Embed Size (px)
Citation preview

Science 21Water from the sea – a local and global issue
Working for our future – todayWorking for our future – today
Make your water mark!
Water from the sea – a local and global issue
Science 21
Introduction
General objectives
Unit plans
Worksheets
■ Investigating the quality of water
■ Desalination - a local and global issue
Griffi th University labratory experiment
■ Griffi th University laboratory experiment
■ Quantitative analysis of phosphorus
■ Quantitative analysis of fl uoride
■ Quantitative analysis of iron
■ Quantitative analysis of heavy metals using the ASS
■ Quantitative analysis of water hardness using titrations
■ Gravimetric analysis of total suspended solids
References
Appendices
■ Fact sheet - Desalination - fresh water from the sea
■ Department of Environment and Resource Management (formerly Natural Resources and Water): Fact sheet - how healthy is your watercourse?
Contents
Make your water mark!
Water from the sea – a local and global issue
Science 21
Water is a valuable resource for all life on earth. According to the Department of Environment and Heritage Protection of Queensland, less than three per cent of the total supply of water on earth is freshwater (www.ehp.qld.gov.au/water/caring_for_our_water/) and only 0.3 per cent is found in rivers and lakes (http://ga.water.usgs.gov/edu/earthwherewater.html). The world’s water supply is unevenly distributed and 13 per cent of the world’s population, over 800 million people, do not have enough water to live (http://unesdoc.unesco.org/images/0014/001444/144409E.pdf ).
Australia is the driest inhabited continent on earth (www.csiro.au/org/psf.html), even though tropical regions of Queensland and the Northern Territory can receive more than 1200 millimetres of rain per year. Overall, the rainfall patterns in Australia are very varied, with many areas of the country experiencing periods of drought, especially areas away from the coasts and ranges. In Australia, drought is the most economically costly of all the climatic phenomena, causing crop failure, stock losses, bush fi res and land degradation. Different human activities further impact on the supplies of fresh water required for agriculture, hygiene and human consumption, at a local and global level. These activities include pollution, climate change, poverty, population growth, urbanisation and natural disasters (http://unesdoc.unesco.org/images/0014/001444/144409E.pdf).
Throughout the world different projects have been discussed and implemented to ensure that there will be a sustainable supply of water for the future.
In this unit students will be given opportunities to understand
the world through inquiry. They will explore the physical and chemical properties of water; understand the importance of water to life on earth and how the availability of water is being affected by pollution, the increasing human population, urbanisation and climate change; and develop ideas and opinions by researching an important local and global issue to overcome a shortage of freshwater, desalination.
■ Work sheet: Investigation of water quality
■ Work sheet: Desalination: A local global issue
Both link with the key concepts and contain knowledge and conceptual understanding, investigative processes and issues and impacts sections, and can be developed into an extended practical investigation or non-experimental investigation if desired.
The two work sheets
Introduction
Make your water mark!
Water from the sea – a local and global issue
Science 21
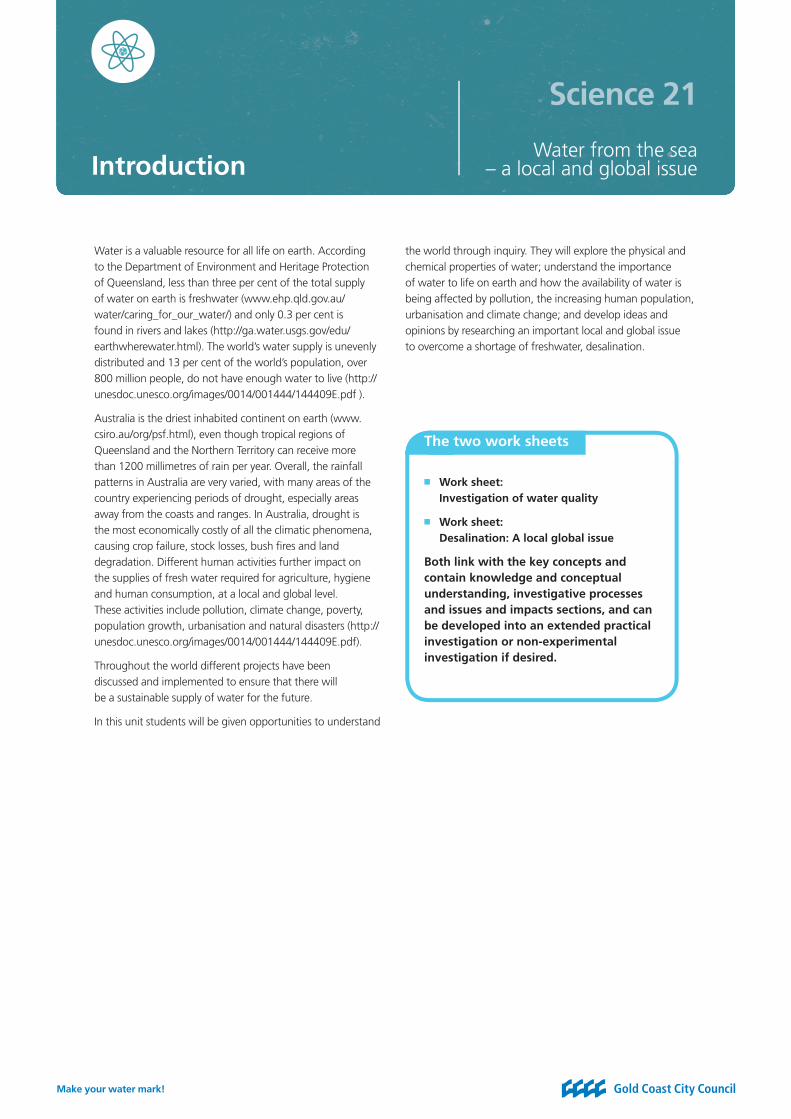
Investigative processes
1 conduct scientifi c investigations-this includes formulating questions, hypothesising, planning, experimenting, evaluating, refi ning and justifying decisions
2 use scientifi c and technological equipment to gather data and information - this includes assessing and managing risk; safely selecting, applying and operating equipment in the labratory and the fi eld
3 use qualitative and quantitative data - this includes processing, analysing, evaluating and interpreting data using appropriate mathematical techniques where necessary
4 communicate information and ideas in a variety of ways using scientifi c convention and terminology - this includes selecting and presenting data and ideas to convey meaning to selected audiences in written, oral and mulitmedia formats.
Attitudes and values
1 retain an openness to new ideas, a thirst for knowledge and an appreciation of the need for lifelong learning
2 value intellectual honesty, integrity, collegiality, cooperation and respect for evidence and ethical conduct
3 develop a level of sensitivity to the implications of science for individuals and society and understand that science is a human endeavour with consequent limitations.
Knowledge and conceptual understanding
1 state, describe and explain scientifi c information including facts, defi nitions, formulas, terminology, concepts, theories, procedures, sequences, diagrams, symbols, fi gures, systems and patterns
2 compare and explain interrelationships between scientifi c concepts, theories, processes and phenomena
3 use scientifi c knowlege and information to generate explanations of real-world phenomena.
Issues and impacts
1 identify and explain issues and evaluate scientifi c impacts
2 draw conclusions and express positions that are scientifi cally and technologically informed
3 analyse the range of factors that infl uence the development of scientifi c knowledge.
Senior science 21 syllabus links
General objectives
KCU
AV
II
IP
Make your water mark!
Science 21 - Information for teachers
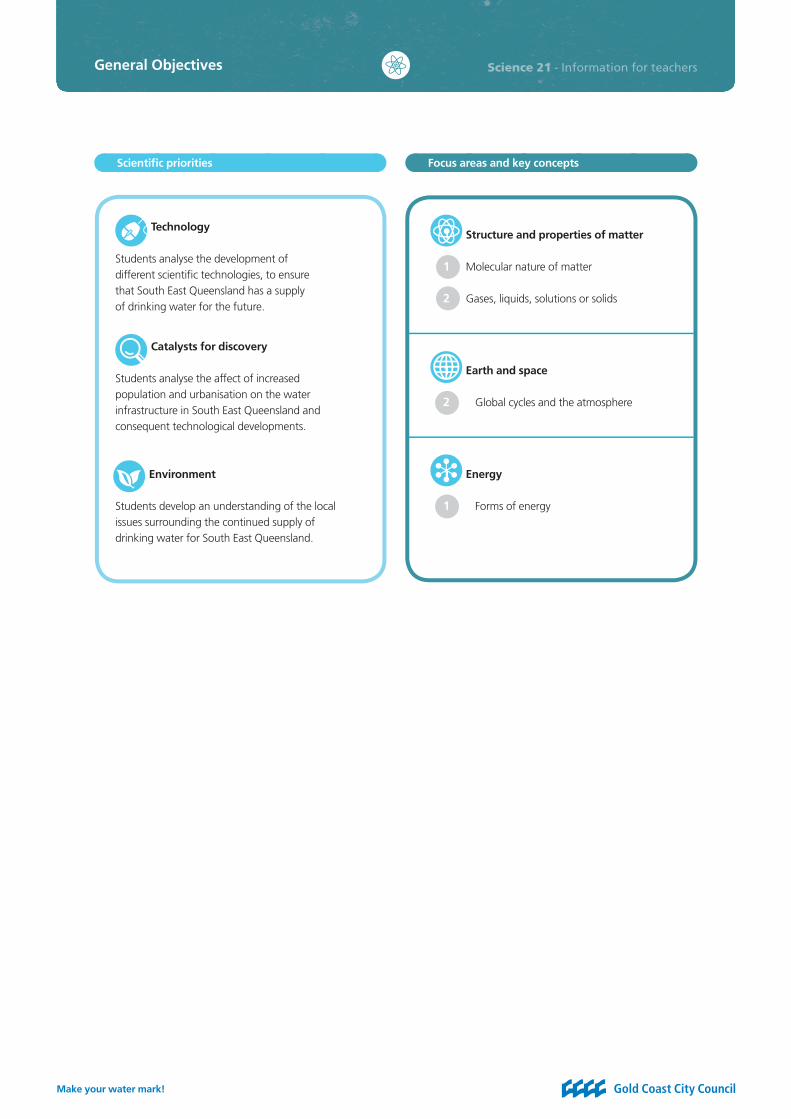
Technology
Students analyse the development of different scientifi c technologies, to ensure that South East Queensland has a supply of drinking water for the future.
Catalysts for discovery
Students analyse the affect of increased population and urbanisation on the water infrastructure in South East Queensland and consequent technological developments.
Environment
Students develop an understanding of the local issues surrounding the continued supply of drinking water for South East Queensland.
1 Structure and properties of matter
1 Molecular nature of matter
2 Gases, liquids, solutions or solids
1 Earth and space
2 2 Global cycles and the atmosphere
1 Energy
1 1 Forms of energy
Scientifi c priorities Focus areas and key concepts
General Objectives
Make your water mark!
Water from the sea – a local and global issue
Science 21
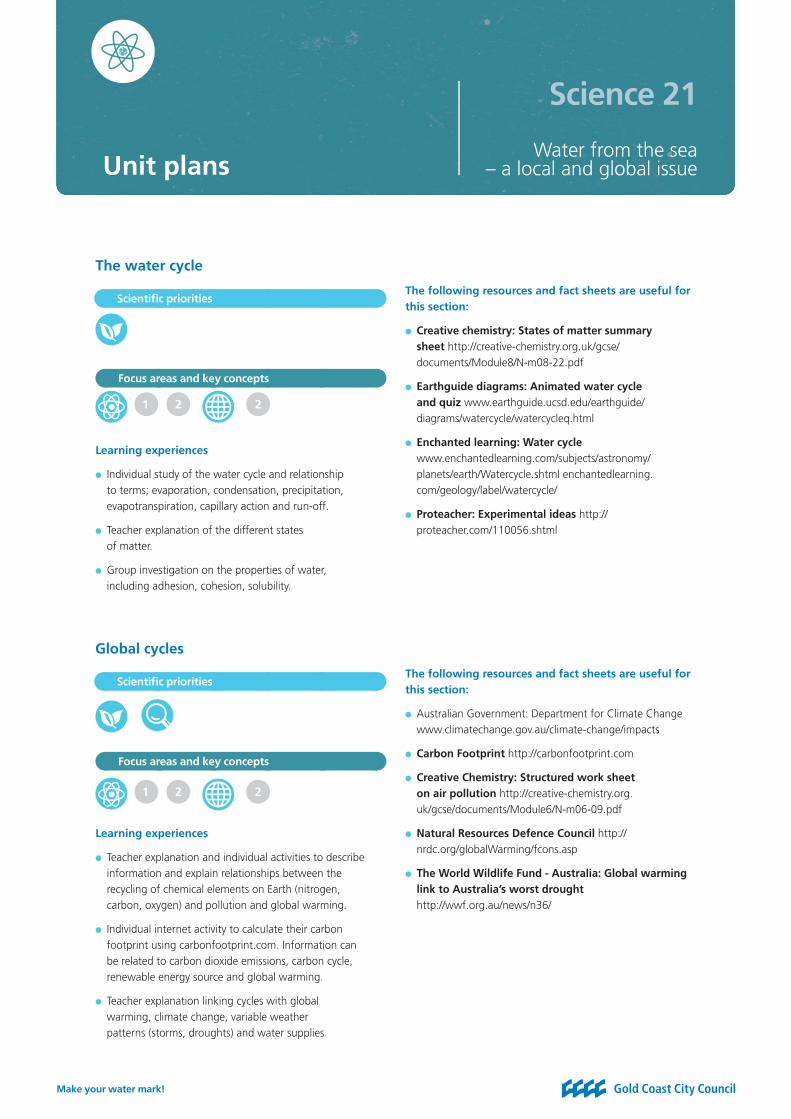
The water cycle
Learning experiences
● Individual study of the water cycle and relationship to terms; evaporation, condensation, precipitation, evapotranspiration, capillary action and run-off.
● Teacher explanation of the different states of matter.
● Group investigation on the properties of water, including adhesion, cohesion, solubility.
Unit plans
Global cycles
Learning experiences
● Teacher explanation and individual activities to describe information and explain relationships between the recycling of chemical elements on Earth (nitrogen, carbon, oxygen) and pollution and global warming.
● Individual internet activity to calculate their carbon footprint using carbonfootprint.com. Information can be related to carbon dioxide emissions, carbon cycle, renewable energy source and global warming.
● Teacher explanation linking cycles with global warming, climate change, variable weather patterns (storms, droughts) and water supplies.
The following resources and fact sheets are useful for this section:
● Creative chemistry: States of matter summary sheet http://creative-chemistry.org.uk/gcse/documents/Module8/N-m08-22.pdf
● Earthguide diagrams: Animated water cycle and quiz www.earthguide.ucsd.edu/earthguide/diagrams/watercycle/watercycleq.html
● Enchanted learning: Water cycle www.enchantedlearning.com/subjects/astronomy/planets/earth/Watercycle.shtml enchantedlearning.com/geology/label/watercycle/
● Proteacher: Experimental ideas http://proteacher.com/110056.shtml
The following resources and fact sheets are useful for this section:
● Australian Government: Department for Climate Change www.climatechange.gov.au/climate-change/impacts
● Carbon Footprint http://carbonfootprint.com
● Creative Chemistry: Structured work sheet on air pollution http://creative-chemistry.org.uk/gcse/documents/Module6/N-m06-09.pdf
● Natural Resources Defence Council http://nrdc.org/globalWarming/fcons.asp
● The World Wildlife Fund - Australia: Global warming link to Australia’s worst drought http://wwf.org.au/news/n36/
Focus areas and key concepts
Focus areas and key concepts
1
1
2
2
2
2
Scientifi c priorities
Scientifi c priorities
Make your water mark!
Science 21 - Information for teachers
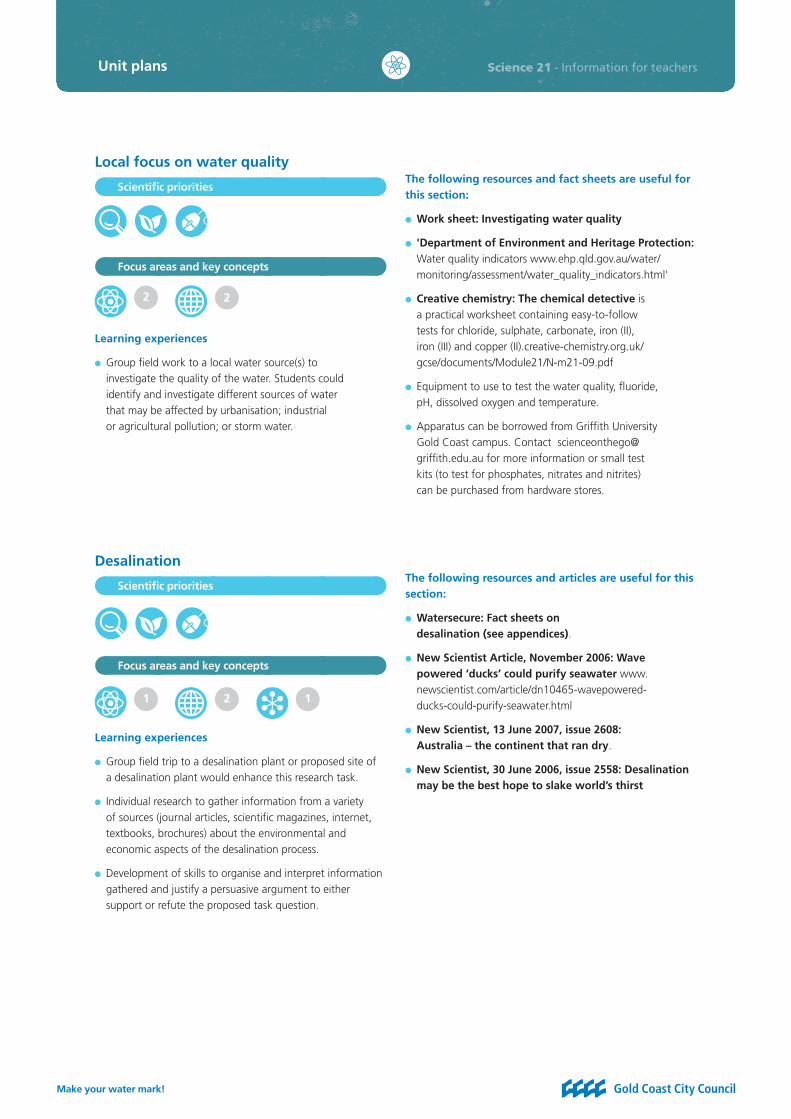
Local focus on water quality
Learning experiences
● Group fi eld work to a local water source(s) to investigate the quality of the water. Students could identify and investigate different sources of water that may be affected by urbanisation; industrial or agricultural pollution; or storm water.
Desalination
Learning experiences
● Group fi eld trip to a desalination plant or proposed site of a desalination plant would enhance this research task.
● Individual research to gather information from a variety of sources (journal articles, scientifi c magazines, internet, textbooks, brochures) about the environmental and economic aspects of the desalination process.
● Development of skills to organise and interpret information gathered and justify a persuasive argument to either support or refute the proposed task question.
The following resources and fact sheets are useful for this section:
● Work sheet: Investigating water quality
● 'Department of Environment and Heritage Protection: Water quality indicators www.ehp.qld.gov.au/water/monitoring/assessment/water_quality_indicators.html'
● Creative chemistry: The chemical detective is a practical worksheet containing easy-to-follow tests for chloride, sulphate, carbonate, iron (II), iron (III) and copper (II).creative-chemistry.org.uk/gcse/documents/Module21/N-m21-09.pdf
● Equipment to use to test the water quality, fl uoride, pH, dissolved oxygen and temperature.
● Apparatus can be borrowed from Griffi th University Gold Coast campus. Contact scienceonthego@griffi th.edu.au for more information or small test kits (to test for phosphates, nitrates and nitrites) can be purchased from hardware stores.
The following resources and articles are useful for this section:
● Watersecure: Fact sheets on desalination (see appendices).
● New Scientist Article, November 2006: Wave powered ‘ducks’ could purify seawater www.newscientist.com/article/dn10465-wavepowered-ducks-could-purify-seawater.html
● New Scientist, 13 June 2007, issue 2608: Australia – the continent that ran dry.
● New Scientist, 30 June 2006, issue 2558: Desalination may be the best hope to slake world’s thirst
Scientifi c priorities
Scientifi c priorities
Focus areas and key concepts
2 2
Focus areas and key concepts
2 11
Unit plans
Make your water mark!
Science 21 - Information for teachers
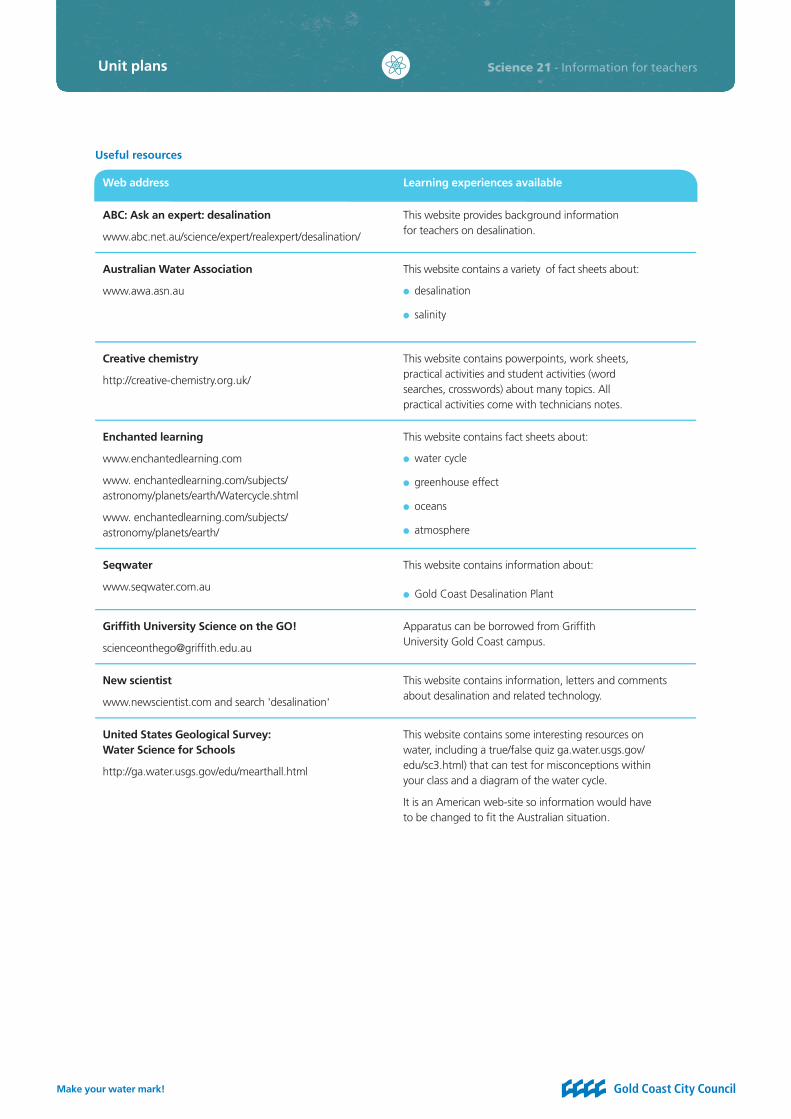
Useful resources
Web address Learning experiences available
ABC: Ask an expert: desalination
www.abc.net.au/science/expert/realexpert/desalination/
This website provides background information for teachers on desalination.
Australian Water Association
www.awa.asn.au
This website contains a variety of fact sheets about:
● desalination
● salinity
Creative chemistry
http://creative-chemistry.org.uk/
This website contains powerpoints, work sheets, practical activities and student activities (word searches, crosswords) about many topics. All practical activities come with technicians notes.
Enchanted learning
www.enchantedlearning.com
www. enchantedlearning.com/subjects/astronomy/planets/earth/Watercycle.shtml
www. enchantedlearning.com/subjects/astronomy/planets/earth/
This website contains fact sheets about:
● water cycle
● greenhouse effect
● oceans
● atmosphere
Seqwater
www.seqwater.com.au
This website contains information about:
● Gold Coast Desalination Plant
Griffi th University Science on the GO!
scienceonthego@griffi th.edu.au
Apparatus can be borrowed from Griffi th University Gold Coast campus.
New scientist
www.newscientist.com and search 'desalination'
This website contains information, letters and comments about desalination and related technology.
United States Geological Survey: Water Science for Schools
http://ga.water.usgs.gov/edu/mearthall.html
This website contains some interesting resources on water, including a true/false quiz ga.water.usgs.gov/edu/sc3.html) that can test for misconceptions within your class and a diagram of the water cycle.
It is an American web-site so information would have to be changed to fi t the Australian situation.
Unit plans
Make your water mark!
Water from the sea – a local and global issue
Science 21
Introduction
Water pollution can be caused by many contaminants including industrial waste (oil, lead, mercury), airborne pollutants and fertiliser runoff (www.water-pollution.org.uk/causes.html). There are two types of water pollution sources - identifi able location like a pipe and one that does not come from one identifi able source, like run-off from agricultural land (www.ehp.qld.gov.au).
Household activities, such as the over-use of commercial toilet cleaners and laundry powder high in phosphates also lower water quality (www.ehp.qld.gov.au).
These contaminants enter the soil, groundwater system, storm water drains and waterways, affecting habitats, ecosystems and fresh water for human use. In Australia these land-based contaminants contribute to 80 per cent of all marine pollution (www.csiro.au/org/PollutionOverview.html).
The Department of Natural Resources and Mines (DNRM) manages the quality of waterways in Queensland. The DNRM uses a range of indicators and sampling methods to assess water quality. These include; pH and dissolved oxygen, but there are many more tests that can be used to assess the health of a water source.
Task
You have to produce a report, incorporating data tables, charts and photographs, on the water quality of a local water source(s) that may have the possibility of being contaminated from industry, agriculture, urbanisation or storm water.
You should:
● identify a local water source(s) and make decisions regarding where to test, how often to test and depth of each sample.
● identify different tests (physical, chemical and biological) that you could use to help determine the quality of water in your water source(s).
● collect quantitative and qualitative data from your water source(s).
● interpret and analyse the data to make judgements on the quality of water in your local water source.
General objectives
1
1
12
2
3
3 4
Focus areas and key concepts
1 2 2
KCU Ii
Ip
Worksheet:Investigating the quality of water
Make your water mark!
Water from the sea – a local and global issue
Science 21
2 2 1
Introduction
There is increasing concern, at a local and global level, over the limited supply of fresh water for irrigation, agriculture, industry and human consumption. Desalination is one of the new and improved technologies developed to ensure a continued supply of fresh water.
Removing salt from sea or brackish water is a process used around the world, especially in very dry countries, small islands and on ships (www.awa.asn.au).
Singapore has a high population and limited fresh water and its fi rst desalination plant, Tuas Seawater Reverse Osmosis Plant, was opened in 2005. It produces 10 per cent of the country’s fresh water supply (www.water-technology.net/projects/tuas/).
The Gold Coast Desalination Plant can produce up to 133 million litres per day of fresh drinking water.
The desalination process involves separation techniques that use distillation methods and membranes for reverse osmosis. According to the Australian Water Association, the process can be expensive because of the energy required to run the plant (www.awa.asn.au) and the World Wildlife Fund states desalination may not be the world’s answer to water problems due to high environmental, economic and social impacts (http://www.wwf.org.au/publications/desalinationreportjune2007/).
Task
You have to gather information and data related about desalination, and use your evidence to produce a logical argument to support or refute the following statement.
"Desalination of seawater is an environmentally and economically sustainable option as a local and global alternate freshwater resource."
Read the different stimulus materials supplied by your teacher for ideas and direction for your research report.
Your report has to:
● incorporate researched information from a variety of resources. Accurately reference any resources used in a bibliography.
● include graphics, tables and pictures to display information and enhance report.
● justify that you have interpreted, analysed and evaluated the information gathered to produce conclusions to support or refute the statement.
General objectives
4
1 2 3 1 2 3
Focus areas and key concepts
KCU Ii
Ip
Worksheet:Desalination: a local and global issue
Make your water mark!
Science 21 - Information for teachers
Checklist
Phase and date Component of task Teacher’s comments and initials
Phase 1
Date:
Defi ning the research question
● identifying a variety of environmental issues related to desalination
● identifying a variety of economic issues related to desalination.
Phase 2
Date:
Collecting data
● research information about task from articles with a local and global perspective
● evidence of bibliography being developed.
Phase 3
Date:
Development of report
● interpreting and analysing information
● development of ideas and design for an article for a scientifi c magazine.
Phase 4
Date:
Submission of fi nal report
● bibliography included.
Worksheet:Desalination: a local and global issue

Make your water mark!
Water from the sea – a local and global issue
Science 21
Equipment (per group) Chemicals
5 volumetric fl asks for standards Distilled water
1 volumetric fl ask for each water sample Stock phosphorous solution (50ppm)
Glass pipettes: 1mL, 5mL, 10mL, 20mL Molybdate reagent *
Bulbs for pipettes Tin (11) chloride reagent
Droppers
Cuvettes
Spectrophotometer
Equipment (per group) Chemicals
6 100mL glass beakers Distilled water
1 100mL glass beaker for each water sample TISAB buffer*
Glass pipettes: 1mL, 5mL, 10mL, 20mL Fluoride standards (1.0, 5.0, 10.0, 50.0, 100.0 ppm)
Bulbs for pipettes
Fluoride ion selective electrode
Worksheets for the quantitative analysis of:
● phosphorous
● fl uoride
● iron
● heavy metals
● total water hardness
● total suspended solids.
Resources for experiments
1. Quantitative analysis of phosphorous
2. Quantitative analysis of fl uoride
* Approximately 30mL per group
* Approximately 100mL per group
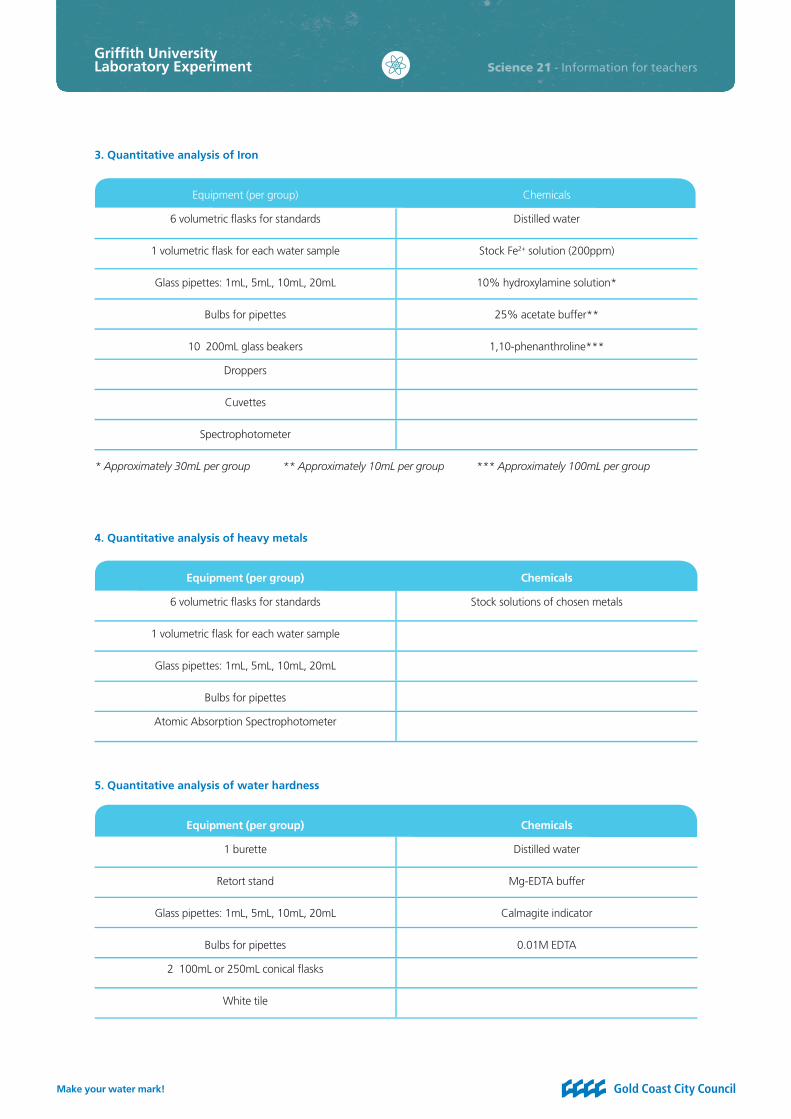
Griffi th University Laboratory Experiment
Make your water mark!
Science 21 - Information for teachers
Equipment (per group) Chemicals
6 volumetric fl asks for standards Distilled water
1 volumetric fl ask for each water sample Stock Fe2+ solution (200ppm)
Glass pipettes: 1mL, 5mL, 10mL, 20mL 10% hydroxylamine solution*
Bulbs for pipettes 25% acetate buffer**
10 200mL glass beakers 1,10-phenanthroline***
Droppers
Cuvettes
Spectrophotometer
Equipment (per group) Chemicals
6 volumetric fl asks for standards Stock solutions of chosen metals
1 volumetric fl ask for each water sample
Glass pipettes: 1mL, 5mL, 10mL, 20mL
Bulbs for pipettes
Atomic Absorption Spectrophotometer
Equipment (per group) Chemicals
1 burette Distilled water
Retort stand Mg-EDTA buffer
Glass pipettes: 1mL, 5mL, 10mL, 20mL Calmagite indicator
Bulbs for pipettes 0.01M EDTA
2 100mL or 250mL conical fl asks
White tile
3. Quantitative analysis of Iron
4. Quantitative analysis of heavy metals
5. Quantitative analysis of water hardness
* Approximately 30mL per group ** Approximately 10mL per group *** Approximately 100mL per group
Griffi th University Laboratory Experiment

Make your water mark!
Science 21 - Information for teachers
Equipment (per group) Chemicals
Vacuum fi ltration equipment Distilled water
Glass fi lter papers
1 100mL or 200mL measuring cylinder
Oven at 103ºC
Teacher notesLaboratory techniques
Water samples
● These experiments can be used on a variety of water supplies from drinking water to natural water systems. For some water samples (recycled water) students should wear disposable gloves.
● Water samples from a natural water system (rivers and creeks), will have to be diluted at approximately a 1: 25 ratio in the quantitative analysis of water hardness experiment. Estuarine water samples may have to be diluted to approximately 1: 50 ratio. Sea water is not suitable for this experiment.
Collecting data
When measuring the absorbance of the standards using a spectrophotometer (phosphorous and iron experiments), always start with the lowest concentration (0.0mg/L) and work through standards to the highest concentration.
For example: Quantitative analysis of phosphorous
Step 1 Rinse cuvette with the 0.0 mg/L standard.
Step 2 Re-fi ll cuvette with the 0.0 mg/L standard and use the spectrophotometer to measure the absorbance at 690nm. Discard solution.
Step 3 Rinse cuvette with the 0.5 mg/L standard.
Step 4 Re-fi ll cuvette with the 0.5 mg/L standard and use the spectrophotometer to measure the absorbance at 690nm. Discard solution.
Repeat these steps until all standards are measured.
When measuring the absorbance of the water samples, follow the same steps as listed above, but rinse the cuvette with distilled water before rinsing with the next standard.
6. Gravimetric analysis of total suspended solids
Griffi th University Laboratory Experiment
Make your water mark!
Water from the sea – a local and global issue
Science 21
Introduction
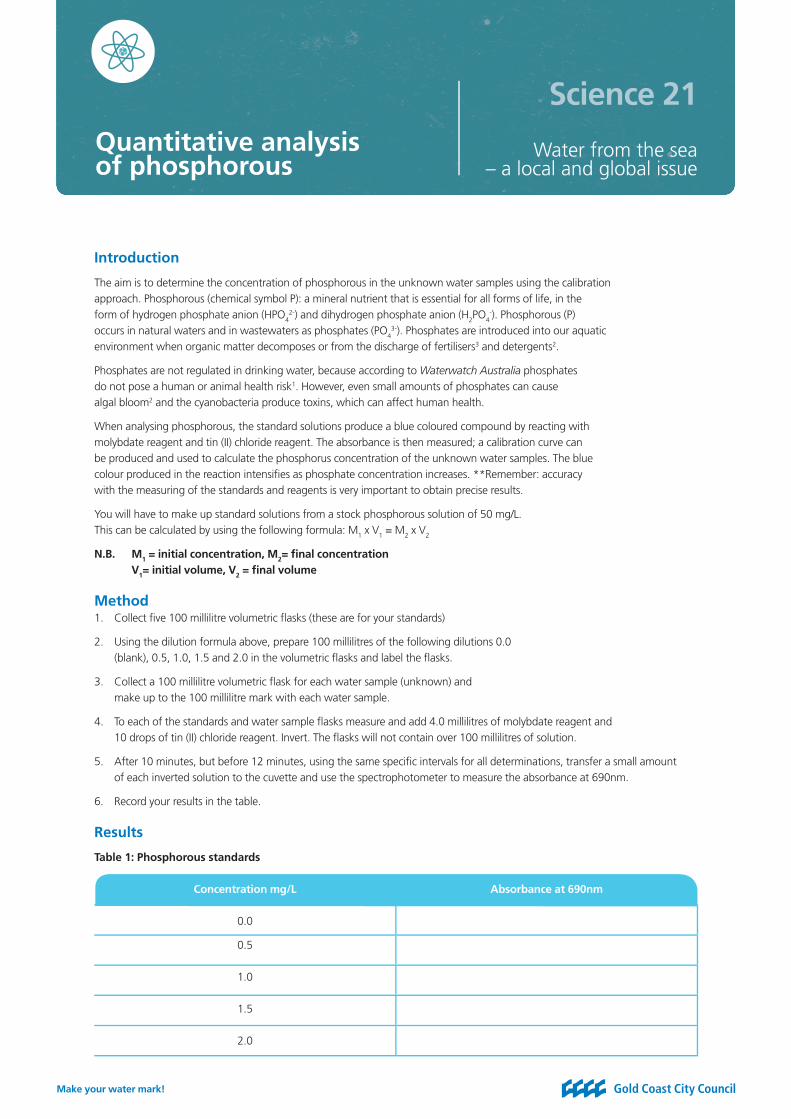
The aim is to determine the concentration of phosphorous in the unknown water samples using the calibration approach. Phosphorous (chemical symbol P): a mineral nutrient that is essential for all forms of life, in the form of hydrogen phosphate anion (HPO4
2-) and dihydrogen phosphate anion (H2PO4-). Phosphorous (P)
occurs in natural waters and in wastewaters as phosphates (PO43-). Phosphates are introduced into our aquatic
environment when organic matter decomposes or from the discharge of fertilisers3 and detergents2.
Phosphates are not regulated in drinking water, because according to Waterwatch Australia phosphates do not pose a human or animal health risk1. However, even small amounts of phosphates can cause algal bloom2 and the cyanobacteria produce toxins, which can affect human health.
When analysing phosphorous, the standard solutions produce a blue coloured compound by reacting with molybdate reagent and tin (II) chloride reagent. The absorbance is then measured; a calibration curve can be produced and used to calculate the phosphorus concentration of the unknown water samples. The blue colour produced in the reaction intensifi es as phosphate concentration increases. **Remember: accuracy with the measuring of the standards and reagents is very important to obtain precise results.
You will have to make up standard solutions from a stock phosphorous solution of 50 mg/L. This can be calculated by using the following formula: M1 x V1 = M2 x V2
N.B. M1 = initial concentration, M2= fi nal concentration V1= initial volume, V2 = fi nal volume
Method1. Collect fi ve 100 millilitre volumetric fl asks (these are for your standards)
2. Using the dilution formula above, prepare 100 millilitres of the following dilutions 0.0 (blank), 0.5, 1.0, 1.5 and 2.0 in the volumetric fl asks and label the fl asks.
3. Collect a 100 millilitre volumetric fl ask for each water sample (unknown) and make up to the 100 millilitre mark with each water sample.
4. To each of the standards and water sample fl asks measure and add 4.0 millilitres of molybdate reagent and 10 drops of tin (II) chloride reagent. Invert. The fl asks will not contain over 100 millilitres of solution.
5. After 10 minutes, but before 12 minutes, using the same specifi c intervals for all determinations, transfer a small amount of each inverted solution to the cuvette and use the spectrophotometer to measure the absorbance at 690nm.
6. Record your results in the table.
Results
Table 1: Phosphorous standards
Concentration mg/L Absorbance at 690nm
0.0
0.5
1.0
1.5
2.0
Quantitative analysis of phosphorous
Make your water mark!
Science 21 - Information for teachers
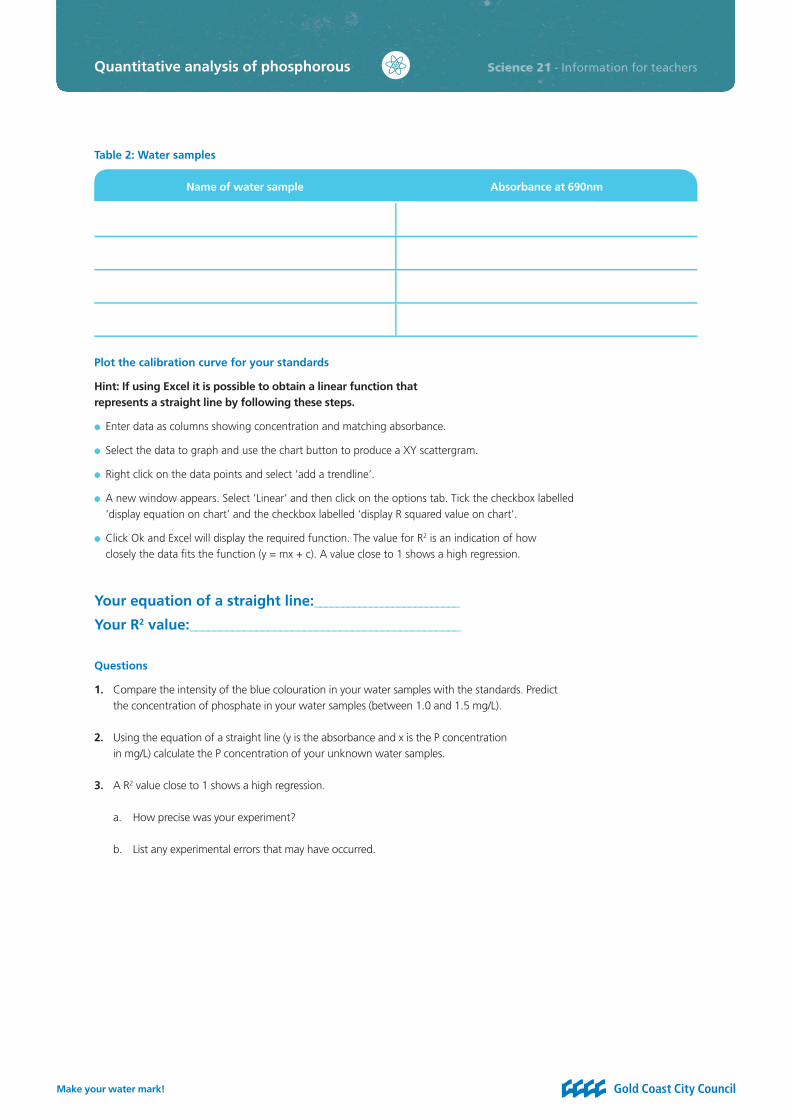
Table 2: Water samples
Name of water sample Absorbance at 690nm
Plot the calibration curve for your standards
Hint: If using Excel it is possible to obtain a linear function that represents a straight line by following these steps.
● Enter data as columns showing concentration and matching absorbance.
● Select the data to graph and use the chart button to produce a XY scattergram.
● Right click on the data points and select ‘add a trendline’.
● A new window appears. Select ‘Linear’ and then click on the options tab. Tick the checkbox labelled ‘display equation on chart’ and the checkbox labelled ‘display R squared value on chart’.
● Click Ok and Excel will display the required function. The value for R2 is an indication of how closely the data fi ts the function (y = mx + c). A value close to 1 shows a high regression.
Your equation of a straight line:__________________________
Your R2 value:_____________________________________________
Questions
1. Compare the intensity of the blue colouration in your water samples with the standards. Predict the concentration of phosphate in your water samples (between 1.0 and 1.5 mg/L).
2. Using the equation of a straight line (y is the absorbance and x is the P concentration in mg/L) calculate the P concentration of your unknown water samples.
3. A R2 value close to 1 shows a high regression.
a. How precise was your experiment?
b. List any experimental errors that may have occurred.
Quantitative analysis of phosphorous
Make your water mark!
Water from the sea – a local and global issue
Science 21
Introduction
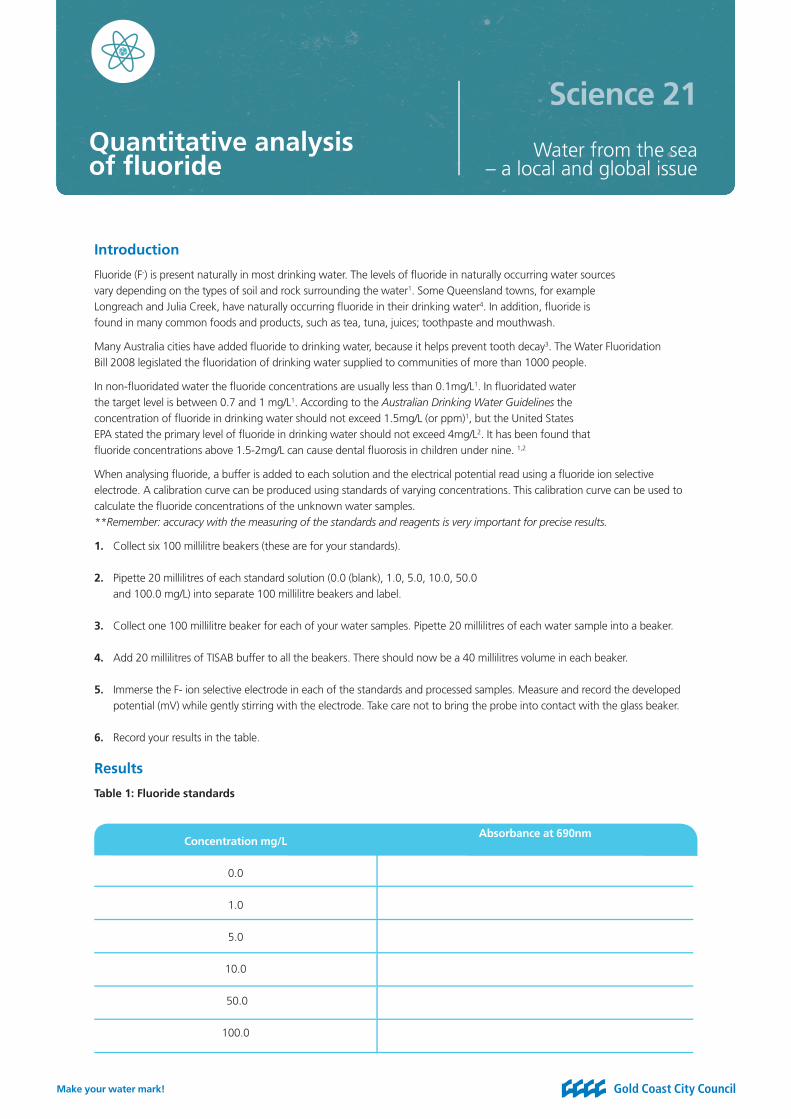
Fluoride (F-) is present naturally in most drinking water. The levels of fl uoride in naturally occurring water sources vary depending on the types of soil and rock surrounding the water1. Some Queensland towns, for example Longreach and Julia Creek, have naturally occurring fl uoride in their drinking water4. In addition, fl uoride is found in many common foods and products, such as tea, tuna, juices; toothpaste and mouthwash.
Many Australia cities have added fl uoride to drinking water, because it helps prevent tooth decay3. The Water Fluoridation Bill 2008 legislated the fl uoridation of drinking water supplied to communities of more than 1000 people.
In non-fl uoridated water the fl uoride concentrations are usually less than 0.1mg/L1. In fl uoridated water the target level is between 0.7 and 1 mg/L1. According to the Australian Drinking Water Guidelines the concentration of fl uoride in drinking water should not exceed 1.5mg/L (or ppm)1, but the United States EPA stated the primary level of fl uoride in drinking water should not exceed 4mg/L2. It has been found that fl uoride concentrations above 1.5-2mg/L can cause dental fl uorosis in children under nine. 1,2
When analysing fl uoride, a buffer is added to each solution and the electrical potential read using a fl uoride ion selective electrode. A calibration curve can be produced using standards of varying concentrations. This calibration curve can be used to calculate the fl uoride concentrations of the unknown water samples. **Remember: accuracy with the measuring of the standards and reagents is very important for precise results.
1. Collect six 100 millilitre beakers (these are for your standards).
2. Pipette 20 millilitres of each standard solution (0.0 (blank), 1.0, 5.0, 10.0, 50.0 and 100.0 mg/L) into separate 100 millilitre beakers and label.
3. Collect one 100 millilitre beaker for each of your water samples. Pipette 20 millilitres of each water sample into a beaker.
4. Add 20 millilitres of TISAB buffer to all the beakers. There should now be a 40 millilitres volume in each beaker.
5. Immerse the F- ion selective electrode in each of the standards and processed samples. Measure and record the developed potential (mV) while gently stirring with the electrode. Take care not to bring the probe into contact with the glass beaker.
6. Record your results in the table.
Results
Table 1: Fluoride standards
Concentration mg/LAbsorbance at 690nm
0.0
1.0
5.0
10.0
50.0
100.0
Quantitative analysis of fl uoride

Make your water mark!
Science 21 - Information for teachers
Table 1: Fluoride standards
Name of water sample Potential mV
Plot the calibration curve for your standards
Hint: If using Excel it is possible to obtain a linear function which represents a straight line following these steps.
● Enter data as columns showing concentration and matching mV measurements.
● Calculate the – log of your F- concentrations.
● Produce a third column which shows the -log of your F- concentrations.
● Produce two graphs; one of F- concentration v mV and one of – log F- concentration v mV.
● Use the chart button to produce a XY scattergram (the F- concentration or -log F- concentration should be on the x axis and the mV on the y axis).
● Right click on of the data points and select ‘add a trendline’.
● A new window appears. Select ‘Linear’ and then click on the options tab. Tick the checkbox labelled ‘display equation on chart’ and the checkbox labelled ‘display R squared value on chart’.
● Click Ok and Excel will display the required function. The value for R2 is an indication of how closely the data fi ts the function (y = mx + c). A value close to 1 shows a high regression.
Your equation of a straight line:__________________________
Your R2 value:_____________________________________________
Questions
1. Compare the electrical potential (mV) in your water samples with the standards. Predict the concentration of fl uoride in your water samples (i.e. Between 1.0 and 5.0 mg/L).
2. Using the equation of a straight line (y is the mV and x is the – log F- concentration in mg/L) you have to calculate the F- concentrations in mg/L of your unknown samples.
a. Firstly, use your equation to calculate the – log F- concentration of your unknown water samples.
b. Secondly, calculate the F- concentrations of the unknown samples in mg/L by calculating the inverse log of your answers to part a.
3. A R2 value close to 1 shows a high regression.
a. How accurate was your experiment?
b. List any experimental errors that may have occurred.
Quantitative analysis of fl uoride

Make your water mark!
Water from the sea – a local and global issue
Science 21
Introduction
The aim is to determine the concentration of Fe2+ in the unknown water samples using the calibration approach. Iron is found naturally in different soils and rocks as oxide, sulphide and carbonate compounds1. Iron leeches into water supplies from different domestic and industrial sources, for example rusting iron pipes. In water iron is found as Fe2+ (ferrous) or Fe3+ (ferric) ions.
According to the Australian Drinking Water Guidelines the concentration of iron in drinking water should not exceed 0.3mg/L (or ppm)1. The World Health Organisation states that at this level (0.3mg/L) there is no distinct taste to the water or staining of laundry2. In uncontaminated water iron levels are approximately 0.1mg/L1, in rivers 0.7mg/L2 but this can increase to 50mg/L near industrial sites or in extreme cases, 100mg/L in oxygen-depleted water1.
When analysing Fe2+, the standard solutions produce a red coloured compound by reacting with 10 per cent hydroxylamine solution, 25 per cent acetate buffer and 1,10-phenanthroline reagent. The red colour produced in the reaction intensifi es as the Fe2+ concentration increases. The absorbance is measured; a calibration curve can be produced and used to calculate the Fe2+ concentration in the water samples. **Remember: accuracy with the measuring of the standards and reagents is very important to obtain precise results.
You will have to make up standard solutions from a stock Fe2+ solution of 200 mg/L. This can be calculated by using the following formula: M1 x V1 = M2 x V2
N.B. M1 = initial concentration, M2= fi nal concentration V1= initial volume, V2 = fi nal volume
Method1. Collect six 100 millilitre volumetric fl asks (these are for your standards).
2. Using the dilution formula above, prepare 100 millilitres of the following dilutions; 0 (a blank), 0.5, 1.0, 1.5, 2.0 and 3.0 mg/L.
3. Label your fl asks with the correct dilutions.
4. Collect a 100 millilitre volumetric fl ask for each water sample and add 100 millilitres of your unknown water samples to each.
5. Transfer each standard and water sample to a clean 200 millilitre beaker.
6. To each standard and water sample add 3 millilitres of 10 per cent hydroxylamine solution, 1 millilitre 25 per cent acetate buffer and 10 millilitres of 1,10-phenanthroline (o-phenanthroline). Invert. Each beaker should have a volume of 114 millilitres.
7. Using the spectrophotometer, transfer a small amount of solution to the cuvette and measure the absorbance of each solution at 508nm.
8. Record all your results in the table on the next page.
Results
Concentration mg/L Absorbance at 508nm
0.0
0.5
1.0
1.5
2.0
Quantitative analysis of iron

Make your water mark!
Science 21 - Information for teachers
Table 2: Unknown water samples
Name of water sample Absorbance at 508nm
Plot the calibration curve for your standards
Hint: If using Excel it is possible to obtain a linear function which represents a straight line following these steps.
● Enter data as columns showing concentration and matching absorbance.
● Select the data to graph and use the chart button to produce a XY scattergram.
● Right click one of the data points and select ‘add a trendline’.
● A new window appears. Select ‘Linear’ and then click on the options tab. Tick the checkbox labelled ‘display equation on chart’ and the checkbox labelled ‘display R squared value on chart’.
● Click Ok and Excel will display the required function. The value for R2 is an indication of how closely the data fi ts the function (y = mx + c). A value close to 1 shows a high regression.
Your equation of a straight line:__________________________
Your R2 value:_____________________________________________
Questions
1. Compare the intensity of the red colouration in your water samples with the standards. Predict the concentration of Fe2+ in your water samples (i.e. between 1.0 and 1.5 mg/L).
a. Using your equation of a straight line (y is the absorbance and x is the Fe2+ concentration in mg/L) calculate the Fe2+ concentration of your unknown water samples.
2. A R2 value close to 1 shows a high regression.
a. How precise was your experiment?
b. List any experimental errors that may have occurred.
Quantitative analysis of iron
Make your water mark!
Water from the sea – a local and global issue
Science 21
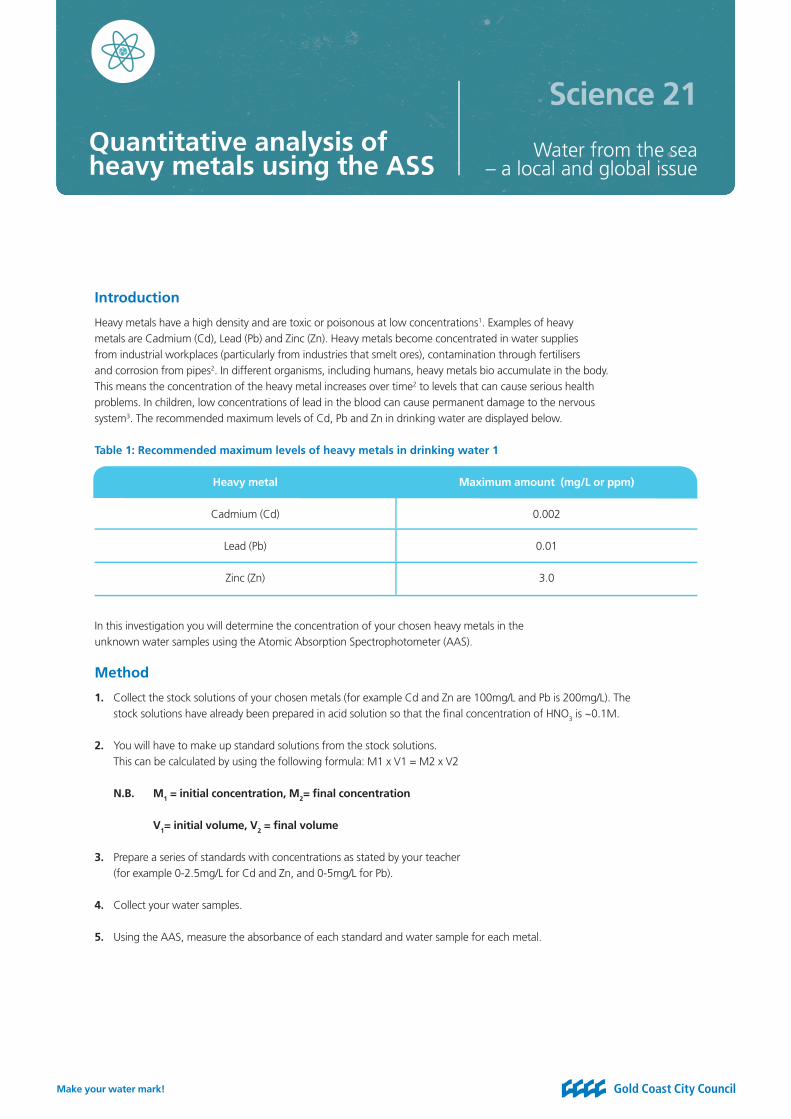
Introduction
Heavy metals have a high density and are toxic or poisonous at low concentrations1. Examples of heavy metals are Cadmium (Cd), Lead (Pb) and Zinc (Zn). Heavy metals become concentrated in water supplies from industrial workplaces (particularly from industries that smelt ores), contamination through fertilisers and corrosion from pipes2. In different organisms, including humans, heavy metals bio accumulate in the body. This means the concentration of the heavy metal increases over time2 to levels that can cause serious health problems. In children, low concentrations of lead in the blood can cause permanent damage to the nervous system3. The recommended maximum levels of Cd, Pb and Zn in drinking water are displayed below.
Table 1: Recommended maximum levels of heavy metals in drinking water 1
Heavy metal Maximum amount (mg/L or ppm)
Cadmium (Cd) 0.002
Lead (Pb) 0.01
Zinc (Zn) 3.0
In this investigation you will determine the concentration of your chosen heavy metals in the unknown water samples using the Atomic Absorption Spectrophotometer (AAS).
Method
1. Collect the stock solutions of your chosen metals (for example Cd and Zn are 100mg/L and Pb is 200mg/L). The stock solutions have already been prepared in acid solution so that the fi nal concentration of HNO3 is ~0.1M.
2. You will have to make up standard solutions from the stock solutions. This can be calculated by using the following formula: M1 x V1 = M2 x V2
N.B. M1 = initial concentration, M2= fi nal concentration
V1= initial volume, V2 = fi nal volume
3. Prepare a series of standards with concentrations as stated by your teacher (for example 0-2.5mg/L for Cd and Zn, and 0-5mg/L for Pb).
4. Collect your water samples.
5. Using the AAS, measure the absorbance of each standard and water sample for each metal.
Quantitative analysis of heavy metals using the ASS

Make your water mark!
Science 21 - Information for teachers
Results
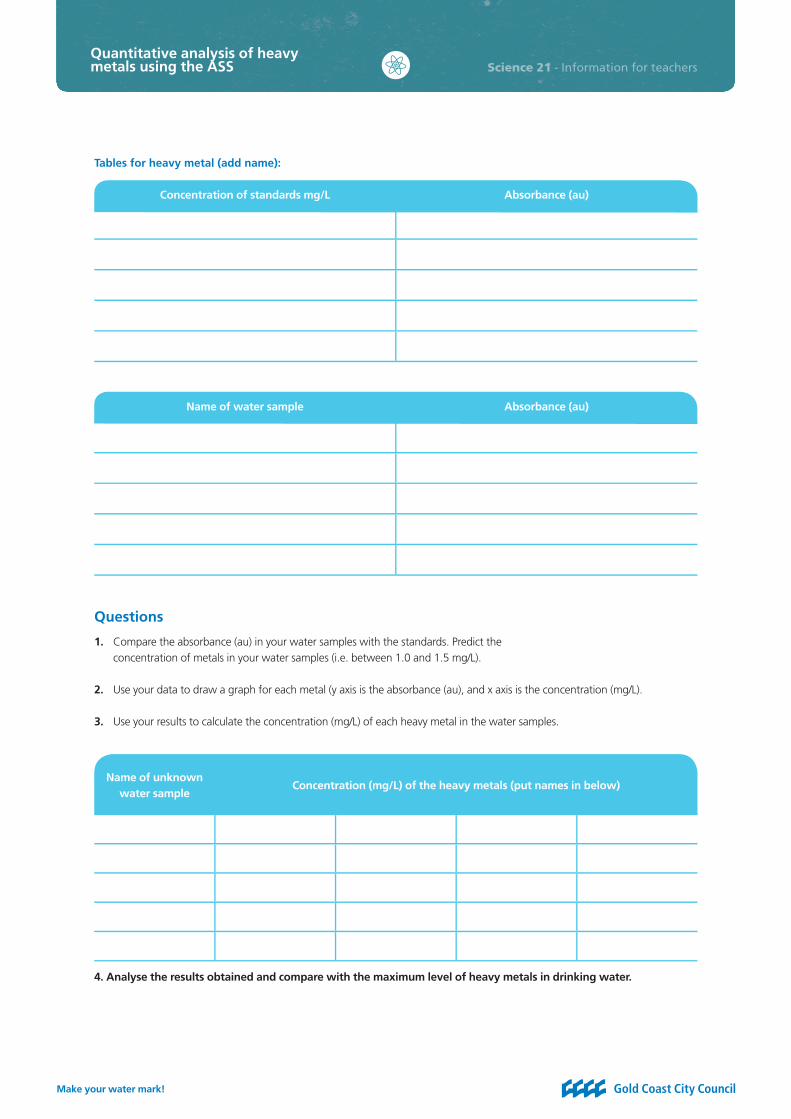
Tables for heavy metal (add name):
Concentration of standards mg/L Absorbance (au)
Name of water sample Absorbance (au)
Tables for heavy metal (add name):
Concentration of standards mg/L Absorbance (au)
Name of water sample Absorbance (au)
Quantitative analysis of heavy metals using the ASS
Make your water mark!
Science 21 - Information for teachers
Tables for heavy metal (add name):
Concentration of standards mg/L Absorbance (au)
Name of water sample Absorbance (au)
Questions
1. Compare the absorbance (au) in your water samples with the standards. Predict the concentration of metals in your water samples (i.e. between 1.0 and 1.5 mg/L).
2. Use your data to draw a graph for each metal (y axis is the absorbance (au), and x axis is the concentration (mg/L).
3. Use your results to calculate the concentration (mg/L) of each heavy metal in the water samples.
Name of unknown water sample
Concentration (mg/L) of the heavy metals (put names in below)
4. Analyse the results obtained and compare with the maximum level of heavy metals in drinking water.
Quantitative analysis of heavy metals using the ASS

Make your water mark!
Water from the sea – a local and global issue
Science 21
Introduction
Water hardness is an indication of the amount of calcium and magnesium salts (usually carbonates2,4 or sulphates and chlorides1) in water. These salts reduce the ability of soaps and detergents to lather4, and can cause scaling problems, due to deposits of these salts2, inside kettles, hot water systems and pipes2. In Australia the hardness of the drinking water in cities ranges from 5-380 mg/L2.
The degree of hardness in water, modifi ed from the Water Quality Association3
Term mg/L or ppm
Soft Less that 17.1
Slightly hard 17.1 - 60
Moderately hard 60 – 120
Hard 120 - 180
Very hard 180 +
The concentration of total hardness in water can be determined using volumetric analysis (titration). The method involves the titration of the water with a standard 0.01M EDTA solution in the presence of calmagite indicator at pH 10. A water sample containing Ca2+ and/or Mg2+ ions will produce a red colour in the presence of calmagite. As the water sample is titrated with the standard EDTA solution, the EDTA will out-compete the calmagite to form metal-EDTA complexes. When all the metals have been complexed by EDTA, the solution turns from red to blue (the result of free calmagite). Your task is to calculate the number of moles of Ca2+ and/or Mg2+ ions in the water sample.
Method
1. Place 25 millilitres of your water sample into a conical fl ask and make up to 50 millilitres with distilled water.
2. Add one to two millilitres of Mg-EDTA buffer and one to two drops of calmagite indicator. The solution should become a pink/red colour.
3. Add EDTA standard to the burette and record the volume.
4. Titrate your diluted water sample with the standard EDTA solution, Titrate until the solution turns a light blue colour (the solution will turn a purple colour before blue, this is the intermediate colour). Stir continuously. (N.B.: If your water sample goes blue straight away, then assume your water sample does not contain any Ca2+ or Mg2+ ions).
5. If you don’t obtain a blue colour after you have added 20 to 25 millilitres of EDTA, then your water sample is too concentrated. Natural water systems may need to be diluted further in step one. Repeat experiment using two millilitres of your water sample and make up to 50 millilitres with distilled water.
Quantitative analysis of water hardness using titrations
Make your water mark!
Science 21 - Information for teachers
Results
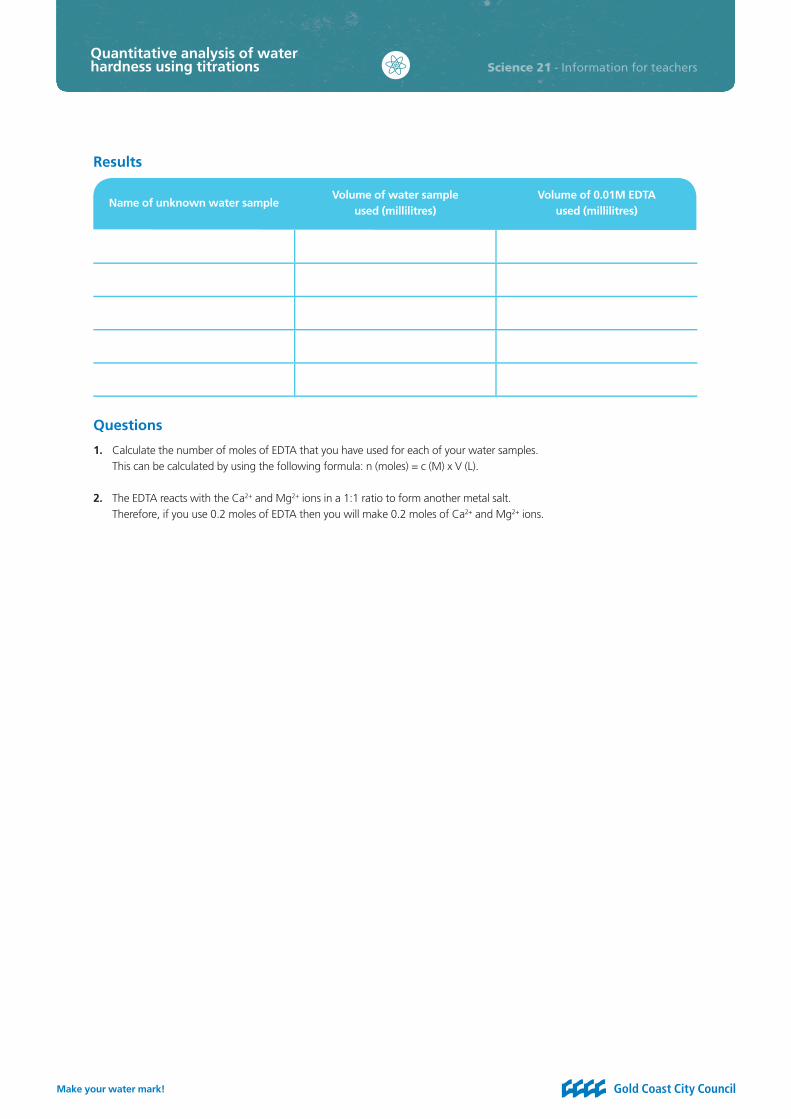
Name of unknown water sampleVolume of water sample
used (millilitres)Volume of 0.01M EDTA
used (millilitres)
Questions
1. Calculate the number of moles of EDTA that you have used for each of your water samples. This can be calculated by using the following formula: n (moles) = c (M) x V (L).
2. The EDTA reacts with the Ca2+ and Mg2+ ions in a 1:1 ratio to form another metal salt. Therefore, if you use 0.2 moles of EDTA then you will make 0.2 moles of Ca2+ and Mg2+ ions.
Quantitative analysis of water hardness using titrations
Make your water mark!
Water from the sea – a local and global issue
Science 21
Introduction
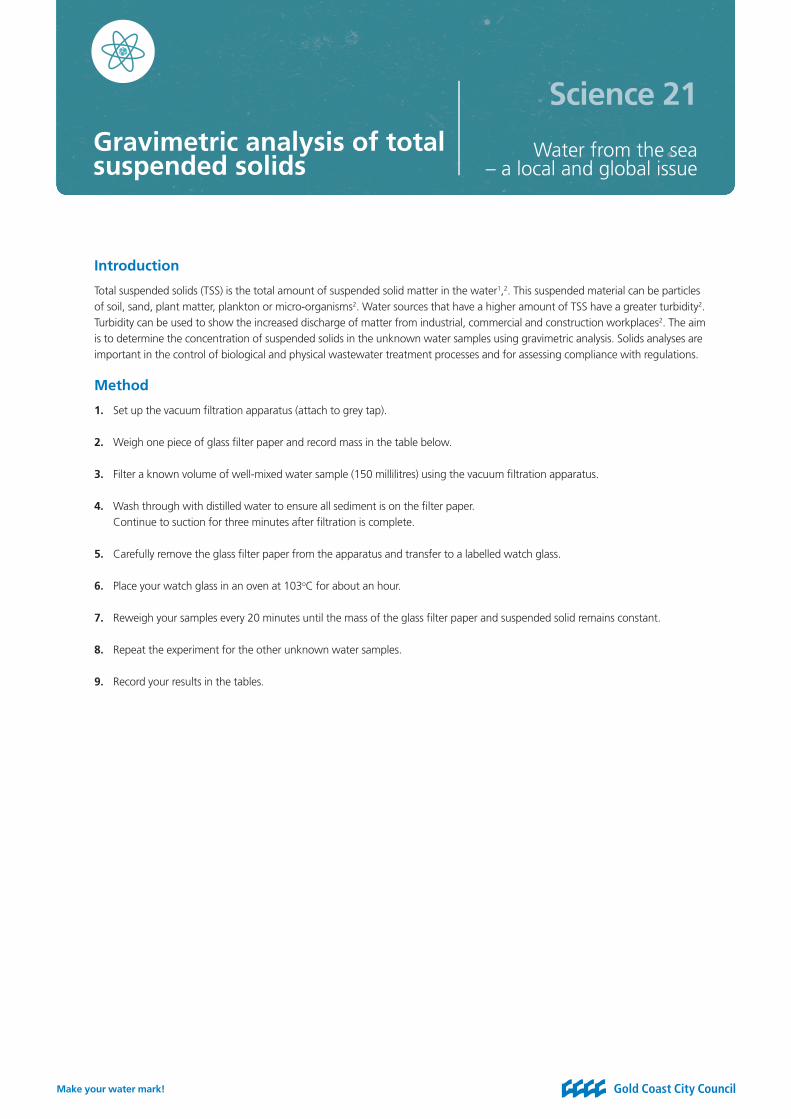
Total suspended solids (TSS) is the total amount of suspended solid matter in the water1,2. This suspended material can be particles of soil, sand, plant matter, plankton or micro-organisms2. Water sources that have a higher amount of TSS have a greater turbidity2. Turbidity can be used to show the increased discharge of matter from industrial, commercial and construction workplaces2. The aim is to determine the concentration of suspended solids in the unknown water samples using gravimetric analysis. Solids analyses are important in the control of biological and physical wastewater treatment processes and for assessing compliance with regulations.
Method
1. Set up the vacuum fi ltration apparatus (attach to grey tap).
2. Weigh one piece of glass fi lter paper and record mass in the table below.
3. Filter a known volume of well-mixed water sample (150 millilitres) using the vacuum fi ltration apparatus.
4. Wash through with distilled water to ensure all sediment is on the fi lter paper. Continue to suction for three minutes after fi ltration is complete.
5. Carefully remove the glass fi lter paper from the apparatus and transfer to a labelled watch glass.
6. Place your watch glass in an oven at 103oC for about an hour.
7. Reweigh your samples every 20 minutes until the mass of the glass fi lter paper and suspended solid remains constant.
8. Repeat the experiment for the other unknown water samples.
9. Record your results in the tables.
Gravimetric analysis of total suspended solids

Make your water mark!
Science 21 - Information for teachers
Results tables
Table 1: Mass of fi lter paper and suspended solid during drying process
Water sampleMass (g) of glass fi lter paper and suspended solid during drying process
0 mins 20 mins 40 mins 60 mins 80 mins
Table 2: All data
Water sampleVolume
of fi ltered sample (L)
Mass of glass fi lter paper before (mg)
Mass of glass fi lter paper
and suspended solid after (mg)
Mass of suspended solid (mg)
Total suspended solids in water sample (mg/L)
Gravimetric analysis of total suspended solids

Make your water mark!
Water from the sea – a local and global issue
Science 21
1. American Public Health Association (1995), Standard Methods for the Examination of Water and Wastewater, 19th Edition.
2. Australian Government, Environment Australia (2002). Waterwatch Australia National Technical Manual, Module 4- Physical and Chemical Parameters, Retrieved July 9, 2007, from www.waterwatch.org.au/publications/module4/phosphorus.html
3. Nova Science in the News (1997). Toxic Algal Blooms- a sign of rivers under stress. Published by Australian Academy of Science. Retrieved July 27, 2007, from www.science.org.au/nova/017/017key.htm
4. Wilbraham, A.C, Staley, D.D, Matta, M.S and Waterman E.L (2005). Chemistry, Pearson Prentice Hall.
5. Australian Government and National Health and Medical Research Council, National Water Quality Management Strategy (2004). Australian Drinking Water Guidelines. Retrieved July 9, 2007, from www.nhmrc.gov.au/publications/synopses/_fi les/adwg_11_06.pdf
6. World Health Organisation (2003). Iron in Drinking Water. Background Document for the Development of WHO Guidelines for Drinking-Water Quality. Retrieved July 9, 2007, from www.who.int/water_sanitation_health/dwq/chemicals/iron.pdf
7. Australian Government and National Health and Medical Research Council, National Water Quality Management Strategy (2004).Water Made Clear, A Consumer Guide to Accompany the Australian Drinking Water Guidelines. Retrieved July 9, 2007, from www.nhmrc.gov.au/publications/synopses/_fi les/eh33.pdf
8. Wilbraham, A.C, Staley, D.D, Matta, M.S and Waterman E.L (2005). Chemistry, Pearson Prentice Hall.
9. CSIRO, Australia (2003), Simple Estuarine Response Model II, Indicators, Retrieved July 20, 2007 from www.per.marine.csiro.au/serm2/indicators/tss.htm
10. Shugar, G.J and Ballinger, J.T. (1996). Chemical Technicians’ Ready Reference Handbook, 4th Edition, McGraw-Hill Inc.
11. South East Water (2007), Caring for your Household Appliances and Aquariums, Retrieved July 23, 2007, from www.southeastwater.com.au/SiteCollectionDocuments/Residential%20brochures/ Appliances%20and%20Aquariums.pdf
12. Water Quality Association (2006), Water Hardness Classifi cations, Retrieved July 24, 2007, from www.wqa.org/
13. World Health Organisation (2007), Water Sanitation and Health, Chemical Hazards in Drinking Water- Hardness, Retrieved July 24, 2007, from www.who.int/water_sanitation_health/dwq/chemicals/hardness/en/
14. Australian Government, Bureau of Meteorology (2008). Living with Drought. Retrieved March 2008 from www.bom.gov.au/climate/drought/livedrought.shtml
15. Australian Government, Bureau of Meteorology (2008). Climate Education. Retrieved March 2008 from www.bom.gov.au/lam/climate/levelthree/c20thc/drought.htm
16. Australian Water Association (2008). Industry facts: Desalination. Retrieved March 2008 from www.awa.asn.au/AM/Template.cfm?Section=Desalination&Template=/CM/HTMLDisplay.cfm&ContentID=4013
17. CSIRO (2005). Water Overview. Retrieved March 2008 from www.csiro.au/org/psf.html
References
Make your water mark!
Science 21 - Information for teachers
18. CSIRO (2007). Advanced Membrane Technologies for water treatment research cluster. Retrieved March 2008 from www.csiro.au/partnerships/ps30e.html
19. CSIRO (2007). Pollution Overview. Retrieved March 2008 from www.csiro.au/org/PollutionOverview.html
20. Gold Coast City Council (2005), Our Living City Report. Chapter 2: A Description of the Gold Coast Area. Retrieved January 2008 from www.goldcoastwater.qld.gov.au/attachment/publications/our_living_city0405_chp2.pdf
21. Gold Coast City Council (2006), Waterway Ecosystem Health Report Card 2006. Retrieved January 2008 from www.goldcoastwater.com.au/t_news_item.aspx?pid=6327
22. Queensland Government Environmental Protection Agency (2006), Caring for our Water. Retrieved January 2008 from www.epa.qld.gov.au/environment_management/water/caring_for_our_water/#Water%20pollution%20sources
23. Queensland Government, Department of Natural Resources and Water (2008), Fact Sheets. Retrieved March 2008 from www.nrw.qld.gov.au/factsheets/index.php
24. Queensland Studies Authority (2004, amended 2006), Science 21 (2007 Pilot) Syllabus. Retrieved March 2008 from www.qsa.qld.edu.au/syllabus/1968.html
25. Queensland Water Commission (2007), Projects: South East Queensland Water Grid. Retrieved January 2008 from www.qwc.qld.gov.au/Projects+-+South+East+Queensland+Water+Grid
26. Queensland Water Commission (2007), Water Supply Projects. Retrieved January 2008 from http://www.qwc.qld.gov.au/Projects
27. United Nations Educational, Scientifi c and Cultural Organisation (UNESCO) (2006), The United Nations World Water Development Report 2, Executive Summary. Retrieved February 2008 from www.unesdoc.unesco.org/images/0014/001444/144409E.pdf
28. U.S. Geological Survey (2008), Water Science for Schools: Where is Earth’s water located?Retrieved March 2008 from www.ga.water.usgs.gov/edu/earthwherewater.html
29. Water Technology-Net (2007), Tuas Seawater Desalination Plant. Retrieved March 2008 from www.water-technology.net/projects/tuas/
30. World Wildlife Fund (2007), Making Water, Desalination: option or distraction for a thirsty world?Retrieved March 2008 from www.assets.panda.org/downloads/desalinationreportjune2007.pdf
31. Watersecure (2010), Desalination - fresh water from the sea. Retrieved November 2010 from www.watersecure.com.au/images/stories/factsheets/watersecure_factsheet_desalination_web.pdf
References

Make your water mark!
Water from the sea – a local and global issue
Science 21
Seawater is drawn through an inlet tunnel that extends more
than one kilometre from the beach at Tugun. The seawater
first passes through a drum screen to remove particulates
larger than 3mm. To help remove suspended solids in
the filtration system, pH is corrected and polyelectrolyte
coagulant is added. Pre-treatment filtration involves dual
filters of sand and coal.
Desalination is a technology that separates dissolved salts
and other minerals from seawater or other salty water to
provide clean drinking water. The Gold Coast Desalination
Plant uses a process called reverse osmosis, which involves
the removal of salts and other minerals out of the water as it
moves through layers of extremely thin membranes under
high pressure. The pure water is then blended with other
drinking water supplies and distributed directly to users via
south-east Queensland’s new water grid.
Desalination – fresh water from the sea
The major benefit of desalination is that it can continue to
deliver high quality drinking water for consumption, even
during periods of drought. It also provides an alternative
source of water that will make our overall supply more
diverse and less vulnerable to interruption.
What are the benefits of a desalinated water supply?
What is desalination?
Gold Coast Desalination Plant
WaterSecure is a statutory authority that manages Australia’s largest water recycling scheme. It produces purified and desalinated water for south-east Queensland.
Did you know?
The Gold Coast Desalination Plant at Tugun produces
drinking water for south-east Queensland.
The Gold Coast Desalination Plant will
produce up to 133 megalitres a day.
Fact sheet - Desalination – fresh water from the sea - pg1
Appendices

Make your water mark!
Science 21 - Information for teachers
To see a virtual tour of the desalination plant go to www.seqwater.com.au
Fact sheet - Desalination – fresh water from the sea - pg2
Concentrated seawater disposal
SEAWATER SUPPLY
PRE-TREATMENT SYSTEM
REVERSE OSMOSISPROCESS
POST-TREATMENT
FRESHWATER STORAGE
Concentrated seawater
Treated water
Mesh spacer
Membrane sandwiches
Porous layer
Semi-permeable membrane
Product tube
Fibreglass membrane element
Salt water
Reverse osmosis is the most popular type of desalination
process in the world. Reverse osmosis involves forcing sea
water through layers of specially engineered membranes
at high pressure (about 60 times atmospheric pressure) to
remove dissolved salt and other microscopic particles. The
membrane is so thin that a stack of five thousand of them
would be only one millimetre thick. The process produces
water that is of a higher level of purity than water from dams
and reservoirs (see ‘How Reverse Osmosis Works’ fact sheet).
How does reverse osmosis work?
ENERGY
RECOVERY
SEAWATER INTAKE
- Chlorination- pH adjustment- Dechlorination
PRE-TREATMENTBACKWASH
TREATMENT
RO MODULES
POST-TREATMENT
DRINKING
WATER TO
SYSTEM
SEAWATER
CONCENTRATE (BRINE)
RETURN TO OCEAN
- Chlorination- Fluoridation
High Salinity
Seawater Return
Cleaning Process(Chlorination)
PUMPS
Stages of the desalination process
1. Seawater is drawn from the ocean through a
submerged inlet tunnel to the plant.
2. Pre-treatment involves micro-filtering particles
from seawater, adjusting the pH, and adding
an inhibitor to control the build-up of scale in
pipelines and tanks.
3. Reverse osmosis forces seawater through layers
of synthetic membranes to remove salt and
minerals. Concentrated salt water is separated
and returned to the ocean.
4. Post-treatment involves stabilising the water with
small amounts of lime and carbon dioxide, then
chlorine for disinfection.
5. Desalinated water is blended with other Gold
Coast water supplies and joins south-east
Queensland’s water grid to supply homes and
industry.
Stages of the desalination process
There are more than 56,000 reverse
osmosis membranes in the plant.
Appendices
Make your water mark!
Science 21 - Information for teachers
Fact sheet - Desalination – fresh water from the sea - pg3
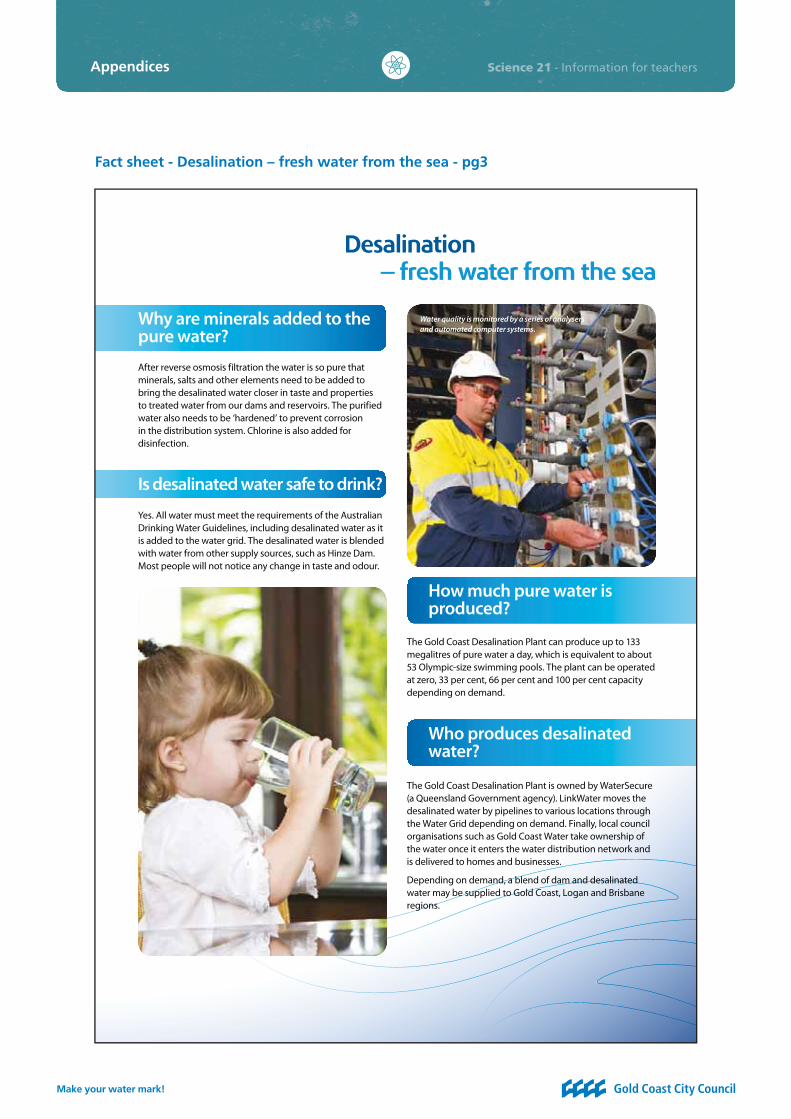
After reverse osmosis filtration the water is so pure that
minerals, salts and other elements need to be added to
bring the desalinated water closer in taste and properties
to treated water from our dams and reservoirs. The purified
water also needs to be ‘hardened’ to prevent corrosion
in the distribution system. Chlorine is also added for
disinfection.
Yes. All water must meet the requirements of the Australian
Drinking Water Guidelines, including desalinated water as it
is added to the water grid. The desalinated water is blended
with water from other supply sources, such as Hinze Dam.
Most people will not notice any change in taste and odour.
The Gold Coast Desalination Plant is owned by WaterSecure
(a Queensland Government agency). LinkWater moves the
desalinated water by pipelines to various locations through
the Water Grid depending on demand. Finally, local council
organisations such as Gold Coast Water take ownership of
the water once it enters the water distribution network and
is delivered to homes and businesses.
Depending on demand, a blend of dam and desalinated
water may be supplied to Gold Coast, Logan and Brisbane
regions.
The Gold Coast Desalination Plant can produce up to 133
megalitres of pure water a day, which is equivalent to about
53 Olympic-size swimming pools. The plant can be operated
at zero, 33 per cent, 66 per cent and 100 per cent capacity
depending on demand.
Desalination – fresh water from the sea
Why are minerals added to the pure water?
How much pure water is produced?
Who produces desalinated water?
Is desalinated water safe to drink?
Water quality is monitored by a series of analysers
and automated computer systems.
Appendices
Make your water mark!
Science 21 - Information for teachers
Fact sheet - Desalination – fresh water from the sea - pg4
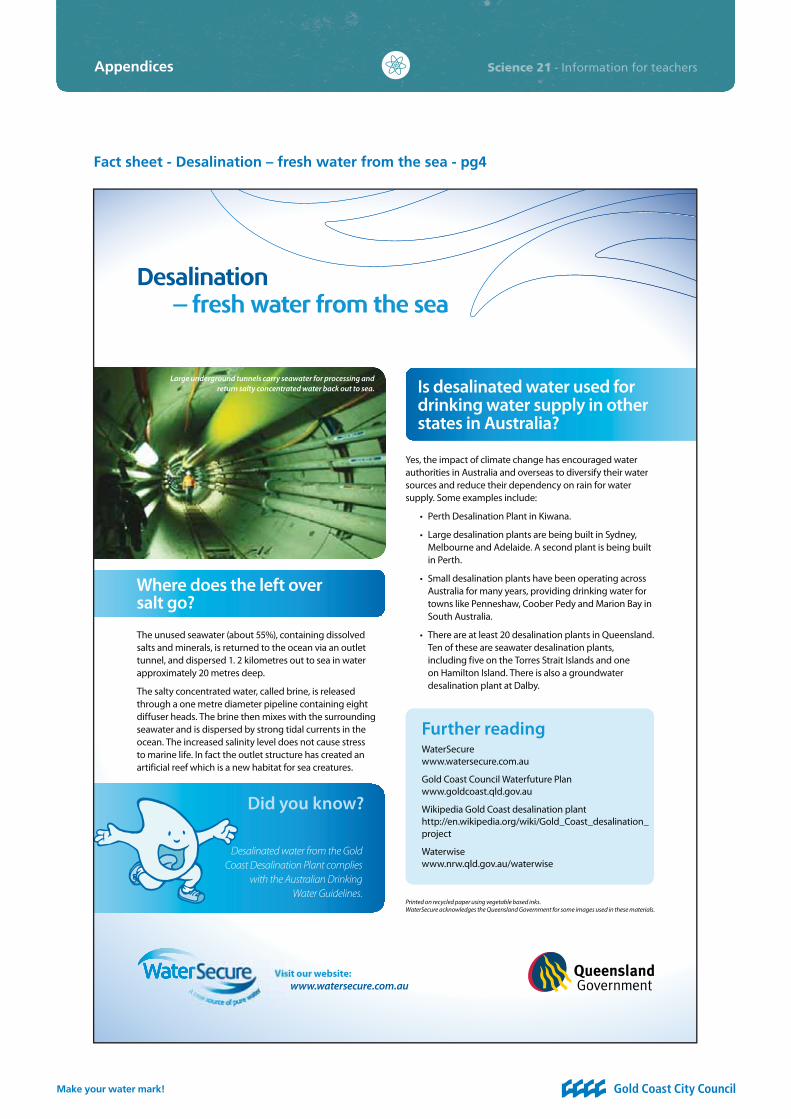
The unused seawater (about 55%), containing dissolved
salts and minerals, is returned to the ocean via an outlet
tunnel, and dispersed 1. 2 kilometres out to sea in water
approximately 20 metres deep.
The salty concentrated water, called brine, is released
through a one metre diameter pipeline containing eight
diffuser heads. The brine then mixes with the surrounding
seawater and is dispersed by strong tidal currents in the
ocean. The increased salinity level does not cause stress
to marine life. In fact the outlet structure has created an
artificial reef which is a new habitat for sea creatures.
Printed on recycled paper using vegetable based inks.WaterSecure acknowledges the Queensland Government for some images used in these materials.
Desalinated water from the Gold
Coast Desalination Plant complies
with the Australian Drinking
Water Guidelines.
Did you know?
Further readingWaterSecure
www.watersecure.com.au
Gold Coast Council Waterfuture Plan
www.goldcoast.qld.gov.au
Wikipedia Gold Coast desalination plant
http://en.wikipedia.org/wiki/Gold_Coast_desalination_
project
Waterwise
www.nrw.qld.gov.au/waterwise
Visit our website: www.watersecure.com.au
Yes, the impact of climate change has encouraged water
authorities in Australia and overseas to diversify their water
sources and reduce their dependency on rain for water
supply. Some examples include:
Melbourne and Adelaide. A second plant is being built
in Perth.
Australia for many years, providing drinking water for
towns like Penneshaw, Coober Pedy and Marion Bay in
South Australia.
Ten of these are seawater desalination plants,
including five on the Torres Strait Islands and one
on Hamilton Island. There is also a groundwater
desalination plant at Dalby.
Desalination – fresh water from the sea
Where does the left over salt go?
Is desalinated water used for drinking water supply in other states in Australia?
Large underground tunnels carry seawater for processing and
return salty concentrated water back out to sea.
Appendices

Make your water mark!
Science 21 - Information for teachers
Fact sheet - How healthy is your watercourse? pg1
Appendices

Make your water mark!
Science 21 - Information for teachers
Fact sheet - How healthy is your watercourse? pg2
Appendices

Make your water mark!
Science 21 - Information for teachers
Fact sheet - Sampling your water supply - pg1
Appendices

Make your water mark!
Science 21 - Information for teachers
Fact sheet - Sampling your water supply - pg2
Appendices