Embed Size (px)
Citation preview
Senior plcAnnual Report 2006
Senior plc59/61 High StreetRickmansworthHertfordshireWD3 1RHUnited Kingdom
T +44 (0)1923 775 547F +44 (0)1923 896 [email protected]
Sen
ior
plc
An
nu
alR
epo
rt2006
Designed by Sheppard Day CorporatePrinted by Beacon Press using pureprint – their environmental print technology
Contents1 Financial highlights
Directors’ report2 Chairman’s statement4 Board of Directors5 Report of the Directors7 Operating and financial review
14 Corporate governance report16 Audit Committee report18 Remuneration report24 Corporate social responsibility report26 Statement of Directors’ responsibilities27 Independent auditors’ report to the members of Senior plc
Financial information28 Consolidated income statement28 Statements of recognised income and expense29 Balance sheets30 Cash flow statements31 Notes to the financial statements62 Five year summary
Other information63 Principal group undertakings64 Additional shareholder informationibc 2007 Financial calendaribc Officers and advisers
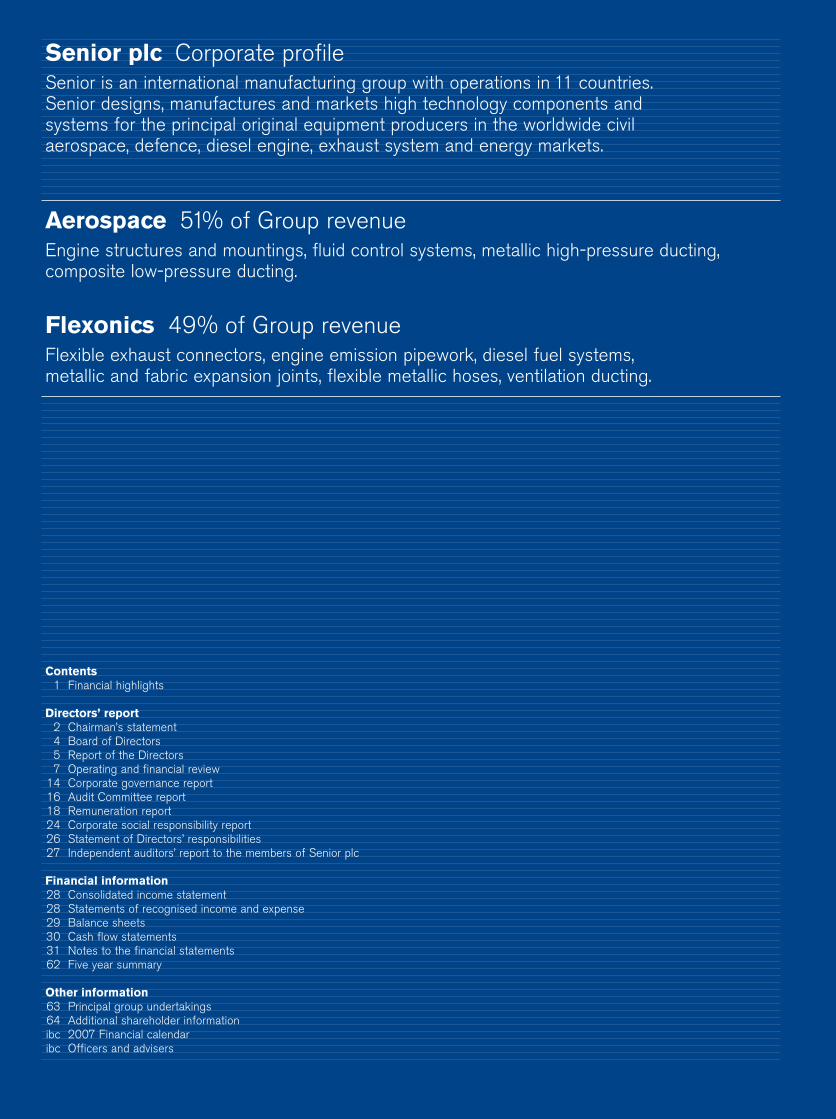
Senior plc Corporate profileSenior is an international manufacturing group with operations in 11 countries. Senior designs, manufactures and markets high technology components and systems for the principal original equipment producers in the worldwide civil aerospace, defence, diesel engine, exhaust system and energy markets.
Aerospace 51% of Group revenueEngine structures and mountings, fluid control systems, metallic high-pressure ducting,composite low-pressure ducting.
Flexonics 49% of Group revenueFlexible exhaust connectors, engine emission pipework, diesel fuel systems, metallic and fabric expansion joints, flexible metallic hoses, ventilation ducting.
The key events for the Company are set out below. Some ofthe dates are indicative only and may be subject to change.
1 MarchPreliminary announcement of 2006 annual results.
13 MarchPublication of Annual Report 2006.
27 AprilAnnual General Meeting.
2 May Shares ex-dividend for 2006 final dividend.
4 MayRecord date for shareholders on the register to receive the 2006 final dividend.
31 MayPayment of 2006 final dividend.
25 JunePre-close period statement.
2 AugustPreliminary announcement of 2007 interim results.
6 AugustPublication of Interim Report 2007.
31 OctoberShares ex-dividend for 2007 interim dividend.
2 NovemberRecord date for shareholders on the register to receive the 2007 interim dividend.
30 NovemberPayment of 2007 interim dividend.
17 DecemberPre-close period statement.
Secretary and Registered OfficeAndrew Bodenham59/61 High Street, Rickmansworth, Hertfordshire WD3 1RH
Registered in England and Wales No. 282772
RegistrarsLloyds TSB RegistrarsThe Causeway, Worthing, West Sussex BN99 6DA
AuditorsDeloitte & Touche LLP1 Woodborough Road, Nottingham NG1 3FG
SolicitorsSlaughter and MayOne Bunhill Row, London EC1Y 8YY
Principal UK Clearing Bankers Lloyds TSB Group plc25 Gresham Street, London EC2V 7HN
Investment BankersCitigroup Global Markets LimitedCitigroup Centre, 33 Canada Square, London E14 5LB
StockbrokersHoare Govett Limited250 Bishopsgate, London EC2M 4AA
2007 Financial Calendar Officers and Advisers
Senior plc Annual Report 2006 (5) Continuing business. 1
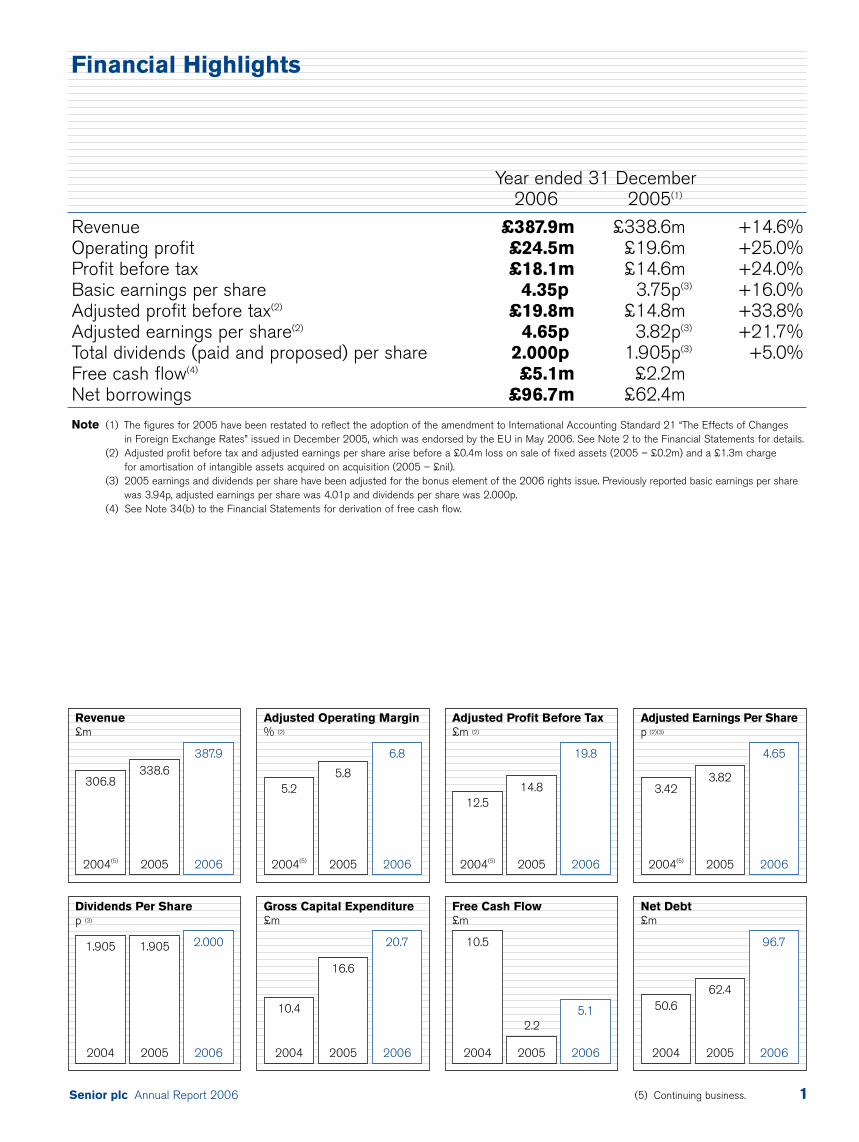
Revenue£m
306.8338.6
387.9
2004(5) 2005 2006
Gross Capital Expenditure£m
10.4
16.6
20.7
Adjusted Operating Margin% (2)
5.25.8
6.8
2004(5) 2005 2006
Adjusted Profit Before Tax£m (2)
12.514.8
19.8
2004(5) 2005 2006
2004 2005 2006
Adjusted Earnings Per Share p (2)(3)
3.423.82
4.65
2004(5) 2005 2006
Net Debt£m
50.662.4
96.7
2004 2005 2006
Dividends Per Sharep (3)
1.905 1.905 2.000
2004 2005 2006
Free Cash Flow£m
10.5
5.1
2004 2005 2006
Year ended 31 December2006 2005(1)
Revenue £387.9m £338.6m +14.6%Operating profit £24.5m £19.6m +25.0%Profit before tax £18.1m £14.6m +24.0%Basic earnings per share 4.35p 3.75p(3) +16.0%Adjusted profit before tax(2) £19.8m £14.8m +33.8%Adjusted earnings per share(2) 4.65p 3.82p(3) +21.7%Total dividends (paid and proposed) per share 2.000p 1.905p(3) +5.0%Free cash flow(4) £5.1m £2.2mNet borrowings £96.7m £62.4m
Note (1) The figures for 2005 have been restated to reflect the adoption of the amendment to International Accounting Standard 21 “The Effects of Changes in Foreign Exchange Rates” issued in December 2005, which was endorsed by the EU in May 2006. See Note 2 to the Financial Statements for details.
(2) Adjusted profit before tax and adjusted earnings per share arise before a £0.4m loss on sale of fixed assets (2005 – £0.2m) and a £1.3m charge for amortisation of intangible assets acquired on acquisition (2005 – £nil).
(3) 2005 earnings and dividends per share have been adjusted for the bonus element of the 2006 rights issue. Previously reported basic earnings per sharewas 3.94p, adjusted earnings per share was 4.01p and dividends per share was 2.000p.
(4) See Note 34(b) to the Financial Statements for derivation of free cash flow.
Financial Highlights
2.2
Senior plc Annual Report 20062
The Group has delivered an excellent set of results with adjusted profitbefore tax 33.8% ahead of the prior year. Aerospace ManufacturingTechnologies, Inc. (“AMT”) and Sterling Machine Co., Inc. (“SterlingMachine”), the two North American aerospace businesses acquired during2006, both delivered strong performances. Their full year contribution,combined with the continuing growth in build rates of commercial aircraft and the production ramp up of the Group’s new heavy duty dieselengine products, mean prospects for the Group are very encouraging.Consequently, the Board is pleased to recommend a 5% increase in thefull year dividend, the first increase for seven years.
Financial ResultsIt is pleasing to be able to report progress on all aspects of financialperformance with significant advances being made in top and bottomline growth.
During 2006, Group revenue increased by 14.6% to £387.9m(2005 – £338.6m) and operating profit increased by 25.0% to £24.5m(2005 – £19.6m) largely due to increasing build rates of civil aircraft,strong energy markets and the two acquisitions completed in the year.
Adjusted profit before tax, the measure which the Board believes bestreflects the true underlying performance of the business, increased by 33.8% to £19.8m (2005 – £14.8m). Adjusted profit before tax is before the loss on sale of fixed assets of £0.4m (2005 – £0.2m) and a £1.3m (2005 – £nil) charge for amortisation of intangible assetsacquired on acquisition.
Adjusted earnings per share increased by 21.7% to 4.65p (2005 – 3.82prestated for the bonus element of the rights issue) despite an increasedtax charge of 17.7% (2005 – 16.9%) on adjusted profit before tax.
Year-end net debt increased to £96.7m (2005 – £62.4m) largely as a consequence of the acquisitions, which were funded by debt aswell as new equity, and the ongoing investment in the manufacturingcapacity and capability of the Senior Group. The majority of the debt isdesignated in US dollars, with the level of year-end debt benefiting fromthe weakening of the US dollar against the UK pound during 2006.
DividendThe Board is recommending an increase in the dividend, the first forseven years. It is proposed that the final dividend to be paid for 2006 is 1.381p per share (2005 – 1.286p restated for the bonus element of the rights issue) an increase of 7.4%. When added to the restated0.619p interim dividend, this will bring the full year dividend to 2.000p,an increase of 5.0% over the restated 1.905p for 2005. The finaldividend, if approved, will be paid on 31 May 2007 to shareholders on the register at close of business on 4 May 2007. With encouragingprospects for the Group, the Board anticipates following a progressivedividend policy going forward.
AcquisitionsDuring 2006, Senior acquired two businesses to add to its existingaerospace interests. Both were privately owned and located in the USA. These acquisitions met certain key criteria namely: aerospace bypreference; good growth prospects in existing markets; profitable andimmediately enhancing to Group earnings per share without the need to assume synergistic benefits. Both the acquired businesses haveperformed in line with expectations during their time within the Group.
Sterling Machine was purchased by Senior at the end of January 2006for £21.5m. The company is a machine shop working in titanium, nickeland magnesium alloys that manufactures flight critical componentsprimarily for the Sikorsky Aircraft Corporation. It is located in Enfield,Connecticut, USA, and is a well invested business housed in a facilitybuilt in 2003. Sikorsky, a builder of mainly military helicopters, isoutsourcing more of its component manufacture as it increases its buildrate to meet a strong order book. Increasing numbers of helicopters areflying in various operational roles and the result is a growing demandfor spares. Sterling Machine continues to be focused on growing itslevel of business service to Sikorsky and, following its acquisition, newmachining centres have been ordered to increase capacity and thefactory floor space increased by 50%. We anticipate that SterlingMachine will continue to maintain its growth momentum.
Aerospace Manufacturing Technologies, Inc. (“AMT”) was acquired at the end of October 2006 for £60.0m. The business is located in Arlington, Washington State, USA, in the Seattle area. AMT is a machine shop, working almost exclusively in the manufacture ofaluminium structural parts for Boeing civil aircraft. It has substantialcontent on current Boeing production aircraft – the 737, 777 and 747.The company is exceptionally well invested with a substantial number of state-of-the-art four and five-axis computer controlled machiningcentres. AMT is set to continue to grow as a result of increases in the build rates of Boeing’s existing aircraft and also the launch of the new, highly successful, Boeing 787 (“Dreamliner”) on which AMThas substantial content. As a result, capacity expansion has beensanctioned with new machining centres being ordered. Additional land,adjacent to the existing facility, has already been purchased and plansfor new factory space are currently under consideration.
TradingSenior’s operations are organised into two similar sized operatingdivisions – Aerospace with 12 operating subsidiaries and Flexonics with 11. Both Divisions are focused on manufacturing components and systems for the original equipment manufacturers. There is littleaftermarket content and the Group’s operations generally deliver to the required production schedules of their customers. All products areengineered for specific applications, so levels of demand are essentiallydriven by the success, or otherwise, of customers’ individual product lines.
AerospaceIn Aerospace, the civil market, particularly for large commercial aircraft(35% of Divisional sales) and business jets (9%), continued to be verystrong. Whilst 2005 had been a memorable year for order intake by the large civil aircraft builders and their engine suppliers, 2006 turnedout to be almost as good, with Boeing delivering 398 civil airliners andbooking new orders for 1,044, and Airbus delivering 434 and booking790. The result is that both aircraft manufacturers currently havearound six year order books, at 2006 delivery rates.
The Aerospace Division has substantial exposure to the new highlysuccessful Boeing 787, due into service in late 2008, both on theaircraft itself and its engines, but only limited exposure to the largeAirbus A380, which has suffered extensive production delays. The defence and military sector (27% of Divisional sales in 2006) was relatively stable throughout the year.
Chairman’s Statement
Senior plc Annual Report 2006 3
The two acquisitions made in 2006 immediately contributed positivelyto the fortunes of the Division. In addition to the investment in the newlyacquired businesses, capital expenditure is running at a higher rate than in recent years throughout the Aerospace Division, as build ratesincrease throughout the industry and new aircraft programmes ramp up.
The result of all this activity was an increase in the Aerospace Division’ssales of 27.1% to £197.0m (2005 – £155.0m at constant currency i.e.2005 results translated using 2006 average exchange rates) and anadjusted operating profit increase of 48.8% to £19.2m (2005 – £12.9mat constant currency).
FlexonicsIn Flexonics, the automotive markets in which the Group operates showedlittle change in demand. In North America, 16.0 million light vehicleswere produced in 2006 compared to 16.4 million in 2005. In WesternEurope, 18.4 million light vehicles were built compared to 18.0 million in 2005. Consequently, the Group’s automotive volumes remained atabout the same level in 2006 as in 2005, but with the manufacturingbase continuing to move away from the US, UK and France, to theCzech Republic, South Africa, Brazil and India.
An important stage in the business development of this Division hasbeen reached. Following nearly four years of product development andtwo years of production process development and capital investment,sales of the new products for North American built heavy duty dieselengines have commenced. This is incremental business for the Division’sNorth American operation and takes the Division into a new marketsector where demand is being driven by the need for lower engineemissions from 2007 onwards. This market sector continues to offergood opportunities for future growth.
Energy markets (power generation, oil and gas and process plant) wererewarding in 2006, driven by the industrialisation of China and India and the high demand for many basic commodities. As 2006 ended, theGroup saw continued development of these energy markets, the returnof some nuclear market activity, and completion of the site work on thetroublesome Wembley Stadium ducting contract.
Overall, Flexonics reported sales growth of 5.1% to £191.5m (2005 – £182.2m at constant currency). Adjusted operating profitsincreased by 8.3% to £11.8m (2005 – £10.9m at constant currency).The increases were achieved despite the flat automotive markets, as a number of new automotive programmes were won, the new heavy duty diesel products commenced production in the final quarter of the year, energy markets were strong and the site-work on Wembleywas completed.
Employees and the BoardI would like to extend a warm welcome to all the new employees joiningSenior, as well as thanking the Group’s employees for another year ofunstinting effort and commitment, a year in which their endeavours haveresulted in a significant step forward in the performance and the valueof the Senior Group. It is particularly important that the Group has theright people in the right roles, given the geographical diversity of theGroup and its lean structure, and I am pleased that the Group has made significant progress in this area over recent years.
Having been on the Board of Senior for 10 years, the past six as Chairman,I am planning to retire sometime during 2007. I am delighted that MartinClark, a non-executive Director of six years, has agreed to becomeChairman when I leave. The recruitment of a new non-executive Directoris well advanced with an appointment anticipated prior to my retirement.
I am proud of the advances Senior has made whilst I have beenChairman, but most of all I am proud of the achievements of theGroup’s employees.
OutlookThe Senior Group enters 2007 with almost universally larger order booksacross its operations than it had a year ago. Demand from customerscontinues at an encouraging level.
The aerospace industry continues to thrive, the Group’s new heavy duty diesel products are in production and energy markets are strong.The challenges of recruiting the necessary skills to grow our business,the availability and pricing of raw materials and the fluctuations in themajor currencies in which Senior trades are all still present. These arenot, however, new challenges for Senior or its management.
Trading in the first two months of 2007 has been in line with the Board’sexpectations and I expect that 2007 will deliver further meaningful growth.
James Kerr-MuirChairman
Senior plc Annual Report 20064
Main BoardThe main Board met a total of 11 times during the period 1 January 2006 to31 December 2006. There was full attendanceat every Board Meeting during the year.
Audit CommitteeMartin Clark (Chairman) and Ian Much. Met three times during the year.
Remuneration CommitteeIan Much (Chairman) and Martin Clark. James Kerr-Muir was re-appointed to theCommittee on 1 August 2006. Met five timesduring the year.
Nominations CommitteeJames Kerr-Muir (Chairman), Martin Clark and Ian Much. Met twice during the year.
Health, Safety & Environment CommitteeGraham Menzies (Chairman), Mike Sheppardand Ron Case (CEO Aerospace Division). Met three times during the year.
There was full attendance at every Committeeof the Board during the year.
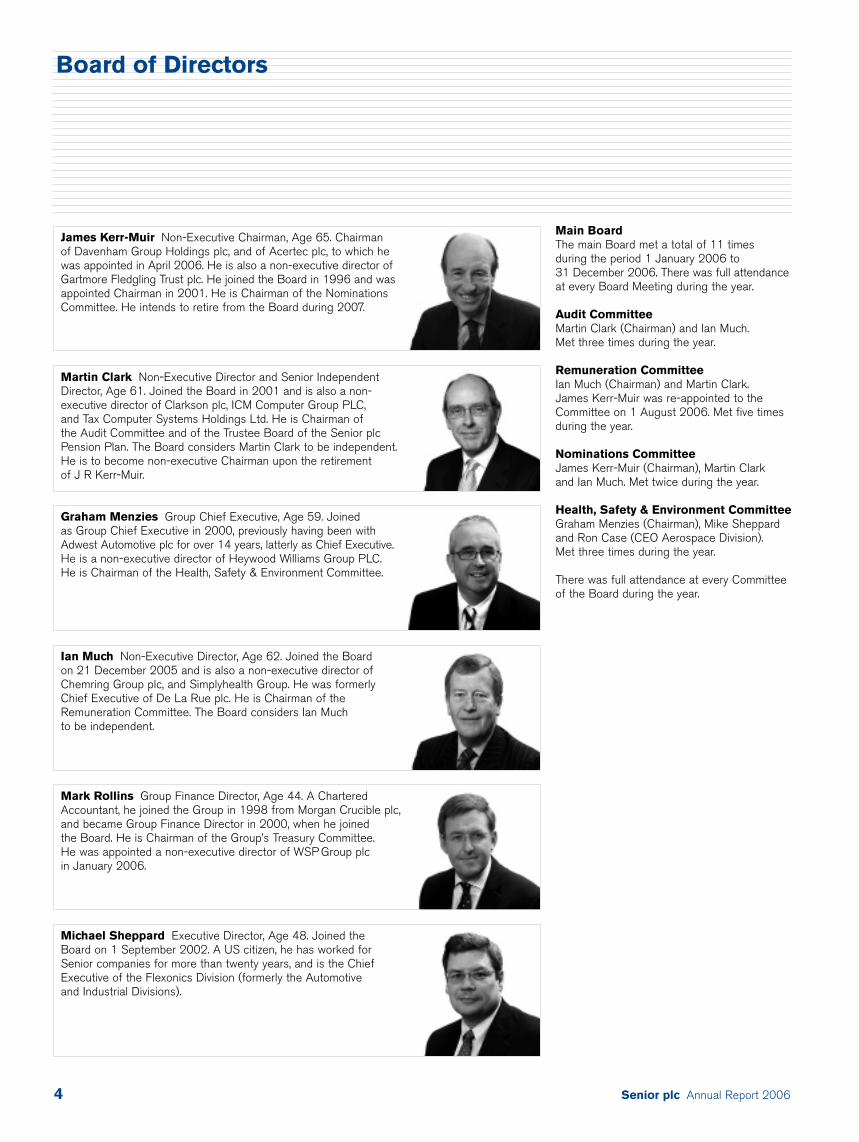
James Kerr-Muir Non-Executive Chairman, Age 65. Chairman of Davenham Group Holdings plc, and of Acertec plc, to which hewas appointed in April 2006. He is also a non-executive director ofGartmore Fledgling Trust plc. He joined the Board in 1996 and wasappointed Chairman in 2001. He is Chairman of the NominationsCommittee. He intends to retire from the Board during 2007.
Graham Menzies Group Chief Executive, Age 59. Joined as Group Chief Executive in 2000, previously having been withAdwest Automotive plc for over 14 years, latterly as Chief Executive.He is a non-executive director of Heywood Williams Group PLC. He is Chairman of the Health, Safety & Environment Committee.
Mark Rollins Group Finance Director, Age 44. A CharteredAccountant, he joined the Group in 1998 from Morgan Crucible plc,and became Group Finance Director in 2000, when he joined the Board. He is Chairman of the Group’s Treasury Committee. He was appointed a non-executive director of WSP Group plc in January 2006.
Michael Sheppard Executive Director, Age 48. Joined the Board on 1 September 2002. A US citizen, he has worked forSenior companies for more than twenty years, and is the ChiefExecutive of the Flexonics Division (formerly the Automotive and Industrial Divisions).
Martin Clark Non-Executive Director and Senior IndependentDirector, Age 61. Joined the Board in 2001 and is also a non-executive director of Clarkson plc, ICM Computer Group PLC, and Tax Computer Systems Holdings Ltd. He is Chairman of the Audit Committee and of the Trustee Board of the Senior plcPension Plan. The Board considers Martin Clark to be independent.He is to become non-executive Chairman upon the retirement of J R Kerr-Muir.
Ian Much Non-Executive Director, Age 62. Joined the Board on 21 December 2005 and is also a non-executive director ofChemring Group plc, and Simplyhealth Group. He was formerlyChief Executive of De La Rue plc. He is Chairman of theRemuneration Committee. The Board considers Ian Much to be independent.
Board of Directors
Senior plc Annual Report 2006 5
DirectorsDetails on the Directors who served throughout the year can be foundon page 4. The Directors’ interests in the shares of the Company areincluded in the Remuneration Report on pages 18 to 23. None of the Directors has any interest in contracts with the Company or itssubsidiary undertakings.
J R Kerr-Muir intends to retire from the Board during 2007. M Clark is to become non-executive Chairman upon J R Kerr-Muir’s retirement,and I F R Much is to be appointed the Senior Independent Director.
A new non-executive Director is expected to be appointed prior toJ R Kerr-Muir’s retirement. M Clark and G R Menzies retire by rotationand, being eligible, offer themselves for re-election at the AGM. M Clarkhas no service agreement with the Company and G R Menzies has aservice agreement subject to 12 months’ notice by either party.
Research and DevelopmentIn 2006, the Group incurred £8.5m (2005 – £8.3m) on research and development, before recoveries from customers of £0.8m (2005 – £0.6m). The majority of the Group’s efforts are focused on product development and improved manufacturing techniques.
Charitable and Political DonationsDuring the year, the Group made charitable donations amounting to £35,000 (2005 – £53,000), principally to local charities serving the communities in which the Group operates. No political donationswere made.
Disabled Employees and Employee ConsultationThe Group’s policies in respect of disabled employees and jobapplicants, and employee consultation are set out in the CorporateSocial Responsibility Report on page 24.
Policy on Payment of CreditorsThe Group’s policy is to settle the terms of payment with its supplierswhen agreeing the terms of each transaction and to seek to adhere to those terms. Based on the ratio of Company trade creditors at theend of the year to the amounts invoiced during the year by suppliers,the number of days outstanding at the year-end was 15 days (2005 – 37 days). However, these figures are not considered indicative of the typical payment terms adhered to, which are estimated to be on average about 30 days for the Company.
Major ShareholdingsAt 28 February 2007, the following shareholders had advised holdingsin excess of 3% of the issued share capital of the Company:
Barclays 31,138,259 7.98%Legal & General Investment Management 28,056,968 7.19%Schroder Investment Management 26,433,546 6.78%JO Hambro Capital Management 14,627,486 3.75%Deutsche Asset Management 13,706,031 3.51%Aegon Asset Management 12,456,266 3.19%HBOS 12,361,671 3.17%Morley Fund Management 11,745,657 3.01%
The Directors present their report and supplementary reports, together with the audited financial statements for the year ended31 December 2006.
Activities and Business ReviewSenior plc is a holding company. Its Principal Group Undertakings are shown on page 63 and comments on each Division’s results andactivities in 2006 are included in the Operating and Financial Review(“OFR”) on pages 7 to 13. The OFR includes details of the principalrisks and uncertainties facing the Group, expected future developmentsin the Group’s business, an indication of its activities in the field ofresearch and development, and details of key performance indicatorsthat management uses.
Acquisitions and DisposalsThere were no disposals during the year. Sterling Machine Co., Inc. was acquired on 27 January 2006 and Aerospace ManufacturingTechnologies, Inc. (“AMT”) was acquired on 27 October 2006; details of the transactions are set out in Note 33 to the Financial Statementson page 53 to 54.
Results and DividendsThe results for the year are shown in the Consolidated Income Statementon page 28.
An interim dividend of 0.619p per share (2005 – 0.619p) has alreadybeen paid and the Directors recommend a final dividend of 1.381p pershare (2005 – 1.286p). The final dividend, if approved, will be payableon 31 May 2007 to shareholders on the register at the close of businesson 4 May 2007. This would bring the total dividend for the year to2.000p per share (2005 – 1.905p). The prior year dividend comparativefigures have been adjusted to reflect the rights issue that took place in October 2006.
Share CapitalThe following table shows the changes in the Company’s share capitalduring 2006:
Shares in issue at 1 January 2006 309,285,740Placing to partly finance acquisition of Sterling Machine Co., Inc. 15,000,000Shares allotted in respect of Senior plc Savings Related Share Option Plan 692,880Shares allotted in respect of rights issue to partly finance acquisition of AMT 64,960,962Shares in issue at 31 December 2006 389,939,582
A further 50,626 shares were allotted under the Senior plc SavingsRelated Share Option Plan in January and February 2007.
Further share capital details are given in Note 25 to the FinancialStatements on page 51.
Financial InstrumentsNote 21 to the Financial Statements on page 48 contains disclosureson Financial Instruments.
Report of the Directors
Senior plc Annual Report 20066
So far as is known, no other shareholder had a notifiable interestamounting to 3% or more of the share capital of the Company and the Directors believe that the close company provisions of theIncome and Corporation Taxes Act 1988 (as amended) do not apply to the Company.
Compliance with the Combined CodeThe statements of compliance with the provisions of the CombinedCode on Corporate Governance that was issued in 2003 by theFinancial Reporting Council are set out on page 14.
Remuneration ReportThe Company’s policy on executive Directors’ remuneration is set out in the Remuneration Report on pages 18 to 23. The RemunerationReport is to be put to shareholder vote at the Annual General Meetingon 27 April 2007.
Annual General MeetingThe Notice of Meeting describes the business to be considered at the Annual General Meeting to be held on Friday 27 April 2007 at theoffices of ABN Amro, 250 Bishopsgate, London EC2M 4AA at 11.30 am.
Acquisition of the Company’s Own SharesThe Company purchased none of its ordinary shares during the year. At the end of the year, the Directors had authority, under the shareholders’resolutions dated 28 April 2006, to make market purchases of theCompany’s shares up to an aggregate nominal amount of £3.24m,which represented 10% of the issued share capital of the Company.
AuditorsEach of the persons who is a Director at the date of approval of thisAnnual Report confirms that:
• so far as the Director is aware, there is no relevant audit informationof which the Company’s Auditors are unaware; and
• the Director has taken all the steps that he ought to have taken as a Director in order to make himself aware of any relevant auditinformation and to establish that the Company’s Auditors are aware of that information.
This confirmation is given and should be interpreted in accordance with the provisions of Section 234ZA of the Companies Act 1985.
A resolution to re-appoint Deloitte & Touche LLP as the Company’sAuditor will be proposed at the forthcoming Annual General Meeting.
By Order of the BoardAndrew BodenhamSecretary28 February 2007
Report of the Directors continued
Senior plc Annual Report 2006 7
To the members of Senior plcThis Operating and Financial Review (“OFR”) has been prepared solely to provide additional information to enable shareholders to assess theCompany’s strategies and the potential for those strategies to befulfilled. The OFR should not be relied upon by any other party for anyother purpose.
The OFR contains certain forward-looking statements. Such statementsare made by the Directors in good faith based on the informationavailable to them at the time of their approval of this report, and they should be treated with caution due to the inherent uncertaintiesunderlying any such forward-looking information.
In preparing this OFR, the Directors have sought to comply with the guidance set out in the Accounting Standards Board’s ReportingStatement: “Operating and Financial Review”.
This OFR has been prepared for the Group as a whole and thereforegives greatest emphasis to those matters which are significant toSenior plc and its subsidiary undertakings when viewed as a whole. The OFR discusses the following:
• Operations• Long-term strategy and business objectives• Key performance indicators• Acquisitions• Financial review• Divisional review• Outlook• Risks and uncertainties• Resources• Corporate responsibility
OperationsSenior is an international manufacturing group with operations in 11 countries. Senior designs, manufactures and markets hightechnology components and systems for the principal originalequipment producers in the worldwide civil aerospace, defence, diesel engine, exhaust system and energy markets. The Group is split into two Divisions, Aerospace and Flexonics.
AerospaceFollowing the acquisition of two aerospace businesses in the year,Sterling Machine and AMT, the Aerospace Division is now the larger of the Group’s two Divisions, consisting of 12 operating companies,seven of which are located in the USA, with the remainder in Europe. In 2006, the Division’s main products were engine structures andmounting systems (30% of Divisional sales), metallic ducting systems(25%), composite ducting systems (14%), helicopter machined parts(7%), fluid control systems (6%) and airframe and other structural parts (3%). 15% of Divisional sales are to non-aerospace, but relatedtechnology, markets. In 2007, sales of airframe and other structuralparts are expected to represent a much greater portion of Divisionalsales, as AMT was owned by Senior for only the final two months of 2006.
FlexonicsThe Flexonics Division has 11 operations and was formed at thebeginning of 2006, by the consolidation of the Automotive (eightoperations) and Industrial (three operations) Divisions, for managerial,technical and market-related reasons. The 11 operations are located in North America (three), Europe (five), South Africa, India and Brazil. In 2006, the Division’s sales comprised of flexible mechanisms forvehicle exhaust systems (32% of Divisional sales), diesel fuel distributionpipework (13%), cooling and emission control components (12%),expansion joints and ducting for the heating and ventilation market(11%), expansion joints/control bellows/hoses for the power market(11%), for the oil and gas and chemical processing industries (7%) and for other industrial markets (14%). 2007 is anticipated to see anincreasing percentage of sales coming from the diesel fuel distributionpipework, and the cooling and emission control component sectors, as production of the Group’s new heavy duty diesel products ramp up.
Long-term Strategy and Business ObjectivesSenior is a manufacturer of products used principally in the aerospace,diesel engine, exhaust system and energy markets.
There are four key elements to Senior’s strategy for acceleratinggrowth and creating real shareholder value. They are:
• targeted investment in new product development for markets having higher than average growth potential;
• exceeding customer expectation through advanced processengineering and excellent factory execution;
• focused acquisitions which meet strict financial and commercial criteria; • creating an entrepreneurial culture, with strong controls, amongst
its operating businesses.
The Group implements and monitors its performance against its strategyby having the following financial objectives:
• to have organic annual sales growth in excess of the rate of inflation;• to increase adjusted earnings per share on an annual basis by more
than the rate of inflation;• to increase the Group’s return on revenue margin each year;• to generate sufficient cash to enable the Group to follow
a progressive dividend policy;• to maintain an overall return on capital employed in excess of the
Group’s cost of capital and to target a return in excess of 15%.
These financial objectives have more recently been supported by twonon-financial objectives which are:
• to reduce the Group’s carbon dioxide emissions to revenue ratio by 15% by 2010; and
• to reduce the number of OSHA (or equivalent) recordable injury and illness cases involving days away from work per 100 employeesby 5% per annum.
During 2006, the Group made significant progress on a number of its strategic objectives. Two aerospace businesses were acquired,both of which made strong starts within the Group, the new heavy dutydiesel engine products went into production in the final quarter of the year,and on-time delivery performance was maintained at acceptable levelsdespite the significant ramp up in the build rates of commercial aircraft.
Operating and Financial Review
Senior plc Annual Report 20068
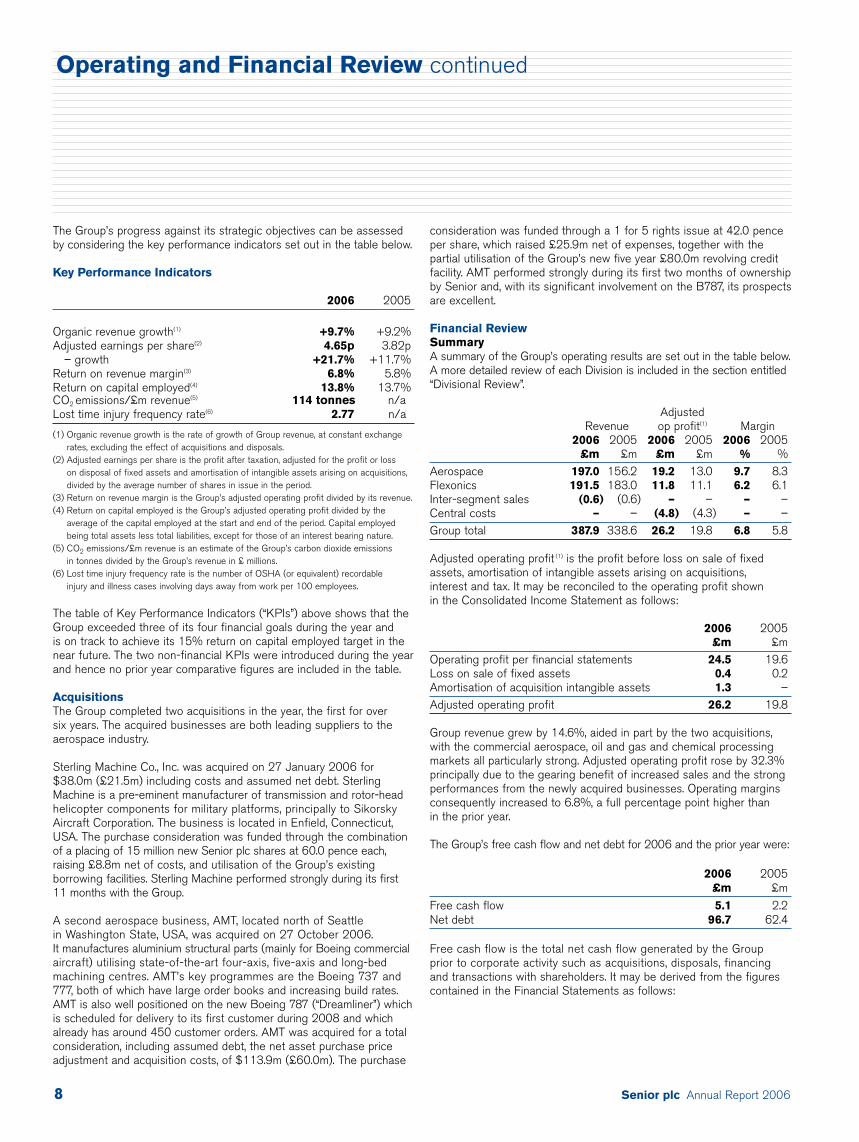
The Group’s progress against its strategic objectives can be assessedby considering the key performance indicators set out in the table below.
Key Performance Indicators
2006 2005
Organic revenue growth(1) +9.7% +9.2%Adjusted earnings per share(2) 4.65p 3.82p
– growth +21.7% +11.7%Return on revenue margin(3) 6.8% 5.8%Return on capital employed(4) 13.8% 13.7%CO2 emissions/£m revenue(5) 114 tonnes n/aLost time injury frequency rate(6) 2.77 n/a
(1) Organic revenue growth is the rate of growth of Group revenue, at constant exchangerates, excluding the effect of acquisitions and disposals.
(2) Adjusted earnings per share is the profit after taxation, adjusted for the profit or loss on disposal of fixed assets and amortisation of intangible assets arising on acquisitions,divided by the average number of shares in issue in the period.
(3) Return on revenue margin is the Group’s adjusted operating profit divided by its revenue. (4) Return on capital employed is the Group’s adjusted operating profit divided by the
average of the capital employed at the start and end of the period. Capital employedbeing total assets less total liabilities, except for those of an interest bearing nature.
(5) CO2 emissions/£m revenue is an estimate of the Group’s carbon dioxide emissions in tonnes divided by the Group’s revenue in £ millions.
(6) Lost time injury frequency rate is the number of OSHA (or equivalent) recordable injury and illness cases involving days away from work per 100 employees.
The table of Key Performance Indicators (“KPIs”) above shows that theGroup exceeded three of its four financial goals during the year and is on track to achieve its 15% return on capital employed target in thenear future. The two non-financial KPIs were introduced during the year and hence no prior year comparative figures are included in the table.
AcquisitionsThe Group completed two acquisitions in the year, the first for over six years. The acquired businesses are both leading suppliers to theaerospace industry.
Sterling Machine Co., Inc. was acquired on 27 January 2006 for$38.0m (£21.5m) including costs and assumed net debt. SterlingMachine is a pre-eminent manufacturer of transmission and rotor-headhelicopter components for military platforms, principally to SikorskyAircraft Corporation. The business is located in Enfield, Connecticut,USA. The purchase consideration was funded through the combinationof a placing of 15 million new Senior plc shares at 60.0 pence each,raising £8.8m net of costs, and utilisation of the Group’s existingborrowing facilities. Sterling Machine performed strongly during its first11 months with the Group.
A second aerospace business, AMT, located north of Seattle in Washington State, USA, was acquired on 27 October 2006. It manufactures aluminium structural parts (mainly for Boeing commercialaircraft) utilising state-of-the-art four-axis, five-axis and long-bedmachining centres. AMT’s key programmes are the Boeing 737 and777, both of which have large order books and increasing build rates.AMT is also well positioned on the new Boeing 787 (“Dreamliner”) whichis scheduled for delivery to its first customer during 2008 and whichalready has around 450 customer orders. AMT was acquired for a totalconsideration, including assumed debt, the net asset purchase priceadjustment and acquisition costs, of $113.9m (£60.0m). The purchase
consideration was funded through a 1 for 5 rights issue at 42.0 penceper share, which raised £25.9m net of expenses, together with thepartial utilisation of the Group’s new five year £80.0m revolving creditfacility. AMT performed strongly during its first two months of ownershipby Senior and, with its significant involvement on the B787, its prospectsare excellent.
Financial ReviewSummaryA summary of the Group’s operating results are set out in the table below.A more detailed review of each Division is included in the section entitled“Divisional Review”.
Adjusted Revenue op profit(1) Margin
2006 2005 2006 2005 2006 2005£m £m £m £m % %
Aerospace 197.0 156.2 19.2 13.0 9.7 8.3Flexonics 191.5 183.0 11.8 11.1 6.2 6.1Inter-segment sales (0.6) (0.6) – – – –Central costs – – (4.8) (4.3) – –Group total 387.9 338.6 26.2 19.8 6.8 5.8
Adjusted operating profit (1) is the profit before loss on sale of fixedassets, amortisation of intangible assets arising on acquisitions, interest and tax. It may be reconciled to the operating profit shown in the Consolidated Income Statement as follows:
2006 2005£m £m
Operating profit per financial statements 24.5 19.6Loss on sale of fixed assets 0.4 0.2Amortisation of acquisition intangible assets 1.3 –Adjusted operating profit 26.2 19.8
Group revenue grew by 14.6%, aided in part by the two acquisitions,with the commercial aerospace, oil and gas and chemical processingmarkets all particularly strong. Adjusted operating profit rose by 32.3%principally due to the gearing benefit of increased sales and the strongperformances from the newly acquired businesses. Operating marginsconsequently increased to 6.8%, a full percentage point higher than in the prior year.
The Group’s free cash flow and net debt for 2006 and the prior year were:
2006 2005£m £m
Free cash flow 5.1 2.2Net debt 96.7 62.4
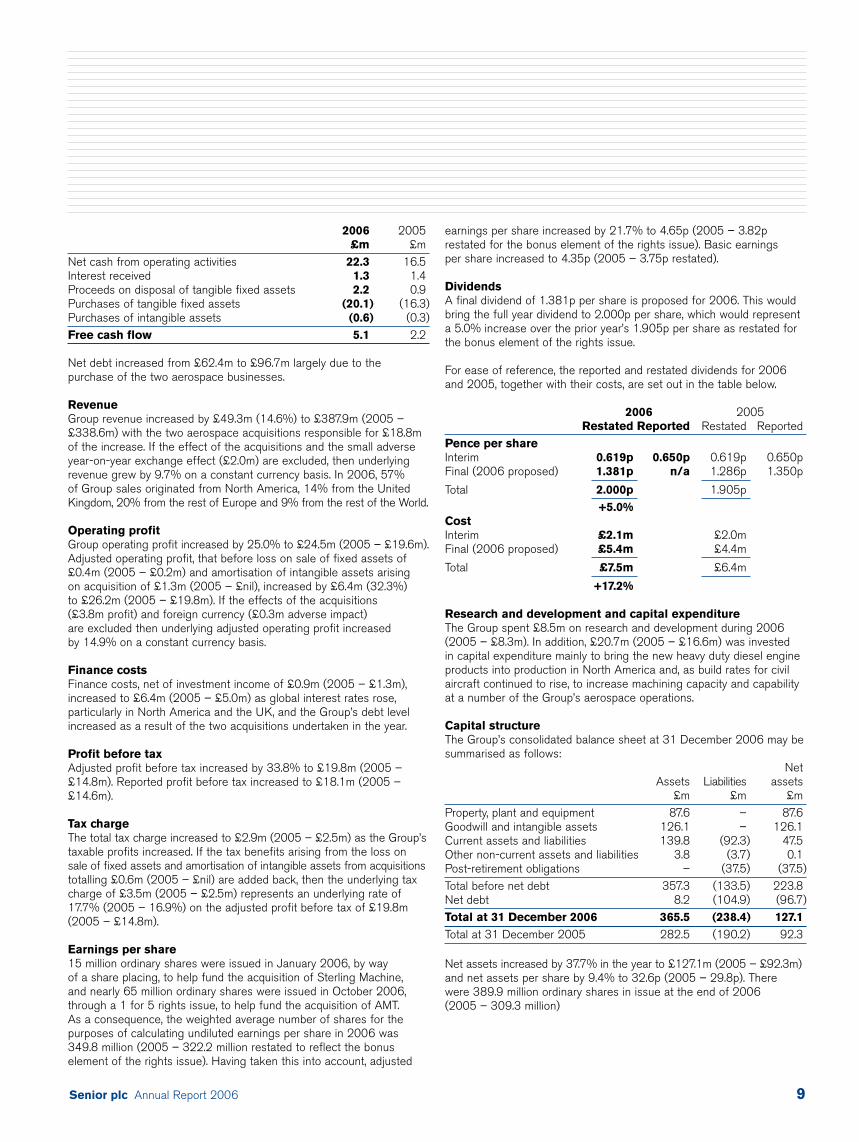
Free cash flow is the total net cash flow generated by the Group prior to corporate activity such as acquisitions, disposals, financing and transactions with shareholders. It may be derived from the figurescontained in the Financial Statements as follows:
Operating and Financial Review continued
Senior plc Annual Report 2006 9
2006 2005£m £m
Net cash from operating activities 22.3 16.5Interest received 1.3 1.4Proceeds on disposal of tangible fixed assets 2.2 0.9Purchases of tangible fixed assets (20.1) (16.3)Purchases of intangible assets (0.6) (0.3)Free cash flow 5.1 2.2
Net debt increased from £62.4m to £96.7m largely due to thepurchase of the two aerospace businesses.
Revenue Group revenue increased by £49.3m (14.6%) to £387.9m (2005 –£338.6m) with the two aerospace acquisitions responsible for £18.8mof the increase. If the effect of the acquisitions and the small adverseyear-on-year exchange effect (£2.0m) are excluded, then underlyingrevenue grew by 9.7% on a constant currency basis. In 2006, 57% of Group sales originated from North America, 14% from the UnitedKingdom, 20% from the rest of Europe and 9% from the rest of the World.
Operating profit Group operating profit increased by 25.0% to £24.5m (2005 – £19.6m).Adjusted operating profit, that before loss on sale of fixed assets of£0.4m (2005 – £0.2m) and amortisation of intangible assets arising on acquisition of £1.3m (2005 – £nil), increased by £6.4m (32.3%) to £26.2m (2005 – £19.8m). If the effects of the acquisitions (£3.8m profit) and foreign currency (£0.3m adverse impact) are excluded then underlying adjusted operating profit increased by 14.9% on a constant currency basis.
Finance costs Finance costs, net of investment income of £0.9m (2005 – £1.3m),increased to £6.4m (2005 – £5.0m) as global interest rates rose,particularly in North America and the UK, and the Group’s debt levelincreased as a result of the two acquisitions undertaken in the year.
Profit before tax Adjusted profit before tax increased by 33.8% to £19.8m (2005 –£14.8m). Reported profit before tax increased to £18.1m (2005 –£14.6m).
Tax chargeThe total tax charge increased to £2.9m (2005 – £2.5m) as the Group’staxable profits increased. If the tax benefits arising from the loss on sale of fixed assets and amortisation of intangible assets from acquisitionstotalling £0.6m (2005 – £nil) are added back, then the underlying taxcharge of £3.5m (2005 – £2.5m) represents an underlying rate of17.7% (2005 – 16.9%) on the adjusted profit before tax of £19.8m(2005 – £14.8m).
Earnings per share 15 million ordinary shares were issued in January 2006, by way of a share placing, to help fund the acquisition of Sterling Machine, and nearly 65 million ordinary shares were issued in October 2006,through a 1 for 5 rights issue, to help fund the acquisition of AMT. As a consequence, the weighted average number of shares for thepurposes of calculating undiluted earnings per share in 2006 was349.8 million (2005 – 322.2 million restated to reflect the bonuselement of the rights issue). Having taken this into account, adjusted
earnings per share increased by 21.7% to 4.65p (2005 – 3.82prestated for the bonus element of the rights issue). Basic earnings per share increased to 4.35p (2005 – 3.75p restated).
DividendsA final dividend of 1.381p per share is proposed for 2006. This wouldbring the full year dividend to 2.000p per share, which would representa 5.0% increase over the prior year’s 1.905p per share as restated forthe bonus element of the rights issue.
For ease of reference, the reported and restated dividends for 2006 and 2005, together with their costs, are set out in the table below.
2006 2005Restated Reported Restated Reported
Pence per shareInterim 0.619p 0.650p 0.619p 0.650pFinal (2006 proposed) 1.381p n/a 1.286p 1.350p
Total 2.000p 1.905p+5.0%
CostInterim £2.1m £2.0mFinal (2006 proposed) £5.4m £4.4m
Total £7.5m £6.4m
+17.2%
Research and development and capital expenditureThe Group spent £8.5m on research and development during 2006(2005 – £8.3m). In addition, £20.7m (2005 – £16.6m) was invested in capital expenditure mainly to bring the new heavy duty diesel engineproducts into production in North America and, as build rates for civilaircraft continued to rise, to increase machining capacity and capability at a number of the Group’s aerospace operations.
Capital structureThe Group’s consolidated balance sheet at 31 December 2006 may besummarised as follows:
NetAssets Liabilities assets
£m £m £mProperty, plant and equipment 87.6 – 87.6Goodwill and intangible assets 126.1 – 126.1Current assets and liabilities 139.8 (92.3) 47.5Other non-current assets and liabilities 3.8 (3.7) 0.1Post-retirement obligations – (37.5) (37.5)Total before net debt 357.3 (133.5) 223.8Net debt 8.2 (104.9) (96.7)Total at 31 December 2006 365.5 (238.4) 127.1Total at 31 December 2005 282.5 (190.2) 92.3
Net assets increased by 37.7% in the year to £127.1m (2005 – £92.3m)and net assets per share by 9.4% to 32.6p (2005 – 29.8p). There were 389.9 million ordinary shares in issue at the end of 2006(2005 – 309.3 million)
Senior plc Annual Report 200610
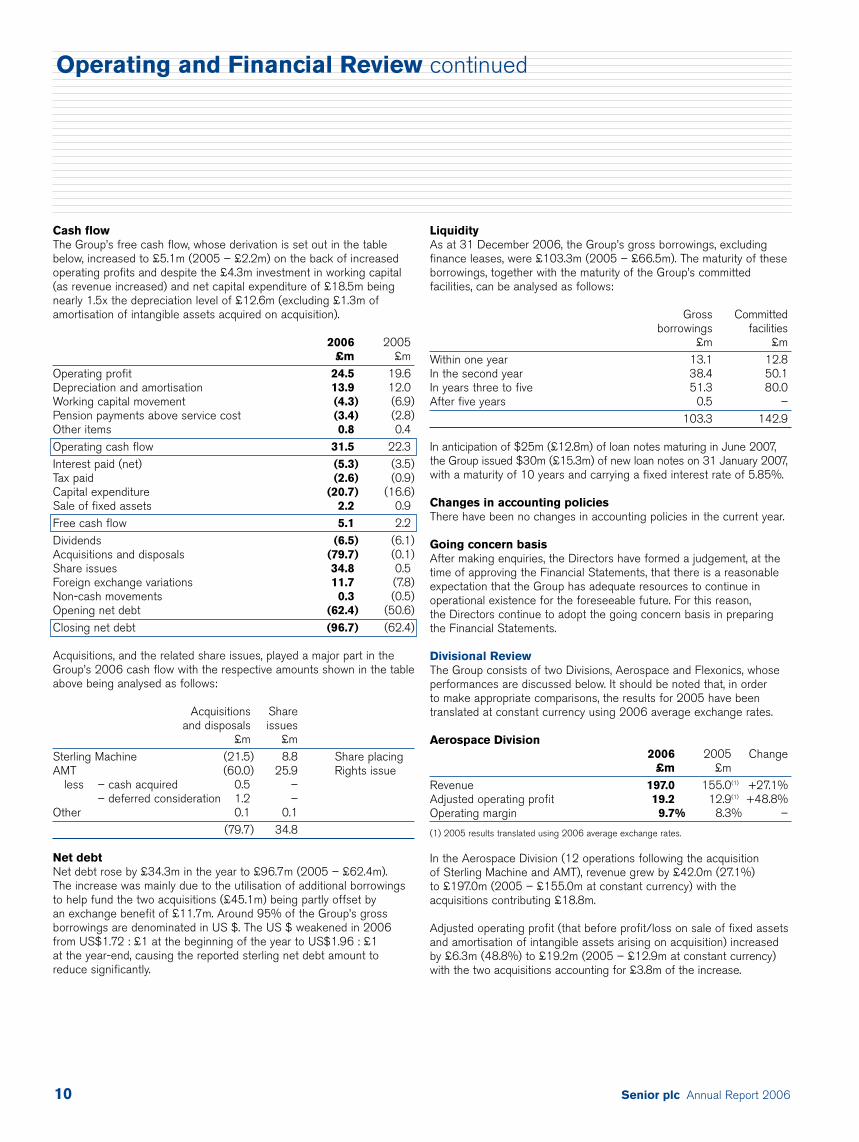
Cash flow The Group’s free cash flow, whose derivation is set out in the tablebelow, increased to £5.1m (2005 – £2.2m) on the back of increasedoperating profits and despite the £4.3m investment in working capital(as revenue increased) and net capital expenditure of £18.5m beingnearly 1.5x the depreciation level of £12.6m (excluding £1.3m ofamortisation of intangible assets acquired on acquisition).
2006 2005£m £m
Operating profit 24.5 19.6Depreciation and amortisation 13.9 12.0Working capital movement (4.3) (6.9)Pension payments above service cost (3.4) (2.8)Other items 0.8 0.4Operating cash flow 31.5 22.3Interest paid (net) (5.3) (3.5)Tax paid (2.6) (0.9)Capital expenditure (20.7) (16.6)Sale of fixed assets 2.2 0.9Free cash flow 5.1 2.2Dividends (6.5) (6.1)Acquisitions and disposals (79.7) (0.1)Share issues 34.8 0.5Foreign exchange variations 11.7 (7.8)Non-cash movements 0.3 (0.5)Opening net debt (62.4) (50.6)Closing net debt (96.7) (62.4)
Acquisitions, and the related share issues, played a major part in theGroup’s 2006 cash flow with the respective amounts shown in the tableabove being analysed as follows:
Acquisitions Shareand disposals issues
£m £mSterling Machine (21.5) 8.8 Share placingAMT (60.0) 25.9 Rights issue
less – cash acquired 0.5 –– deferred consideration 1.2 –
Other 0.1 0.1(79.7) 34.8
Net debtNet debt rose by £34.3m in the year to £96.7m (2005 – £62.4m). The increase was mainly due to the utilisation of additional borrowingsto help fund the two acquisitions (£45.1m) being partly offset by an exchange benefit of £11.7m. Around 95% of the Group’s grossborrowings are denominated in US $. The US $ weakened in 2006from US$1.72 : £1 at the beginning of the year to US$1.96 : £1 at the year-end, causing the reported sterling net debt amount toreduce significantly.
LiquidityAs at 31 December 2006, the Group’s gross borrowings, excludingfinance leases, were £103.3m (2005 – £66.5m). The maturity of theseborrowings, together with the maturity of the Group’s committedfacilities, can be analysed as follows:
Gross Committedborrowings facilities
£m £mWithin one year 13.1 12.8In the second year 38.4 50.1In years three to five 51.3 80.0After five years 0.5 –
103.3 142.9
In anticipation of $25m (£12.8m) of loan notes maturing in June 2007,the Group issued $30m (£15.3m) of new loan notes on 31 January 2007,with a maturity of 10 years and carrying a fixed interest rate of 5.85%.
Changes in accounting policiesThere have been no changes in accounting policies in the current year.
Going concern basisAfter making enquiries, the Directors have formed a judgement, at thetime of approving the Financial Statements, that there is a reasonableexpectation that the Group has adequate resources to continue inoperational existence for the foreseeable future. For this reason, the Directors continue to adopt the going concern basis in preparingthe Financial Statements.
Divisional ReviewThe Group consists of two Divisions, Aerospace and Flexonics, whoseperformances are discussed below. It should be noted that, in order to make appropriate comparisons, the results for 2005 have beentranslated at constant currency using 2006 average exchange rates.
Aerospace Division2006 2005 Change
£m £mRevenue 197.0 155.0(1) +27.1%Adjusted operating profit 19.2 12.9(1) +48.8%Operating margin 9.7% 8.3% –
(1) 2005 results translated using 2006 average exchange rates.
In the Aerospace Division (12 operations following the acquisition of Sterling Machine and AMT), revenue grew by £42.0m (27.1%) to £197.0m (2005 – £155.0m at constant currency) with theacquisitions contributing £18.8m.
Adjusted operating profit (that before profit/loss on sale of fixed assetsand amortisation of intangible assets arising on acquisition) increasedby £6.3m (48.8%) to £19.2m (2005 – £12.9m at constant currency)with the two acquisitions accounting for £3.8m of the increase.
Operating and Financial Review continued
Senior plc Annual Report 2006 11
The Division’s results benefited from the continuing strong growth in the build rate of civil aircraft, with the combined large commercial,regional and business jet markets accounting for 57% of 2006Divisional sales. The market for large commercial aircraft was particularlystrong, with Boeing and Airbus together delivering 25% more aircraft in 2006 (832) than in 2005 (668). Their order intakes were alsoextremely strong, at 2.2x delivery levels. Their combined order book of 4,988 aircraft at the year-end is 25% above the level at the start of 2006 (3,986 aircraft). The six year order books, at current deliveryrates, represent a very healthy picture for the future. Both Airbus andBoeing are forecasting to increase build rates further in the comingyears. Elsewhere, the regional jet market was weak, but the business jet market very strong, and the military market (27% of Divisional sales)was stable.
Flexonics Division2006 2005 Change
£m £m
Revenue 191.5 182.2(1) +5.1%Adjusted operating profit 11.8 10.9(1) +8.3%Operating margin 6.2% 6.0% –
(1) 2005 results translated using 2006 average exchange rates.
In the Flexonics Division, the 11 operations saw combined revenuegrow by £9.3m (5.1%) to £191.5m (2005 – £182.2m at constantcurrency), with strong energy markets but generally flat automotivemarkets. Whilst sales of the new heavy duty diesel engine productsbegan in the final months of the year, the volumes were not significant.
Adjusted operating profit for the Division increased by 8.3% to £11.8m (2005 – £10.9m at constant currency) as strong energymarkets and operational improvements more than offset the impact of flat automotive demand and the start up costs associated with the introduction of the diesel engine products in North America.
Automotive production levels in North America declined by 2.3% in 2006, to 16.00 million vehicles (2005 – 16.37 million), whereasWestern Europe saw a 2.1% increase to 18.37 million vehicles (2005 – 18.00 million). The outlook for 2007 is for continuing flatdemand, with further erosion of the sales of the “Big Three” (GeneralMotors, Ford and Daimler Chrysler) in North America. In 2006, they had 56.5% of the market (2005 – 59.6%). The outlook in Franceremains challenging.
However, overall prospects for the Flexonics Division remain good given strong energy markets, the continued industrialisation of Chinaand India, growing volumes in the European truck market and the fact that production of the new heavy duty diesel engine products inNorth America is now ramping up. The Group’s North American plant is expected to have total sales in excess of £20m in 2008 for its dieselfuel lines, diesel common rail and diesel exhaust gas recycling coolerproducts. Completion of the troublesome Wembley ducting contract in January 2007 should also enhance year-on-year profitability.
Outlook The commercial aerospace industry, representing 57% of the AerospaceDivision’s 2006 sales, continues to thrive. The most important sectorwithin this category is the large commercial sector, principally Boeing,Airbus, and the engine manufacturers GE and Rolls-Royce, and theirrespective supplier bases. Boeing and Airbus have together receivedorders for 3,891 aircraft in the last two years, against the 1,500 aircraftdelivered. This has resulted in their collective order book increasing from2,597 aircraft at the beginning of 2005 to 4,988 at the end of 2006 (a six year order book at 2006 delivery rates). As a consequence, theyhave been increasing their build rates (2006 saw a 25% increase indeliveries) and are forecasting further increases of around 10% perannum over the next two years. The business jet sector is seeing similarbuoyant market conditions to that of the large commercial sector, whilstthe regional jet market (typically 30 to 90 seat aircraft) is now stabilisingafter a few years in decline. The military/defence sector, 27% of 2006Aerospace Divisional sales, is healthy but stable.
In the Flexonics Division, the Group increased its sales of flexibleexhaust connectors (32% of 2006 Divisional sales), largely because itsBrazilian operation began production on a number of new programmes.The global market for this product is expected to stay competitive, not helped by increases in the price of stainless steel, with demand inNorth American and European markets remaining broadly unchanged.The industrial markets in which the Group operates, e.g. power, oil andgas, chemical processing and HVAC, are generally in a healthy conditionwith strong future growth anticipated for many of them. Industrialmarkets represented 43% of the Flexonics Division’s 2006 sales.
It is anticipated that the strong commercial aerospace market, healthyindustrial markets and stable automotive markets, will provide a strongfoundation for the Group’s future growth. Three other areas in particularfurther underpin the Board’s confidence as to the positive future for the Group: the ramping up, through 2007, of the North American heavyduty diesel engine products (2008 is expected to see sales in excessof £20m); full year contributions from the two aerospace acquisitions(AMT was owned for only two months in 2006 and Sterling Machine for 11); and the highly successful Boeing 787 (“Dreamliner”) going into production in late 2007 (the Group has significant content on this aircraft and its engines).
However, in addition to the impact of the weakened US $ and higherstainless steel prices, there are certain risks and uncertainties inherentin the Group’s business that may affect future performance. These arediscussed below.
Risks and Uncertainties There are a number of potential risks and uncertainties, which could havea material impact on the Group’s future performance, and could causeactual results to differ materially from expected and historical results.
Senior plc Annual Report 200612
CompetitorsThe Group operates in competitive market sectors. The aerospacemarket is principally located in North America and Europe. This iswhere the Group’s aerospace operations are all situated, so enablingengineering support to be readily given to its customers. Whilst theindustry is consolidating, the supplier base remains fragmented and the actions of a single competitor are unlikely to have a material impact on the results of the Group.
In the Flexonics Division, the industrial markets in which the Groupoperates (43% of 2006 Divisional sales) are diverse both geographicallyand in nature with engineering skills, technical qualifications and servicelevels being the key to success for most of them. Again, the marketsare competitive, but no single competitor represents a material threat to the Group. In the automotive markets, products like the new NorthAmerican heavy duty diesel engine products are similar in nature to those of aerospace, in that engineering support and processengineering are very important to the customers’ choice of supplier.However, there are other automotive products where competition is fiercer and price more the defining factor. Where this is the case, the Group is increasingly manufacturing these products in its lowercost operations in the Czech Republic, South Africa, Brazil and India,rather than in its North American and Western European operations.
Markets and customersOver half of the Group’s sales are derived from the aerospace marketwith the majority being attributed to the commercial aircraft sector.Whilst these markets are expected to remain buoyant for a number of years, should this not be the case the Group’s financial performancewould be adversely affected, as was the case in 2001 following theevents of “9/11”. The Group has a relatively balanced portfolio ofaerospace customers, nearly all of whom are financially strong, with thelargest representing some 5% of 2006 Group sales. The immediateand total loss of such a customer is considered to be highly improbablegiven that many parts are typically supplied from a number of Senior’soperations to a range of customer locations, with many products onlong-term agreements.
The industrial markets are diverse, fragmented and generally healthy,with the largest single customer representing less than one half of one percent of 2006 Group sales. However, the financial health ofmuch of the North American automotive industry is currently fragile. In the event that one of the larger automotive manufacturers were to seek protection from its creditors (known as going into Chapter 11in the USA) then the Group would be unlikely to recover all, if any, ofthe amounts owed to it. The largest manufacturer accounted for around7% of 2006 Group sales, both to the manufacturer directly and/or toits supplier base. However, production of the vehicles, and hence salesof the Group’s products, would probably continue, albeit at a lower level,so rendering the impact to be of a one-off rather than ongoing nature.The Group has a strong balance sheet and insurance coverage for manyof its North American automotive customers as mitigation against theeffects of such an event occurring.
ManufacturingThe Group’s manufacturing facilities could be disrupted for reasonsbeyond the Group’s control, such as fire, workforce actions and other issues. As such, the Group prepares recovery plans for the most likely situations so that business continuity procedures are in place and staff are appropriately trained to implement them, should these situations occur.
Due to the rapid advancement in manufacturing technology, facilitiesmay become outdated, affecting efficiency and product quality, which inturn may have a detrimental impact on revenue, cost of sales and profitmargins. Consequently, the Group continues to invest in new manufacturingequipment and processes in order that it remains competitive in itschosen markets.
EnvironmentalThe Group’s operations, like those of other companies engaged insimilar businesses, require the handling, use, storage and disposal of certain regulated materials. As a result, the Group is subject to the requirements of environmental and occupational health and safetylaws and regulations in a number of jurisdictions. These regulate suchmatters as waste water, storm water, solid and hazardous waste materials,and air quality. Under such laws and regulations, the Group may beliable for, amongst other things, the cost of investigating and remediatingcontamination (regardless of fault) and for fines and penalties for non-compliance. The Group’s operations generally do not raise significantenvironmental risks, but the Group does use certain hazardous materialsin its business.
Foreign exchange and interest ratesAlthough the Group reports in Pounds Sterling, in 2006 it derivedapproximately 86% of its revenue from businesses located outside the United Kingdom, of which 57% related to operations located inNorth America. Furthermore at the end of 2006, over 95% of theGroup’s gross borrowings were denominated in US Dollars. Fluctuationsin the value of the US Dollar (and to a lesser extent other currencies) in relation to the Pound have had, and may continue to have, a significantimpact on the results of the Group’s operations when reported in PoundsSterling. Although the Group seeks to match its foreign currency assetsand liabilities, currency fluctuations could still have a significant impacton the Group’s consolidated balance sheet, particularly total shareholders’funds, when the financial statements of its overseas subsidiaries are translated into Pounds Sterling. The Group also has a number of transaction-related foreign currency exposures, particularly the Euro to South African Rand. Although the Group seeks to hedge such exposures for 15 months forward, there is the risk that currencymovements may have an adverse, or indeed positive, effect on theresults of the Group’s operations.
The majority of the Group’s borrowings are subject to fixed interestrates. However, a significant element has variable rates, and consequentlyfluctuations in interest rates may have an effect on the results of theGroup’s operations.
Operating and Financial Review continued
Senior plc Annual Report 2006 13
These risks are managed by a centralised treasury department whichreports to the Group Finance Director. It operates under the guidanceof the Treasury Committee which meets quarterly and acts according to the laid-down objectives, policies and authority levels approved bythe Board.
Defined benefit pension planThe Group operates a number of defined benefit pension plans, withthe largest being a UK plan, as well as a number of geographicallybased defined contribution and government sponsored arrangements.
The primary liability for funding the UK defined benefit pension planrests with the participating employer. By virtue of the Pensions Act2004, there may be risks for the Group in relation to this pension plan.These are largely generic risks associated with the operation of UKdefined benefit pension plans (including the imposition of more onerousemployer contribution/funding requirements by the Pensions Regulator,the requirement to fund the winding-up of pension plans by trustees on a “buy-out basis” and the provision of funding guarantees whererequired by the Pensions Regulator). Should the Pensions Regulatorimpose any of these requirements, they could have an adverse effecton the results of the Group’s operations.
Resources Employees The key resource of the Group is its employees, who have extensiveknowledge of the Group’s key markets, customers, product technologyand manufacturing processes. The average number of employees in the Group during 2006 was 5,202. Of these 4,444 were in production-related roles, 53 in distribution, 291 in sales and 414 in administration.Senior is a global group operating in 11 countries. At the end of 2006,the Group employed a total of 5,606 people, 357 in the two recentlyacquired businesses, with 49% located in North America, 16% in theUnited Kingdom, 21% in the rest of Europe and 14% in the rest of the World.
Manufacturing technologyA key strength of the Group is its manufacturing technology andproduction processes, which help maximise production efficiency and product quality. This in turn maintains and enhances the Group’sreputation for delivering quality added-value products to its customerson time and at a competitive price. During 2006, the Group spent£20.7m (2005 – £16.6m) on capital expenditure to add to the Group’s manufacturing capability, as well as its production capacity.
Corporate Responsibility The policy of the Board is to enhance shareholder value in an ethical andsocially responsible manner which helps to preserve health, safety andthe environment. Two of the Group’s six KPIs, those relating to carbondioxide emissions and lost time injuries, are applicable to this subjectarea. The Group’s corporate and social responsibility principles, goals and performance indices are discussed in detail in the separate“Corporate Social Responsibility Report” contained within this Annual Report.
Senior plc Annual Report 200614
This Corporate Governance Report describes the manner in which the Company has applied the Principles of Good Governance set out in Section 1 of the Combined Code on Corporate Governance andwhether or not it has complied with the Code provisions. In July 2003,the Financial Reporting Council (“FRC”) issued the “Combined Code on Corporate Governance” known as the “2003 FRC Code”, in responseto the Higgs Review on Non-executive Directors and the Smith Reviewon Audit Committees.
Statement of Compliance with the Combined CodeIn June 2006, the FRC issued a revised Combined Code which supersedesand replaces the 2003 FRC Code for financial years beginning on or after 1 November 2006. The Board considered that it would bebeneficial to take advantage of the amendment to the 2003 FRC Coderestriction on the Chairman serving on the Remuneration Committee, in order to enable him to do so. The Board considered J R Kerr-Muir to be independent on appointment as Chairman.
The Company, throughout the year, has been in compliance with theprovisions set out in Section 1 of the 2003 FRC Code, except thatJ R Kerr-Muir was re-appointed to the Remuneration Committee on 1 August 2006 (FRC Code Provision B.2.1).
Application of the Principles of the 2003 FRC CodeThe Principles of Good Corporate Governance are detailed in the 2003 FRC Code under four areas which have each been reviewed by the Directors and then commented upon below:
a) DirectorsThe Board is structured under a non-executive Chairman, and includesthree executive Directors, and two other non-executive independentDirectors, who were selected for appointment because of their wideindustrial and commercial experience. In addition, there is a GroupExecutive Committee, chaired by the Group Chief Executive, which iscomprised of the executive Directors and other key executives withinthe Group. Brief details of the Board are included on page 4.
The Directors consider that there is in place an effective Board whichleads and controls the Group, with clear divisions of responsibilitybetween running the Board and running the Group’s businesses. The Board is responsible for the strategic decisions regarding theGroup, including the setting of commercial strategy and approval ofGroup budgets and financial statements. It also approves significantfinancial and contractual commitments made by the Group. The Board’sTerms of Reference more fully describe the responsibilities of theBoard, and may be found on the Company’s website.
The Board delegates certain of its responsibilities to the Audit,Remuneration, Nominations, and Health, Safety & Environment (“HSE”)Committees. The Group Chief Executive, together with the GroupExecutive Committee, is responsible for the implementation of thedecisions made by the Board, and for the day-to-day conduct of the Group’s operations.
The Board meets formally on a regular basis (11 times in 2006); and in addition there were three meetings of the Audit Committee in 2006, together with five meetings of the Remuneration Committee, two meetings of the Nominations Committee and three meetings of the HSE Committee during the year. There was full attendance at everyBoard meeting and Committee of the Board during the year. OtherCommittees are appointed by the Board to deal with treasury mattersand specific issues such as acquisitions and disposals. The minutesarising from the Committee Meetings are available to the Board.
Procedures are in place to ensure that the Directors are properlybriefed so that the decisions taken by the Board are based on the fullest available information. At every Board Meeting there arereviews of operational, financial and administrative matters. Health,safety & environmental performance is reviewed by the Board on a regular, and at least quarterly, basis; while social and ethical issues,agreement of budgets and levels of insurance cover are reviewedwhenever appropriate.
There is a procedure by which all Directors can obtain independentprofessional advice at the Company’s expense in furtherance of theirduties, if required.
Nominations CommitteeThe Nominations Committee leads the process for Board appointments,and supervises management development and succession plans. It alsomakes recommendations to the Board on all new Board appointments.The Committee, which consists entirely of non-executive Directors, is chaired by J R Kerr-Muir, and its composition is shown on page 4. Its Terms of Reference may be found on the Company’s website.
The appointment of new non-executive Directors to the Board is controlled by the Committee, assisted by appropriate externalrecruitment consultants. In conjunction with the external consultant,consideration is given to the role and the capabilities required for aparticular appointment. Based on agreed criteria, the consultant thenproduces a shortlist of candidates. The Committee members interviewthese candidates, then present their recommendation to the Board.Consideration is also given to the number of other posts held by the candidates, and their ability to devote sufficient time to dischargetheir duty as a non-executive Director. J R Kerr-Muir has advised the Company that he will be retiring from the Board during 2007. The Nominations Committee recommended that M Clark, the SeniorIndependent Director, be appointed non-executive Chairman andI F R Much be appointed the Senior Independent Director, uponJ R Kerr-Muir’s retirement. In order to maintain the minimum requirednumber of non-executive Directors, a new non-executive Director will be appointed prior to J R Kerr-Muir’s retirement.
Corporate Governance Report
Senior plc Annual Report 2006 15
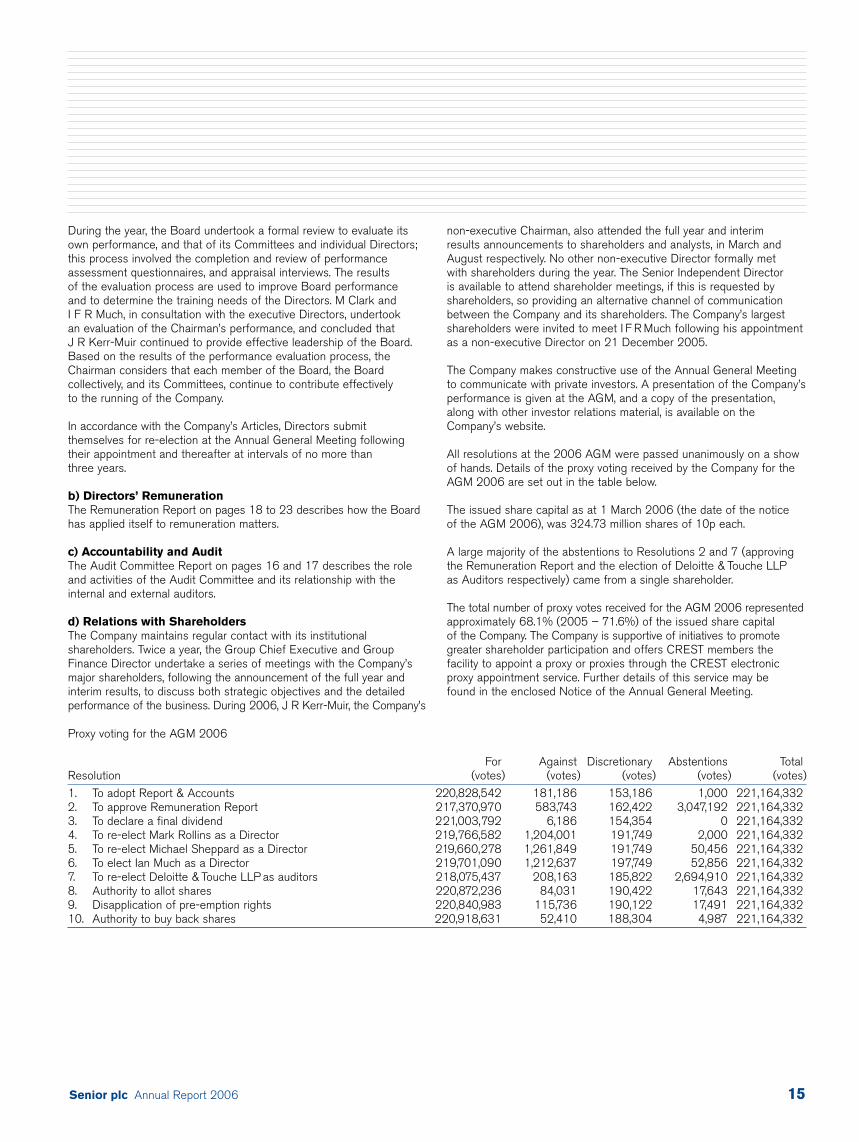
Proxy voting for the AGM 2006
For Against Discretionary Abstentions TotalResolution (votes) (votes) (votes) (votes) (votes)
1. To adopt Report & Accounts 220,828,542 181,186 153,186 1,000 221,164,3322. To approve Remuneration Report 217,370,970 583,743 162,422 3,047,192 221,164,3323. To declare a final dividend 221,003,792 6,186 154,354 0 221,164,3324. To re-elect Mark Rollins as a Director 219,766,582 1,204,001 191,749 2,000 221,164,3325. To re-elect Michael Sheppard as a Director 219,660,278 1,261,849 191,749 50,456 221,164,3326. To elect Ian Much as a Director 219,701,090 1,212,637 197,749 52,856 221,164,3327. To re-elect Deloitte & Touche LLP as auditors 218,075,437 208,163 185,822 2,694,910 221,164,3328. Authority to allot shares 220,872,236 84,031 190,422 17,643 221,164,3329. Disapplication of pre-emption rights 220,840,983 115,736 190,122 17,491 221,164,33210. Authority to buy back shares 220,918,631 52,410 188,304 4,987 221,164,332
During the year, the Board undertook a formal review to evaluate itsown performance, and that of its Committees and individual Directors;this process involved the completion and review of performanceassessment questionnaires, and appraisal interviews. The results of the evaluation process are used to improve Board performance and to determine the training needs of the Directors. M Clark andI F R Much, in consultation with the executive Directors, undertook an evaluation of the Chairman’s performance, and concluded thatJ R Kerr-Muir continued to provide effective leadership of the Board.Based on the results of the performance evaluation process, theChairman considers that each member of the Board, the Boardcollectively, and its Committees, continue to contribute effectively to the running of the Company.
In accordance with the Company’s Articles, Directors submit themselves for re-election at the Annual General Meeting followingtheir appointment and thereafter at intervals of no more than three years.
b) Directors’ RemunerationThe Remuneration Report on pages 18 to 23 describes how the Boardhas applied itself to remuneration matters.
c) Accountability and AuditThe Audit Committee Report on pages 16 and 17 describes the roleand activities of the Audit Committee and its relationship with theinternal and external auditors.
d) Relations with ShareholdersThe Company maintains regular contact with its institutionalshareholders. Twice a year, the Group Chief Executive and GroupFinance Director undertake a series of meetings with the Company’s major shareholders, following the announcement of the full year andinterim results, to discuss both strategic objectives and the detailedperformance of the business. During 2006, J R Kerr-Muir, the Company’s
non-executive Chairman, also attended the full year and interim results announcements to shareholders and analysts, in March andAugust respectively. No other non-executive Director formally met with shareholders during the year. The Senior Independent Director is available to attend shareholder meetings, if this is requested byshareholders, so providing an alternative channel of communicationbetween the Company and its shareholders. The Company’s largestshareholders were invited to meet I F R Much following his appointmentas a non-executive Director on 21 December 2005.
The Company makes constructive use of the Annual General Meetingto communicate with private investors. A presentation of the Company’sperformance is given at the AGM, and a copy of the presentation, along with other investor relations material, is available on theCompany’s website.
All resolutions at the 2006 AGM were passed unanimously on a showof hands. Details of the proxy voting received by the Company for theAGM 2006 are set out in the table below.
The issued share capital as at 1 March 2006 (the date of the notice of the AGM 2006), was 324.73 million shares of 10p each.
A large majority of the abstentions to Resolutions 2 and 7 (approvingthe Remuneration Report and the election of Deloitte & Touche LLPas Auditors respectively) came from a single shareholder.
The total number of proxy votes received for the AGM 2006 representedapproximately 68.1% (2005 – 71.6%) of the issued share capital of the Company. The Company is supportive of initiatives to promotegreater shareholder participation and offers CREST members thefacility to appoint a proxy or proxies through the CREST electronicproxy appointment service. Further details of this service may be found in the enclosed Notice of the Annual General Meeting.
Senior plc Annual Report 200616
Summary of the Role of the Audit CommitteeThe Audit Committee is appointed by the Board from the non-executiveDirectors. The duties of the Committee include:
• considering and making recommendations to the Board regarding the appointment of the external auditors, the audit fee, and anyquestions of the resignation or dismissal of the external auditors;
• considering (if appropriate) the degree of any work undertaken by the external auditors for the Group other than the statutory audit;
• reviewing the half-year and annual financial statements beforesubmission to the Board and to report on them to the Board;
• discussing with the external auditors problems and reservations arising from the interim and final audits and any other matters the external auditors may raise;
• reviewing the internal audit programme, to receive periodical reports from the Group Finance Director, to consider the majorfindings of internal audit investigations and management’s response,to ensure co-ordination between the Group and the external auditorsand to ensure that the internal audit function is adequately resourcedand has appropriate standing within the Group;
• reviewing the effectiveness of internal control systems and to reviewthe external auditors’ management letter and management’s response;
• reviewing the effectiveness of the Risk Management Process ensuringthat the process is active, dynamic and focused on the achievement of strategy at both Group and operational levels, and to ensure keybusiness risks and other issues arising from the process are effectivelyidentified and communicated to the Board; and
• considering any other topics specifically delegated to the Committeeby the Board from time to time.
The Audit Committee is required to report its findings to the Board,identify any matters in respect of which it considers that action orimprovement is needed, and to make recommendations as to the steps to be taken.
The Audit Committee’s Terms of Reference may be found on theCompany’s website.
Composition of the Audit CommitteeThe members of the Audit Committee, both of which are independentnon-executive Directors, are:
Date ofappointment Qualification
M Clark 1 February 2001 Both members of the Committee I F R Much 21 December 2005 have significant commercial and
financial experience at a seniormanagement level. M Clark is a Certified Accountant and haspreviously acted as FinanceDirector at a number of majorbusinesses.
M Clark is to become non-executive Chairman upon the retirement of J R Kerr-Muir during 2007. It is intended that a new non-executiveDirector will replace M Clark on the Audit Committee prior to M Clark’sappointment as Chairman. Two members constitute a quorum for the Committee.
The Board expects the Audit Committee members to have anunderstanding of:
• the principles of, contents of, and developments in financial reportingincluding the applicable accounting standards and statements ofrecommended practice;
• key aspects of the Group’s operations including corporate policies,group financing, products and systems of internal control;
• matters that influence or distort the presentation of accounts and key figures;
• the principles of, and developments in, company law, sector-specificlaws and other relevant corporate legislation;
• the role of internal and external auditing and risk management; and• the regulatory framework for the Group’s businesses.
MeetingsThe Audit Committee met three times during the year and has anagenda linked to events in the Group’s financial calendar. The agendais predominantly cyclical, although each Audit Committee member hasthe right to require reports on matters of interest in addition to thecyclical items.
The Audit Committee invites the non-executive Chairman, Group ChiefExecutive, Group Finance Director, Group Financial Controller, GroupInternal Auditor, and senior representatives of the external auditors toattend all of its meetings, although it reserves the right to require any of these individuals to withdraw at any time.
The Audit Committee meets the external auditors at least twice a yearwithout the executive Directors being present.
Overview of the Actions Taken by the Audit Committee toDischarge its DutiesDuring the year, the Audit Committee has:
• reviewed the Financial Statements in the Annual Report 2005, theInterim Report issued in August 2006, as well as formal announcementsrelating to the Group’s financial position. As part of this review, the Committee received a report from the external auditors on theiraudit of the Annual Report and review of the Interim Report;
• reviewed the effectiveness of the Group’s internal controls anddisclosures made in the Annual Report;
• reviewed and agreed the scope of the audit work to be undertaken by the external auditors;
• agreed the fees to be paid to the external auditors for their audit of the 2006 Accounts and review of the Interim Report;
• reviewed its own effectiveness;• agreed a programme of work for the Group Internal Auditor;• undertaken an evaluation of the performance of the external auditors;
and• received reports from the Group Internal Auditor on the work he
has undertaken and the management responses to proposals made in his audit reports during the year.
External AuditorsThe Audit Committee is responsible for the development,implementation and monitoring of the Group’s policy on external audit.The Audit Committee is responsible for monitoring the independence,objectivity and compliance with regulatory requirements.
Audit Committee Report
Senior plc Annual Report 2006 17
Whilst the Company does not have a policy of subjecting its externalauditors to a regular fixed-term rotation, the Committee remainscognisant of the importance of maintaining the objectivity of theCompany’s external auditors.
The Audit Committee reviews the scope, cost and timing of the work of the external auditors, and acts to ensure their findings areappropriately implemented. The Committee also reviews the level and type of non-audit work carried out by the Company’s externalauditors. In 2006, £0.7m (2005 – £0.2m) was paid in fees to theexternal auditors relating to non-audit work, for advice in relation to the two acquisitions made by the Group during the year, and for tax compliance. The Committee considered it was beneficial to retainDeloitte & Touche LLP for this work, because of their expertise in this area and knowledge of the Group. However, the Committee will continue to keep the nature and extent of such services underreview, in order to balance the maintenance of objectivity and value for money.
To fulfil its responsibility regarding the independence of the externalauditors, the Audit Committee reviewed:
• the changes in key external audit staff; the audit partner rotated at the end of 2005 and a new senior audit manager was appointedduring 2006;
• a report from the external auditors describing their arrangements toidentify, report and manage any conflicts of interest and to maintaintheir independence; and
• the overall extent of non-audit services provided by the external auditors.
To assess the effectiveness of the external auditors, the Committeereviewed the external auditors’ performance during the year and theirfulfilment of the agreed audit plan.
The Audit Committee is satisfied with the effectiveness and independenceof the external auditors.
As a consequence of its satisfaction with the results of the activities of the external auditors, the Committee has recommended to the Boardthat the external auditors are re-appointed.
Internal ControlThe Company has a well-established and ongoing process, which wasin place for the full year and up to the date of the Financial Statements,for identifying, evaluating and managing significant risks, including non-financial risks, faced by the Group. This process is regularly reviewedby the Board and has been further improved during the year. The processcontinues to accord with the Turnbull guidance on internal control.
Prior to any acquisitions, the Company undertakes a due diligencereview of the business to be acquired. Post acquisition, work is thenundertaken to bring the control systems and procedures of the acquiredbusiness in line with Group standards.
Information on the Group’s significant risks, together with the relevantcontrol and monitoring procedures, is reviewed for completeness andaccuracy by the Group’s management committees. This information ispresented to the Board, for it to assess the effectiveness of the systemof internal control. Whilst the Board acknowledges its overall responsibilityfor internal control, it believes strongly that senior management within
the Group’s operating businesses should contribute in a substantial way,and this has been built into the process.
In carrying out its review of the effectiveness of internal control in the Group, the Board takes into consideration the following keyfeatures of the risk management process and system of internal control:
• senior management of each business has spent time identifying and assessing business unit and Group objectives, key issues,opportunities and controls. This assessment encompassed operational,compliance, financial and business risks and is updated on an ongoingbasis. A risk assessment has similarly been prepared for the Groupcovering central functions and strategic risks;
• a detailed system of budgeting, reporting and forecasting for theGroup’s operations is in place; this is monitored, both locally andcentrally, through a review of monthly management information;
• the Group has expanded the remit of the Internal Audit function,whose audit plan, which includes a cyclical programme of visits to all Group operations, is reviewed, updated and approved by the Committee. The conclusions from the function’s work are reported to the Committee, the Group Chief Executive and the Group Finance Director;
• the Group Internal Audit function also co-ordinates semi-annualFinancial Integrity Declarations and self-assessment questionnaireswhich are applied on a cyclical basis and subjected to review. Theresults of these reviews and internal audit visits are reported to theAudit Committee, along with those from the external auditors; and
• there is in place a formal annual risk management sign-off process for senior management in each of the business units. This is operatedin order to ensure that, as far as possible, the controls and safeguardsare being operated in line with established procedures and standards.
The whole risk management process is subject to review twice a yearby the Audit Committee, and strengthened as appropriate. Steps aretaken to embed internal controls and risk management further into the operations of the business, and to deal with areas of improvementwhich come to management’s and the Board’s attention. The Board is responsible for the effectiveness of the Group’s system of internalcontrol and for the review of its effectiveness. Such a system is designedto manage, rather than to eliminate, the risk of failure to achieve theGroup’s objectives, and can only provide reasonable but not absoluteassurance against misstatement or loss.
OverviewAs a result of its work during the year, the Audit Committee has concludedthat it has acted in accordance with its terms of reference and hasensured the independence and objectivity of the external auditors. The Chairman of the Audit Committee will be available at the AnnualGeneral Meeting 2007 to answer any questions about the work of the Committee.
ApprovalThis report was approved by the Audit Committee and signed on itsbehalf by:
M ClarkChairman of the Audit Committee28 February 2007
Senior plc Annual Report 200618
The Directors present their Remuneration Report for the year ended31 December 2006 in accordance with Schedule 7A of the CompaniesAct 1985 and the relevant provisions of the Listing Rules of the FinancialServices Authority. The report also describes how the Board has appliedthe Principles of Good Governance relating to Directors’ Remuneration.
The Companies Act 1985 (“the Act”) requires the external auditors toreport to the Company’s members on certain parts of the RemunerationReport and to state whether in their opinion those parts of the report have been properly prepared in accordance with the Act. The Remuneration Report has therefore been divided into separatesections for audited and unaudited information.
Unaudited InformationComposition of the Remuneration CommitteeThe Remuneration Committee consists entirely of non-executiveDirectors. I F R Much (Chairman) and M Clark were members of the Committee throughout the year. J R Kerr-Muir was re-appointed to the Remuneration Committee on 1 August 2006.
Role of the Remuneration CommitteeThe primary role of the Committee is to consider and makerecommendations to the Board concerning the remuneration packagesand conditions of service of the executive Directors and approximately90 other senior managers. The terms of reference of the RemunerationCommittee may be found on the Company’s website. During thefinancial year, the Committee met five times. Details of Directors’attendance at these meetings are disclosed on page 4.
Advisers to the Remuneration CommitteeAll advisers to the Remuneration Committee are appointed andinstructed by the Committee. During the year, the Committee wasadvised by New Bridge Street Consultants in relation to a review of executive Directors’ and senior managers’ remuneration, by Slaughter& May in relation to the adoption of the Senior plc 2006 SavingsRelated Share Option Scheme, and by the Group Company Secretary.
Remuneration PolicyIn determining remuneration of the executive Directors, the Committeeseeks to maintain a competitive programme, which enables the Companyto attract and retain the highest calibre of executive. The performance-related elements of remuneration form a significant proportion of thetotal remuneration package of executive Directors, details of which are set out in paragraphs (c) and (d) below. They are designed to aligntheir interests with those of shareholders and to give such executiveDirectors incentives to perform at the highest levels.
The non-executive Directors do not participate in any pension, bonus,share incentive or other share option plans. Their remuneration reflectsboth the time given and the contribution made by them to the Company’saffairs, including membership or chairmanship of the Board or itsCommittees. The remuneration of the non-executive Directors is determinedby the Board of Directors. The non-executive Directors do not participatein any discussion or decisions relating to their own remuneration.
Before recommending proposals for Board approval, the RemunerationCommittee may seek advice from external remuneration consultants to ensure it is fully aware of comparative external remuneration practiceas well as legislative and regulatory developments. The services ofremuneration consultants were used in determining the 2007 salariesof executive Directors and senior managers.
a) Service AgreementsEach executive Director has a service agreement providing for a rolling period of notice of one year. There are no provisions in thoseagreements or otherwise for additional termination payments. Theservice agreements for G R Menzies, M Rollins and M Sheppard are dated 27 April 2000, 1 November 2000 and 4 February 2004,respectively. The agreements contain provisions requiring the relevantDirector to mitigate his loss in the event of termination. G R Menzies’agreement (the terms of which remain unchanged since his appointment)provides that in the event of a change of control of the Company, hehas the option to resign within three months of such change of controlwithout a duty to mitigate his loss.
The non-executive Directors do not have service agreements with the Company. J R Kerr-Muir was appointed Chairman with effect from 11 May 2001. His contract is terminable upon 12 months’ noticeby either party on or after the third anniversary. J R Kerr-Muir intends to retire from the Board during 2007. M Clark was appointed with effect from 1 February 2001 for an initial three year term, which wassubsequently renewed for further three year terms to 1 February 2010.I F R Much was appointed with effect from 21 December 2005 for aninitial three year term.
With prior approval of the Board, executive Directors may hold external non-executive directorships and retain any fees paid for these appointments. At the year-end, G R Menzies and M Rollins held one such position each. M Rollins has held his non-executivedirectorship from January 2006. In 2006, G R Menzies and M Rollinsreceived and retained non-executive directorship fees of £37,000 and£30,000 respectively.
b) Base SalariesIn setting the base salary of each Director, the Committee takes intoaccount the pay practice of other companies and the performance of that Director.
The Committee is also responsible for ratifying the salaries ofapproximately 90 senior managers and therefore is fully cognisant of pay levels in the Group when determining the pay of the executive Directors.
The base salaries in 2006 for the executive Directors for the year were as follows: G R Menzies – £323,000 (2005 – £313,500), M Rollins – £190,000 (2005 – £190,000), and M Sheppard –£165,800 (2005 – £156,100).
As a result of the review of the executive Directors’ remuneration, the Remuneration Committee recommended that the base salaries forthe executive Directors for 2007 should be as follows: G R Menzies –£340,000, M Rollins – £210,000, and M Sheppard – £166,700.
The 2006 fees for J R Kerr-Muir and M Clark increased by £6,000 each to £78,000 p.a. and £40,000 p.a. respectively; these being thefirst increases since 2002. I F R Much’s fee for 2006 was £33,000.The non-executive Directors’ fees for 2007 remain unchanged from 2006.
Remuneration Report
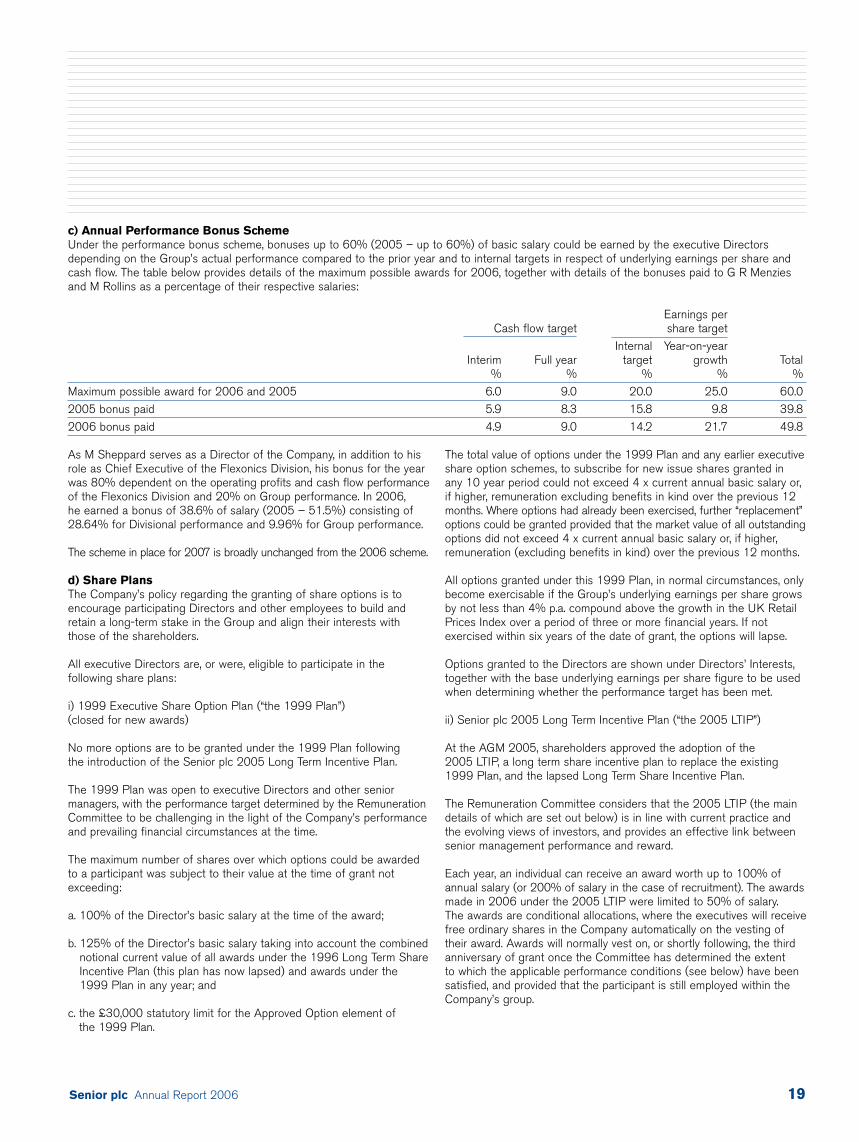
Senior plc Annual Report 2006 19
c) Annual Performance Bonus SchemeUnder the performance bonus scheme, bonuses up to 60% (2005 – up to 60%) of basic salary could be earned by the executive Directorsdepending on the Group’s actual performance compared to the prior year and to internal targets in respect of underlying earnings per share andcash flow. The table below provides details of the maximum possible awards for 2006, together with details of the bonuses paid to G R Menziesand M Rollins as a percentage of their respective salaries:
Earnings perCash flow target share target
Internal Year-on-yearInterim Full year target growth Total
% % % % %
Maximum possible award for 2006 and 2005 6.0 9.0 20.0 25.0 60.0
2005 bonus paid 5.9 8.3 15.8 9.8 39.8
2006 bonus paid 4.9 9.0 14.2 21.7 49.8
As M Sheppard serves as a Director of the Company, in addition to hisrole as Chief Executive of the Flexonics Division, his bonus for the yearwas 80% dependent on the operating profits and cash flow performanceof the Flexonics Division and 20% on Group performance. In 2006, he earned a bonus of 38.6% of salary (2005 – 51.5%) consisting of28.64% for Divisional performance and 9.96% for Group performance.
The scheme in place for 2007 is broadly unchanged from the 2006 scheme.
d) Share PlansThe Company’s policy regarding the granting of share options is toencourage participating Directors and other employees to build andretain a long-term stake in the Group and align their interests withthose of the shareholders.
All executive Directors are, or were, eligible to participate in thefollowing share plans:
i) 1999 Executive Share Option Plan (“the 1999 Plan”) (closed for new awards)
No more options are to be granted under the 1999 Plan following the introduction of the Senior plc 2005 Long Term Incentive Plan.
The 1999 Plan was open to executive Directors and other seniormanagers, with the performance target determined by the RemunerationCommittee to be challenging in the light of the Company’s performanceand prevailing financial circumstances at the time.
The maximum number of shares over which options could be awardedto a participant was subject to their value at the time of grant notexceeding:
a. 100% of the Director’s basic salary at the time of the award;
b. 125% of the Director’s basic salary taking into account the combinednotional current value of all awards under the 1996 Long Term ShareIncentive Plan (this plan has now lapsed) and awards under the 1999 Plan in any year; and
c. the £30,000 statutory limit for the Approved Option element of the 1999 Plan.
The total value of options under the 1999 Plan and any earlier executiveshare option schemes, to subscribe for new issue shares granted in any 10 year period could not exceed 4 x current annual basic salary or,if higher, remuneration excluding benefits in kind over the previous 12months. Where options had already been exercised, further “replacement”options could be granted provided that the market value of all outstandingoptions did not exceed 4 x current annual basic salary or, if higher,remuneration (excluding benefits in kind) over the previous 12 months.
All options granted under this 1999 Plan, in normal circumstances, onlybecome exercisable if the Group’s underlying earnings per share growsby not less than 4% p.a. compound above the growth in the UK RetailPrices Index over a period of three or more financial years. If notexercised within six years of the date of grant, the options will lapse.
Options granted to the Directors are shown under Directors’ Interests,together with the base underlying earnings per share figure to be usedwhen determining whether the performance target has been met.
ii) Senior plc 2005 Long Term Incentive Plan (“the 2005 LTIP”)
At the AGM 2005, shareholders approved the adoption of the2005 LTIP, a long term share incentive plan to replace the existing1999 Plan, and the lapsed Long Term Share Incentive Plan.
The Remuneration Committee considers that the 2005 LTIP (the maindetails of which are set out below) is in line with current practice andthe evolving views of investors, and provides an effective link betweensenior management performance and reward.
Each year, an individual can receive an award worth up to 100% ofannual salary (or 200% of salary in the case of recruitment). The awardsmade in 2006 under the 2005 LTIP were limited to 50% of salary. The awards are conditional allocations, where the executives will receivefree ordinary shares in the Company automatically on the vesting oftheir award. Awards will normally vest on, or shortly following, the thirdanniversary of grant once the Committee has determined the extent to which the applicable performance conditions (see below) have beensatisfied, and provided that the participant is still employed within theCompany’s group.
Senior plc Annual Report 200620
All awards are subject to performance conditions set by theRemuneration Committee. The 2005 LTIP is designed to reward seniorexecutives partly for delivering superior total shareholder return (“TSR”)performance and partly for achieving challenging earnings per share(“EPS”) growth targets. In each case, performance will be measuredover a three year performance period beginning on the first day of thefinancial year in which the award is made. The vesting of one half ofeach of the awards will depend on the Company’s TSR performancecompared to that of the members of the FTSE Small Cap Index(excluding investment trusts), while the vesting of the other half of each award will depend on the growth of the Company’s adjustedEPS relative to RPI.
The vesting of the TSR-related half of the awards will be determined on the following basis:
Ranking of Company’s TSR compared with theFTSE Small Cap Index(excluding investment trusts) Percentage of TSR halfover the performance period of an award which vestsBelow Median 0%Median 25%Upper Quintile (top 20%) 100%Between Median and Upper Quintile Pro rata on a straight-line basis
between 25% and 100%
TSR will be averaged over three months prior to the start and endof the performance period.
The vesting of the EPS-related half of an award will be determined on the following basis:
Company’s average annual adjusted EPS performance Vesting percentage –in excess of RPI EPS half of an awardLess than 5% p.a. 0%5% p.a. 25%12% p.a. 100%Between 5% and 12% p.a. Pro rata on a straight-line basis
between 25% and 100%
Remuneration Report continued
The Remuneration Committee believes that this mixture of conditionsprovides an effective balance so that executives are encouraged toenhance underlying financial performance whilst retaining focus on the need to deliver superior returns for the Company’s shareholders.
The Remuneration Committee encourages Directors to own shares in the Company and, in support of this policy, it expects Directors toretain at least 50% of the shares they acquire under the 2005 LTIP,after allowing for tax liabilities, until a holding of 100% of base salary is built up.
iii) Savings-Related Share Option Plan (“the Sharesave Plan”)The Company’s Sharesave Plan was first launched in 1996 to eligibleemployees across the Group, and was updated and renewed for afurther 10 years in 2006. There are no performance criteria for thisarrangement and options are issued to all participants in accordancewith the HM Revenue & Customs (“HMRC”) rules for savings-relatedplans. As employees, executive Directors are eligible to participate andtheir options under the Sharesave Plan are shown on page 22 underDirectors’ Interests.
e) Retirement BenefitsG R Menzies’ and M Rollins’ pension arrangements are provided by the Group’s UK pension plan and are based upon their pensionablesalaries up to the HMRC’s “cap”. G R Menzies and M Rollins contribute7.5% of salary to cap. From 6 April 2006 (A-Day), the Group’s UKpension plan adopted its own earnings cap, which has been calculatedon the same basis as the HMRC’s pre-A-Day “cap”. M Sheppardparticipates in a defined benefit plan that has now closed to newentrants and a defined contribution plan that remains available to theGroup’s US employees. His base salary is pensionable up to a “cap” of $220,000 p.a.
f) Other BenefitsThe executive Directors also receive non-cash benefits including the provision of a fully expensed car and medical insurance.
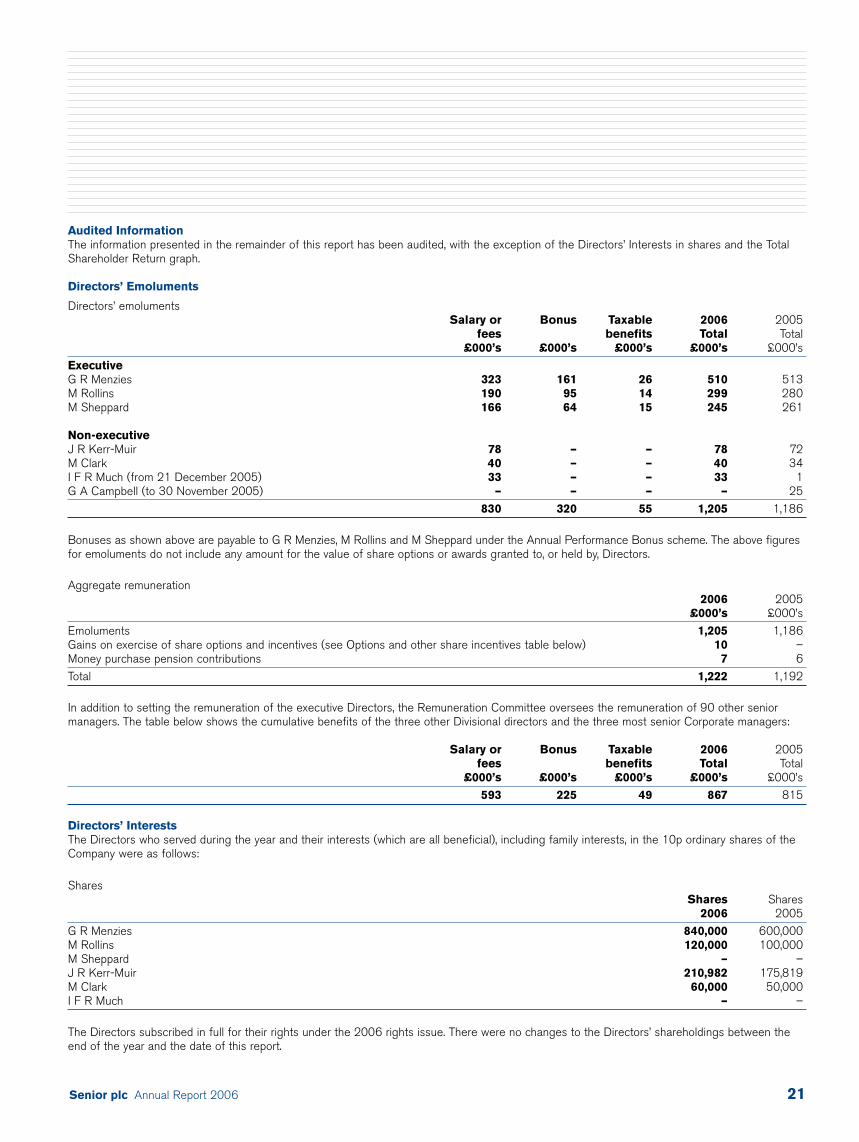
Senior plc Annual Report 2006 21
Audited InformationThe information presented in the remainder of this report has been audited, with the exception of the Directors’ Interests in shares and the TotalShareholder Return graph.
Directors’ Emoluments
Directors’ emolumentsSalary or Bonus Taxable 2006 2005
fees benefits Total Total£000’s £000’s £000’s £000’s £000’s
ExecutiveG R Menzies 323 161 26 510 513M Rollins 190 95 14 299 280M Sheppard 166 64 15 245 261
Non-executiveJ R Kerr-Muir 78 – – 78 72M Clark 40 – – 40 34I F R Much (from 21 December 2005) 33 – – 33 1G A Campbell (to 30 November 2005) – – – – 25
830 320 55 1,205 1,186
Bonuses as shown above are payable to G R Menzies, M Rollins and M Sheppard under the Annual Performance Bonus scheme. The above figuresfor emoluments do not include any amount for the value of share options or awards granted to, or held by, Directors.
Aggregate remuneration2006 2005
£000’s £000’s
Emoluments 1,205 1,186Gains on exercise of share options and incentives (see Options and other share incentives table below) 10 –Money purchase pension contributions 7 6
Total 1,222 1,192
In addition to setting the remuneration of the executive Directors, the Remuneration Committee oversees the remuneration of 90 other seniormanagers. The table below shows the cumulative benefits of the three other Divisional directors and the three most senior Corporate managers:
Salary or Bonus Taxable 2006 2005fees benefits Total Total
£000’s £000’s £000’s £000’s £000’s
593 225 49 867 815
Directors’ InterestsThe Directors who served during the year and their interests (which are all beneficial), including family interests, in the 10p ordinary shares of theCompany were as follows:
SharesShares Shares
2006 2005
G R Menzies 840,000 600,000M Rollins 120,000 100,000M Sheppard – –J R Kerr-Muir 210,982 175,819M Clark 60,000 50,000I F R Much – –
The Directors subscribed in full for their rights under the 2006 rights issue. There were no changes to the Directors’ shareholdings between theend of the year and the date of this report.
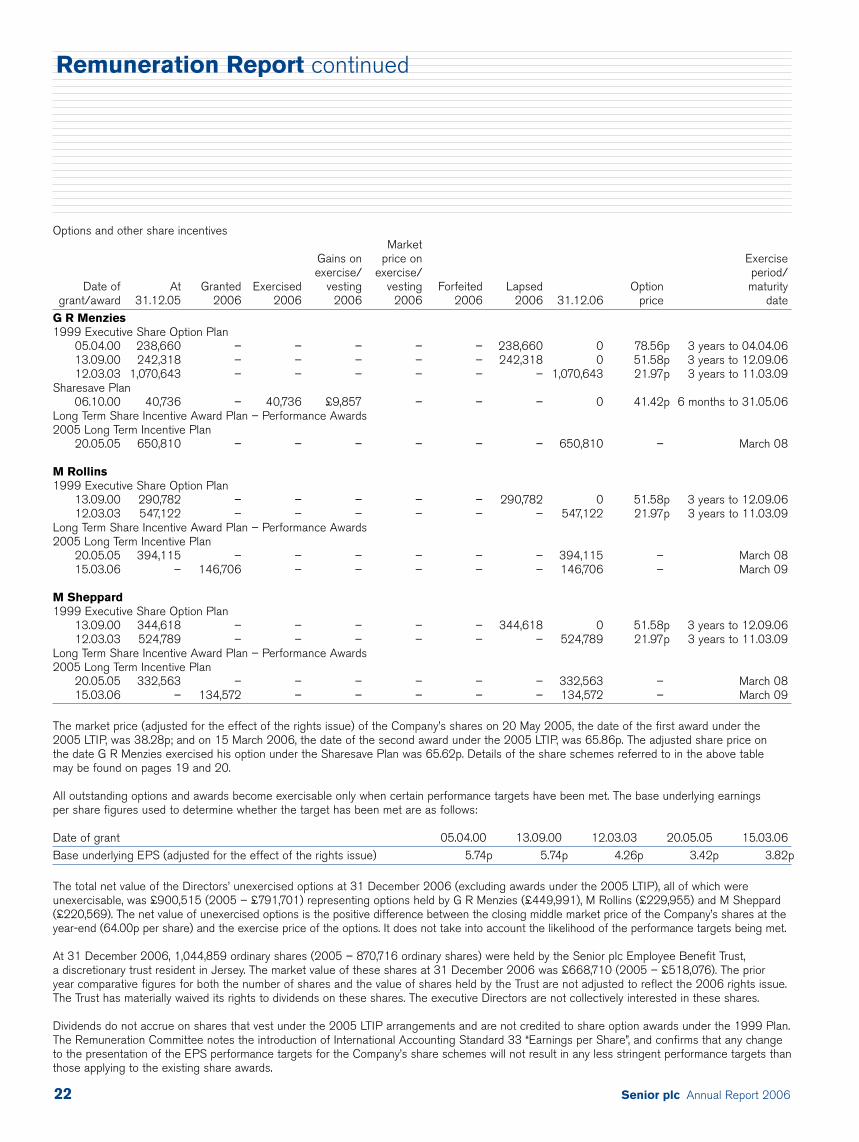
Senior plc Annual Report 200622
Options and other share incentivesMarket
Gains on price on Exerciseexercise/ exercise/ period/
Date of At Granted Exercised vesting vesting Forfeited Lapsed Option maturitygrant/award 31.12.05 2006 2006 2006 2006 2006 2006 31.12.06 price date
G R Menzies1999 Executive Share Option Plan
05.04.00 238,660 – – – – – 238,660 0 78.56p 3 years to 04.04.0613.09.00 242,318 – – – – – 242,318 0 51.58p 3 years to 12.09.0612.03.03 1,070,643 – – – – – – 1,070,643 21.97p 3 years to 11.03.09
Sharesave Plan06.10.00 40,736 – 40,736 £9,857 – – – 0 41.42p 6 months to 31.05.06
Long Term Share Incentive Award Plan – Performance Awards2005 Long Term Incentive Plan
20.05.05 650,810 – – – – – – 650,810 – March 08
M Rollins1999 Executive Share Option Plan
13.09.00 290,782 – – – – – 290,782 0 51.58p 3 years to 12.09.0612.03.03 547,122 – – – – – – 547,122 21.97p 3 years to 11.03.09
Long Term Share Incentive Award Plan – Performance Awards2005 Long Term Incentive Plan
20.05.05 394,115 – – – – – – 394,115 – March 0815.03.06 – 146,706 – – – – – 146,706 – March 09
M Sheppard 1999 Executive Share Option Plan
13.09.00 344,618 – – – – – 344,618 0 51.58p 3 years to 12.09.0612.03.03 524,789 – – – – – – 524,789 21.97p 3 years to 11.03.09
Long Term Share Incentive Award Plan – Performance Awards2005 Long Term Incentive Plan
20.05.05 332,563 – – – – – – 332,563 – March 0815.03.06 – 134,572 – – – – – 134,572 – March 09
The market price (adjusted for the effect of the rights issue) of the Company’s shares on 20 May 2005, the date of the first award under the 2005 LTIP, was 38.28p; and on 15 March 2006, the date of the second award under the 2005 LTIP, was 65.86p. The adjusted share price on the date G R Menzies exercised his option under the Sharesave Plan was 65.62p. Details of the share schemes referred to in the above table may be found on pages 19 and 20.
All outstanding options and awards become exercisable only when certain performance targets have been met. The base underlying earnings per share figures used to determine whether the target has been met are as follows:
Date of grant 05.04.00 13.09.00 12.03.03 20.05.05 15.03.06
Base underlying EPS (adjusted for the effect of the rights issue) 5.74p 5.74p 4.26p 3.42p 3.82p
The total net value of the Directors’ unexercised options at 31 December 2006 (excluding awards under the 2005 LTIP), all of which wereunexercisable, was £900,515 (2005 – £791,701) representing options held by G R Menzies (£449,991), M Rollins (£229,955) and M Sheppard(£220,569). The net value of unexercised options is the positive difference between the closing middle market price of the Company’s shares at theyear-end (64.00p per share) and the exercise price of the options. It does not take into account the likelihood of the performance targets being met.
At 31 December 2006, 1,044,859 ordinary shares (2005 – 870,716 ordinary shares) were held by the Senior plc Employee Benefit Trust, a discretionary trust resident in Jersey. The market value of these shares at 31 December 2006 was £668,710 (2005 – £518,076). The prior year comparative figures for both the number of shares and the value of shares held by the Trust are not adjusted to reflect the 2006 rights issue.The Trust has materially waived its rights to dividends on these shares. The executive Directors are not collectively interested in these shares.
Dividends do not accrue on shares that vest under the 2005 LTIP arrangements and are not credited to share option awards under the 1999 Plan.The Remuneration Committee notes the introduction of International Accounting Standard 33 “Earnings per Share”, and confirms that any changeto the presentation of the EPS performance targets for the Company’s share schemes will not result in any less stringent performance targets thanthose applying to the existing share awards.
Remuneration Report continued
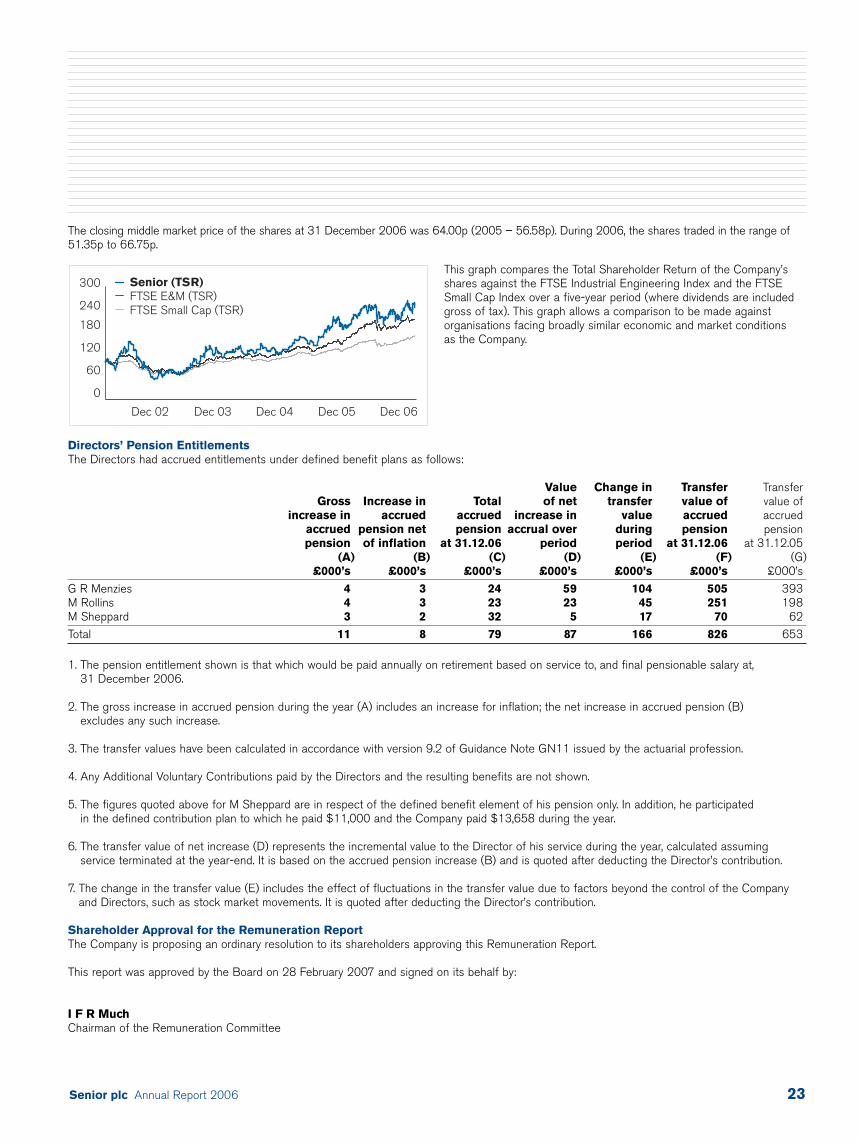
Senior plc Annual Report 2006 23
The closing middle market price of the shares at 31 December 2006 was 64.00p (2005 – 56.58p). During 2006, the shares traded in the range of51.35p to 66.75p.
Directors’ Pension EntitlementsThe Directors had accrued entitlements under defined benefit plans as follows:
Value Change in Transfer TransferGross Increase in Total of net transfer value of value of
increase in accrued accrued increase in value accrued accruedaccrued pension net pension accrual over during pension pensionpension of inflation at 31.12.06 period period at 31.12.06 at 31.12.05
(A) (B) (C) (D) (E) (F) (G)£000’s £000’s £000’s £000’s £000’s £000’s £000’s
G R Menzies 4 3 24 59 104 505 393M Rollins 4 3 23 23 45 251 198M Sheppard 3 2 32 5 17 70 62
Total 11 8 79 87 166 826 653
1. The pension entitlement shown is that which would be paid annually on retirement based on service to, and final pensionable salary at,31 December 2006.
2. The gross increase in accrued pension during the year (A) includes an increase for inflation; the net increase in accrued pension (B) excludes any such increase.
3. The transfer values have been calculated in accordance with version 9.2 of Guidance Note GN11 issued by the actuarial profession.
4. Any Additional Voluntary Contributions paid by the Directors and the resulting benefits are not shown.
5. The figures quoted above for M Sheppard are in respect of the defined benefit element of his pension only. In addition, he participated in the defined contribution plan to which he paid $11,000 and the Company paid $13,658 during the year.
6. The transfer value of net increase (D) represents the incremental value to the Director of his service during the year, calculated assumingservice terminated at the year-end. It is based on the accrued pension increase (B) and is quoted after deducting the Director’s contribution.
7. The change in the transfer value (E) includes the effect of fluctuations in the transfer value due to factors beyond the control of the Companyand Directors, such as stock market movements. It is quoted after deducting the Director’s contribution.
Shareholder Approval for the Remuneration ReportThe Company is proposing an ordinary resolution to its shareholders approving this Remuneration Report.
This report was approved by the Board on 28 February 2007 and signed on its behalf by:
I F R MuchChairman of the Remuneration Committee
Dec 02 Dec 03 Dec 04 Dec 05 Dec 06
Senior (TSR)FTSE E&M (TSR)FTSE Small Cap (TSR)
0
60
120
180
240
300This graph compares the Total Shareholder Return of the Company’sshares against the FTSE Industrial Engineering Index and the FTSESmall Cap Index over a five-year period (where dividends are includedgross of tax). This graph allows a comparison to be made againstorganisations facing broadly similar economic and market conditions as the Company.
Senior plc Annual Report 200624
PrinciplesThe policy of the Board is to enhance shareholder value in an ethicaland socially responsible manner which helps to preserve health, safetyand the environment. The Board believes that operating in such a way is an integral part of efficient and profitable business management, and recognises that success in these areas depends on theinvolvement and commitment of everyone in the organisation.
As a minimum, the Group operations around the world are required to meet their legal and regulatory obligations. This policy is reviewedannually for validity and is revised and reissued as necessary.
Goalsa) Ethical OperationsApplications for employment by disabled persons are encouraged, bearingin mind the respective aptitudes, skills and abilities of the applicantconcerned and the requirements of the position. In the event of employeesbecoming disabled, the Group’s aim is to ensure continued employmentwhere possible and to arrange appropriate training. It is the policy of theGroup to maintain, wherever feasible, the training, career developmentand promotion of disabled persons.
Group policy is that employment-related decisions are based on relevantaptitudes, skills and abilities, and promote a policy of equal opportunityin employment, without unlawful consideration of sex, race, nationality,age, disability, religion or any other category protected by law.
The Group promotes the dissemination of relevant information so that employees are kept regularly advised of Group and operatingcompany developments. Where practical, local briefing sessions areheld concerning such matters as health and safety, pension plans, etc.
There is a formal Code of Business Conduct in place for the Group,which promotes a commitment to maintaining the highest standard ofethics and integrity in the conduct of the Group’s business throughoutthe world. This Code includes requirements for the personal conduct of Group employees, including specifically conflict of interests, businessgifts, and bribery and corruption. The Code does not permit employeesto make contributions to political parties or organisations or candidatesfor public office with a view to gaining any advantage.
The Company has a Whistle Blowing policy that is communicatedthroughout the Group. This policy provides employees with the opportunityto report unethical or illegal corporate conduct. M Clark is the Company’sSenior Independent Director. His position provides shareholders with an alternative channel of communication if they have concerns that theChairman, Group Chief Executive or Group Finance Director has failedto resolve, or for which such contact is inappropriate.
b) Socially Aware OperationsThe management of each operation in the Group is aware of theimportance of being a good neighbour in its community and is encouragedto build a relationship with local organisations. Each operation within the Group looks to offer a competitive remuneration package to its employees which assists in the retention of its skilled workforce. Each operation aims to recognise and respond constructively to any community concerns about the health, safety and environmentalaspects of its activities.
c) Health, Safety and EnvironmentThe Board as a whole takes an active interest in ensuring that itsoperations provide a safe working environment for their employees. The members of the Health, Safety and Environment (“HSE”) Committeeare G R Menzies (Chairman), M Sheppard (CEO Flexonics Division) andR Case (CEO Aerospace Division). The Committee’s terms of referencecan be found on the Senior plc website.
The HSE Committee normally sits on a quarterly basis and is responsiblefor formulating the Group’s HSE strategy and objectives, for reviewingthe Group’s HSE performance against the objectives, and for ensuringthat key HSE risks and issues are effectively identified and managed.
The Board also reviews the health and safety performance of all theGroup’s operations. The executive Directors, together with the CEOs of the local operations, are responsible for delivering improved HSEperformance. The Group’s operations promote employee involvement in HSE matters, by open communication and encouragement of active participation.
Improving the Group’s HSE performance has been a particular focus overthe past 12 months, with some important foundations being establishedon which to build its programme; these improvements include:
• The publication of a Group HSE Charter and Framework whichdefines the principles, expectations and the standards that Senior plcis seeking to implement with each of its operations.
• The development of an HSE Improvement Strategy, which is directedby the HSE Committee.
• The appointment of a Group HSE Manager in April 2006, whose role is to co-ordinate initiatives across the business, oversee the HSE Improvement Strategy, and assist the operations in identifyingand prioritising opportunities for improvement.
• Establishing a network of HSE Co-ordinators within each operation,and hiring full-time practitioners where appropriate.
• A doubling of the number of operations which have achievedISO 14001 certification, with significant progress being made in theremaining operations to achieve this standard by the end of 2007.
• The establishment of an Internal Audit programme for HSE, whereby each operation undergoes a comprehensive audit annually.
• The formalisation of a uniform set of performance metrics coveringaccidents, energy, waste and water. These, along with the results of Internal Audits, allow for the measurement of improvement.
Having taken the above steps, the Group is in a position to set targetsfor HSE; the 2007 annual business planning process includedimprovement targets covering a range of HSE indices. Responsibility for establishing and fulfilling these targets is devolved to the CEO ofeach operation as part of their leadership responsibilities, and isoverseen by the HSE Committee.
d) EnvironmentWhilst already subject to various laws and regulations governing the emission of substances which could affect human health or theenvironment, each operation examines different means by which toreduce further such emissions. Each operation considers the possibleenvironmental impact of new products and processes, and the Groupconsiders environmental issues during acquisitions and divestments.Each operation aims to provide resources in terms of people, trainingand plant and equipment to meet applicable environmental obligations.
Corporate Social Responsibility Report
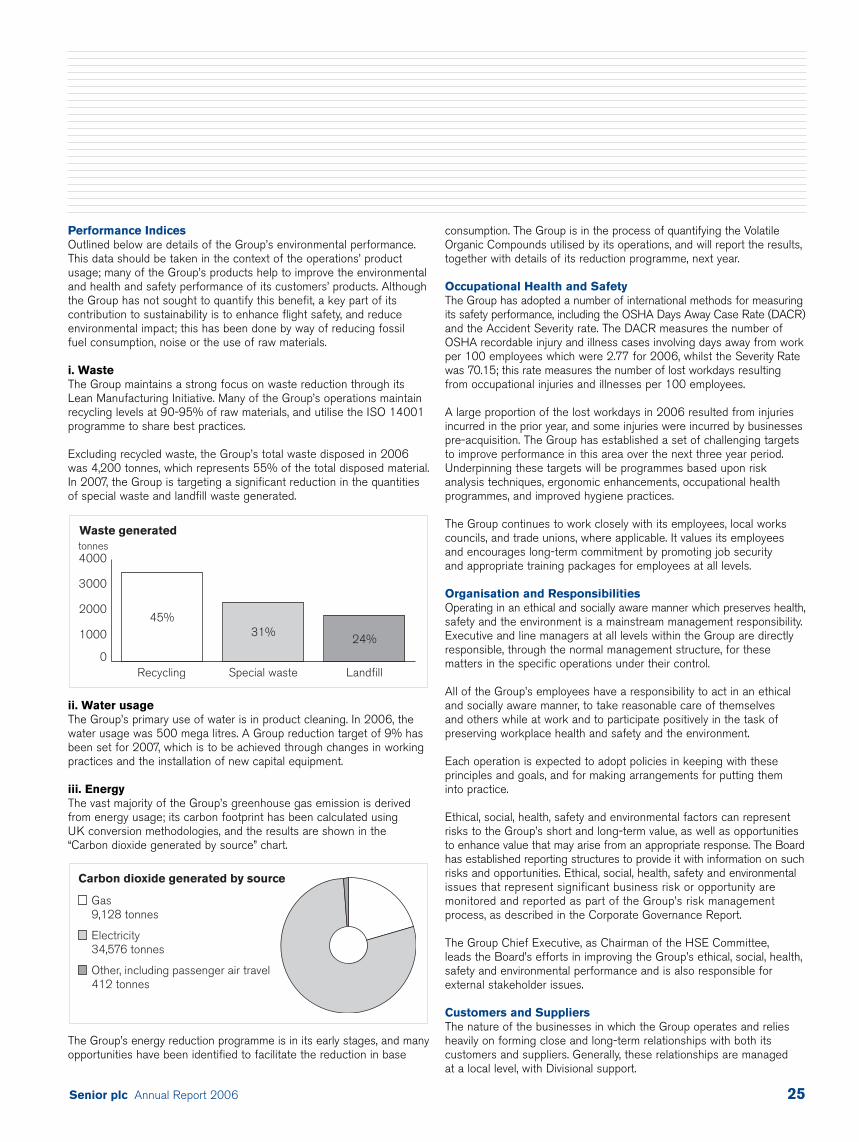
Senior plc Annual Report 2006 25
Performance IndicesOutlined below are details of the Group’s environmental performance.This data should be taken in the context of the operations’ productusage; many of the Group’s products help to improve the environmentaland health and safety performance of its customers’ products. Althoughthe Group has not sought to quantify this benefit, a key part of itscontribution to sustainability is to enhance flight safety, and reduceenvironmental impact; this has been done by way of reducing fossil fuel consumption, noise or the use of raw materials.
i. WasteThe Group maintains a strong focus on waste reduction through itsLean Manufacturing Initiative. Many of the Group’s operations maintainrecycling levels at 90-95% of raw materials, and utilise the ISO 14001programme to share best practices.
Excluding recycled waste, the Group’s total waste disposed in 2006was 4,200 tonnes, which represents 55% of the total disposed material.In 2007, the Group is targeting a significant reduction in the quantitiesof special waste and landfill waste generated.
ii. Water usageThe Group’s primary use of water is in product cleaning. In 2006, thewater usage was 500 mega litres. A Group reduction target of 9% hasbeen set for 2007, which is to be achieved through changes in workingpractices and the installation of new capital equipment.
iii. EnergyThe vast majority of the Group’s greenhouse gas emission is derivedfrom energy usage; its carbon footprint has been calculated using UK conversion methodologies, and the results are shown in the “Carbon dioxide generated by source” chart.
The Group’s energy reduction programme is in its early stages, and manyopportunities have been identified to facilitate the reduction in base
Carbon dioxide generated by source
Gas9,128 tonnes
Electricity 34,576 tonnes
Other, including passenger air travel 412 tonnes
Recycling Special waste Landfill
Waste generated
0
1000
2000
3000
4000
45%31%
24%
tonnes
consumption. The Group is in the process of quantifying the VolatileOrganic Compounds utilised by its operations, and will report the results,together with details of its reduction programme, next year.
Occupational Health and SafetyThe Group has adopted a number of international methods for measuringits safety performance, including the OSHA Days Away Case Rate (DACR)and the Accident Severity rate. The DACR measures the number ofOSHA recordable injury and illness cases involving days away from workper 100 employees which were 2.77 for 2006, whilst the Severity Ratewas 70.15; this rate measures the number of lost workdays resultingfrom occupational injuries and illnesses per 100 employees.
A large proportion of the lost workdays in 2006 resulted from injuriesincurred in the prior year, and some injuries were incurred by businessespre-acquisition. The Group has established a set of challenging targetsto improve performance in this area over the next three year period.Underpinning these targets will be programmes based upon riskanalysis techniques, ergonomic enhancements, occupational healthprogrammes, and improved hygiene practices.
The Group continues to work closely with its employees, local workscouncils, and trade unions, where applicable. It values its employees and encourages long-term commitment by promoting job security and appropriate training packages for employees at all levels.
Organisation and ResponsibilitiesOperating in an ethical and socially aware manner which preserves health,safety and the environment is a mainstream management responsibility.Executive and line managers at all levels within the Group are directlyresponsible, through the normal management structure, for thesematters in the specific operations under their control.
All of the Group’s employees have a responsibility to act in an ethicaland socially aware manner, to take reasonable care of themselves and others while at work and to participate positively in the task ofpreserving workplace health and safety and the environment.
Each operation is expected to adopt policies in keeping with theseprinciples and goals, and for making arrangements for putting them into practice.
Ethical, social, health, safety and environmental factors can representrisks to the Group’s short and long-term value, as well as opportunitiesto enhance value that may arise from an appropriate response. The Boardhas established reporting structures to provide it with information on suchrisks and opportunities. Ethical, social, health, safety and environmentalissues that represent significant business risk or opportunity aremonitored and reported as part of the Group’s risk managementprocess, as described in the Corporate Governance Report.
The Group Chief Executive, as Chairman of the HSE Committee, leads the Board’s efforts in improving the Group’s ethical, social, health,safety and environmental performance and is also responsible forexternal stakeholder issues.
Customers and SuppliersThe nature of the businesses in which the Group operates and reliesheavily on forming close and long-term relationships with both itscustomers and suppliers. Generally, these relationships are managed at a local level, with Divisional support.
Senior plc Annual Report 200626
The Directors are responsible for preparing the Annual Report, Directors’Remuneration Report and the Financial Statements in accordance withapplicable law and regulations.
Company law requires the Directors to prepare financial statements for each financial year. The Directors are required by the IAS Regulationto prepare the group financial statements under International FinancialReporting Standards (“IFRS”) as adopted by the European Union and have also elected to prepare the parent company financial statements in accordance with IFRS as adopted by the European Union. Thefinancial statements are also required by law to be properly prepared in accordance with the Companies Act 1985 and Article 4 of the IAS Regulation.
International Accounting Standard 1 requires that financial statementspresent fairly for each financial year the Company’s financial position,financial performance and cash flows. This requires the faithfulrepresentation of the effects of transactions, other events and conditionsin accordance with the definitions and recognition criteria for assets,liabilities, income and expenses set out in the International AccountingStandards Board’s “Framework for the preparation and presentation of financial statements”. In virtually all circumstances, a fair presentationwill be achieved by compliance with all applicable IFRS. However,Directors are also required to:
• properly select and apply accounting policies;• present information, including accounting policies, in a manner
that provides relevant, reliable, comparable and understandableinformation; and
• provide additional disclosures when compliance with the specificrequirements in IFRS are insufficient to enable users to understandthe impact of particular transactions, other events and conditions on the entity’s financial position and financial performance.
The Directors are responsible for keeping proper accounting recordsthat disclose with reasonable accuracy at any time the financial positionof the Company and enable them to ensure that the financial statementscomply with the Companies Act 1985. They are also responsible for safeguarding the assets of the Company and hence for takingreasonable steps for the prevention and detection of fraud and other irregularities.
The Directors are responsible for the maintenance and integrity of thecorporate and financial information included on the Company’s website.Legislation in the United Kingdom governing the preparation anddissemination of financial statements may differ from legislation in other jurisdictions.
Statement of Directors’ Responsibilities
Senior plc Annual Report 2006 27
We have audited the Group and parent company financial statements (the“financial statements”) of Senior plc for the year ended 31 December 2006which comprise the Consolidated Income Statement, the Group andCompany Statements of Recognised Income and Expense, the Groupand Company Balance Sheets, the Group and Company cash flowstatements and the related notes 1 to 38. These financial statementshave been prepared under the accounting policies set out therein. We have also audited the information in the Directors’ RemunerationReport that is described as having been audited.
This report is made solely to the Company’s members, as a body, inaccordance with Section 235 of the Companies Act 1985. Our auditwork has been undertaken so that we might state to the Company’smembers those matters we are required to state to them in an auditors’report and for no other purpose. To the fullest extent permitted by law,we do not accept or assume responsibility to anyone other than theCompany and the Company’s members as a body, for our audit work, for this report, or for the opinions we have formed.
Respective Responsibilities of Directors and AuditorsThe Directors’ responsibilities for preparing the Annual Report, the Directors’ Remuneration Report and the financial statements inaccordance with applicable law and International Financial ReportingStandards (“IFRS”) as adopted by the European Union are set out in the Statement of Directors’ Responsibilities.
Our responsibility is to audit the financial statements and the part of the Directors’ Remuneration Report to be audited in accordance withrelevant legal and regulatory requirements and International Standardson Auditing (UK and Ireland).
We report to you our opinion as to whether the financial statements givea true and fair view and whether the financial statements and the partof the Directors’ Remuneration Report to be audited have been properlyprepared in accordance with the Companies Act 1985 and, as regardsthe Group financial statements, Article 4 of the IAS Regulation. We alsoreport to you whether in our opinion the information given in the Directors’Report is consistent with the financial statements. The information givenin the Directors’ Report includes that specific information presented in the Operating and Financial Review that is cross referred from the Activities and Business Review section of the Directors’ Report.
In addition we report to you if, in our opinion, the Company has not kept proper accounting records, if we have not received all the informationand explanations we require for our audit, or if information specified by law regarding Directors’ remuneration and other transactions is not disclosed.
We review whether the Corporate Governance Statement reflects theCompany’s compliance with the nine provisions of the 2003 CombinedCode specified for our review by the Listing Rules of the FinancialServices Authority, and we report if it does not. We are not required to consider whether the Board’s statements on internal control cover allrisks and controls, or form an opinion on the effectiveness of the Group’scorporate governance procedures or its risk and control procedures.
We read the other information contained in the Annual Report asdescribed in the contents section and consider whether it is consistentwith the audited financial statements. We consider the implications forour report if we become aware of any apparent misstatements or materialinconsistencies with the financial statements. Our responsibilities do not extend to any further information outside the Annual Report.
Basis of Audit OpinionWe conducted our audit in accordance with International Standards on Auditing (UK and Ireland) issued by the Auditing Practices Board.An audit includes examination, on a test basis, of evidence relevant to the amounts and disclosures in the financial statements and the part of the Directors’ Remuneration Report to be audited. It also includes an assessment of the significant estimates and judgements made bythe Directors in the preparation of the financial statements, and ofwhether the accounting policies are appropriate to the Group’s andCompany’s circumstances, consistently applied and adequately disclosed.
We planned and performed our audit so as to obtain all the informationand explanations which we considered necessary in order to provide uswith sufficient evidence to give reasonable assurance that the financialstatements and the part of the Directors’ Remuneration Report to beaudited are free from material misstatement, whether caused by fraudor other irregularity or error. In forming our opinion we also evaluatedthe overall adequacy of the presentation of information in the financialstatements and the part of the Directors’ Remuneration Report to be audited.
OpinionIn our opinion:
• the Group financial statements give a true and fair view, in accordancewith IFRS as adopted by the European Union, of the state of the Group’s affairs as at 31 December 2006 and of its profit for the year then ended;
• the parent company financial statements give a true and fair view, in accordance with IFRS as adopted by the European Union asapplied in accordance with the provisions of the Companies Act 1985,of the state of the parent company’s affairs as at 31 December 2006;
• the financial statements and the part of the Directors’ RemunerationReport to be audited have been properly prepared in accordance with the Companies Act 1985 and, as regards the Group financialstatements, Article 4 of the IAS Regulation; and
• the information given in the Directors’ Report is consistent with thefinancial statements.
Deloitte & Touche LLPChartered Accountants and Registered Auditors Nottingham28 February 2007
Independent Auditors’ Report to the Members of Senior plc
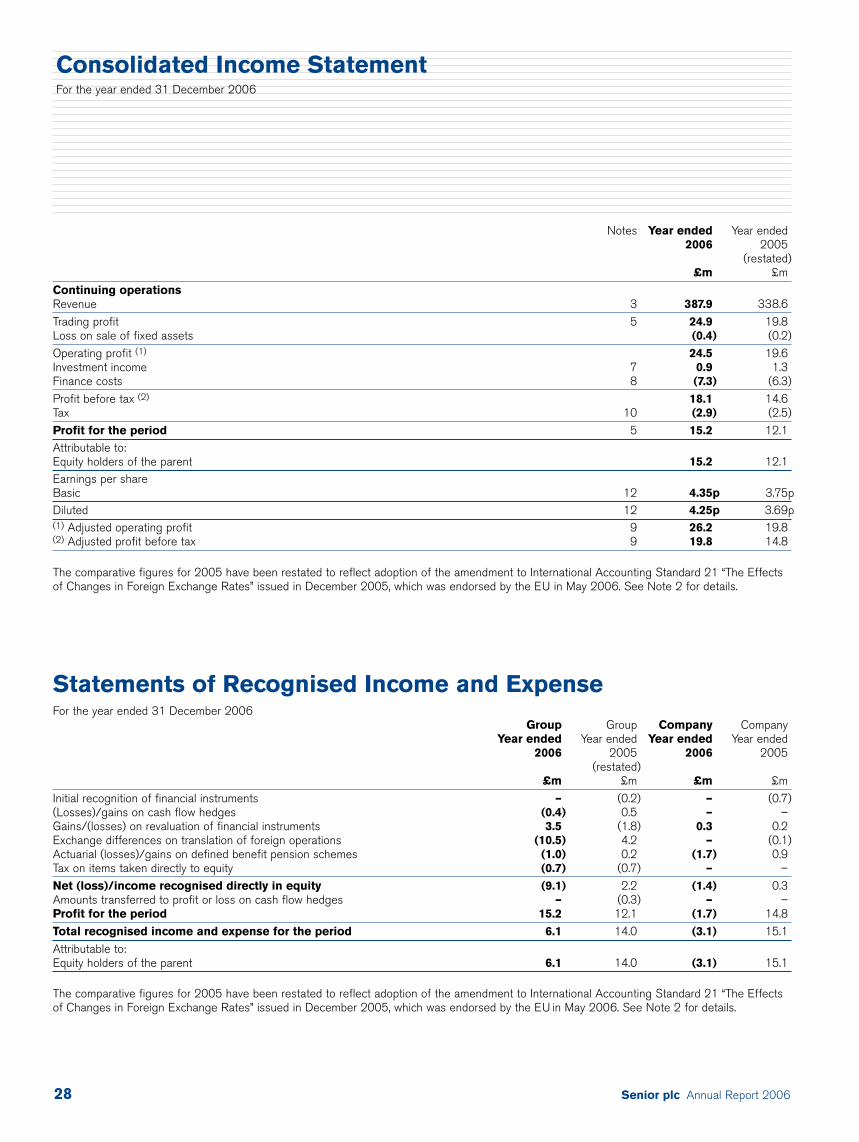
Senior plc Annual Report 200628
Notes Year ended Year ended2006 2005
(restated)£m £m
Continuing operationsRevenue 3 387.9 338.6
Trading profit 5 24.9 19.8 Loss on sale of fixed assets (0.4) (0.2)
Operating profit (1) 24.5 19.6Investment income 7 0.9 1.3 Finance costs 8 (7.3) (6.3)
Profit before tax (2) 18.1 14.6 Tax 10 (2.9) (2.5)
Profit for the period 5 15.2 12.1 Attributable to: Equity holders of the parent 15.2 12.1 Earnings per share Basic 12 4.35p 3.75pDiluted 12 4.25p 3.69p(1) Adjusted operating profit 9 26.2 19.8(2) Adjusted profit before tax 9 19.8 14.8
The comparative figures for 2005 have been restated to reflect adoption of the amendment to International Accounting Standard 21 “The Effectsof Changes in Foreign Exchange Rates” issued in December 2005, which was endorsed by the EU in May 2006. See Note 2 for details.
Statements of Recognised Income and Expense For the year ended 31 December 2006
Group Group Company CompanyYear ended Year ended Year ended Year ended
2006 2005 2006 2005(restated)
£m £m £m £m
Initial recognition of financial instruments – (0.2) – (0.7)(Losses)/gains on cash flow hedges (0.4) 0.5 – –Gains/(losses) on revaluation of financial instruments 3.5 (1.8) 0.3 0.2Exchange differences on translation of foreign operations (10.5) 4.2 – (0.1)Actuarial (losses)/gains on defined benefit pension schemes (1.0) 0.2 (1.7) 0.9Tax on items taken directly to equity (0.7) (0.7) – –
Net (loss)/income recognised directly in equity (9.1) 2.2 (1.4) 0.3Amounts transferred to profit or loss on cash flow hedges – (0.3) – –Profit for the period 15.2 12.1 (1.7) 14.8
Total recognised income and expense for the period 6.1 14.0 (3.1) 15.1
Attributable to: Equity holders of the parent 6.1 14.0 (3.1) 15.1
The comparative figures for 2005 have been restated to reflect adoption of the amendment to International Accounting Standard 21 “The Effectsof Changes in Foreign Exchange Rates” issued in December 2005, which was endorsed by the EU in May 2006. See Note 2 for details.
Consolidated Income Statement For the year ended 31 December 2006
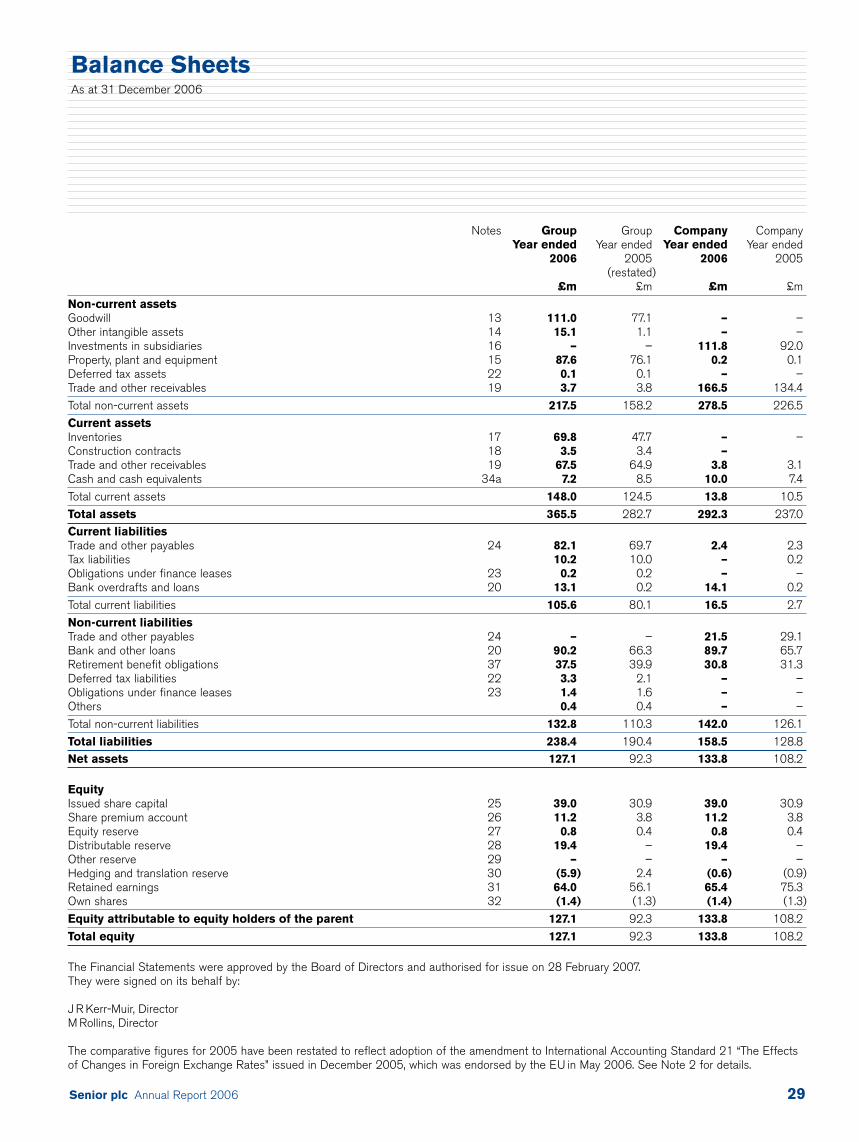
Senior plc Annual Report 2006 29
Notes Group Group Company CompanyYear ended Year ended Year ended Year ended
2006 2005 2006 2005(restated)
£m £m £m £m
Non-current assetsGoodwill 13 111.0 77.1 – –Other intangible assets 14 15.1 1.1 – –Investments in subsidiaries 16 – – 111.8 92.0Property, plant and equipment 15 87.6 76.1 0.2 0.1Deferred tax assets 22 0.1 0.1 – –Trade and other receivables 19 3.7 3.8 166.5 134.4
Total non-current assets 217.5 158.2 278.5 226.5
Current assetsInventories 17 69.8 47.7 – –Construction contracts 18 3.5 3.4 –Trade and other receivables 19 67.5 64.9 3.8 3.1Cash and cash equivalents 34a 7.2 8.5 10.0 7.4
Total current assets 148.0 124.5 13.8 10.5
Total assets 365.5 282.7 292.3 237.0Current liabilities Trade and other payables 24 82.1 69.7 2.4 2.3Tax liabilities 10.2 10.0 – 0.2Obligations under finance leases 23 0.2 0.2 – –Bank overdrafts and loans 20 13.1 0.2 14.1 0.2
Total current liabilities 105.6 80.1 16.5 2.7
Non-current liabilitiesTrade and other payables 24 – – 21.5 29.1Bank and other loans 20 90.2 66.3 89.7 65.7Retirement benefit obligations 37 37.5 39.9 30.8 31.3Deferred tax liabilities 22 3.3 2.1 – –Obligations under finance leases 23 1.4 1.6 – –Others 0.4 0.4 – –
Total non-current liabilities 132.8 110.3 142.0 126.1
Total liabilities 238.4 190.4 158.5 128.8Net assets 127.1 92.3 133.8 108.2
EquityIssued share capital 25 39.0 30.9 39.0 30.9Share premium account 26 11.2 3.8 11.2 3.8Equity reserve 27 0.8 0.4 0.8 0.4Distributable reserve 28 19.4 – 19.4 –Other reserve 29 – – – –Hedging and translation reserve 30 (5.9) 2.4 (0.6) (0.9)Retained earnings 31 64.0 56.1 65.4 75.3Own shares 32 (1.4) (1.3) (1.4) (1.3)
Equity attributable to equity holders of the parent 127.1 92.3 133.8 108.2
Total equity 127.1 92.3 133.8 108.2
The Financial Statements were approved by the Board of Directors and authorised for issue on 28 February 2007.They were signed on its behalf by:
J R Kerr-Muir, DirectorM Rollins, Director
The comparative figures for 2005 have been restated to reflect adoption of the amendment to International Accounting Standard 21 “The Effectsof Changes in Foreign Exchange Rates” issued in December 2005, which was endorsed by the EU in May 2006. See Note 2 for details.
Balance SheetsAs at 31 December 2006
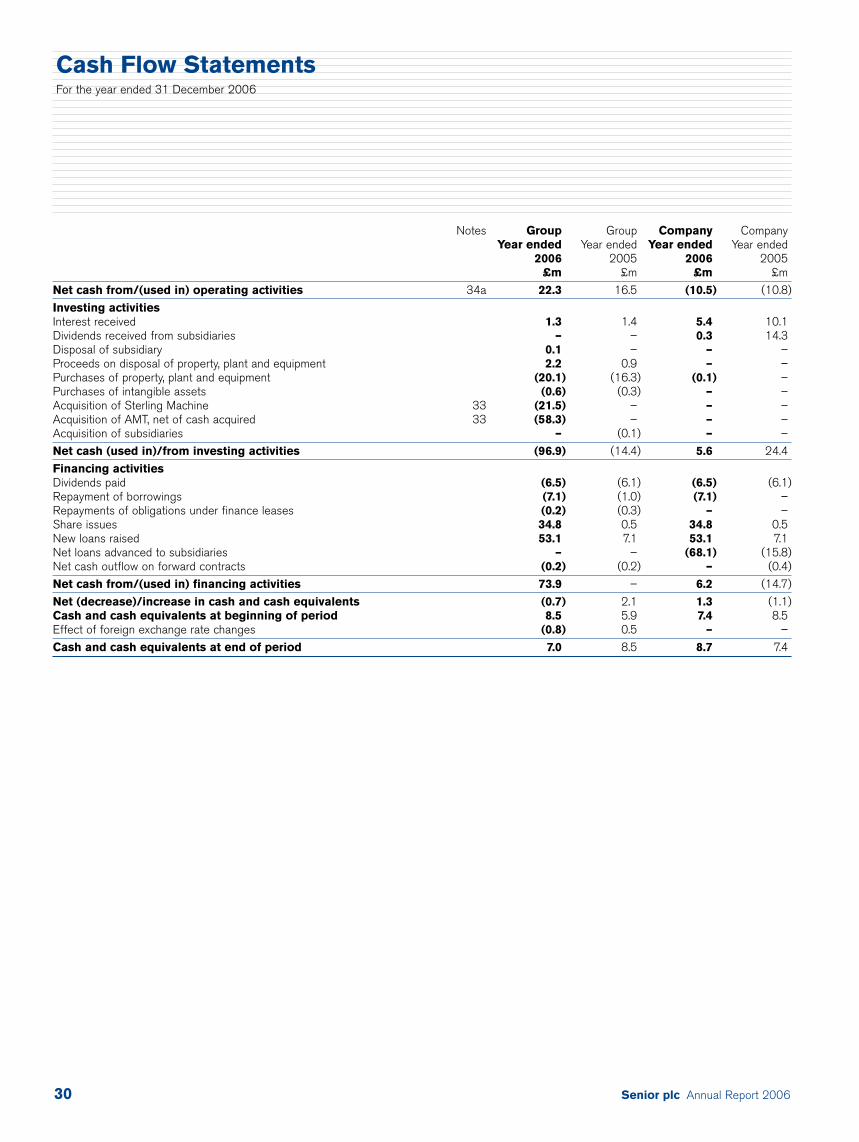
Senior plc Annual Report 200630
Notes Group Group Company CompanyYear ended Year ended Year ended Year ended
2006 2005 2006 2005£m £m £m £m
Net cash from/(used in) operating activities 34a 22.3 16.5 (10.5) (10.8)
Investing activities Interest received 1.3 1.4 5.4 10.1Dividends received from subsidiaries – – 0.3 14.3Disposal of subsidiary 0.1 – – –Proceeds on disposal of property, plant and equipment 2.2 0.9 – –Purchases of property, plant and equipment (20.1) (16.3) (0.1) –Purchases of intangible assets (0.6) (0.3) – –Acquisition of Sterling Machine 33 (21.5) – – –Acquisition of AMT, net of cash acquired 33 (58.3) – – –Acquisition of subsidiaries – (0.1) – –
Net cash (used in)/from investing activities (96.9) (14.4) 5.6 24.4
Financing activities Dividends paid (6.5) (6.1) (6.5) (6.1)Repayment of borrowings (7.1) (1.0) (7.1) –Repayments of obligations under finance leases (0.2) (0.3) – –Share issues 34.8 0.5 34.8 0.5New loans raised 53.1 7.1 53.1 7.1Net loans advanced to subsidiaries – – (68.1) (15.8)Net cash outflow on forward contracts (0.2) (0.2) – (0.4)
Net cash from/(used in) financing activities 73.9 – 6.2 (14.7)
Net (decrease)/increase in cash and cash equivalents (0.7) 2.1 1.3 (1.1)Cash and cash equivalents at beginning of period 8.5 5.9 7.4 8.5Effect of foreign exchange rate changes (0.8) 0.5 – –
Cash and cash equivalents at end of period 7.0 8.5 8.7 7.4
Cash Flow StatementsFor the year ended 31 December 2006
Senior plc Annual Report 2006 31
1. General informationSenior plc is a company incorporated in the United Kingdom under the Companies Act 1985. The address of the registered office is givenon the inside back cover. The nature of the Group’s operations and itsprincipal activities are set out in Note 4 and in the Operating andFinancial Review on pages 7 to 13.
2. Significant accounting policiesBasis of accountingThese Financial Statements have been prepared in accordance withInternational Financial Reporting Standards (“IFRS”) adopted by theEuropean Union and they therefore comply with Article 4 of the EU IASRegulation. They have been prepared on the historical cost basis, exceptfor the revaluation of certain properties and financial instruments.
At the time of preparation of the Group’s annual Financial Statementsfor 2005 the EU had not endorsed an amendment to IAS 21 whichrequired exchange differences that arise on re-translation of inter-company loans in a currency different to that of either counterparty tobe taken to reserves and consequently a gain of £2.0m was recognisedin the income statement in respect of such loans, under IAS 21 as thenendorsed. In May 2006 the EU endorsed the amendment to IAS 21and consequently these Financial Statements have been prepared in accordance with the revised Standard and the December 2005comparatives have been adjusted to recognise the gain of £2.0m in the translation reserve.
At the date of authorisation of these Financial Statements, the followingstandards and interpretations which have not been applied in thesefinancial statements were in issue and adopted by the EU but are notyet effective:
IFRS 7 Financial instruments: Disclosures; and the related amendmentto IAS 1 on capital disclosures. Effective for periods commencing on or after 1 January 2007.
IFRIC 7 Applying the Restatement Approach under IAS 29 FinancialReporting in Hyperinflationary Economies. Effective for periodscommencing on or after 1 March 2006.
IFRIC 8 Scope of IFRS 2. Effective for periods commencing on or after1 May 2006.
IFRIC 9 Reassessment of embedded derivatives. Effective for periodscommencing on or after 1 June 2006.
The Directors anticipate that the adoption of these standards in futureperiods will not have a material impact on these Financial Statements,except for additional disclosures, when the relevant standards come into effect. As none of the Group entities has a currency of ahyperinflationary economy as its functional currency, IFRIC 7 is notrelevant to the Group’s operations.
The separate Financial Statements of the Company are presented as required by the Companies Act 1985. As permitted by the Act, the separate statements have been prepared in accordance with IFRS.They have been prepared on the historical cost basis except for therevaluation of certain financial instruments. The principal accountingpolicies adopted are the same as those set out below, except in respect of investments in subsidiaries, which are stated at cost less,where appropriate, provisions for impairment.
The principal accounting policies under IFRS are set out below.
Basis of consolidationThe Consolidated Financial Statements incorporate the FinancialStatements of Senior plc and the entities controlled by it (its subsidiaries)made up to 31 December. Control is achieved when Senior plc has thepower to govern the financial and operating policies of an investedentity so as to obtain benefits from its activities.
On acquisition, the assets and liabilities and contingent liabilities of asubsidiary are measured at their fair values at the date of acquisition.Any excess of the cost of acquisition over the fair values of the identifiablenet assets acquired is recognised as goodwill. Any deficiency of thecost of acquisition below the fair value of the identifiable net assetsacquired (i.e. discount on acquisition) is credited to the profit and loss account in the period of acquisition. The interest of minorityshareholders is stated at the minority’s proportion of the fair values of the assets and liabilities recognised. Subsequently, any lossesapplicable to the minority interest in excess of the minority interest are allocated against the interests of the parent.
The results of subsidiaries acquired or disposed of during the year areincluded in the Consolidated Income Statement from the effective dateof acquisition or up to the effective date of disposal, as appropriate.
Where necessary, adjustments are made to the financial statements of subsidiaries to bring the accounting policies used into line with those used by the Group.
All intra-group transactions, balances, income and expenses areeliminated on consolidation.
GoodwillGoodwill arising on consolidation represents the excess of the cost ofacquisition over the Group’s interest in the fair value of the identifiableassets and liabilities of a subsidiary, associate or jointly controlled entityat the date of acquisition.
Goodwill is recognised as an asset and reviewed for impairment at leastannually. Any impairment is recognised immediately through the incomestatement and is not subsequently reversed.
On disposal of a subsidiary, associate or jointly controlled entity, theattributable amount of goodwiII is included in the determination of theprofit or loss on disposal.
Notes to the Financial Statements
Senior plc Annual Report 200632
2. Significant accounting policies continuedGoodwill arising on acquisitions prior to the date of transition to IFRShas been retained at the previous UK GAAP amount subject to beingtested for impairment at that date. Goodwill written off to reservesunder UK GAAP prior to 1998 has not been reinstated and is notincluded in determining any subsequent profit or loss on disposal.
Revenue recognitionRevenue is measured at the fair value of the consideration received or receivable and represents amounts receivable for goods and services provided in the normal course of business, net of discounts,VAT and other sales related taxes.
Sales of goods are recognised when goods are delivered in accordancewith the terms and conditions of the sale.
Revenue from construction contracts is recognised in accordance with the Group’s accounting policy on construction contracts, as outlined below.
Interest income is accrued on a time basis, by reference to the principaloutstanding and at the effective interest rate applicable.
Dividend income from investments is recognised when theshareholders’ legal rights to receive payment have been established.
Construction contractsWhere the outcome of a construction contract can be estimatedreliably, revenue and costs are recognised by reference to the stage of completion of the contract activity at the balance sheetdate. This is normally calculated in accordance with the proportionthat contract costs incurred for work performed to date bear to the estimated total contract costs, except where this would not berepresentative of the stage of completion. Variations in contractwork and claims are included to the extent that it is probable thatthey will be recovered from the customer.
Where the outcome of a construction contract cannot be estimatedreliably, contract revenue is only recognised to the extent thatcontract costs incurred will probably be recoverable.
When it is probable that total contract costs will exceed totalcontract revenue, the expected loss is recognised as an expenseimmediately.
LeasingLeases are classified as finance leases whenever the terms of thelease substantially transfer all the risks and rewards of ownership to the lessee. All other leases are classified as operating leases.
Assets held under finance leases are recognised as assets of theGroup at their fair value or, if lower, at the present value of the minimumlease payments, each determined at the inception of the lease. Thecorresponding liability to the lessor is included in the balance sheet as a finance lease obligation. Lease payments are apportioned betweenfinance charges and a reduction of the lease obligation in order toachieve a constant rate of interest on the remaining balance of theliability. Finance charges are charged directly to the Income Statement.
Rentals payable under operating leases are expensed on a straight-linebasis over the term of the relevant lease.
Benefits received and receivable as incentives to enter into an operatinglease are also spread on a straight-line basis over the lease term.
Foreign currenciesTransactions in currencies other than Pounds Sterling are recorded at the rates of exchange prevailing on the date of the transaction. At each balance sheet date, monetary assets and liabilities that are denominated in foreign currencies are retranslated at the ratesprevailing on the balance sheet date. Non-monetary items carried at fair value that are denominated in foreign currencies are translated at the rates prevailing at the date when the fair value was determined.Non-monetary items that are measured in terms of historical cost in a foreign currency are not retranslated. Gains and losses arising onretranslation are included in net profit or loss for the period, except forexchange differences arising on non-monetary assets and liabilitieswhere the changes in fair value are recognised directly in equity, subject to meeting the requirements under IAS 21.
In order to hedge its exposure to certain foreign exchange risks, theGroup enters into forward contracts (see section on Derivative financialinstruments and hedging below for details of the Group’s accountingpolicies in respect of such derivative financial instruments).
On consolidation, the assets and liabilities of the Group’s overseasoperations are translated at exchange rates prevailing on the balancesheet date. Income and expense items are translated at the averageexchange rates for the period unless exchange rates fluctuatesignificantly during that period in which case the exchange rates at the date of transactions are used. Exchange differences arising, if any,are classified as equity and transferred to the Group’s translationreserve. Such translation differences are recognised as income orexpense in the period in which the operation is disposed of.
Goodwill and fair value adjustments arising on the acquisition of aforeign entity are treated as assets and liabilities of the foreign entityand translated at the closing rate.
Government grantsGovernment grants received for items of a revenue nature arerecognised as income over the period necessary to match them withthe related costs and are deducted in reporting the related expense.
Government grants relating to investment in property, plant andequipment are deducted from the initial carrying value of the relatedcapital asset.
Operating profitOperating profit is stated after charging restructuring costs, and beforeinvestment income and finance costs, as they relate to externalborrowings and retirement benefit obligations.
Borrowing costsBorrowing costs are recognised in profit or loss in the period in whichthey are incurred.
Notes to the Financial Statements continued
Senior plc Annual Report 2006 33
2. Significant accounting policies continuedRetirement benefit costsPayments to defined contribution retirement schemes are charged asan expense as they fall due. Payments made to state-managed retirementbenefit schemes are dealt with as payments to defined contributionschemes where the Group’s obligations under the schemes areequivalent to those arising in a defined contribution retirement scheme.
For defined benefit retirement schemes, the cost of providing benefits is determined using the Projected Unit Method, with full actuarialvaluations being carried out on a triennial basis, and updated at eachbalance sheet date. Actuarial gains and losses are recognised in full inthe period in which they occur. They are recognised outside the incomestatement and are presented in the statement of recognised incomeand expense.
Past service cost is recognised immediately to the extent that thebenefits are already vested. Otherwise, it is amortised on a straight-linebasis over the period until the benefits become vested.
The retirement benefit obligation recognised in the balance sheetrepresents the present value of the defined benefit obligation asadjusted for unrecognised past service costs, and as reduced by the fair value of scheme assets. Any net asset resulting from thiscalculation is limited to the past service cost plus the present value of available refunds and reductions in future contributions to the plan.
TaxationThe tax currently payable is based on taxable profit for the year.Taxable profit differs from net profit as reported in the incomestatement because it excludes items of income or expense that aretaxable or deductible in other years and it further excludes items thatare never taxable or deductible. The Group’s liability for current tax iscalculated using tax rates that have been enacted or substantivelyenacted by the balance sheet date.
Deferred tax is the tax expected to be payable or recoverable ondifferences between the carrying amounts of assets and liabilities in the financial statements and the corresponding tax bases used in thecomputation of taxable profit, and is accounted for using the balancesheet liability method. Deferred tax liabilities are generally recognisedfor all taxable temporary differences and deferred tax assets arerecognised to the extent that it is probable that taxable profits will be available against which deductible temporary differences can beutilised. Such assets and liabilities are not recognised if the temporarydifference arises from goodwill or from the initial recognition (other thanin a business combination) of other assets and liabilities in a transactionthat affects neither the tax profit nor the accounting profit.
Deferred tax liabilities are recognised for taxable temporary differencesarising on investments in subsidiaries and associates, and interests in joint ventures, except where the Group is able to control the reversalof the temporary difference and it is probable that the temporarydifference will not reverse in the foreseeable future.
The carrying value of deferred tax assets is reviewed at each balancesheet date and reduced to the extent that it is no longer probable that sufficient taxable profits will be available to allow all or part of the deferred tax asset to be recovered.
Deferred tax is calculated at the tax rates that are expected to apply inthe period when the liability is settled or the asset is realised. Deferredtax is charged or credited in the income statement, except when itrelates to items charged or credited directly to equity, in which case the deferred tax is also dealt with in equity.
Property, plant and equipmentLand and buildings held for use in the production or supply of goods orservices, or for administrative purposes, are stated in the balance sheetat their historic cost, or at modified historic cost, being a revaluationundertaken in 1988. Land and buildings were revalued to fair value at date of revaluation.
The Group does not intend to conduct annual revaluations.
Fixtures, plant and equipment are stated at cost less accumulateddepreciation and any recognised impairment loss.
Depreciation is charged on a straight-line basis over the estimateduseful life of the asset, and is charged from the time an asset becomesavailable for its intended use. Annual rates are as follows:
Freehold buildings 2%
Improvements to according to remainingleasehold buildings lease term
Plant and equipment 5% – 33%
Assets held under finance leases are depreciated over their expecteduseful lives on the same basis as owned assets or, where shorter, over the term of the relevant lease.
The gain or loss arising on the disposal or retirement of an asset isdetermined as the difference between the sale proceeds and thecarrying amount of the asset at disposal and is recognised in income.
Other intangible assetsOther intangible assets include computer software and customerrelationships acquired in a business combination. Computer software is measured initially at purchase cost and the cost of customer relationshipsacquired in a business combination is generally based on fair marketvalues. Intangible assets are amortised on a straight-line basis over their estimated useful lives, being between three and five years.
Internally generated intangible assets – research anddevelopment expenditureAn internally generated intangible asset arising from the Group’sdevelopment activities is recognised if all of the following conditions are met:
(i) An asset is created that can be separately identified;
(ii) It is probable that the asset created will generate future economicbenefits; and
(iii) The development cost of the asset can be measured reliably.
Senior plc Annual Report 200634
2. Significant accounting policies continuedInternally generated intangible assets are amortised on a straight-linebasis over their useful lives.
Development work is also carried out on a funded basis. In suchcircumstances the costs are accumulated in inventory and arerecognised when the related billings are made. Any amounts held in inventory are subject to normal inventory valuation principles.Otherwise expenditure on research and development activities is recognised as an expense in the period in which it is incurred.
Impairment of tangible and intangible assets excludinggoodwillAt each balance sheet date, the Group reviews the carrying amounts of its tangible and intangible assets to determine whether there is any indication that those assets have suffered an impairment loss. If any such indication exists, the recoverable amount of the asset is estimated in order to determine the extent of the impairment loss (if any). Where the asset does not generate cash flows that areindependent from other assets, the Group estimates the recoverableamount of the cash-generating unit to which the asset belongs.
The recoverable amount is the higher of the fair value less the costs to sell and the value in use. In assessing the value in use, the estimatedfuture cash flows are discounted to their present value using a pre-taxdiscount rate that reflects current market assessments of the time valueof money and the risks specific to the asset for which the estimates of future cash flows have not been adjusted.
If the recoverable amount of an asset is estimated to be less than itscarrying amount, the carrying amount of the asset is reduced to itsrecoverable amount. An impairment loss is recognised as an expenseimmediately, unless the relevant asset is carried at a revalued amount,in which case the impairment loss is treated as a revaluation decrease.
Where an impairment loss subsequently reverses, the carrying amountof the asset is increased to the revised estimate of its recoverableamount, but so that the increased carrying amount does not exceed thecarrying amount that would have been determined had no impairmentloss been recognised for the asset in prior years. A reversal of animpairment loss is recognised as income immediately, unless therelevant asset is carried at a revalued amount, in which case thereversal of the impairment loss is treated as a revaluation increase.
InventoriesInventories are stated at the lower of cost and net realisable value.Costs comprise direct materials and, where applicable, direct labourcosts and an appropriate allocation of production overheads. Cost is calculated using the first in first out method. Net realisable valuerepresents the estimated selling price less the estimated costs of completion and the costs to be incurred in marketing, selling and distribution.
Financial instrumentsFinancial assets and liabilities are recognised when the Group becomes a party to the contractual provisions of the relevant instrumentand derecognised when it ceases to be a party to such provisions.
Trade receivablesTrade receivables are measured at fair value. Appropriate allowances for estimated irrecoverable amounts are recognised in profit or losswhen there is objective evidence that the asset is impaired.
Cash and cash equivalentsCash and cash equivalents comprise cash at bank and other short-termhighly liquid investments that are readily convertible to a known amountof cash and are subject to an insignificant risk of changes in value.
Non-derivative financial liabilitiesNon-derivative financial liabilities are stated at amortised cost using the effective interest method. For borrowings, their carrying valueincludes accrued interest payable, as well as unamortised issue costs.
Equity instrumentsEquity instruments issued by the Company are recorded at the value of the proceeds received, net of direct issue costs.
Derivative financial instruments and hedgingThe Group’s activities expose it primarily to the financial risks of changesin foreign currency exchange rates and interest rates. The Group usesforeign exchange contracts and interest rate swap contracts to hedgethese exposures. The use of financial derivatives is governed by theGroup’s treasury policy as approved by the Board of Directors, whichprovides written principles on the use of derivatives. The Group doesnot use derivative financial instruments for speculative purposes.
Changes in the fair value of derivative financial instruments that aredesignated and are effective as a cash flow hedge are recogniseddirectly in equity and the ineffective portion is recognised immediately in the income statement. If the cash flow hedge of a firm commitmentor forecasted transaction results in the recognition of an asset or a liability, then, at the time the asset or liability is recognised, theassociated gains or losses on the derivative that had previously beenrecognised in equity are included in the initial measurement of theasset or liability. For hedges that do not result in the recognition of an asset or a liability, amounts deferred in equity are recognised in the income statement in the same period in which the hedged itemaffects net profit or loss.
For an effective hedge of an exposure to changes in fair value, the hedged item is adjusted for changes in fair value attributable to the risk being hedged with the corresponding entry in profit or loss.Gains or losses from re-measuring the derivative are also recognised in profit or loss. If the hedge is effective, these entries will offset in theincome statement.
Changes in the fair value of derivative financial instruments that do notqualify for hedge accounting are recognised in the income statement as they arise.
Hedge accounting is discontinued when the hedging instrument expiresor is sold, terminated, or exercised, or no longer qualifies for hedgeaccounting. At that time, any cumulative gain or loss on the hedginginstrument recognised in equity is retained in equity until the forecastedtransaction occurs. If a hedged transaction is no longer expected to occur,the net cumulative gain or loss recognised in equity is transferred to net profit or loss for the period.
Notes to the Financial Statements continued
Senior plc Annual Report 2006 35
2. Significant accounting policies continuedDerivatives embedded in other financial instruments or other hostcontracts are treated as derivatives when their risks and characteristicsare not closely related to those host contracts.
ProvisionsProvisions for restructuring costs are recognised when the Group has a detailed formal plan for the restructuring and the plan has been communicated to the affected parties. Provisions are measured at the Directors’ best estimate of the expenditure required to settle the obligation at the balance sheet date. They are not discounted topresent value as the effect is not material.
Share-based paymentsThe Group has applied the requirements of IFRS 2 Share-basedpayments. In accordance with the transitional provisions, IFRS 2 hasbeen applied to all grants of equity instruments after 7 November 2002that were unvested as of 1 January 2005.
The Group has issued equity-settled and cash-settled share-basedpayments to certain employees. The fair value (excluding the effect of non-market related conditions), as determined at the grant date, is expensed on a straight-line basis over the vesting period, based onthe Group’s estimate of the number of shares that will eventually vestand adjusted for the effect of non-market related conditions.
Fair value is measured by use of a Black-Scholes model for the shareoption plans, and a binomial model for the share awards under the2005 Long Term Incentive Plan.
The liability in respect of equity-settled amounts is included in equity,whereas the liability in respect of cash-settled amounts is included incurrent and non-current liabilities as appropriate.
Segmental analysisUnder IFRS, segmental detail is presented according to a primarysegment and a secondary segment. The Group’s primary segmentalanalysis is based on the industries that it serves: Aerospace andFlexonics. The secondary analysis is presented according to geographicmarkets comprising North America, Europe (split between the UK andRest of Europe) and the Rest of the World. This is consistent with theway the Group manages itself and with the format of the Group’sinternal financial reporting.
Critical accounting judgements and key sources of estimation uncertaintyWhere critical accounting judgements and key estimations have beenapplied, these are referred to in the relevant Notes, the most significantbeing in goodwill, fair value of intangible assets acquired on acquisition,derivative financial instruments, share-based payments and retirementbenefit schemes.
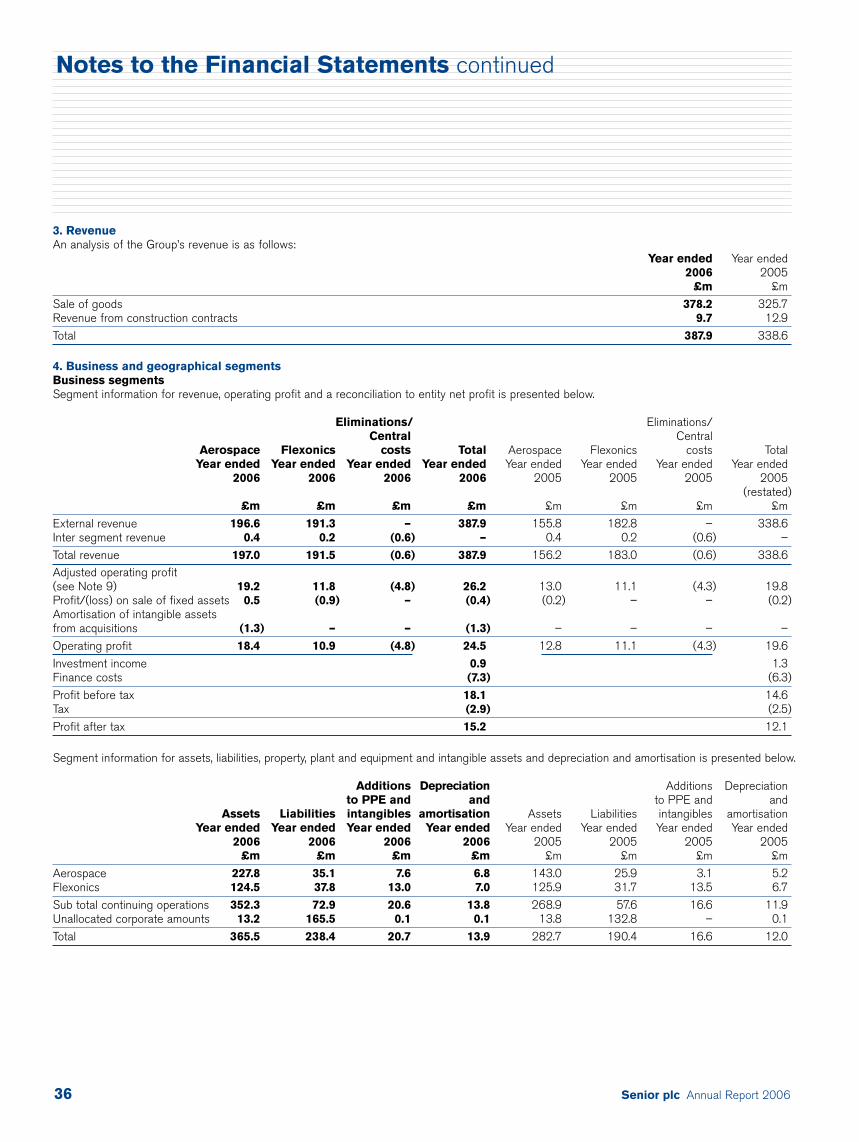
Senior plc Annual Report 200636
3. RevenueAn analysis of the Group’s revenue is as follows:
Year ended Year ended2006 2005
£m £m
Sale of goods 378.2 325.7Revenue from construction contracts 9.7 12.9
Total 387.9 338.6
4. Business and geographical segmentsBusiness segmentsSegment information for revenue, operating profit and a reconciliation to entity net profit is presented below.
Eliminations/ Eliminations/Central Central
Aerospace Flexonics costs Total Aerospace Flexonics costs TotalYear ended Year ended Year ended Year ended Year ended Year ended Year ended Year ended
2006 2006 2006 2006 2005 2005 2005 2005(restated)
£m £m £m £m £m £m £m £m
External revenue 196.6 191.3 – 387.9 155.8 182.8 – 338.6Inter segment revenue 0.4 0.2 (0.6) – 0.4 0.2 (0.6) –
Total revenue 197.0 191.5 (0.6) 387.9 156.2 183.0 (0.6) 338.6Adjusted operating profit(see Note 9) 19.2 11.8 (4.8) 26.2 13.0 11.1 (4.3) 19.8Profit/(loss) on sale of fixed assets 0.5 (0.9) – (0.4) (0.2) – – (0.2)Amortisation of intangible assets from acquisitions (1.3) – – (1.3) – – – –
Operating profit 18.4 10.9 (4.8) 24.5 12.8 11.1 (4.3) 19.6
Investment income 0.9 1.3Finance costs (7.3) (6.3)
Profit before tax 18.1 14.6Tax (2.9) (2.5)
Profit after tax 15.2 12.1
Segment information for assets, liabilities, property, plant and equipment and intangible assets and depreciation and amortisation is presented below.
Additions Depreciation Additions Depreciationto PPE and and to PPE and and
Assets Liabilities intangibles amortisation Assets Liabilities intangibles amortisationYear ended Year ended Year ended Year ended Year ended Year ended Year ended Year ended
2006 2006 2006 2006 2005 2005 2005 2005£m £m £m £m £m £m £m £m
Aerospace 227.8 35.1 7.6 6.8 143.0 25.9 3.1 5.2Flexonics 124.5 37.8 13.0 7.0 125.9 31.7 13.5 6.7
Sub total continuing operations 352.3 72.9 20.6 13.8 268.9 57.6 16.6 11.9Unallocated corporate amounts 13.2 165.5 0.1 0.1 13.8 132.8 – 0.1
Total 365.5 238.4 20.7 13.9 282.7 190.4 16.6 12.0
Notes to the Financial Statements continued
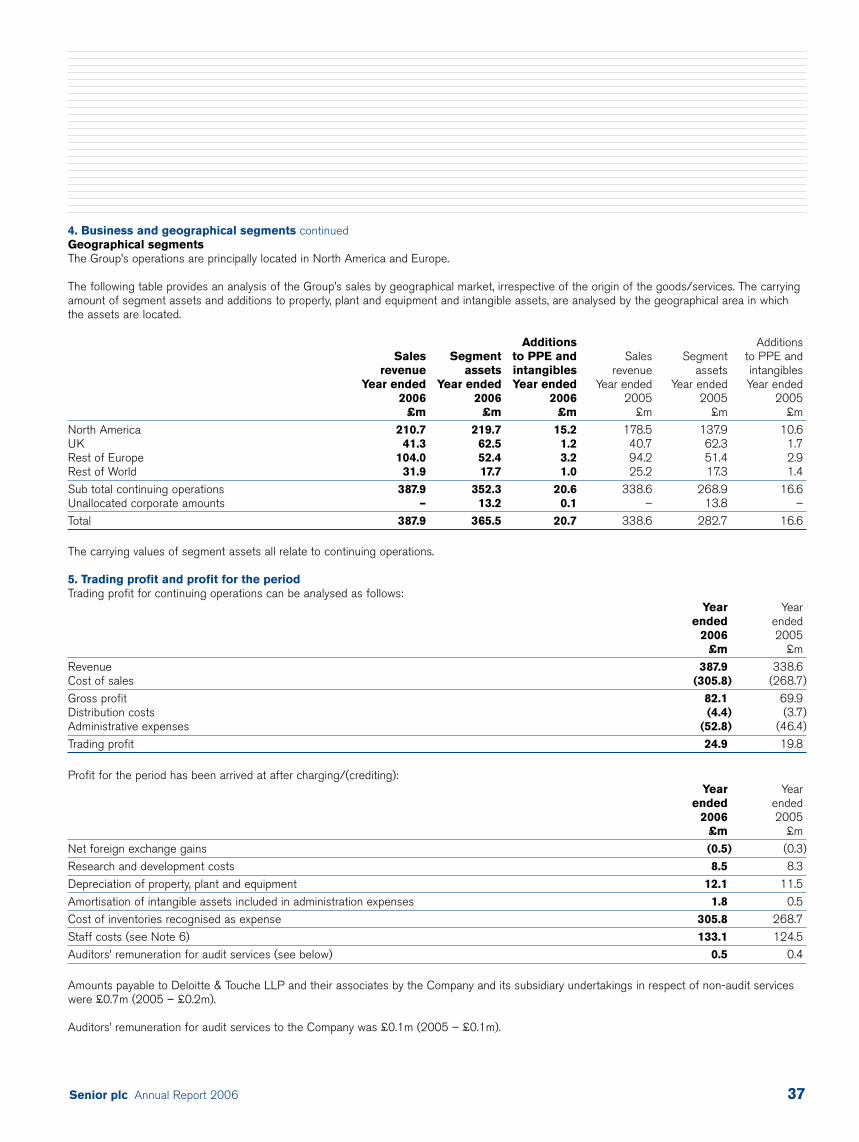
Senior plc Annual Report 2006 37
4. Business and geographical segments continuedGeographical segmentsThe Group’s operations are principally located in North America and Europe.
The following table provides an analysis of the Group’s sales by geographical market, irrespective of the origin of the goods/services. The carryingamount of segment assets and additions to property, plant and equipment and intangible assets, are analysed by the geographical area in whichthe assets are located.
Additions AdditionsSales Segment to PPE and Sales Segment to PPE and
revenue assets intangibles revenue assets intangiblesYear ended Year ended Year ended Year ended Year ended Year ended
2006 2006 2006 2005 2005 2005£m £m £m £m £m £m
North America 210.7 219.7 15.2 178.5 137.9 10.6UK 41.3 62.5 1.2 40.7 62.3 1.7Rest of Europe 104.0 52.4 3.2 94.2 51.4 2.9Rest of World 31.9 17.7 1.0 25.2 17.3 1.4
Sub total continuing operations 387.9 352.3 20.6 338.6 268.9 16.6Unallocated corporate amounts – 13.2 0.1 – 13.8 –
Total 387.9 365.5 20.7 338.6 282.7 16.6
The carrying values of segment assets all relate to continuing operations.
5. Trading profit and profit for the periodTrading profit for continuing operations can be analysed as follows:
Year Yearended ended
2006 2005£m £m
Revenue 387.9 338.6Cost of sales (305.8) (268.7)
Gross profit 82.1 69.9Distribution costs (4.4) (3.7)Administrative expenses (52.8) (46.4)
Trading profit 24.9 19.8
Profit for the period has been arrived at after charging/(crediting):Year Year
ended ended2006 2005
£m £m
Net foreign exchange gains (0.5) (0.3)
Research and development costs 8.5 8.3
Depreciation of property, plant and equipment 12.1 11.5
Amortisation of intangible assets included in administration expenses 1.8 0.5
Cost of inventories recognised as expense 305.8 268.7
Staff costs (see Note 6) 133.1 124.5
Auditors’ remuneration for audit services (see below) 0.5 0.4
Amounts payable to Deloitte & Touche LLP and their associates by the Company and its subsidiary undertakings in respect of non-audit serviceswere £0.7m (2005 – £0.2m).
Auditors’ remuneration for audit services to the Company was £0.1m (2005 – £0.1m).
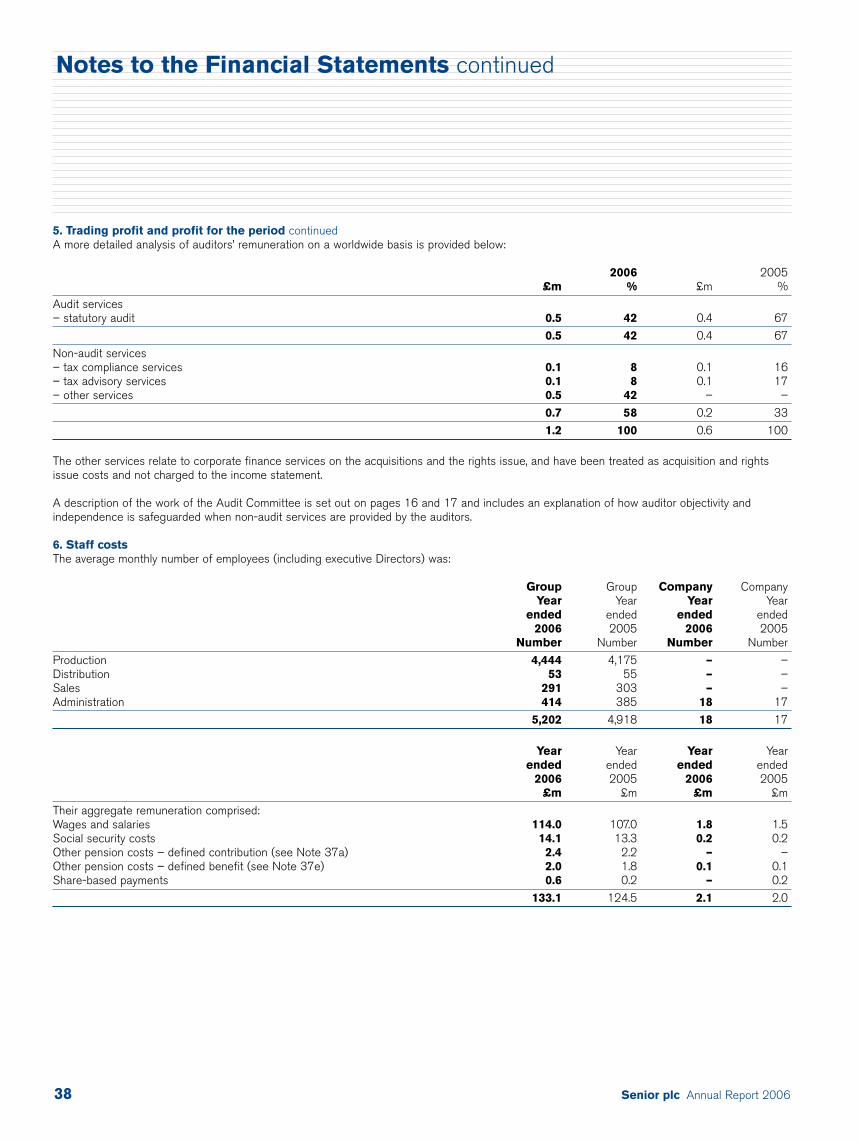
Senior plc Annual Report 200638
5. Trading profit and profit for the period continuedA more detailed analysis of auditors’ remuneration on a worldwide basis is provided below:
2006 2005£m % £m %
Audit services– statutory audit 0.5 42 0.4 67
0.5 42 0.4 67
Non-audit services– tax compliance services 0.1 8 0.1 16– tax advisory services 0.1 8 0.1 17– other services 0.5 42 – –
0.7 58 0.2 33
1.2 100 0.6 100
The other services relate to corporate finance services on the acquisitions and the rights issue, and have been treated as acquisition and rightsissue costs and not charged to the income statement.
A description of the work of the Audit Committee is set out on pages 16 and 17 and includes an explanation of how auditor objectivity andindependence is safeguarded when non-audit services are provided by the auditors.
6. Staff costsThe average monthly number of employees (including executive Directors) was:
Group Group Company CompanyYear Year Year Year
ended ended ended ended2006 2005 2006 2005
Number Number Number Number
Production 4,444 4,175 – –Distribution 53 55 – –Sales 291 303 – –Administration 414 385 18 17
5,202 4,918 18 17
Year Year Year Yearended ended ended ended
2006 2005 2006 2005£m £m £m £m
Their aggregate remuneration comprised:Wages and salaries 114.0 107.0 1.8 1.5Social security costs 14.1 13.3 0.2 0.2Other pension costs – defined contribution (see Note 37a) 2.4 2.2 – –Other pension costs – defined benefit (see Note 37e) 2.0 1.8 0.1 0.1Share-based payments 0.6 0.2 – 0.2
133.1 124.5 2.1 2.0
Notes to the Financial Statements continued
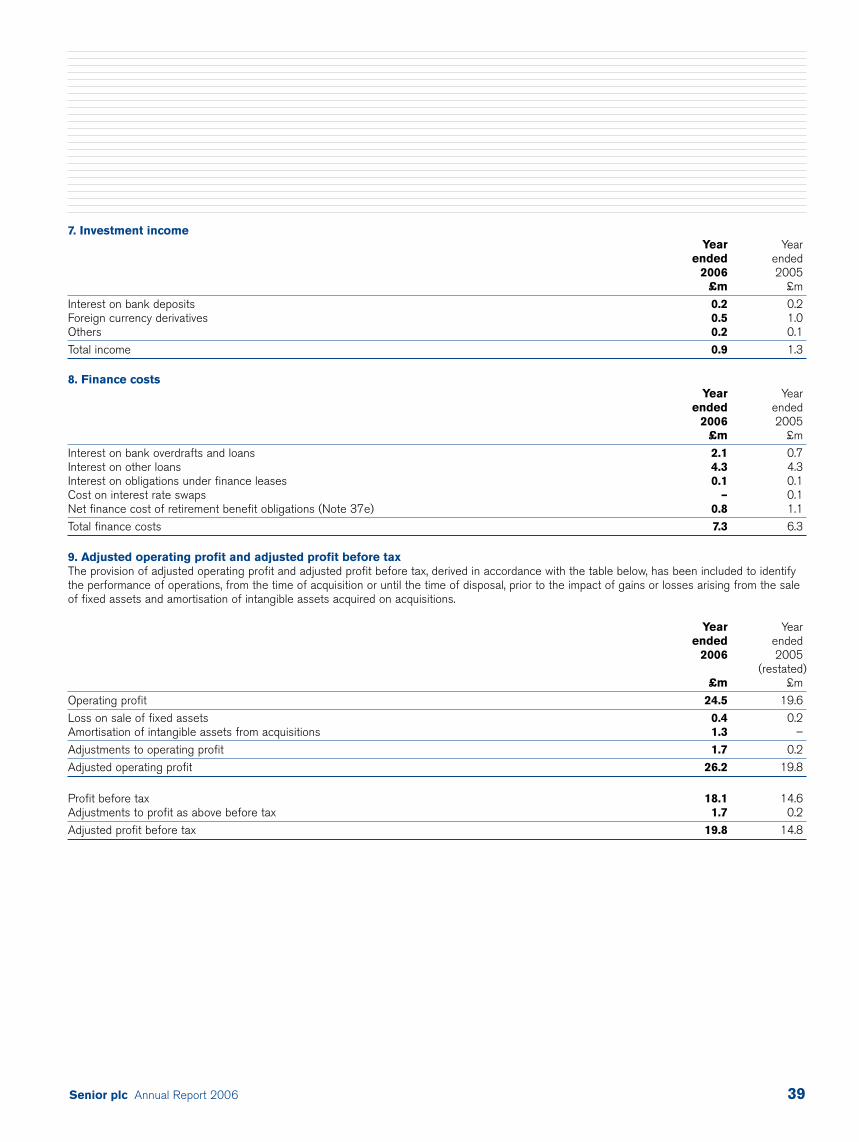
Senior plc Annual Report 2006 39
7. Investment incomeYear Year
ended ended 2006 2005
£m £m
Interest on bank deposits 0.2 0.2Foreign currency derivatives 0.5 1.0Others 0.2 0.1
Total income 0.9 1.3
8. Finance costsYear Year
ended ended2006 2005
£m £m
Interest on bank overdrafts and loans 2.1 0.7 Interest on other loans 4.3 4.3 Interest on obligations under finance leases 0.1 0.1 Cost on interest rate swaps – 0.1Net finance cost of retirement benefit obligations (Note 37e) 0.8 1.1
Total finance costs 7.3 6.3
9. Adjusted operating profit and adjusted profit before taxThe provision of adjusted operating profit and adjusted profit before tax, derived in accordance with the table below, has been included to identifythe performance of operations, from the time of acquisition or until the time of disposal, prior to the impact of gains or losses arising from the saleof fixed assets and amortisation of intangible assets acquired on acquisitions.
Year Yearended ended
2006 2005(restated)
£m £m
Operating profit 24.5 19.6
Loss on sale of fixed assets 0.4 0.2 Amortisation of intangible assets from acquisitions 1.3 –
Adjustments to operating profit 1.7 0.2
Adjusted operating profit 26.2 19.8
Profit before tax 18.1 14.6 Adjustments to profit as above before tax 1.7 0.2
Adjusted profit before tax 19.8 14.8
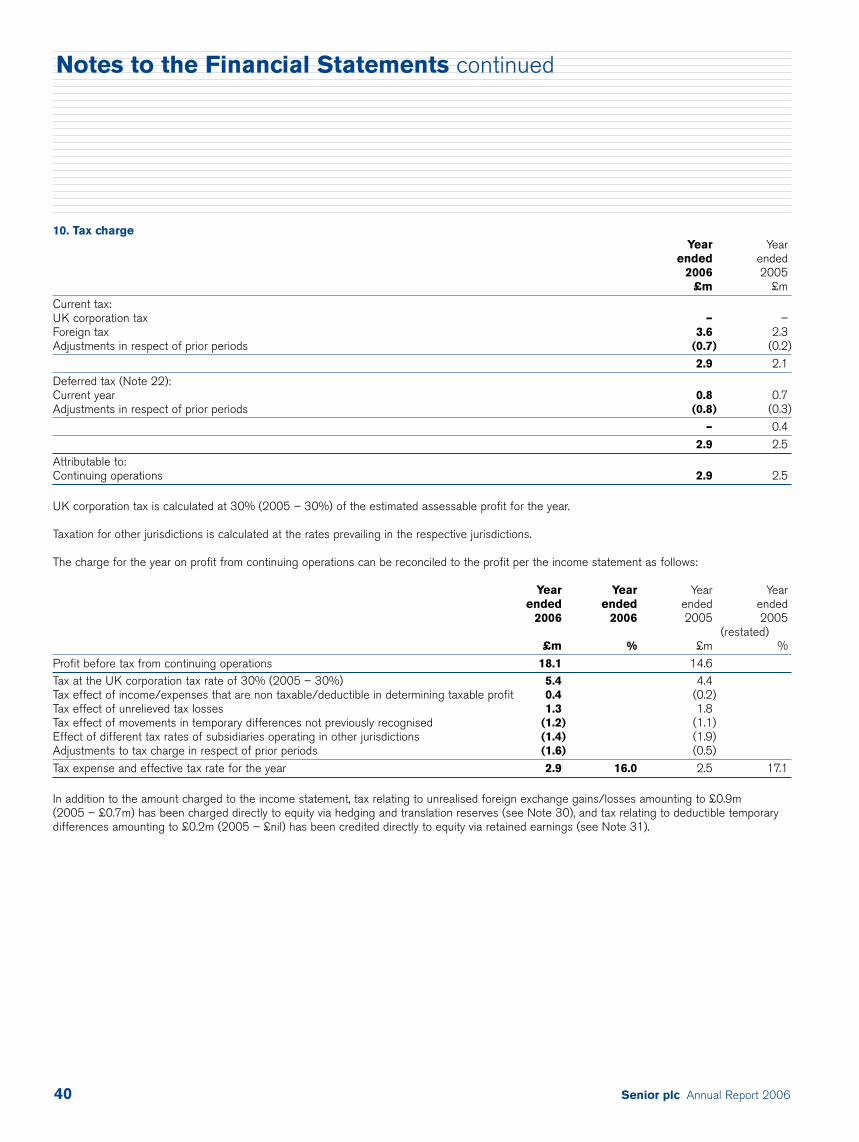
Senior plc Annual Report 200640
10. Tax chargeYear Year
ended ended2006 2005
£m £m
Current tax:UK corporation tax – –Foreign tax 3.6 2.3Adjustments in respect of prior periods (0.7) (0.2)
2.9 2.1
Deferred tax (Note 22):Current year 0.8 0.7Adjustments in respect of prior periods (0.8) (0.3)
– 0.4
2.9 2.5Attributable to:Continuing operations 2.9 2.5
UK corporation tax is calculated at 30% (2005 – 30%) of the estimated assessable profit for the year.
Taxation for other jurisdictions is calculated at the rates prevailing in the respective jurisdictions.
The charge for the year on profit from continuing operations can be reconciled to the profit per the income statement as follows:
Year Year Year Yearended ended ended ended
2006 2006 2005 2005(restated)
£m % £m %
Profit before tax from continuing operations 18.1 14.6Tax at the UK corporation tax rate of 30% (2005 – 30%) 5.4 4.4Tax effect of income/expenses that are non taxable/deductible in determining taxable profit 0.4 (0.2)Tax effect of unrelieved tax losses 1.3 1.8Tax effect of movements in temporary differences not previously recognised (1.2) (1.1)Effect of different tax rates of subsidiaries operating in other jurisdictions (1.4) (1.9)Adjustments to tax charge in respect of prior periods (1.6) (0.5)
Tax expense and effective tax rate for the year 2.9 16.0 2.5 17.1
In addition to the amount charged to the income statement, tax relating to unrealised foreign exchange gains/losses amounting to £0.9m (2005 – £0.7m) has been charged directly to equity via hedging and translation reserves (see Note 30), and tax relating to deductible temporarydifferences amounting to £0.2m (2005 – £nil) has been credited directly to equity via retained earnings (see Note 31).
Notes to the Financial Statements continued
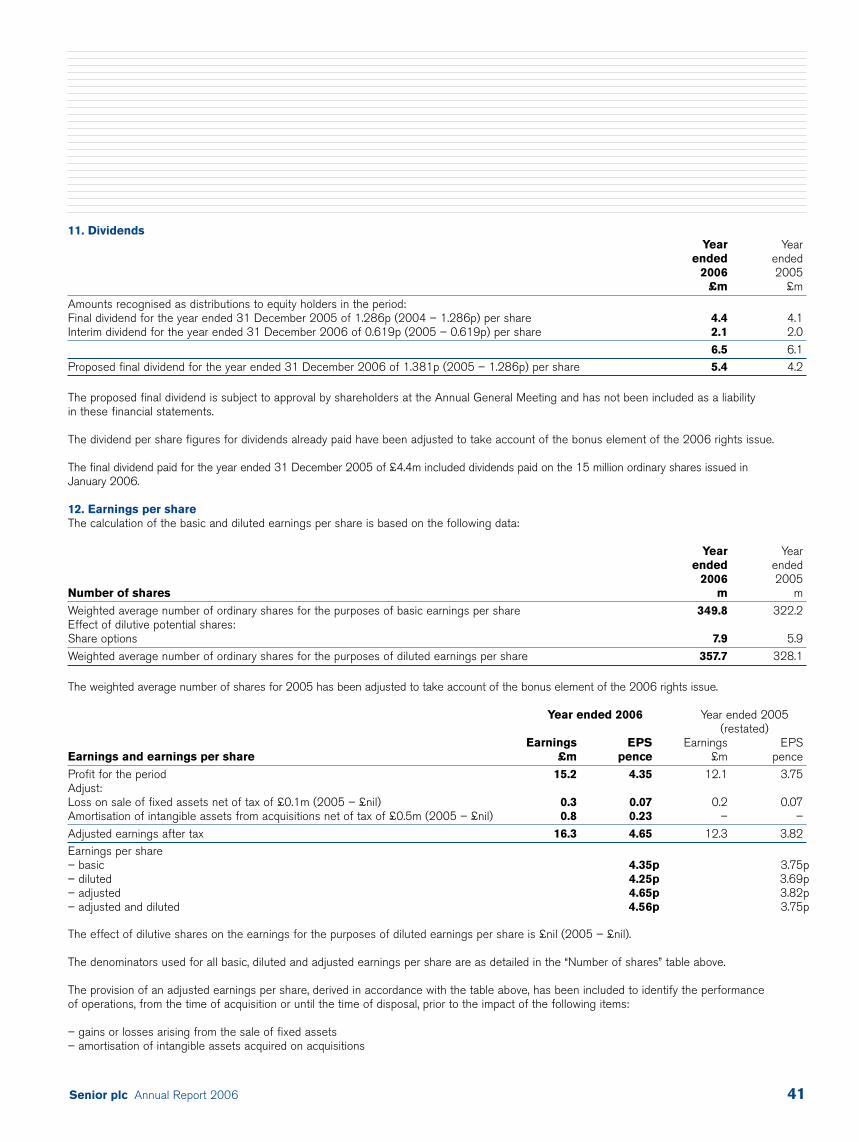
Senior plc Annual Report 2006 41
11. DividendsYear Year
ended ended2006 2005
£m £m
Amounts recognised as distributions to equity holders in the period:Final dividend for the year ended 31 December 2005 of 1.286p (2004 – 1.286p) per share 4.4 4.1Interim dividend for the year ended 31 December 2006 of 0.619p (2005 – 0.619p) per share 2.1 2.0
6.5 6.1Proposed final dividend for the year ended 31 December 2006 of 1.381p (2005 – 1.286p) per share 5.4 4.2
The proposed final dividend is subject to approval by shareholders at the Annual General Meeting and has not been included as a liabilityin these financial statements.
The dividend per share figures for dividends already paid have been adjusted to take account of the bonus element of the 2006 rights issue.
The final dividend paid for the year ended 31 December 2005 of £4.4m included dividends paid on the 15 million ordinary shares issued inJanuary 2006.
12. Earnings per shareThe calculation of the basic and diluted earnings per share is based on the following data:
Year Yearended ended
2006 2005Number of shares m m
Weighted average number of ordinary shares for the purposes of basic earnings per share 349.8 322.2Effect of dilutive potential shares:Share options 7.9 5.9
Weighted average number of ordinary shares for the purposes of diluted earnings per share 357.7 328.1
The weighted average number of shares for 2005 has been adjusted to take account of the bonus element of the 2006 rights issue.
Year ended 2006 Year ended 2005(restated)
Earnings EPS Earnings EPSEarnings and earnings per share £m pence £m pence
Profit for the period 15.2 4.35 12.1 3.75Adjust:Loss on sale of fixed assets net of tax of £0.1m (2005 – £nil) 0.3 0.07 0.2 0.07Amortisation of intangible assets from acquisitions net of tax of £0.5m (2005 – £nil) 0.8 0.23 – –
Adjusted earnings after tax 16.3 4.65 12.3 3.82Earnings per share– basic 4.35p 3.75p– diluted 4.25p 3.69p– adjusted 4.65p 3.82p– adjusted and diluted 4.56p 3.75p
The effect of dilutive shares on the earnings for the purposes of diluted earnings per share is £nil (2005 – £nil).
The denominators used for all basic, diluted and adjusted earnings per share are as detailed in the “Number of shares” table above.
The provision of an adjusted earnings per share, derived in accordance with the table above, has been included to identify the performance of operations, from the time of acquisition or until the time of disposal, prior to the impact of the following items:
– gains or losses arising from the sale of fixed assets– amortisation of intangible assets acquired on acquisitions
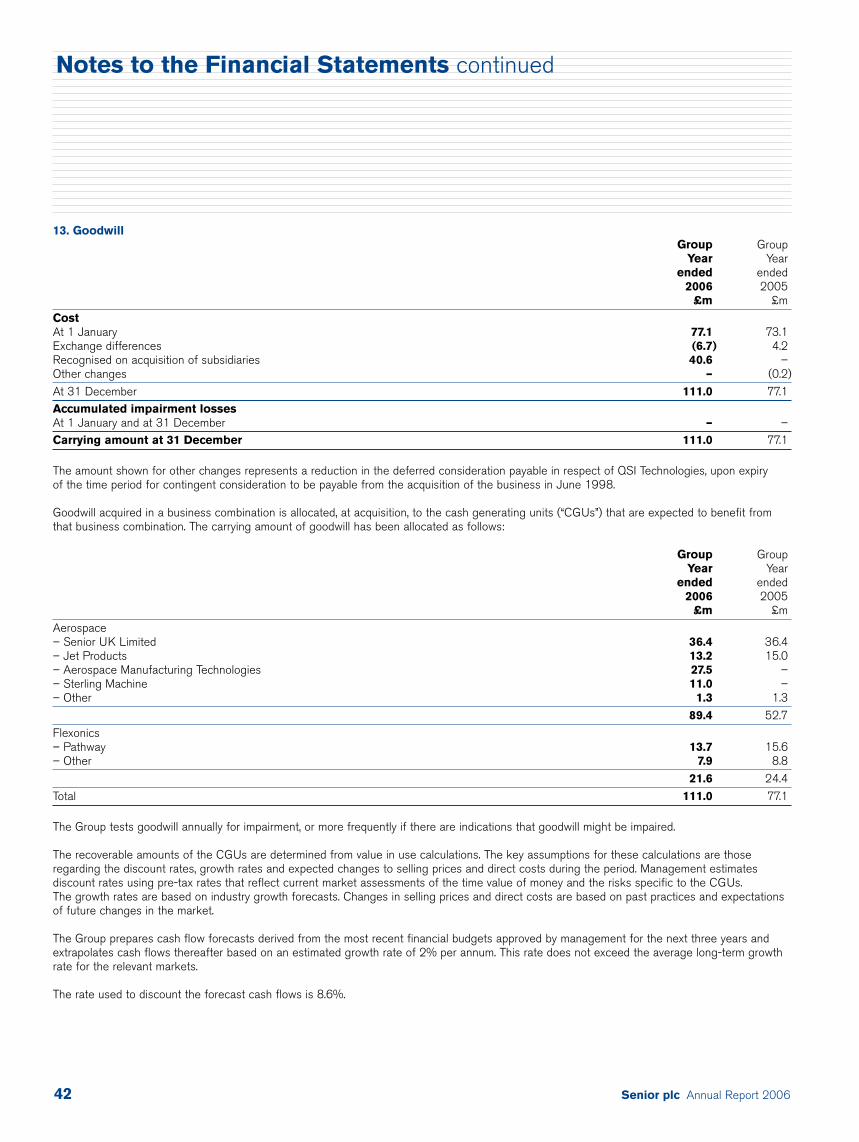
Senior plc Annual Report 200642
13. GoodwillGroup Group
Year Yearended ended
2006 2005£m £m
CostAt 1 January 77.1 73.1 Exchange differences (6.7) 4.2Recognised on acquisition of subsidiaries 40.6 –Other changes – (0.2)
At 31 December 111.0 77.1 Accumulated impairment lossesAt 1 January and at 31 December – –Carrying amount at 31 December 111.0 77.1
The amount shown for other changes represents a reduction in the deferred consideration payable in respect of QSI Technologies, upon expiry of the time period for contingent consideration to be payable from the acquisition of the business in June 1998.
Goodwill acquired in a business combination is allocated, at acquisition, to the cash generating units (“CGUs”) that are expected to benefit from that business combination. The carrying amount of goodwill has been allocated as follows:
Group GroupYear Year
ended ended2006 2005
£m £m
Aerospace– Senior UK Limited 36.4 36.4– Jet Products 13.2 15.0– Aerospace Manufacturing Technologies 27.5 –– Sterling Machine 11.0 –– Other 1.3 1.3
89.4 52.7
Flexonics– Pathway 13.7 15.6– Other 7.9 8.8
21.6 24.4
Total 111.0 77.1
The Group tests goodwill annually for impairment, or more frequently if there are indications that goodwill might be impaired.
The recoverable amounts of the CGUs are determined from value in use calculations. The key assumptions for these calculations are thoseregarding the discount rates, growth rates and expected changes to selling prices and direct costs during the period. Management estimatesdiscount rates using pre-tax rates that reflect current market assessments of the time value of money and the risks specific to the CGUs. The growth rates are based on industry growth forecasts. Changes in selling prices and direct costs are based on past practices and expectations of future changes in the market.
The Group prepares cash flow forecasts derived from the most recent financial budgets approved by management for the next three years andextrapolates cash flows thereafter based on an estimated growth rate of 2% per annum. This rate does not exceed the average long-term growthrate for the relevant markets.
The rate used to discount the forecast cash flows is 8.6%.
Notes to the Financial Statements continued
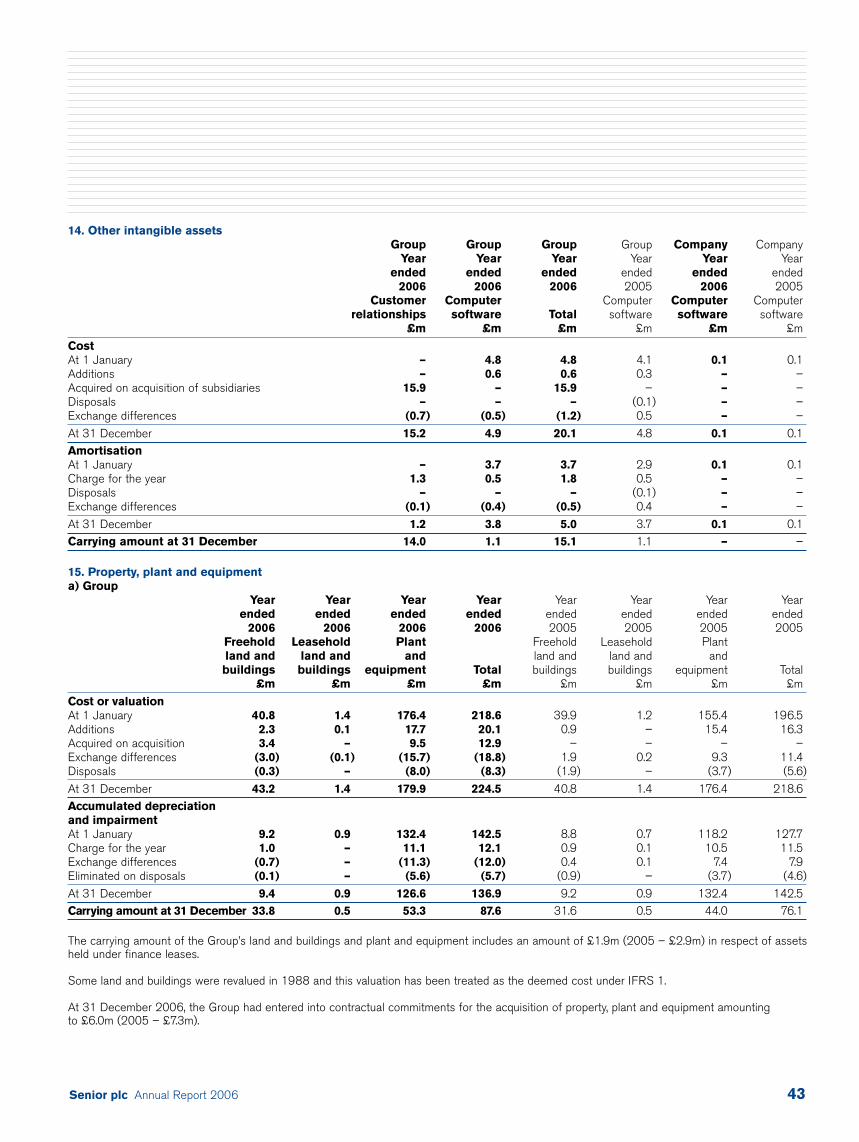
Senior plc Annual Report 2006 43
14. Other intangible assetsGroup Group Group Group Company Company
Year Year Year Year Year Yearended ended ended ended ended ended
2006 2006 2006 2005 2006 2005Customer Computer Computer Computer Computer
relationships software Total software software software£m £m £m £m £m £m
CostAt 1 January – 4.8 4.8 4.1 0.1 0.1Additions – 0.6 0.6 0.3 – –Acquired on acquisition of subsidiaries 15.9 – 15.9 – – –Disposals – – – (0.1) – –Exchange differences (0.7) (0.5) (1.2) 0.5 – –
At 31 December 15.2 4.9 20.1 4.8 0.1 0.1AmortisationAt 1 January – 3.7 3.7 2.9 0.1 0.1Charge for the year 1.3 0.5 1.8 0.5 – –Disposals – – – (0.1) – –Exchange differences (0.1) (0.4) (0.5) 0.4 – –
At 31 December 1.2 3.8 5.0 3.7 0.1 0.1Carrying amount at 31 December 14.0 1.1 15.1 1.1 – –
15. Property, plant and equipmenta) Group
Year Year Year Year Year Year Year Yearended ended ended ended ended ended ended ended
2006 2006 2006 2006 2005 2005 2005 2005Freehold Leasehold Plant Freehold Leasehold Plantland and land and and land and land and andbuildings buildings equipment Total buildings buildings equipment Total
£m £m £m £m £m £m £m £m
Cost or valuationAt 1 January 40.8 1.4 176.4 218.6 39.9 1.2 155.4 196.5Additions 2.3 0.1 17.7 20.1 0.9 – 15.4 16.3Acquired on acquisition 3.4 – 9.5 12.9 – – – –Exchange differences (3.0) (0.1) (15.7) (18.8) 1.9 0.2 9.3 11.4Disposals (0.3) – (8.0) (8.3) (1.9) – (3.7) (5.6)
At 31 December 43.2 1.4 179.9 224.5 40.8 1.4 176.4 218.6Accumulated depreciation and impairmentAt 1 January 9.2 0.9 132.4 142.5 8.8 0.7 118.2 127.7Charge for the year 1.0 – 11.1 12.1 0.9 0.1 10.5 11.5Exchange differences (0.7) – (11.3) (12.0) 0.4 0.1 7.4 7.9Eliminated on disposals (0.1) – (5.6) (5.7) (0.9) – (3.7) (4.6)
At 31 December 9.4 0.9 126.6 136.9 9.2 0.9 132.4 142.5Carrying amount at 31 December 33.8 0.5 53.3 87.6 31.6 0.5 44.0 76.1
The carrying amount of the Group’s land and buildings and plant and equipment includes an amount of £1.9m (2005 – £2.9m) in respect of assetsheld under finance leases.
Some land and buildings were revalued in 1988 and this valuation has been treated as the deemed cost under IFRS 1.
At 31 December 2006, the Group had entered into contractual commitments for the acquisition of property, plant and equipment amounting to £6.0m (2005 – £7.3m).
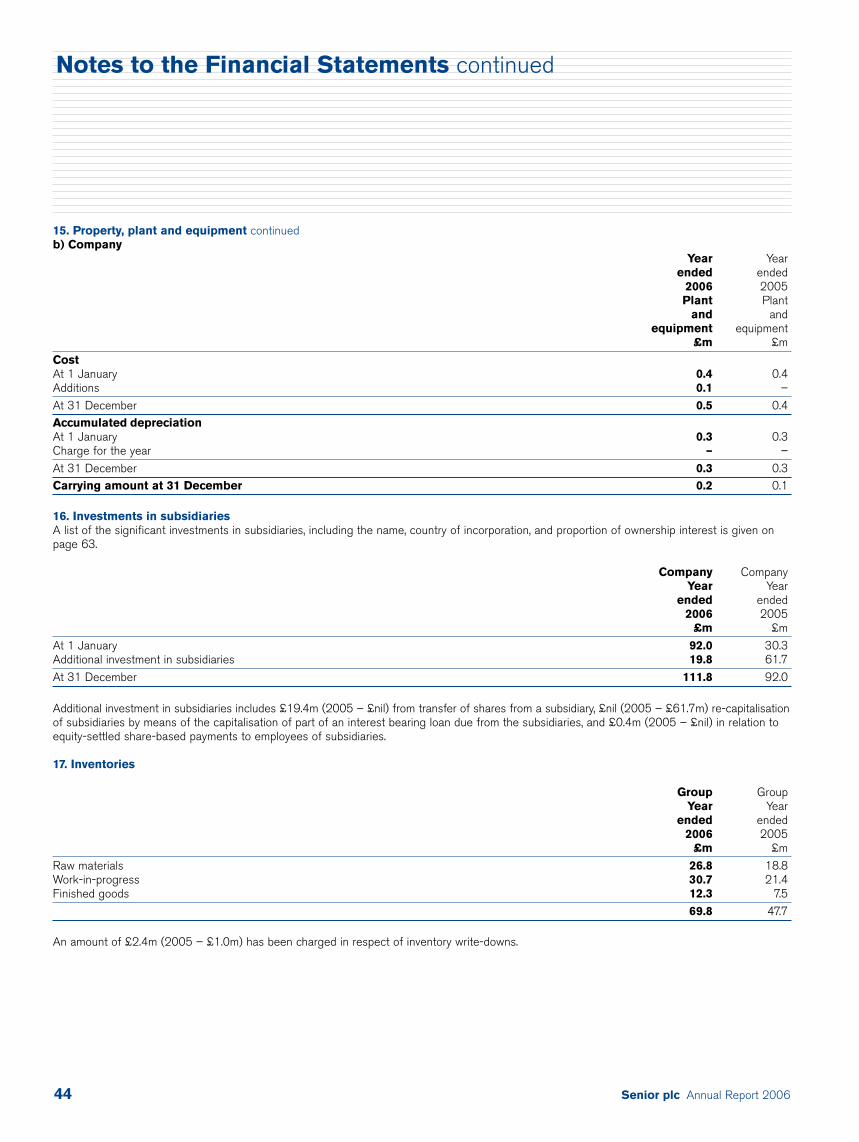
Senior plc Annual Report 200644
15. Property, plant and equipment continuedb) Company
Year Yearended ended
2006 2005Plant Plant
and andequipment equipment
£m £m
CostAt 1 January 0.4 0.4Additions 0.1 –
At 31 December 0.5 0.4Accumulated depreciationAt 1 January 0.3 0.3Charge for the year – –
At 31 December 0.3 0.3Carrying amount at 31 December 0.2 0.1
16. Investments in subsidiariesA list of the significant investments in subsidiaries, including the name, country of incorporation, and proportion of ownership interest is given onpage 63.
Company CompanyYear Year
ended ended2006 2005
£m £m
At 1 January 92.0 30.3Additional investment in subsidiaries 19.8 61.7
At 31 December 111.8 92.0
Additional investment in subsidiaries includes £19.4m (2005 – £nil) from transfer of shares from a subsidiary, £nil (2005 – £61.7m) re-capitalisationof subsidiaries by means of the capitalisation of part of an interest bearing loan due from the subsidiaries, and £0.4m (2005 – £nil) in relation toequity-settled share-based payments to employees of subsidiaries.
17. Inventories
Group GroupYear Year
ended ended2006 2005
£m £m
Raw materials 26.8 18.8Work-in-progress 30.7 21.4Finished goods 12.3 7.5
69.8 47.7
An amount of £2.4m (2005 – £1.0m) has been charged in respect of inventory write-downs.
Notes to the Financial Statements continued

Senior plc Annual Report 2006 45
18. Construction contractsGroup Group
Year Yearended ended
2006 2005£m £m
Contracts in progress at balance sheet date:Amounts due from contract customers included in current assets 3.5 3.4Amounts due to contract customers included in trade and other payables – (0.1)
3.5 3.3Current costs incurred plus recognised profits less recognised losses to date 9.7 10.7Less: progress billings (6.2) (7.4)
3.5 3.3
At 31 December 2006, retentions held by customers for contract work amounted to £0.5m (2005 – £0.6m). Advances received from customersfor contract work amounted to £nil (2005 – £nil).
At 31 December 2006, amounts of £0.2m (2005 – £0.2m) included in trade and other receivables and arising from construction contracts are due for settlement after more than 12 months.
19. Other financial assetsTrade and other receivables at the balance sheet date comprise the following:
Group Group Company CompanyYear Year Year Year
ended ended ended ended2006 2005 2006 2005
£m £m £m £m
Non-current assetsDeferred consideration on disposal of Hose operations 2.6 2.8 – –Trade receivables 0.2 0.2 – –Other receivables 0.9 0.8 – –Due from subsidiaries – – 166.5 134.4
3.7 3.8 166.5 134.4
Current assetsTrade receivables 60.1 56.9 – –Current tax recoverable 0.2 0.4 1.5 1.6Value added tax 1.0 0.6 0.1 0.1Currency derivatives 1.9 1.4 – 0.2Prepayments and accrued income 3.7 5.0 0.8 0.4Other receivables 0.5 0.6 0.5 0.7Deferred consideration on disposal of Hose operations 0.1 – – –Due from subsidiaries – – 0.9 0.1
67.5 64.9 3.8 3.1Total trade and other receivables 71.2 68.7 170.3 137.5
The average credit period taken on sales of goods is 64 days. An allowance has been made for estimated irrecoverable amounts from the sale of goods of £2.1m (2005 – £1.5m). This allowance has been determined in accordance with Group policy.
The Directors consider that the carrying amount of trade and other receivables approximates their fair value.
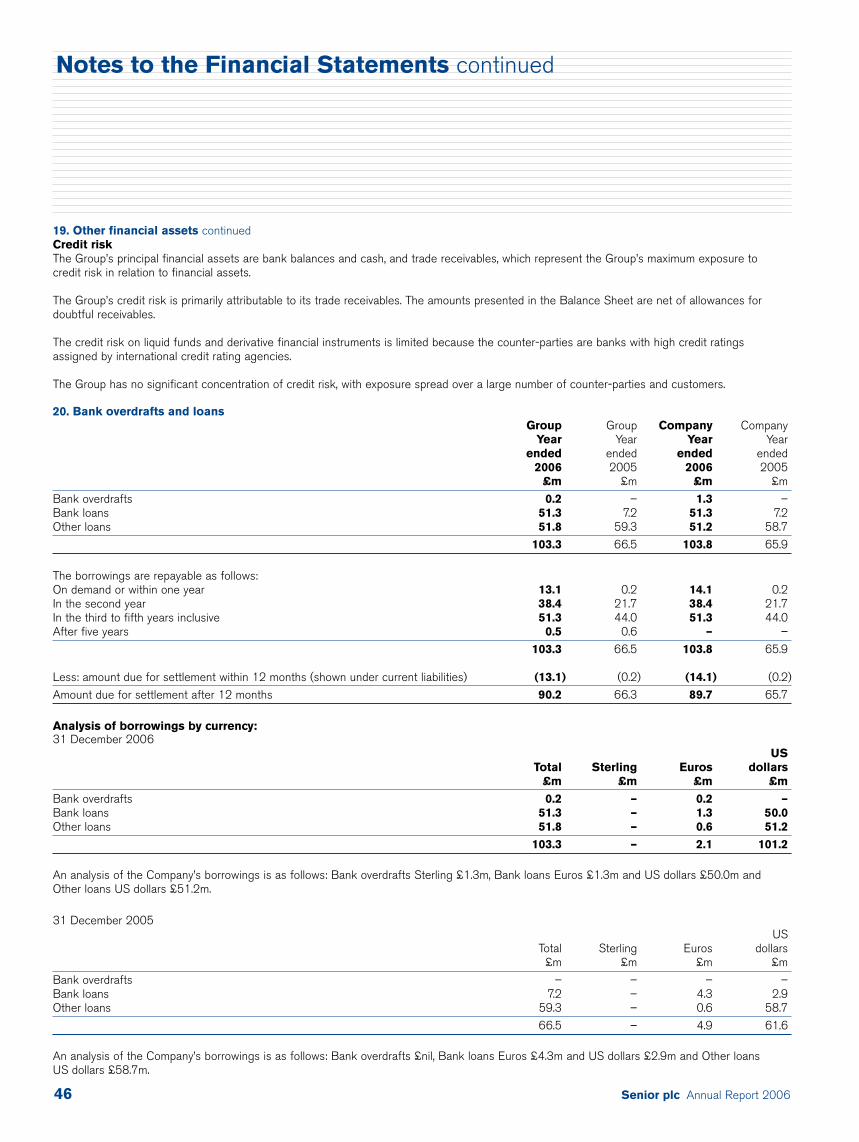
Senior plc Annual Report 200646
19. Other financial assets continuedCredit riskThe Group’s principal financial assets are bank balances and cash, and trade receivables, which represent the Group’s maximum exposure to credit risk in relation to financial assets.
The Group’s credit risk is primarily attributable to its trade receivables. The amounts presented in the Balance Sheet are net of allowances fordoubtful receivables.
The credit risk on liquid funds and derivative financial instruments is limited because the counter-parties are banks with high credit ratingsassigned by international credit rating agencies.
The Group has no significant concentration of credit risk, with exposure spread over a large number of counter-parties and customers.
20. Bank overdrafts and loansGroup Group Company Company
Year Year Year Yearended ended ended ended
2006 2005 2006 2005£m £m £m £m
Bank overdrafts 0.2 – 1.3 –Bank loans 51.3 7.2 51.3 7.2Other loans 51.8 59.3 51.2 58.7
103.3 66.5 103.8 65.9
The borrowings are repayable as follows:On demand or within one year 13.1 0.2 14.1 0.2In the second year 38.4 21.7 38.4 21.7In the third to fifth years inclusive 51.3 44.0 51.3 44.0After five years 0.5 0.6 – –
103.3 66.5 103.8 65.9
Less: amount due for settlement within 12 months (shown under current liabilities) (13.1) (0.2) (14.1) (0.2)
Amount due for settlement after 12 months 90.2 66.3 89.7 65.7
Analysis of borrowings by currency:31 December 2006
USTotal Sterling Euros dollars
£m £m £m £m
Bank overdrafts 0.2 – 0.2 –Bank loans 51.3 – 1.3 50.0Other loans 51.8 – 0.6 51.2
103.3 – 2.1 101.2
An analysis of the Company’s borrowings is as follows: Bank overdrafts Sterling £1.3m, Bank loans Euros £1.3m and US dollars £50.0m and Other loans US dollars £51.2m.
31 December 2005US
Total Sterling Euros dollars£m £m £m £m
Bank overdrafts – – – –Bank loans 7.2 – 4.3 2.9Other loans 59.3 – 0.6 58.7
66.5 – 4.9 61.6
An analysis of the Company’s borrowings is as follows: Bank overdrafts £nil, Bank loans Euros £4.3m and US dollars £2.9m and Other loans US dollars £58.7m.
Notes to the Financial Statements continued
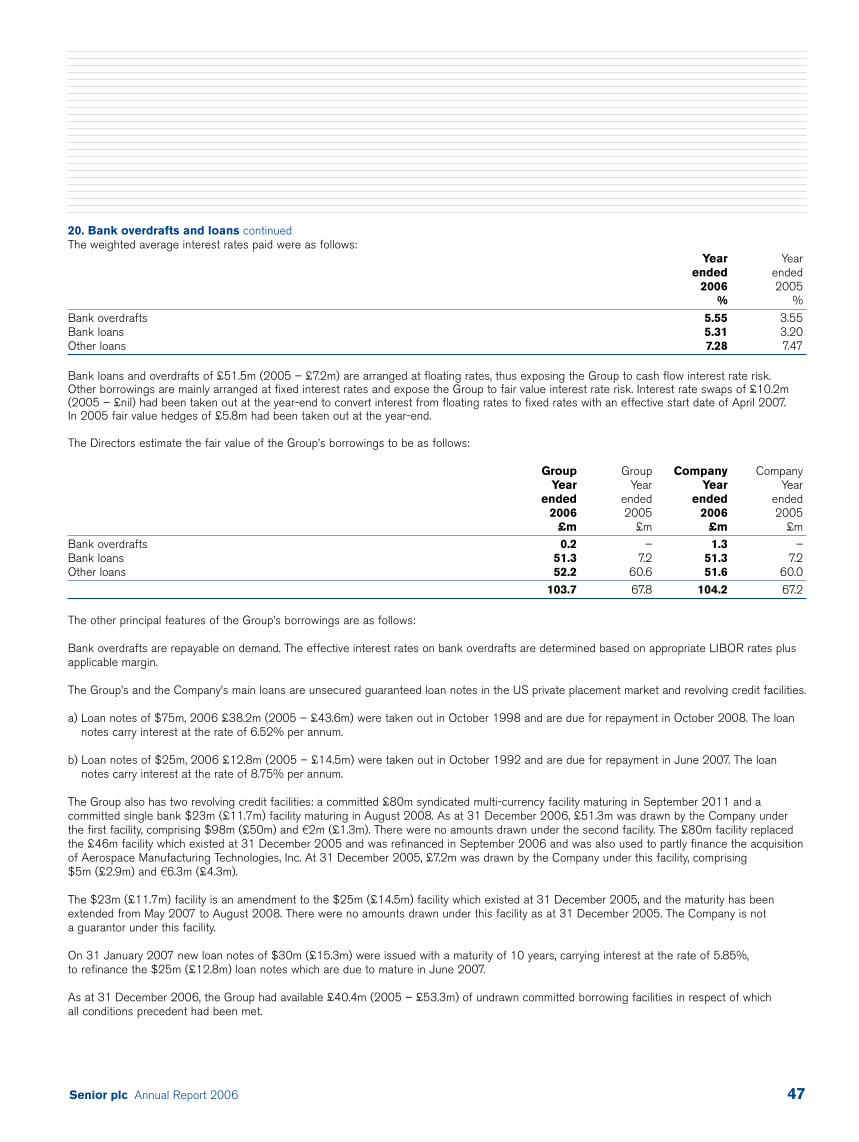
Senior plc Annual Report 2006 47
20. Bank overdrafts and loans continuedThe weighted average interest rates paid were as follows:
Year Year ended ended
2006 2005% %
Bank overdrafts 5.55 3.55Bank loans 5.31 3.20Other loans 7.28 7.47
Bank loans and overdrafts of £51.5m (2005 – £7.2m) are arranged at floating rates, thus exposing the Group to cash flow interest rate risk. Other borrowings are mainly arranged at fixed interest rates and expose the Group to fair value interest rate risk. Interest rate swaps of £10.2m(2005 – £nil) had been taken out at the year-end to convert interest from floating rates to fixed rates with an effective start date of April 2007. In 2005 fair value hedges of £5.8m had been taken out at the year-end.
The Directors estimate the fair value of the Group’s borrowings to be as follows:
Group Group Company CompanyYear Year Year Year
ended ended ended ended2006 2005 2006 2005
£m £m £m £mBank overdrafts 0.2 – 1.3 –Bank loans 51.3 7.2 51.3 7.2Other loans 52.2 60.6 51.6 60.0
103.7 67.8 104.2 67.2
The other principal features of the Group’s borrowings are as follows:
Bank overdrafts are repayable on demand. The effective interest rates on bank overdrafts are determined based on appropriate LIBOR rates plusapplicable margin.
The Group’s and the Company’s main loans are unsecured guaranteed loan notes in the US private placement market and revolving credit facilities.
a) Loan notes of $75m, 2006 £38.2m (2005 – £43.6m) were taken out in October 1998 and are due for repayment in October 2008. The loannotes carry interest at the rate of 6.52% per annum.
b) Loan notes of $25m, 2006 £12.8m (2005 – £14.5m) were taken out in October 1992 and are due for repayment in June 2007. The loannotes carry interest at the rate of 8.75% per annum.
The Group also has two revolving credit facilities: a committed £80m syndicated multi-currency facility maturing in September 2011 and acommitted single bank $23m (£11.7m) facility maturing in August 2008. As at 31 December 2006, £51.3m was drawn by the Company underthe first facility, comprising $98m (£50m) and a2m (£1.3m). There were no amounts drawn under the second facility. The £80m facility replacedthe £46m facility which existed at 31 December 2005 and was refinanced in September 2006 and was also used to partly finance the acquisitionof Aerospace Manufacturing Technologies, Inc. At 31 December 2005, £7.2m was drawn by the Company under this facility, comprising$5m (£2.9m) and a6.3m (£4.3m).
The $23m (£11.7m) facility is an amendment to the $25m (£14.5m) facility which existed at 31 December 2005, and the maturity has beenextended from May 2007 to August 2008. There were no amounts drawn under this facility as at 31 December 2005. The Company is not a guarantor under this facility.
On 31 January 2007 new loan notes of $30m (£15.3m) were issued with a maturity of 10 years, carrying interest at the rate of 5.85%, to refinance the $25m (£12.8m) loan notes which are due to mature in June 2007.
As at 31 December 2006, the Group had available £40.4m (2005 – £53.3m) of undrawn committed borrowing facilities in respect of which all conditions precedent had been met.
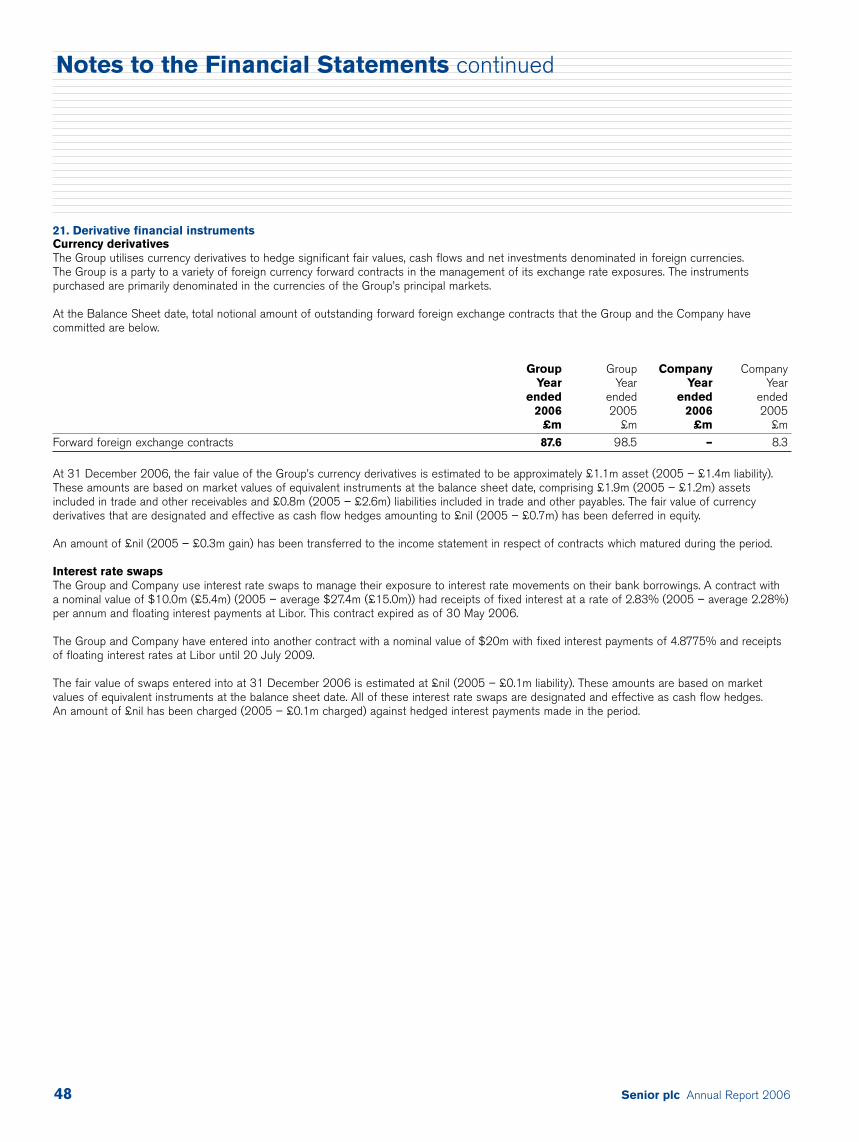
Senior plc Annual Report 200648
21. Derivative financial instrumentsCurrency derivativesThe Group utilises currency derivatives to hedge significant fair values, cash flows and net investments denominated in foreign currencies. The Group is a party to a variety of foreign currency forward contracts in the management of its exchange rate exposures. The instrumentspurchased are primarily denominated in the currencies of the Group’s principal markets.
At the Balance Sheet date, total notional amount of outstanding forward foreign exchange contracts that the Group and the Company havecommitted are below.
Group Group Company CompanyYear Year Year Year
ended ended ended ended2006 2005 2006 2005
£m £m £m £m
Forward foreign exchange contracts 87.6 98.5 – 8.3
At 31 December 2006, the fair value of the Group’s currency derivatives is estimated to be approximately £1.1m asset (2005 – £1.4m liability).These amounts are based on market values of equivalent instruments at the balance sheet date, comprising £1.9m (2005 – £1.2m) assetsincluded in trade and other receivables and £0.8m (2005 – £2.6m) liabilities included in trade and other payables. The fair value of currencyderivatives that are designated and effective as cash flow hedges amounting to £nil (2005 – £0.7m) has been deferred in equity.
An amount of £nil (2005 – £0.3m gain) has been transferred to the income statement in respect of contracts which matured during the period.
Interest rate swapsThe Group and Company use interest rate swaps to manage their exposure to interest rate movements on their bank borrowings. A contract with a nominal value of $10.0m (£5.4m) (2005 – average $27.4m (£15.0m)) had receipts of fixed interest at a rate of 2.83% (2005 – average 2.28%)per annum and floating interest payments at Libor. This contract expired as of 30 May 2006.
The Group and Company have entered into another contract with a nominal value of $20m with fixed interest payments of 4.8775% and receipts of floating interest rates at Libor until 20 July 2009.
The fair value of swaps entered into at 31 December 2006 is estimated at £nil (2005 – £0.1m liability). These amounts are based on marketvalues of equivalent instruments at the balance sheet date. All of these interest rate swaps are designated and effective as cash flow hedges. An amount of £nil has been charged (2005 – £0.1m charged) against hedged interest payments made in the period.
Notes to the Financial Statements continued
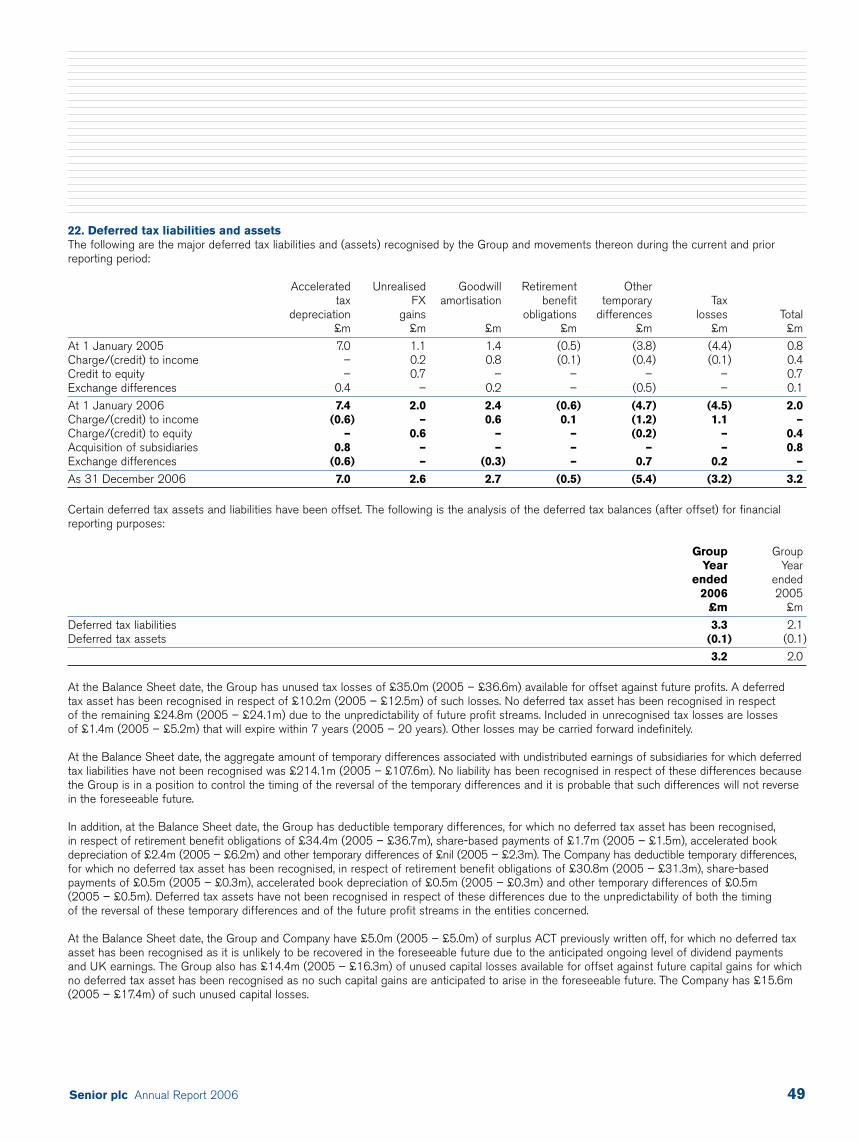
Senior plc Annual Report 2006 49
22. Deferred tax liabilities and assetsThe following are the major deferred tax liabilities and (assets) recognised by the Group and movements thereon during the current and priorreporting period:
Accelerated Unrealised Goodwill Retirement Othertax FX amortisation benefit temporary Tax
depreciation gains obligations differences losses Total£m £m £m £m £m £m £m
At 1 January 2005 7.0 1.1 1.4 (0.5) (3.8) (4.4) 0.8Charge/(credit) to income – 0.2 0.8 (0.1) (0.4) (0.1) 0.4Credit to equity – 0.7 – – – – 0.7Exchange differences 0.4 – 0.2 – (0.5) – 0.1
At 1 January 2006 7.4 2.0 2.4 (0.6) (4.7) (4.5) 2.0Charge/(credit) to income (0.6) – 0.6 0.1 (1.2) 1.1 –Charge/(credit) to equity – 0.6 – – (0.2) – 0.4Acquisition of subsidiaries 0.8 – – – – – 0.8Exchange differences (0.6) – (0.3) – 0.7 0.2 –
As 31 December 2006 7.0 2.6 2.7 (0.5) (5.4) (3.2) 3.2
Certain deferred tax assets and liabilities have been offset. The following is the analysis of the deferred tax balances (after offset) for financialreporting purposes:
Group GroupYear Year
ended ended2006 2005
£m £m
Deferred tax liabilities 3.3 2.1 Deferred tax assets (0.1) (0.1)
3.2 2.0
At the Balance Sheet date, the Group has unused tax losses of £35.0m (2005 – £36.6m) available for offset against future profits. A deferred tax asset has been recognised in respect of £10.2m (2005 – £12.5m) of such losses. No deferred tax asset has been recognised in respect of the remaining £24.8m (2005 – £24.1m) due to the unpredictability of future profit streams. Included in unrecognised tax losses are losses of £1.4m (2005 – £5.2m) that will expire within 7 years (2005 – 20 years). Other losses may be carried forward indefinitely.
At the Balance Sheet date, the aggregate amount of temporary differences associated with undistributed earnings of subsidiaries for which deferredtax liabilities have not been recognised was £214.1m (2005 – £107.6m). No liability has been recognised in respect of these differences becausethe Group is in a position to control the timing of the reversal of the temporary differences and it is probable that such differences will not reversein the foreseeable future.
In addition, at the Balance Sheet date, the Group has deductible temporary differences, for which no deferred tax asset has been recognised, in respect of retirement benefit obligations of £34.4m (2005 – £36.7m), share-based payments of £1.7m (2005 – £1.5m), accelerated bookdepreciation of £2.4m (2005 – £6.2m) and other temporary differences of £nil (2005 – £2.3m). The Company has deductible temporary differences,for which no deferred tax asset has been recognised, in respect of retirement benefit obligations of £30.8m (2005 – £31.3m), share-basedpayments of £0.5m (2005 – £0.3m), accelerated book depreciation of £0.5m (2005 – £0.3m) and other temporary differences of £0.5m (2005 – £0.5m). Deferred tax assets have not been recognised in respect of these differences due to the unpredictability of both the timing of the reversal of these temporary differences and of the future profit streams in the entities concerned.
At the Balance Sheet date, the Group and Company have £5.0m (2005 – £5.0m) of surplus ACT previously written off, for which no deferred taxasset has been recognised as it is unlikely to be recovered in the foreseeable future due to the anticipated ongoing level of dividend payments and UK earnings. The Group also has £14.4m (2005 – £16.3m) of unused capital losses available for offset against future capital gains for whichno deferred tax asset has been recognised as no such capital gains are anticipated to arise in the foreseeable future. The Company has £15.6m(2005 – £17.4m) of such unused capital losses.
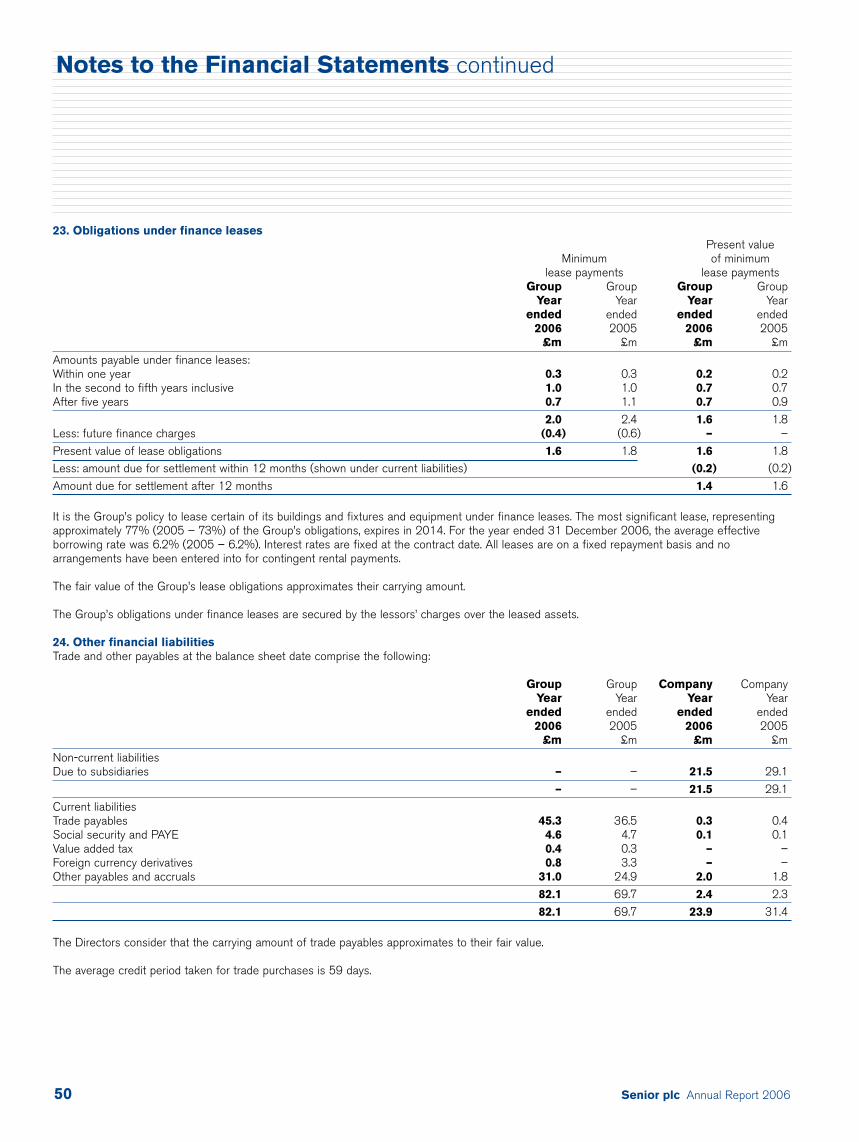
Senior plc Annual Report 200650
23. Obligations under finance leasesPresent value
Minimum of minimumlease payments lease payments
Group Group Group GroupYear Year Year Year
ended ended ended ended 2006 2005 2006 2005
£m £m £m £m
Amounts payable under finance leases:Within one year 0.3 0.3 0.2 0.2In the second to fifth years inclusive 1.0 1.0 0.7 0.7After five years 0.7 1.1 0.7 0.9
2.0 2.4 1.6 1.8Less: future finance charges (0.4) (0.6) – –
Present value of lease obligations 1.6 1.8 1.6 1.8Less: amount due for settlement within 12 months (shown under current liabilities) (0.2) (0.2)
Amount due for settlement after 12 months 1.4 1.6
It is the Group’s policy to lease certain of its buildings and fixtures and equipment under finance leases. The most significant lease, representingapproximately 77% (2005 – 73%) of the Group’s obligations, expires in 2014. For the year ended 31 December 2006, the average effectiveborrowing rate was 6.2% (2005 – 6.2%). Interest rates are fixed at the contract date. All leases are on a fixed repayment basis and noarrangements have been entered into for contingent rental payments.
The fair value of the Group’s lease obligations approximates their carrying amount.
The Group’s obligations under finance leases are secured by the lessors’ charges over the leased assets.
24. Other financial liabilitiesTrade and other payables at the balance sheet date comprise the following:
Group Group Company CompanyYear Year Year Year
ended ended ended ended 2006 2005 2006 2005
£m £m £m £m
Non-current liabilities Due to subsidiaries – – 21.5 29.1
– – 21.5 29.1
Current liabilitiesTrade payables 45.3 36.5 0.3 0.4Social security and PAYE 4.6 4.7 0.1 0.1Value added tax 0.4 0.3 – –Foreign currency derivatives 0.8 3.3 – –Other payables and accruals 31.0 24.9 2.0 1.8
82.1 69.7 2.4 2.3
82.1 69.7 23.9 31.4
The Directors consider that the carrying amount of trade payables approximates to their fair value.
The average credit period taken for trade purchases is 59 days.
Notes to the Financial Statements continued
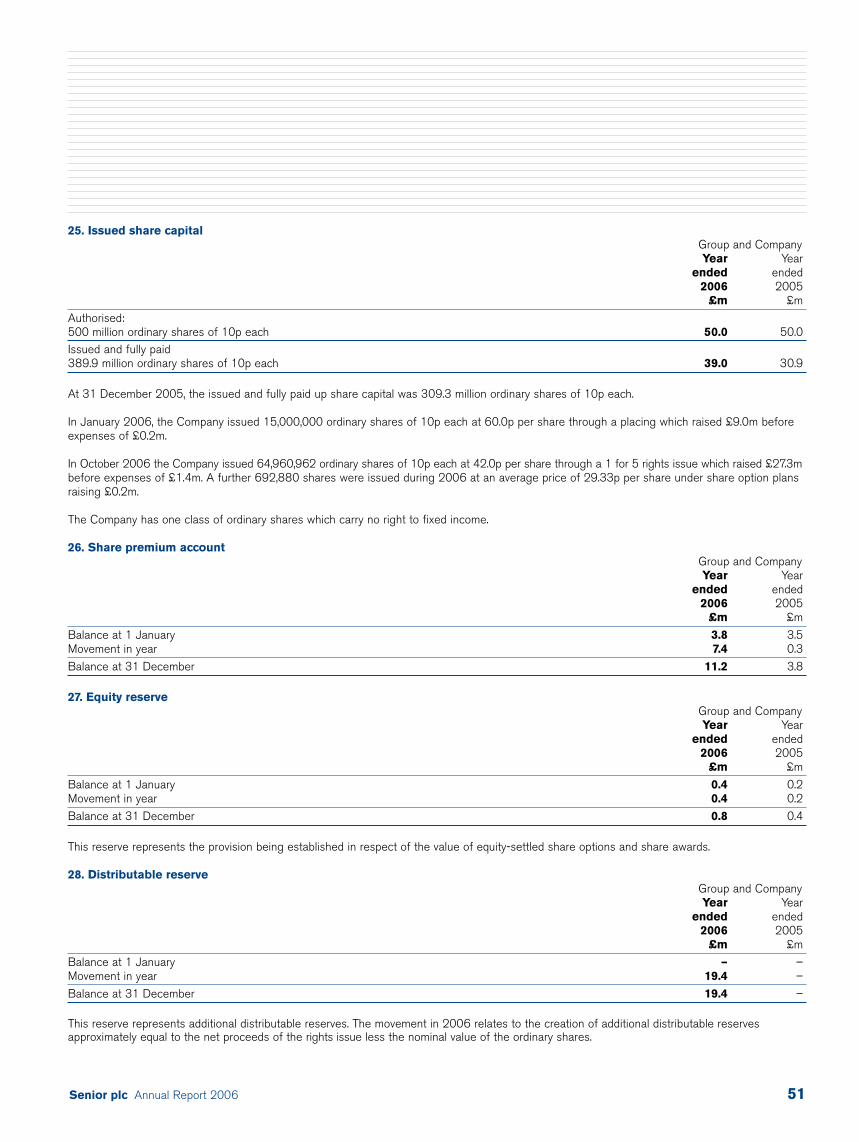
Senior plc Annual Report 2006 51
25. Issued share capitalGroup and CompanyYear Year
ended ended2006 2005
£m £m
Authorised:500 million ordinary shares of 10p each 50.0 50.0Issued and fully paid389.9 million ordinary shares of 10p each 39.0 30.9
At 31 December 2005, the issued and fully paid up share capital was 309.3 million ordinary shares of 10p each.
In January 2006, the Company issued 15,000,000 ordinary shares of 10p each at 60.0p per share through a placing which raised £9.0m beforeexpenses of £0.2m.
In October 2006 the Company issued 64,960,962 ordinary shares of 10p each at 42.0p per share through a 1 for 5 rights issue which raised £27.3mbefore expenses of £1.4m. A further 692,880 shares were issued during 2006 at an average price of 29.33p per share under share option plansraising £0.2m.
The Company has one class of ordinary shares which carry no right to fixed income.
26. Share premium accountGroup and CompanyYear Year
ended ended2006 2005
£m £m
Balance at 1 January 3.8 3.5Movement in year 7.4 0.3
Balance at 31 December 11.2 3.8
27. Equity reserveGroup and CompanyYear Year
ended ended2006 2005
£m £m
Balance at 1 January 0.4 0.2Movement in year 0.4 0.2
Balance at 31 December 0.8 0.4
This reserve represents the provision being established in respect of the value of equity-settled share options and share awards.
28. Distributable reserveGroup and CompanyYear Year
ended ended2006 2005
£m £m
Balance at 1 January – –Movement in year 19.4 –
Balance at 31 December 19.4 –
This reserve represents additional distributable reserves. The movement in 2006 relates to the creation of additional distributable reservesapproximately equal to the net proceeds of the rights issue less the nominal value of the ordinary shares.
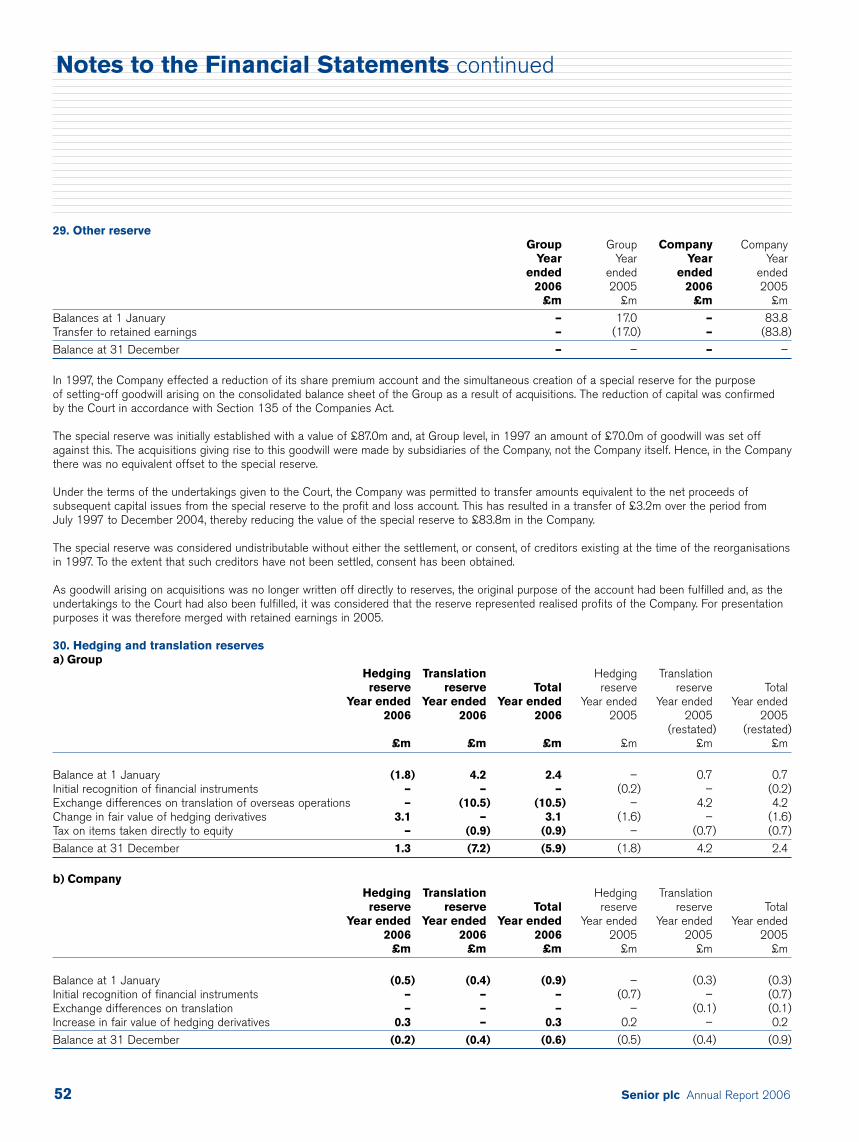
Senior plc Annual Report 200652
29. Other reserveGroup Group Company Company
Year Year Year Yearended ended ended ended
2006 2005 2006 2005£m £m £m £m
Balances at 1 January – 17.0 – 83.8Transfer to retained earnings – (17.0) – (83.8)
Balance at 31 December – – – –
In 1997, the Company effected a reduction of its share premium account and the simultaneous creation of a special reserve for the purpose of setting-off goodwill arising on the consolidated balance sheet of the Group as a result of acquisitions. The reduction of capital was confirmed by the Court in accordance with Section 135 of the Companies Act.
The special reserve was initially established with a value of £87.0m and, at Group level, in 1997 an amount of £70.0m of goodwill was set offagainst this. The acquisitions giving rise to this goodwill were made by subsidiaries of the Company, not the Company itself. Hence, in the Companythere was no equivalent offset to the special reserve.
Under the terms of the undertakings given to the Court, the Company was permitted to transfer amounts equivalent to the net proceeds ofsubsequent capital issues from the special reserve to the profit and loss account. This has resulted in a transfer of £3.2m over the period from July 1997 to December 2004, thereby reducing the value of the special reserve to £83.8m in the Company.
The special reserve was considered undistributable without either the settlement, or consent, of creditors existing at the time of the reorganisationsin 1997. To the extent that such creditors have not been settled, consent has been obtained.
As goodwill arising on acquisitions was no longer written off directly to reserves, the original purpose of the account had been fulfilled and, as theundertakings to the Court had also been fulfilled, it was considered that the reserve represented realised profits of the Company. For presentationpurposes it was therefore merged with retained earnings in 2005.
30. Hedging and translation reservesa) Group
Hedging Translation Hedging Translationreserve reserve Total reserve reserve Total
Year ended Year ended Year ended Year ended Year ended Year ended2006 2006 2006 2005 2005 2005
(restated) (restated)£m £m £m £m £m £m
Balance at 1 January (1.8) 4.2 2.4 – 0.7 0.7Initial recognition of financial instruments – – – (0.2) – (0.2)Exchange differences on translation of overseas operations – (10.5) (10.5) – 4.2 4.2Change in fair value of hedging derivatives 3.1 – 3.1 (1.6) – (1.6)Tax on items taken directly to equity – (0.9) (0.9) – (0.7) (0.7)
Balance at 31 December 1.3 (7.2) (5.9) (1.8) 4.2 2.4
b) CompanyHedging Translation Hedging Translationreserve reserve Total reserve reserve Total
Year ended Year ended Year ended Year ended Year ended Year ended2006 2006 2006 2005 2005 2005
£m £m £m £m £m £m
Balance at 1 January (0.5) (0.4) (0.9) – (0.3) (0.3)Initial recognition of financial instruments – – – (0.7) – (0.7)Exchange differences on translation – – – – (0.1) (0.1)Increase in fair value of hedging derivatives 0.3 – 0.3 0.2 – 0.2
Balance at 31 December (0.2) (0.4) (0.6) (0.5) (0.4) (0.9)
Notes to the Financial Statements continued
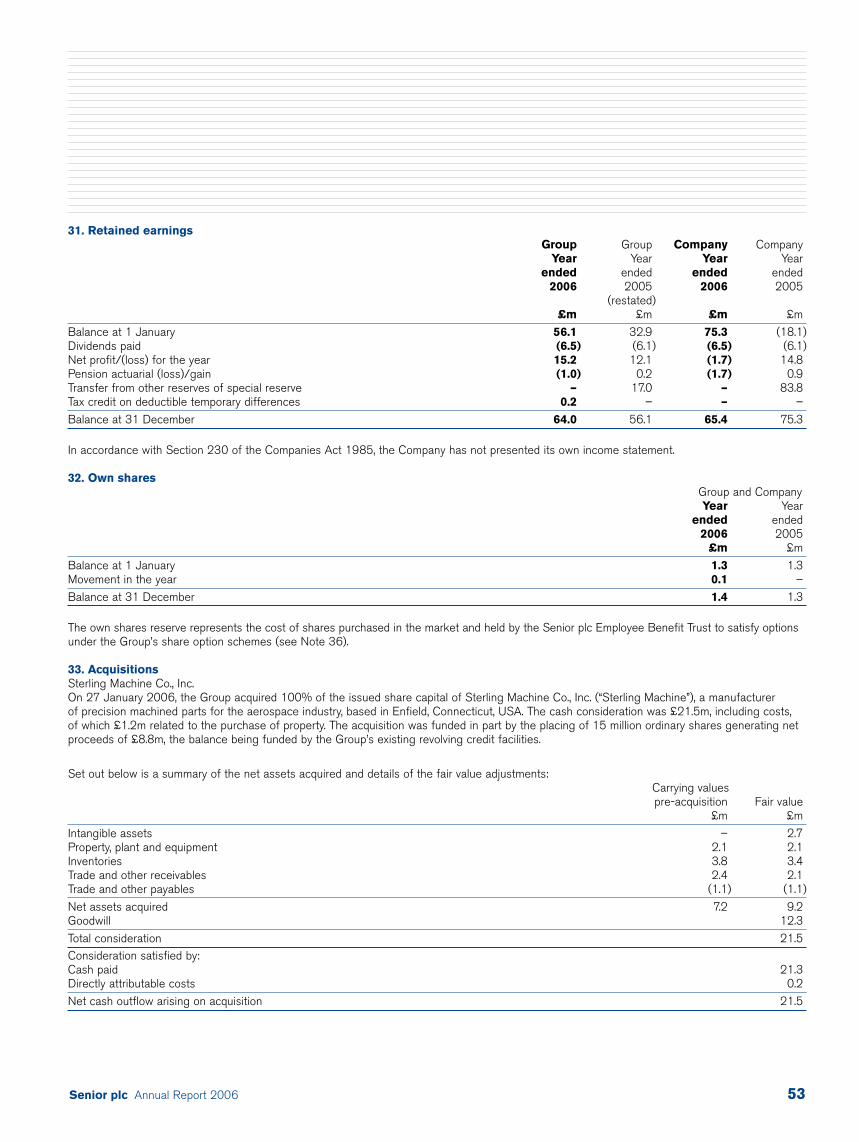
Senior plc Annual Report 2006 53
31. Retained earningsGroup Group Company Company
Year Year Year Yearended ended ended ended
2006 2005 2006 2005(restated)
£m £m £m £m
Balance at 1 January 56.1 32.9 75.3 (18.1)Dividends paid (6.5) (6.1) (6.5) (6.1)Net profit/(loss) for the year 15.2 12.1 (1.7) 14.8Pension actuarial (loss)/gain (1.0) 0.2 (1.7) 0.9Transfer from other reserves of special reserve – 17.0 – 83.8Tax credit on deductible temporary differences 0.2 – – –
Balance at 31 December 64.0 56.1 65.4 75.3
In accordance with Section 230 of the Companies Act 1985, the Company has not presented its own income statement.
32. Own sharesGroup and CompanyYear Year
ended ended2006 2005
£m £m
Balance at 1 January 1.3 1.3Movement in the year 0.1 –
Balance at 31 December 1.4 1.3
The own shares reserve represents the cost of shares purchased in the market and held by the Senior plc Employee Benefit Trust to satisfy optionsunder the Group’s share option schemes (see Note 36).
33. AcquisitionsSterling Machine Co., Inc.On 27 January 2006, the Group acquired 100% of the issued share capital of Sterling Machine Co., Inc. (“Sterling Machine”), a manufacturer of precision machined parts for the aerospace industry, based in Enfield, Connecticut, USA. The cash consideration was £21.5m, including costs, of which £1.2m related to the purchase of property. The acquisition was funded in part by the placing of 15 million ordinary shares generating netproceeds of £8.8m, the balance being funded by the Group’s existing revolving credit facilities.
Set out below is a summary of the net assets acquired and details of the fair value adjustments:Carrying valuespre-acquisition Fair value
£m £m
Intangible assets – 2.7Property, plant and equipment 2.1 2.1 Inventories 3.8 3.4 Trade and other receivables 2.4 2.1 Trade and other payables (1.1) (1.1)
Net assets acquired 7.2 9.2Goodwill 12.3
Total consideration 21.5Consideration satisfied by:Cash paid 21.3Directly attributable costs 0.2
Net cash outflow arising on acquisition 21.5
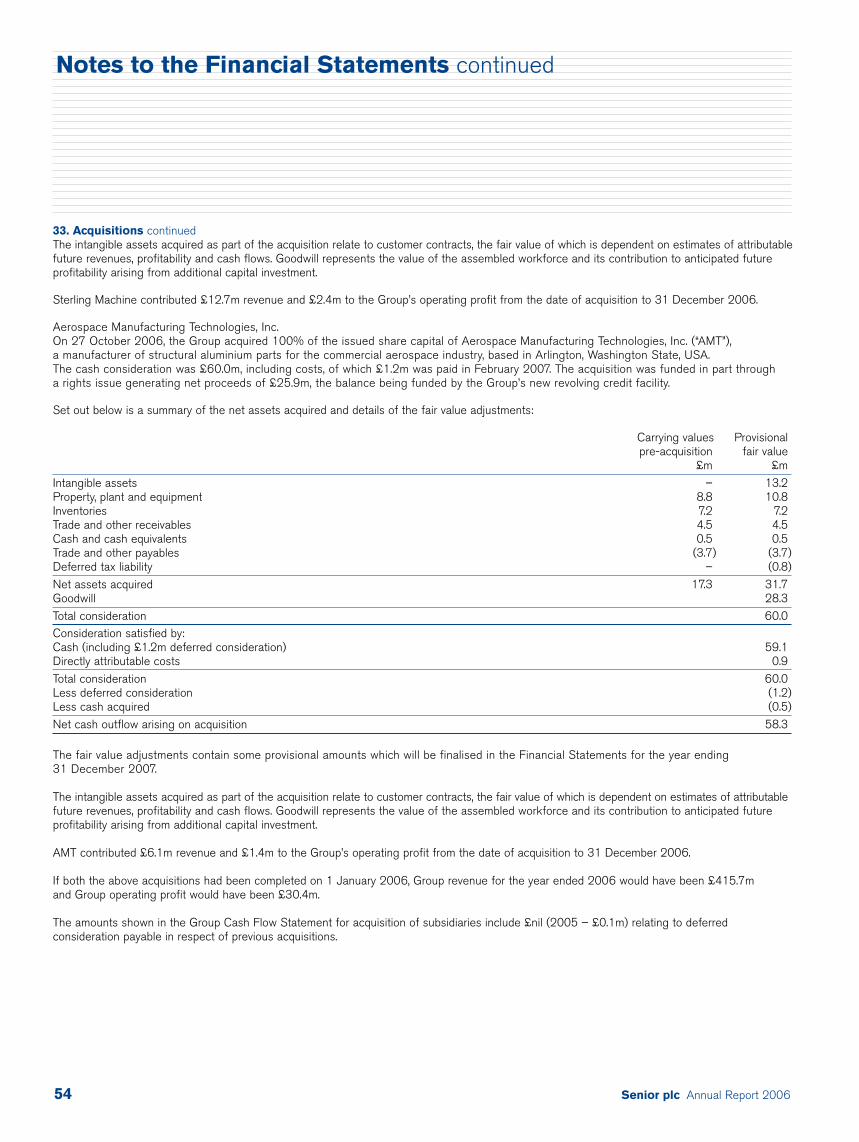
Senior plc Annual Report 200654
33. Acquisitions continuedThe intangible assets acquired as part of the acquisition relate to customer contracts, the fair value of which is dependent on estimates of attributablefuture revenues, profitability and cash flows. Goodwill represents the value of the assembled workforce and its contribution to anticipated futureprofitability arising from additional capital investment.
Sterling Machine contributed £12.7m revenue and £2.4m to the Group’s operating profit from the date of acquisition to 31 December 2006.
Aerospace Manufacturing Technologies, Inc.On 27 October 2006, the Group acquired 100% of the issued share capital of Aerospace Manufacturing Technologies, Inc. (“AMT”), a manufacturer of structural aluminium parts for the commercial aerospace industry, based in Arlington, Washington State, USA. The cash consideration was £60.0m, including costs, of which £1.2m was paid in February 2007. The acquisition was funded in part through a rights issue generating net proceeds of £25.9m, the balance being funded by the Group’s new revolving credit facility.
Set out below is a summary of the net assets acquired and details of the fair value adjustments:
Carrying values Provisionalpre-acquisition fair value
£m £m
Intangible assets – 13.2Property, plant and equipment 8.8 10.8Inventories 7.2 7.2Trade and other receivables 4.5 4.5Cash and cash equivalents 0.5 0.5Trade and other payables (3.7) (3.7)Deferred tax liability – (0.8)
Net assets acquired 17.3 31.7Goodwill 28.3
Total consideration 60.0Consideration satisfied by:Cash (including £1.2m deferred consideration) 59.1Directly attributable costs 0.9
Total consideration 60.0Less deferred consideration (1.2)Less cash acquired (0.5)
Net cash outflow arising on acquisition 58.3
The fair value adjustments contain some provisional amounts which will be finalised in the Financial Statements for the year ending31 December 2007.
The intangible assets acquired as part of the acquisition relate to customer contracts, the fair value of which is dependent on estimates of attributablefuture revenues, profitability and cash flows. Goodwill represents the value of the assembled workforce and its contribution to anticipated futureprofitability arising from additional capital investment.
AMT contributed £6.1m revenue and £1.4m to the Group’s operating profit from the date of acquisition to 31 December 2006.
If both the above acquisitions had been completed on 1 January 2006, Group revenue for the year ended 2006 would have been £415.7m and Group operating profit would have been £30.4m.
The amounts shown in the Group Cash Flow Statement for acquisition of subsidiaries include £nil (2005 – £0.1m) relating to deferredconsideration payable in respect of previous acquisitions.
Notes to the Financial Statements continued
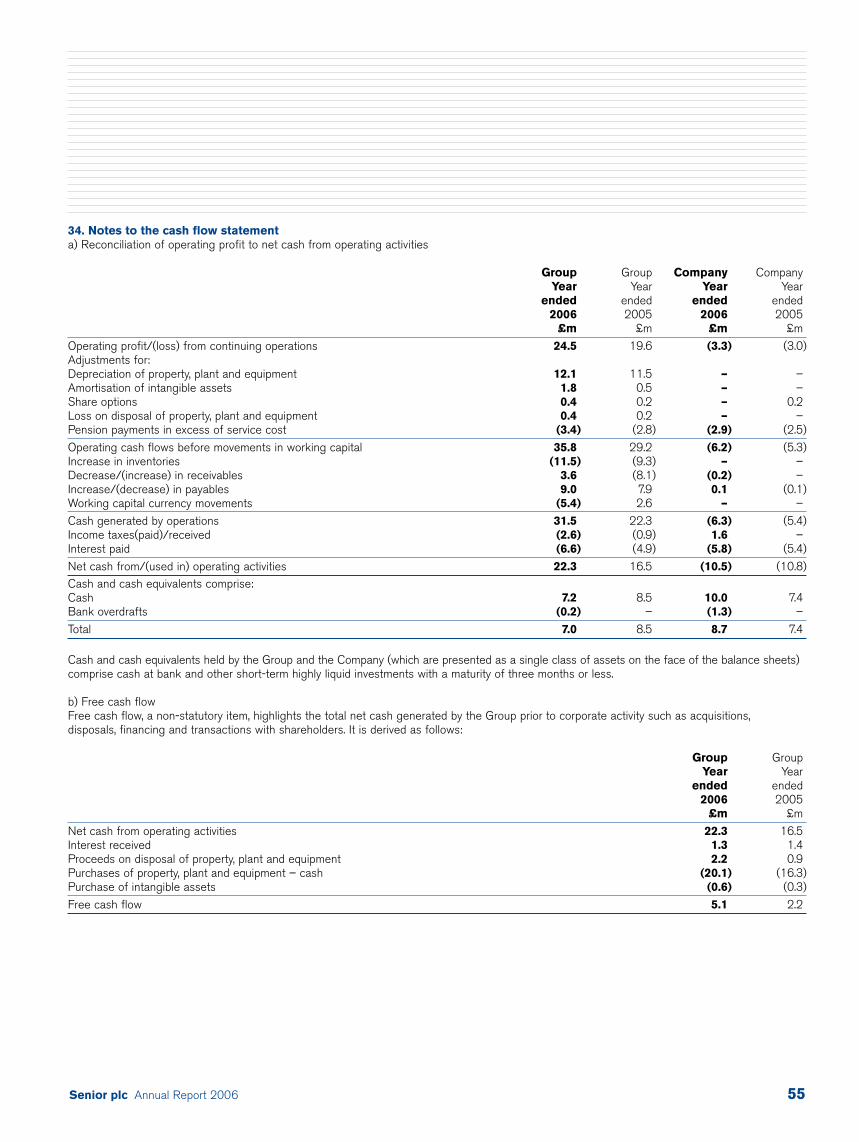
Senior plc Annual Report 2006 55
34. Notes to the cash flow statementa) Reconciliation of operating profit to net cash from operating activities
Group Group Company CompanyYear Year Year Year
ended ended ended ended2006 2005 2006 2005
£m £m £m £m
Operating profit/(loss) from continuing operations 24.5 19.6 (3.3) (3.0)Adjustments for:Depreciation of property, plant and equipment 12.1 11.5 – –Amortisation of intangible assets 1.8 0.5 – –Share options 0.4 0.2 – 0.2Loss on disposal of property, plant and equipment 0.4 0.2 – –Pension payments in excess of service cost (3.4) (2.8) (2.9) (2.5)
Operating cash flows before movements in working capital 35.8 29.2 (6.2) (5.3)Increase in inventories (11.5) (9.3) – –Decrease/(increase) in receivables 3.6 (8.1) (0.2) –Increase/(decrease) in payables 9.0 7.9 0.1 (0.1)Working capital currency movements (5.4) 2.6 – –
Cash generated by operations 31.5 22.3 (6.3) (5.4)Income taxes(paid)/received (2.6) (0.9) 1.6 –Interest paid (6.6) (4.9) (5.8) (5.4)
Net cash from/(used in) operating activities 22.3 16.5 (10.5) (10.8)Cash and cash equivalents comprise:Cash 7.2 8.5 10.0 7.4Bank overdrafts (0.2) – (1.3) –
Total 7.0 8.5 8.7 7.4
Cash and cash equivalents held by the Group and the Company (which are presented as a single class of assets on the face of the balance sheets)comprise cash at bank and other short-term highly liquid investments with a maturity of three months or less.
b) Free cash flowFree cash flow, a non-statutory item, highlights the total net cash generated by the Group prior to corporate activity such as acquisitions, disposals, financing and transactions with shareholders. It is derived as follows:
Group GroupYear Year
ended ended2006 2005
£m £m
Net cash from operating activities 22.3 16.5Interest received 1.3 1.4Proceeds on disposal of property, plant and equipment 2.2 0.9Purchases of property, plant and equipment – cash (20.1) (16.3)Purchase of intangible assets (0.6) (0.3)
Free cash flow 5.1 2.2
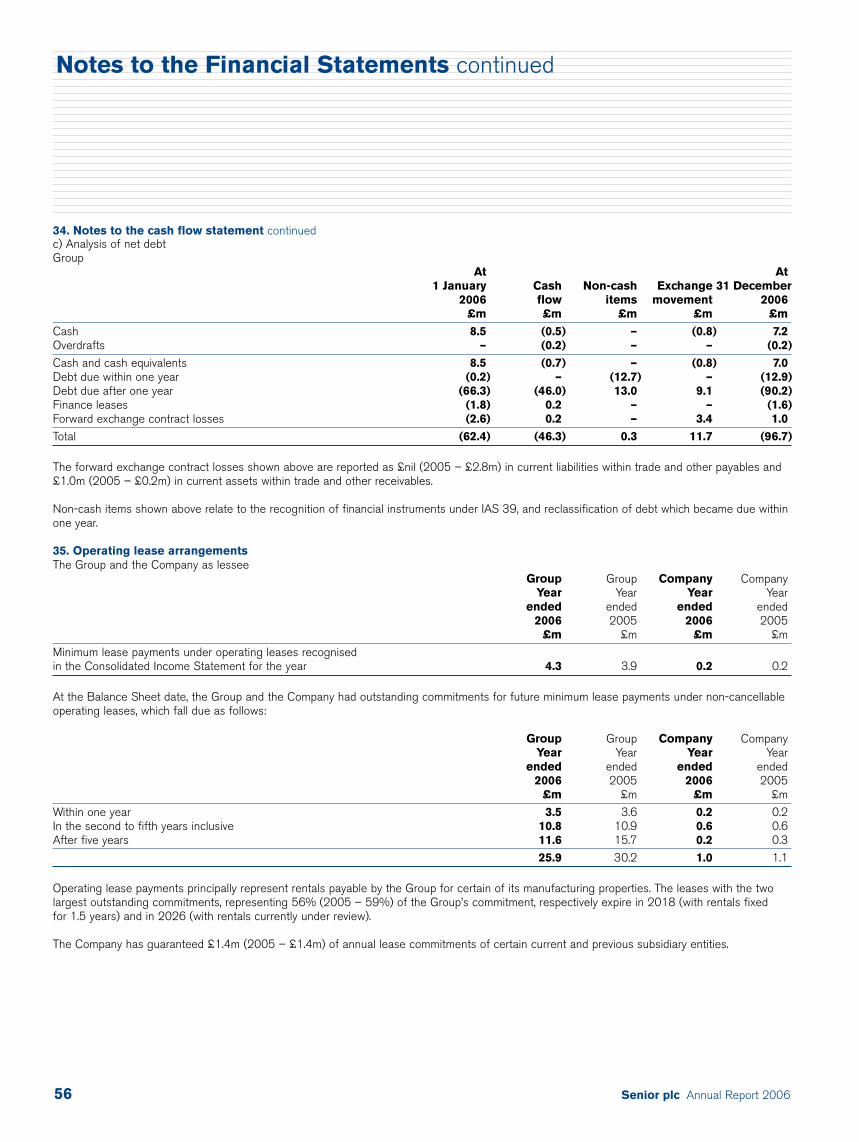
Senior plc Annual Report 200656
34. Notes to the cash flow statement continuedc) Analysis of net debtGroup
At At1 January Cash Non-cash Exchange 31 December
2006 flow items movement 2006£m £m £m £m £m
Cash 8.5 (0.5) – (0.8) 7.2Overdrafts – (0.2) – – (0.2)
Cash and cash equivalents 8.5 (0.7) – (0.8) 7.0Debt due within one year (0.2) – (12.7) – (12.9)Debt due after one year (66.3) (46.0) 13.0 9.1 (90.2)Finance leases (1.8) 0.2 – – (1.6)Forward exchange contract losses (2.6) 0.2 – 3.4 1.0
Total (62.4) (46.3) 0.3 11.7 (96.7)
The forward exchange contract losses shown above are reported as £nil (2005 – £2.8m) in current liabilities within trade and other payables and£1.0m (2005 – £0.2m) in current assets within trade and other receivables.
Non-cash items shown above relate to the recognition of financial instruments under IAS 39, and reclassification of debt which became due withinone year.
35. Operating lease arrangementsThe Group and the Company as lessee
Group Group Company CompanyYear Year Year Year
ended ended ended ended2006 2005 2006 2005
£m £m £m £m
Minimum lease payments under operating leases recognised in the Consolidated Income Statement for the year 4.3 3.9 0.2 0.2
At the Balance Sheet date, the Group and the Company had outstanding commitments for future minimum lease payments under non-cancellableoperating leases, which fall due as follows:
Group Group Company CompanyYear Year Year Year
ended ended ended ended2006 2005 2006 2005
£m £m £m £m
Within one year 3.5 3.6 0.2 0.2In the second to fifth years inclusive 10.8 10.9 0.6 0.6After five years 11.6 15.7 0.2 0.3
25.9 30.2 1.0 1.1
Operating lease payments principally represent rentals payable by the Group for certain of its manufacturing properties. The leases with the twolargest outstanding commitments, representing 56% (2005 – 59%) of the Group’s commitment, respectively expire in 2018 (with rentals fixed for 1.5 years) and in 2026 (with rentals currently under review).
The Company has guaranteed £1.4m (2005 – £1.4m) of annual lease commitments of certain current and previous subsidiary entities.
Notes to the Financial Statements continued
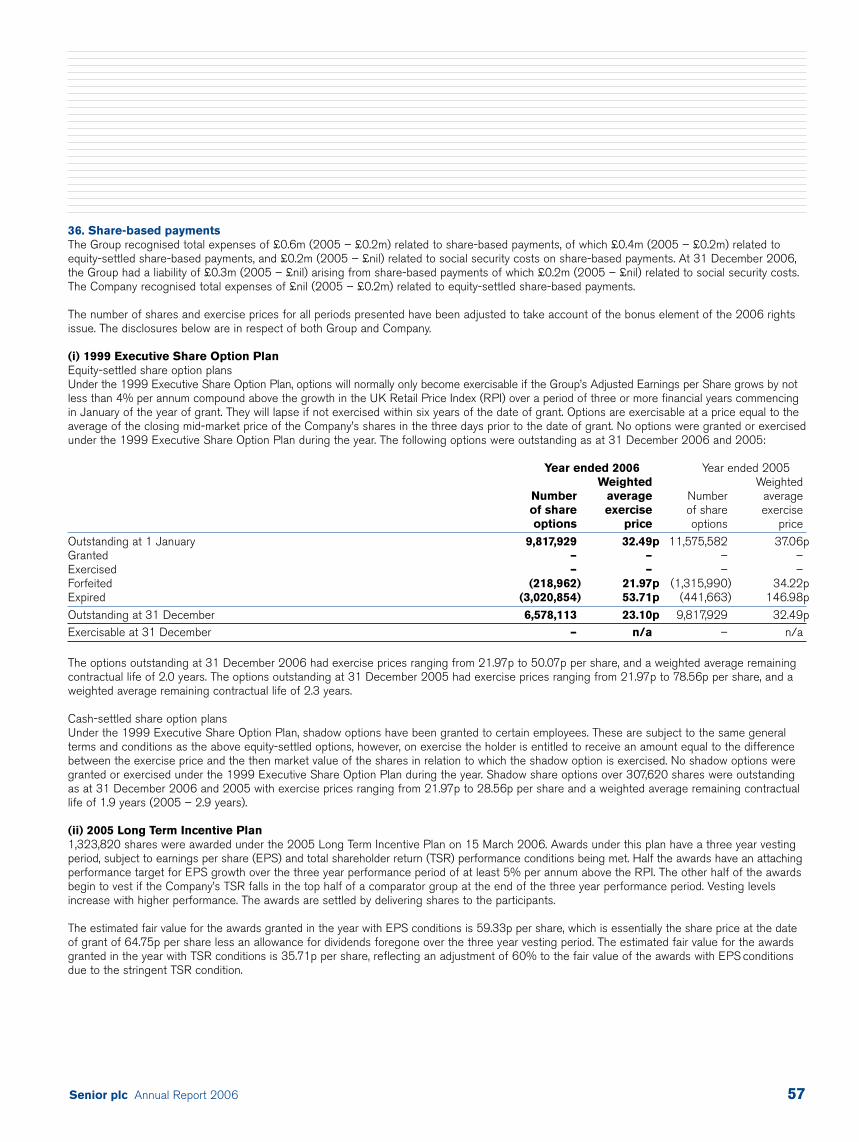
Senior plc Annual Report 2006 57
36. Share-based paymentsThe Group recognised total expenses of £0.6m (2005 – £0.2m) related to share-based payments, of which £0.4m (2005 – £0.2m) related toequity-settled share-based payments, and £0.2m (2005 – £nil) related to social security costs on share-based payments. At 31 December 2006,the Group had a liability of £0.3m (2005 – £nil) arising from share-based payments of which £0.2m (2005 – £nil) related to social security costs.The Company recognised total expenses of £nil (2005 – £0.2m) related to equity-settled share-based payments.
The number of shares and exercise prices for all periods presented have been adjusted to take account of the bonus element of the 2006 rightsissue. The disclosures below are in respect of both Group and Company.
(i) 1999 Executive Share Option PlanEquity-settled share option plansUnder the 1999 Executive Share Option Plan, options will normally only become exercisable if the Group’s Adjusted Earnings per Share grows by notless than 4% per annum compound above the growth in the UK Retail Price Index (RPI) over a period of three or more financial years commencingin January of the year of grant. They will lapse if not exercised within six years of the date of grant. Options are exercisable at a price equal to theaverage of the closing mid-market price of the Company’s shares in the three days prior to the date of grant. No options were granted or exercisedunder the 1999 Executive Share Option Plan during the year. The following options were outstanding as at 31 December 2006 and 2005:
Year ended 2006 Year ended 2005Weighted Weighted
Number average Number average of share exercise of share exerciseoptions price options price
Outstanding at 1 January 9,817,929 32.49p 11,575,582 37.06pGranted – – – –Exercised – – – –Forfeited (218,962) 21.97p (1,315,990) 34.22pExpired (3,020,854) 53.71p (441,663) 146.98p
Outstanding at 31 December 6,578,113 23.10p 9,817,929 32.49pExercisable at 31 December – n/a – n/a
The options outstanding at 31 December 2006 had exercise prices ranging from 21.97p to 50.07p per share, and a weighted average remainingcontractual life of 2.0 years. The options outstanding at 31 December 2005 had exercise prices ranging from 21.97p to 78.56p per share, and aweighted average remaining contractual life of 2.3 years.
Cash-settled share option plansUnder the 1999 Executive Share Option Plan, shadow options have been granted to certain employees. These are subject to the same generalterms and conditions as the above equity-settled options, however, on exercise the holder is entitled to receive an amount equal to the differencebetween the exercise price and the then market value of the shares in relation to which the shadow option is exercised. No shadow options weregranted or exercised under the 1999 Executive Share Option Plan during the year. Shadow share options over 307,620 shares were outstandingas at 31 December 2006 and 2005 with exercise prices ranging from 21.97p to 28.56p per share and a weighted average remaining contractuallife of 1.9 years (2005 – 2.9 years).
(ii) 2005 Long Term Incentive Plan1,323,820 shares were awarded under the 2005 Long Term Incentive Plan on 15 March 2006. Awards under this plan have a three year vestingperiod, subject to earnings per share (EPS) and total shareholder return (TSR) performance conditions being met. Half the awards have an attachingperformance target for EPS growth over the three year performance period of at least 5% per annum above the RPI. The other half of the awardsbegin to vest if the Company’s TSR falls in the top half of a comparator group at the end of the three year performance period. Vesting levelsincrease with higher performance. The awards are settled by delivering shares to the participants.
The estimated fair value for the awards granted in the year with EPS conditions is 59.33p per share, which is essentially the share price at the dateof grant of 64.75p per share less an allowance for dividends foregone over the three year vesting period. The estimated fair value for the awardsgranted in the year with TSR conditions is 35.71p per share, reflecting an adjustment of 60% to the fair value of the awards with EPS conditionsdue to the stringent TSR condition.
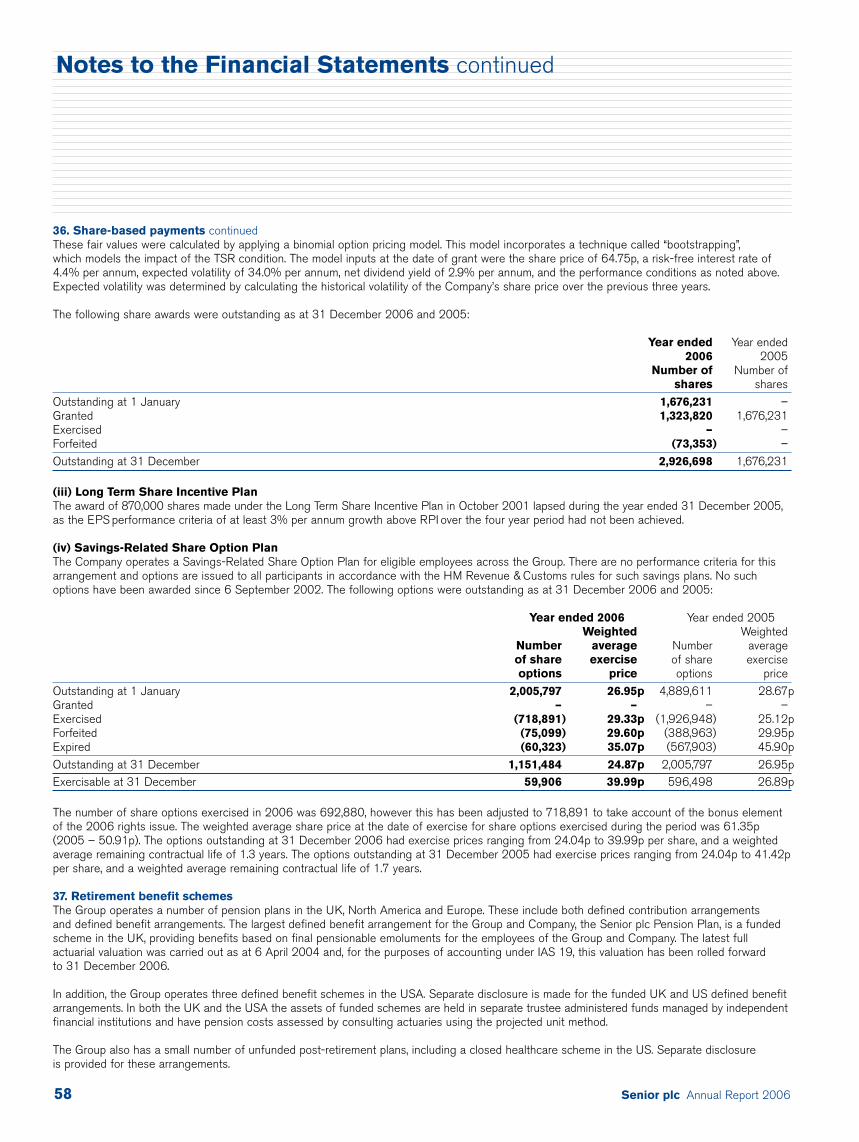
Senior plc Annual Report 200658
36. Share-based payments continuedThese fair values were calculated by applying a binomial option pricing model. This model incorporates a technique called “bootstrapping”, which models the impact of the TSR condition. The model inputs at the date of grant were the share price of 64.75p, a risk-free interest rate of4.4% per annum, expected volatility of 34.0% per annum, net dividend yield of 2.9% per annum, and the performance conditions as noted above.Expected volatility was determined by calculating the historical volatility of the Company’s share price over the previous three years.
The following share awards were outstanding as at 31 December 2006 and 2005:
Year ended Year ended2006 2005
Number of Number ofshares shares
Outstanding at 1 January 1,676,231 –Granted 1,323,820 1,676,231Exercised – –Forfeited (73,353) –
Outstanding at 31 December 2,926,698 1,676,231
(iii) Long Term Share Incentive PlanThe award of 870,000 shares made under the Long Term Share Incentive Plan in October 2001 lapsed during the year ended 31 December 2005,as the EPS performance criteria of at least 3% per annum growth above RPI over the four year period had not been achieved.
(iv) Savings-Related Share Option PlanThe Company operates a Savings-Related Share Option Plan for eligible employees across the Group. There are no performance criteria for thisarrangement and options are issued to all participants in accordance with the HM Revenue & Customs rules for such savings plans. No suchoptions have been awarded since 6 September 2002. The following options were outstanding as at 31 December 2006 and 2005:
Year ended 2006 Year ended 2005Weighted Weighted
Number average Number average of share exercise of share exerciseoptions price options price
Outstanding at 1 January 2,005,797 26.95p 4,889,611 28.67pGranted – – – –Exercised (718,891) 29.33p (1,926,948) 25.12pForfeited (75,099) 29.60p (388,963) 29.95pExpired (60,323) 35.07p (567,903) 45.90p
Outstanding at 31 December 1,151,484 24.87p 2,005,797 26.95pExercisable at 31 December 59,906 39.99p 596,498 26.89p
The number of share options exercised in 2006 was 692,880, however this has been adjusted to 718,891 to take account of the bonus element of the 2006 rights issue. The weighted average share price at the date of exercise for share options exercised during the period was 61.35p(2005 – 50.91p). The options outstanding at 31 December 2006 had exercise prices ranging from 24.04p to 39.99p per share, and a weightedaverage remaining contractual life of 1.3 years. The options outstanding at 31 December 2005 had exercise prices ranging from 24.04p to 41.42pper share, and a weighted average remaining contractual life of 1.7 years.
37. Retirement benefit schemesThe Group operates a number of pension plans in the UK, North America and Europe. These include both defined contribution arrangements and defined benefit arrangements. The largest defined benefit arrangement for the Group and Company, the Senior plc Pension Plan, is a fundedscheme in the UK, providing benefits based on final pensionable emoluments for the employees of the Group and Company. The latest fullactuarial valuation was carried out as at 6 April 2004 and, for the purposes of accounting under IAS 19, this valuation has been rolled forward to 31 December 2006.
In addition, the Group operates three defined benefit schemes in the USA. Separate disclosure is made for the funded UK and US defined benefitarrangements. In both the UK and the USA the assets of funded schemes are held in separate trustee administered funds managed by independentfinancial institutions and have pension costs assessed by consulting actuaries using the projected unit method.
The Group also has a small number of unfunded post-retirement plans, including a closed healthcare scheme in the US. Separate disclosure is provided for these arrangements.
Notes to the Financial Statements continued
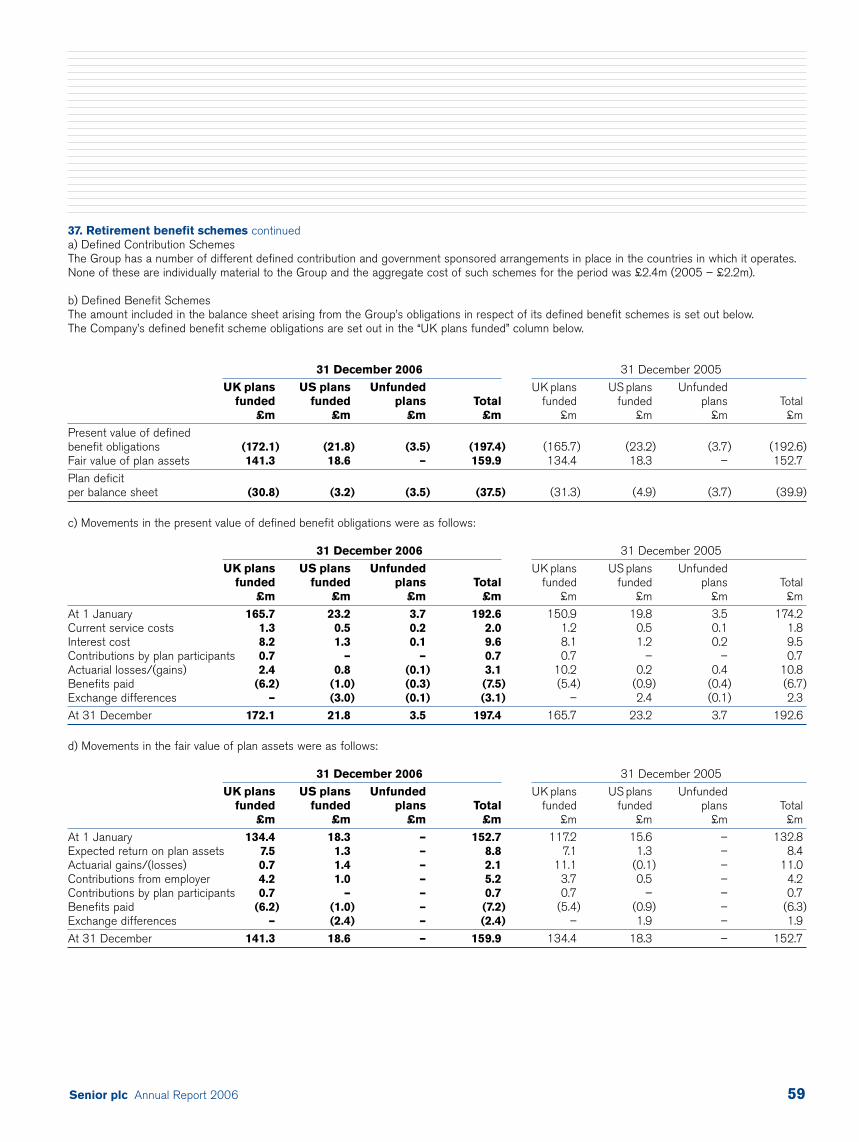
Senior plc Annual Report 2006 59
37. Retirement benefit schemes continueda) Defined Contribution SchemesThe Group has a number of different defined contribution and government sponsored arrangements in place in the countries in which it operates.None of these are individually material to the Group and the aggregate cost of such schemes for the period was £2.4m (2005 – £2.2m).
b) Defined Benefit SchemesThe amount included in the balance sheet arising from the Group’s obligations in respect of its defined benefit schemes is set out below. The Company’s defined benefit scheme obligations are set out in the “UK plans funded” column below.
31 December 2006 31 December 2005
UK plans US plans Unfunded UK plans US plans Unfundedfunded funded plans Total funded funded plans Total
£m £m £m £m £m £m £m £m
Present value of defined benefit obligations (172.1) (21.8) (3.5) (197.4) (165.7) (23.2) (3.7) (192.6)Fair value of plan assets 141.3 18.6 – 159.9 134.4 18.3 – 152.7
Plan deficitper balance sheet (30.8) (3.2) (3.5) (37.5) (31.3) (4.9) (3.7) (39.9)
c) Movements in the present value of defined benefit obligations were as follows:
31 December 2006 31 December 2005
UK plans US plans Unfunded UK plans US plans Unfundedfunded funded plans Total funded funded plans Total
£m £m £m £m £m £m £m £m
At 1 January 165.7 23.2 3.7 192.6 150.9 19.8 3.5 174.2Current service costs 1.3 0.5 0.2 2.0 1.2 0.5 0.1 1.8Interest cost 8.2 1.3 0.1 9.6 8.1 1.2 0.2 9.5Contributions by plan participants 0.7 – – 0.7 0.7 – – 0.7Actuarial losses/(gains) 2.4 0.8 (0.1) 3.1 10.2 0.2 0.4 10.8Benefits paid (6.2) (1.0) (0.3) (7.5) (5.4) (0.9) (0.4) (6.7)Exchange differences – (3.0) (0.1) (3.1) – 2.4 (0.1) 2.3
At 31 December 172.1 21.8 3.5 197.4 165.7 23.2 3.7 192.6
d) Movements in the fair value of plan assets were as follows:
31 December 2006 31 December 2005
UK plans US plans Unfunded UK plans US plans Unfundedfunded funded plans Total funded funded plans Total
£m £m £m £m £m £m £m £m
At 1 January 134.4 18.3 – 152.7 117.2 15.6 – 132.8Expected return on plan assets 7.5 1.3 – 8.8 7.1 1.3 – 8.4Actuarial gains/(losses) 0.7 1.4 – 2.1 11.1 (0.1) – 11.0Contributions from employer 4.2 1.0 – 5.2 3.7 0.5 – 4.2Contributions by plan participants 0.7 – – 0.7 0.7 – – 0.7Benefits paid (6.2) (1.0) – (7.2) (5.4) (0.9) – (6.3)Exchange differences – (2.4) – (2.4) – 1.9 – 1.9
At 31 December 141.3 18.6 – 159.9 134.4 18.3 – 152.7
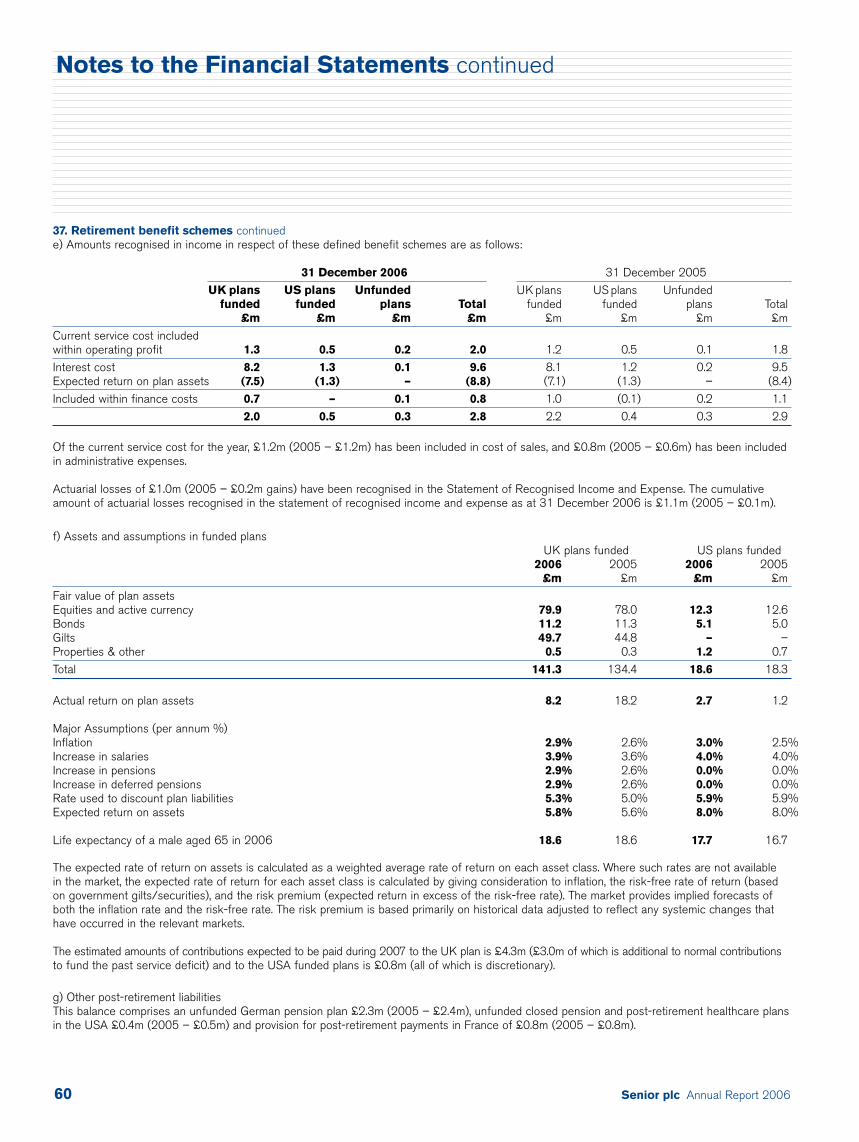
Senior plc Annual Report 200660
37. Retirement benefit schemes continuede) Amounts recognised in income in respect of these defined benefit schemes are as follows:
31 December 2006 31 December 2005
UK plans US plans Unfunded UK plans US plans Unfundedfunded funded plans Total funded funded plans Total
£m £m £m £m £m £m £m £m
Current service cost included within operating profit 1.3 0.5 0.2 2.0 1.2 0.5 0.1 1.8
Interest cost 8.2 1.3 0.1 9.6 8.1 1.2 0.2 9.5Expected return on plan assets (7.5) (1.3) – (8.8) (7.1) (1.3) – (8.4)
Included within finance costs 0.7 – 0.1 0.8 1.0 (0.1) 0.2 1.1
2.0 0.5 0.3 2.8 2.2 0.4 0.3 2.9
Of the current service cost for the year, £1.2m (2005 – £1.2m) has been included in cost of sales, and £0.8m (2005 – £0.6m) has been includedin administrative expenses.
Actuarial losses of £1.0m (2005 – £0.2m gains) have been recognised in the Statement of Recognised Income and Expense. The cumulativeamount of actuarial losses recognised in the statement of recognised income and expense as at 31 December 2006 is £1.1m (2005 – £0.1m).
f) Assets and assumptions in funded plansUK plans funded US plans funded
2006 2005 2006 2005£m £m £m £m
Fair value of plan assets Equities and active currency 79.9 78.0 12.3 12.6Bonds 11.2 11.3 5.1 5.0Gilts 49.7 44.8 – –Properties & other 0.5 0.3 1.2 0.7
Total 141.3 134.4 18.6 18.3
Actual return on plan assets 8.2 18.2 2.7 1.2
Major Assumptions (per annum %)Inflation 2.9% 2.6% 3.0% 2.5%Increase in salaries 3.9% 3.6% 4.0% 4.0%Increase in pensions 2.9% 2.6% 0.0% 0.0%Increase in deferred pensions 2.9% 2.6% 0.0% 0.0%Rate used to discount plan liabilities 5.3% 5.0% 5.9% 5.9%Expected return on assets 5.8% 5.6% 8.0% 8.0%
Life expectancy of a male aged 65 in 2006 18.6 18.6 17.7 16.7
The expected rate of return on assets is calculated as a weighted average rate of return on each asset class. Where such rates are not available in the market, the expected rate of return for each asset class is calculated by giving consideration to inflation, the risk-free rate of return (basedon government gilts/securities), and the risk premium (expected return in excess of the risk-free rate). The market provides implied forecasts ofboth the inflation rate and the risk-free rate. The risk premium is based primarily on historical data adjusted to reflect any systemic changes thathave occurred in the relevant markets.
The estimated amounts of contributions expected to be paid during 2007 to the UK plan is £4.3m (£3.0m of which is additional to normal contributionsto fund the past service deficit) and to the USA funded plans is £0.8m (all of which is discretionary).
g) Other post-retirement liabilitiesThis balance comprises an unfunded German pension plan £2.3m (2005 – £2.4m), unfunded closed pension and post-retirement healthcare plansin the USA £0.4m (2005 – £0.5m) and provision for post-retirement payments in France of £0.8m (2005 – £0.8m).
Notes to the Financial Statements continued
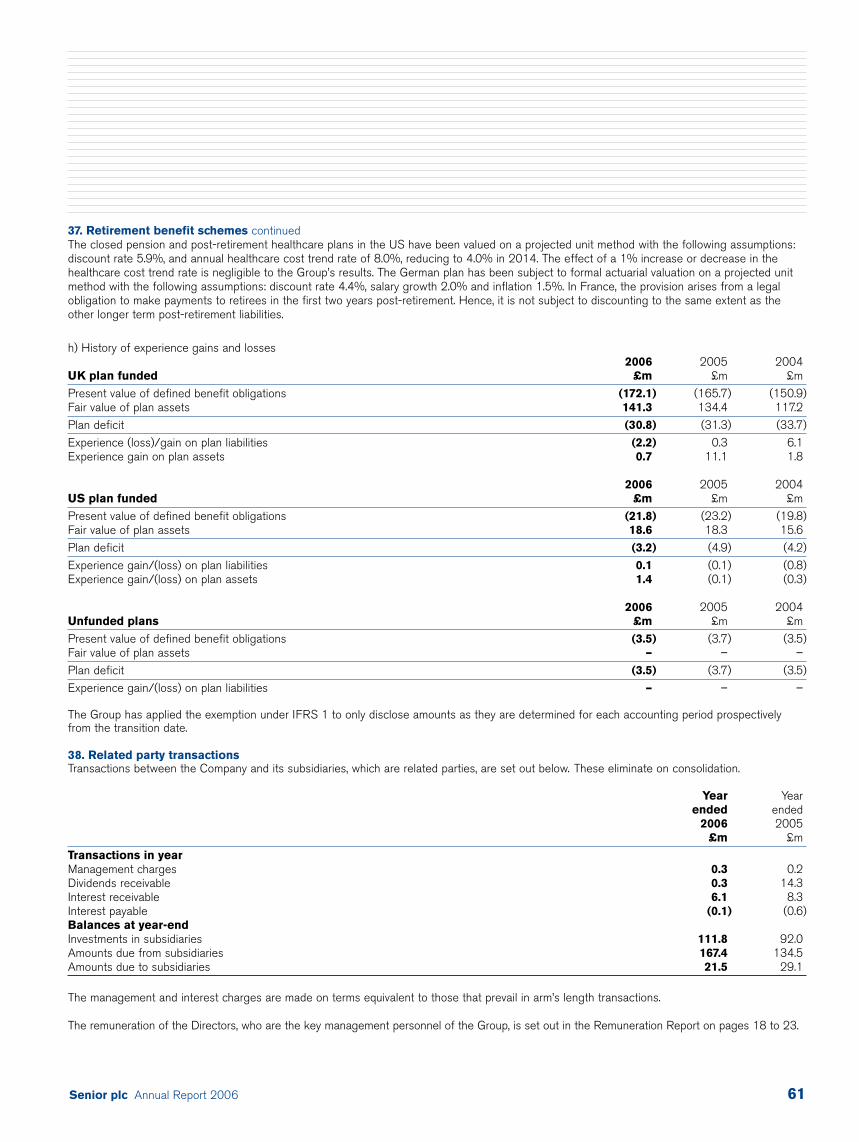
Senior plc Annual Report 2006 61
37. Retirement benefit schemes continuedThe closed pension and post-retirement healthcare plans in the US have been valued on a projected unit method with the following assumptions:discount rate 5.9%, and annual healthcare cost trend rate of 8.0%, reducing to 4.0% in 2014. The effect of a 1% increase or decrease in thehealthcare cost trend rate is negligible to the Group’s results. The German plan has been subject to formal actuarial valuation on a projected unitmethod with the following assumptions: discount rate 4.4%, salary growth 2.0% and inflation 1.5%. In France, the provision arises from a legalobligation to make payments to retirees in the first two years post-retirement. Hence, it is not subject to discounting to the same extent as theother longer term post-retirement liabilities.
h) History of experience gains and losses2006 2005 2004
UK plan funded £m £m £m
Present value of defined benefit obligations (172.1) (165.7) (150.9)Fair value of plan assets 141.3 134.4 117.2
Plan deficit (30.8) (31.3) (33.7)
Experience (loss)/gain on plan liabilities (2.2) 0.3 6.1Experience gain on plan assets 0.7 11.1 1.8
2006 2005 2004US plan funded £m £m £m
Present value of defined benefit obligations (21.8) (23.2) (19.8)Fair value of plan assets 18.6 18.3 15.6
Plan deficit (3.2) (4.9) (4.2)
Experience gain/(loss) on plan liabilities 0.1 (0.1) (0.8)Experience gain/(loss) on plan assets 1.4 (0.1) (0.3)
2006 2005 2004Unfunded plans £m £m £m
Present value of defined benefit obligations (3.5) (3.7) (3.5)Fair value of plan assets – – –
Plan deficit (3.5) (3.7) (3.5)
Experience gain/(loss) on plan liabilities – – –
The Group has applied the exemption under IFRS 1 to only disclose amounts as they are determined for each accounting period prospectively from the transition date.
38. Related party transactionsTransactions between the Company and its subsidiaries, which are related parties, are set out below. These eliminate on consolidation.
Year Yearended ended
2006 2005£m £m
Transactions in yearManagement charges 0.3 0.2Dividends receivable 0.3 14.3Interest receivable 6.1 8.3Interest payable (0.1) (0.6)Balances at year-endInvestments in subsidiaries 111.8 92.0Amounts due from subsidiaries 167.4 134.5Amounts due to subsidiaries 21.5 29.1
The management and interest charges are made on terms equivalent to those that prevail in arm’s length transactions.
The remuneration of the Directors, who are the key management personnel of the Group, is set out in the Remuneration Report on pages 18 to 23.
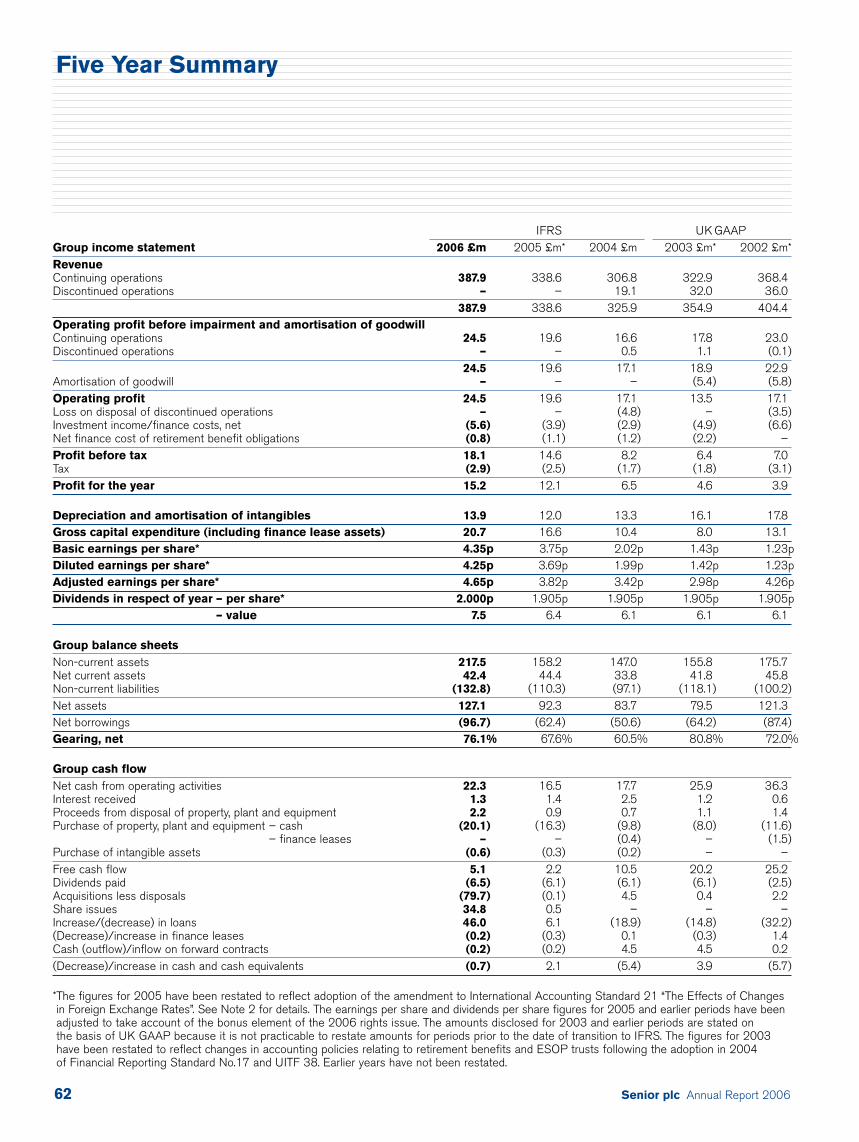
Senior plc Annual Report 200662
IFRS UK GAAPGroup income statement 2006 £m 2005 £m* 2004 £m 2003 £m* 2002 £m*RevenueContinuing operations 387.9 338.6 306.8 322.9 368.4Discontinued operations – – 19.1 32.0 36.0
387.9 338.6 325.9 354.9 404.4Operating profit before impairment and amortisation of goodwillContinuing operations 24.5 19.6 16.6 17.8 23.0Discontinued operations – – 0.5 1.1 (0.1)
24.5 19.6 17.1 18.9 22.9Amortisation of goodwill – – – (5.4) (5.8)Operating profit 24.5 19.6 17.1 13.5 17.1Loss on disposal of discontinued operations – – (4.8) – (3.5)Investment income/finance costs, net (5.6) (3.9) (2.9) (4.9) (6.6)Net finance cost of retirement benefit obligations (0.8) (1.1) (1.2) (2.2) –Profit before tax 18.1 14.6 8.2 6.4 7.0Tax (2.9) (2.5) (1.7) (1.8) (3.1)Profit for the year 15.2 12.1 6.5 4.6 3.9
Depreciation and amortisation of intangibles 13.9 12.0 13.3 16.1 17.8Gross capital expenditure (including finance lease assets) 20.7 16.6 10.4 8.0 13.1Basic earnings per share* 4.35p 3.75p 2.02p 1.43p 1.23pDiluted earnings per share* 4.25p 3.69p 1.99p 1.42p 1.23pAdjusted earnings per share* 4.65p 3.82p 3.42p 2.98p 4.26pDividends in respect of year – per share* 2.000p 1.905p 1.905p 1.905p 1.905p
– value 7.5 6.4 6.1 6.1 6.1
Group balance sheetsNon-current assets 217.5 158.2 147.0 155.8 175.7Net current assets 42.4 44.4 33.8 41.8 45.8Non-current liabilities (132.8) (110.3) (97.1) (118.1) (100.2)Net assets 127.1 92.3 83.7 79.5 121.3Net borrowings (96.7) (62.4) (50.6) (64.2) (87.4)Gearing, net 76.1% 67.6% 60.5% 80.8% 72.0%
Group cash flowNet cash from operating activities 22.3 16.5 17.7 25.9 36.3Interest received 1.3 1.4 2.5 1.2 0.6Proceeds from disposal of property, plant and equipment 2.2 0.9 0.7 1.1 1.4Purchase of property, plant and equipment – cash (20.1) (16.3) (9.8) (8.0) (11.6)
– finance leases – – (0.4) – (1.5)Purchase of intangible assets (0.6) (0.3) (0.2) – –Free cash flow 5.1 2.2 10.5 20.2 25.2Dividends paid (6.5) (6.1) (6.1) (6.1) (2.5)Acquisitions less disposals (79.7) (0.1) 4.5 0.4 2.2Share issues 34.8 0.5 – – –Increase/(decrease) in loans 46.0 6.1 (18.9) (14.8) (32.2)(Decrease)/increase in finance leases (0.2) (0.3) 0.1 (0.3) 1.4Cash (outflow)/inflow on forward contracts (0.2) (0.2) 4.5 4.5 0.2(Decrease)/increase in cash and cash equivalents (0.7) 2.1 (5.4) 3.9 (5.7)
*The figures for 2005 have been restated to reflect adoption of the amendment to International Accounting Standard 21 “The Effects of Changesin Foreign Exchange Rates”. See Note 2 for details. The earnings per share and dividends per share figures for 2005 and earlier periods have beenadjusted to take account of the bonus element of the 2006 rights issue. The amounts disclosed for 2003 and earlier periods are stated on the basis of UK GAAP because it is not practicable to restate amounts for periods prior to the date of transition to IFRS. The figures for 2003have been restated to reflect changes in accounting policies relating to retirement benefits and ESOP trusts following the adoption in 2004 of Financial Reporting Standard No.17 and UITF 38. Earlier years have not been restated.
Five Year Summary
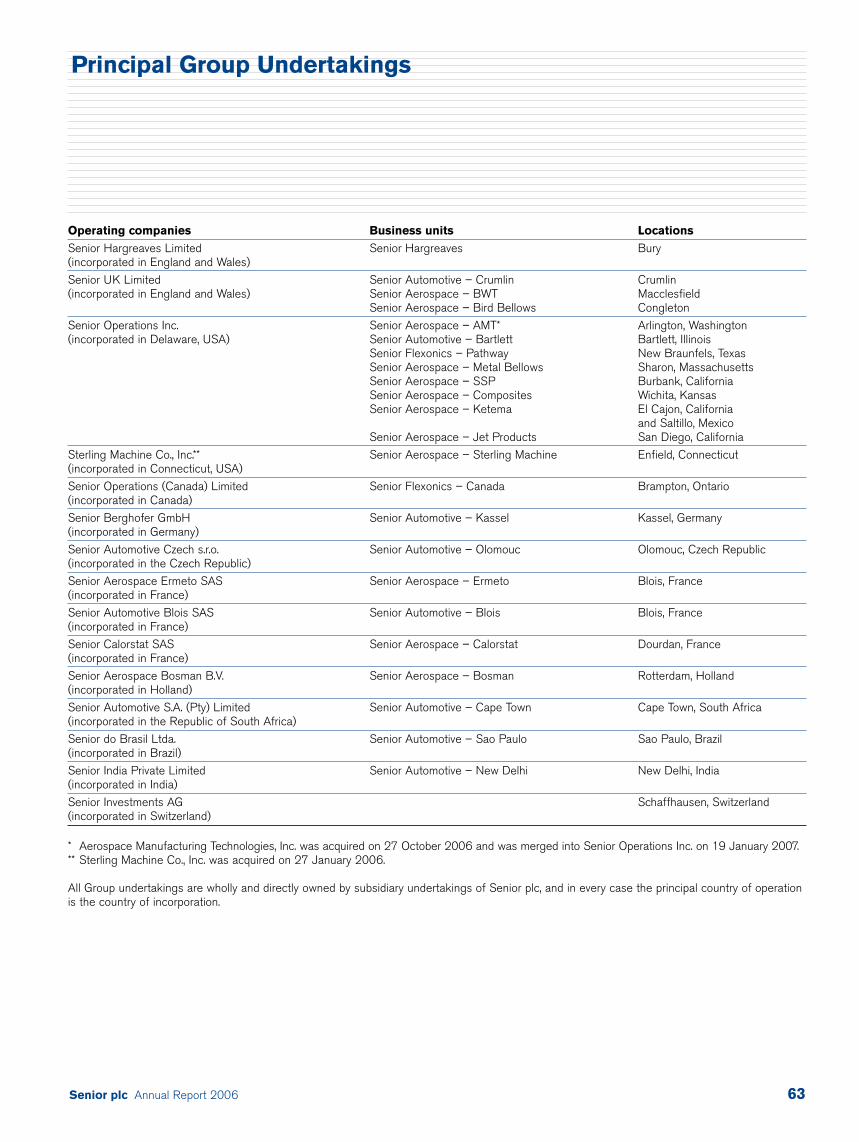
Senior plc Annual Report 2006 63
Operating companies Business units Locations
Senior Hargreaves Limited Senior Hargreaves Bury(incorporated in England and Wales)
Senior UK Limited Senior Automotive – Crumlin Crumlin(incorporated in England and Wales) Senior Aerospace – BWT Macclesfield
Senior Aerospace – Bird Bellows Congleton
Senior Operations Inc. Senior Aerospace – AMT* Arlington, Washington(incorporated in Delaware, USA) Senior Automotive – Bartlett Bartlett, Illinois
Senior Flexonics – Pathway New Braunfels, TexasSenior Aerospace – Metal Bellows Sharon, MassachusettsSenior Aerospace – SSP Burbank, CaliforniaSenior Aerospace – Composites Wichita, KansasSenior Aerospace – Ketema El Cajon, California
and Saltillo, MexicoSenior Aerospace – Jet Products San Diego, California
Sterling Machine Co., Inc.** Senior Aerospace – Sterling Machine Enfield, Connecticut(incorporated in Connecticut, USA)
Senior Operations (Canada) Limited Senior Flexonics – Canada Brampton, Ontario(incorporated in Canada)
Senior Berghofer GmbH Senior Automotive – Kassel Kassel, Germany(incorporated in Germany)
Senior Automotive Czech s.r.o. Senior Automotive – Olomouc Olomouc, Czech Republic(incorporated in the Czech Republic)
Senior Aerospace Ermeto SAS Senior Aerospace – Ermeto Blois, France(incorporated in France)
Senior Automotive Blois SAS Senior Automotive – Blois Blois, France(incorporated in France)
Senior Calorstat SAS Senior Aerospace – Calorstat Dourdan, France(incorporated in France)
Senior Aerospace Bosman B.V. Senior Aerospace – Bosman Rotterdam, Holland(incorporated in Holland)
Senior Automotive S.A. (Pty) Limited Senior Automotive – Cape Town Cape Town, South Africa(incorporated in the Republic of South Africa)
Senior do Brasil Ltda. Senior Automotive – Sao Paulo Sao Paulo, Brazil(incorporated in Brazil)
Senior India Private Limited Senior Automotive – New Delhi New Delhi, India(incorporated in India)
Senior Investments AG Schaffhausen, Switzerland(incorporated in Switzerland)
* Aerospace Manufacturing Technologies, Inc. was acquired on 27 October 2006 and was merged into Senior Operations Inc. on 19 January 2007.** Sterling Machine Co., Inc. was acquired on 27 January 2006.
All Group undertakings are wholly and directly owned by subsidiary undertakings of Senior plc, and in every case the principal country of operationis the country of incorporation.
Principal Group Undertakings
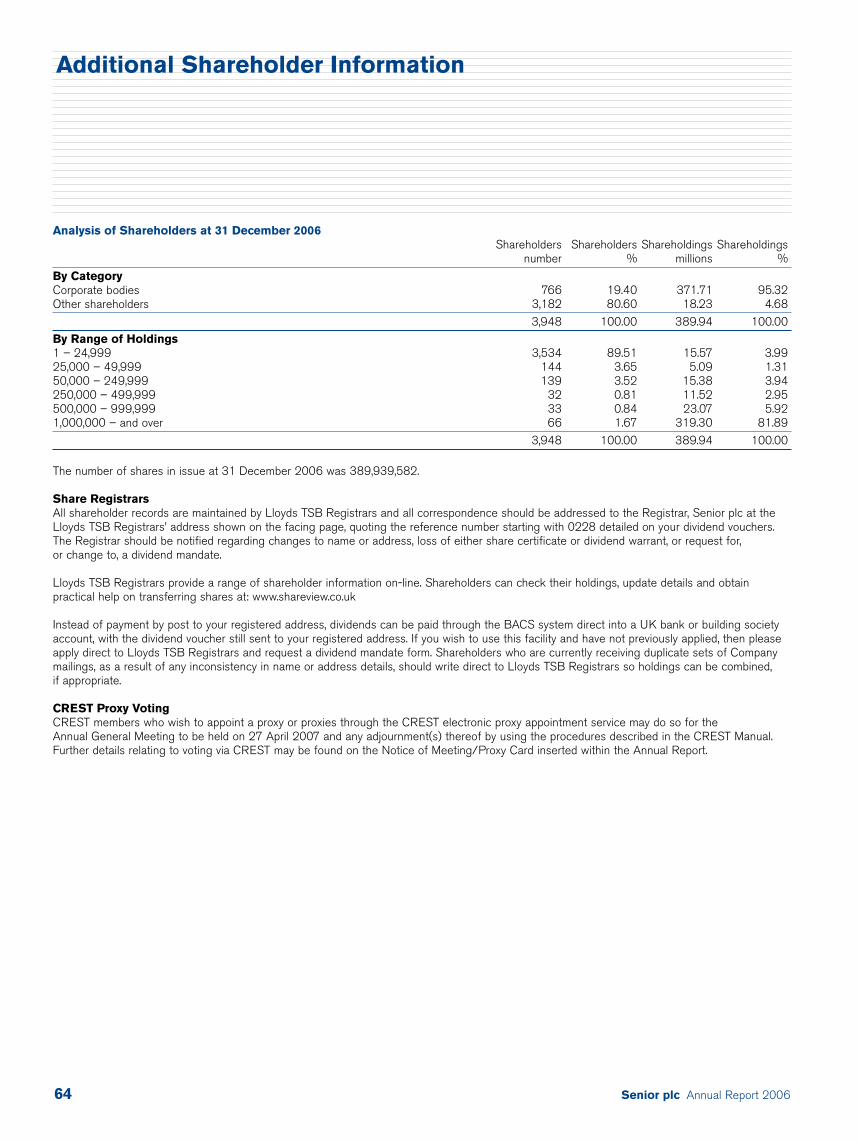
Senior plc Annual Report 200664
Analysis of Shareholders at 31 December 2006Shareholders Shareholders Shareholdings Shareholdings
number % millions %
By CategoryCorporate bodies 766 19.40 371.71 95.32Other shareholders 3,182 80.60 18.23 4.68
3,948 100.00 389.94 100.00By Range of Holdings1 – 24,999 3,534 89.51 15.57 3.9925,000 – 49,999 144 3.65 5.09 1.3150,000 – 249,999 139 3.52 15.38 3.94250,000 – 499,999 32 0.81 11.52 2.95500,000 – 999,999 33 0.84 23.07 5.921,000,000 – and over 66 1.67 319.30 81.89
3,948 100.00 389.94 100.00
The number of shares in issue at 31 December 2006 was 389,939,582.
Share RegistrarsAll shareholder records are maintained by Lloyds TSB Registrars and all correspondence should be addressed to the Registrar, Senior plc at theLloyds TSB Registrars’ address shown on the facing page, quoting the reference number starting with 0228 detailed on your dividend vouchers.The Registrar should be notified regarding changes to name or address, loss of either share certificate or dividend warrant, or request for,or change to, a dividend mandate.
Lloyds TSB Registrars provide a range of shareholder information on-line. Shareholders can check their holdings, update details and obtainpractical help on transferring shares at: www.shareview.co.uk
Instead of payment by post to your registered address, dividends can be paid through the BACS system direct into a UK bank or building societyaccount, with the dividend voucher still sent to your registered address. If you wish to use this facility and have not previously applied, then pleaseapply direct to Lloyds TSB Registrars and request a dividend mandate form. Shareholders who are currently receiving duplicate sets of Companymailings, as a result of any inconsistency in name or address details, should write direct to Lloyds TSB Registrars so holdings can be combined, if appropriate.
CREST Proxy VotingCREST members who wish to appoint a proxy or proxies through the CREST electronic proxy appointment service may do so for the Annual General Meeting to be held on 27 April 2007 and any adjournment(s) thereof by using the procedures described in the CREST Manual.Further details relating to voting via CREST may be found on the Notice of Meeting/Proxy Card inserted within the Annual Report.
Additional Shareholder Information
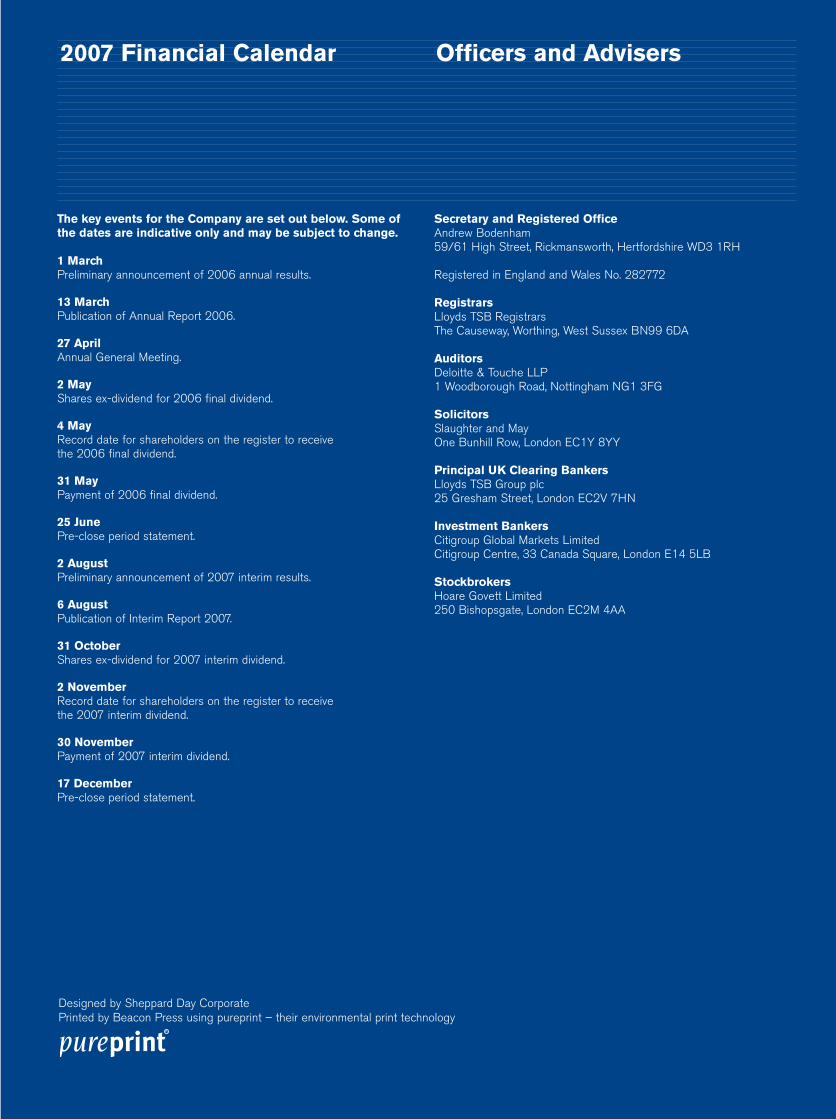
Designed by Sheppard Day CorporatePrinted by Beacon Press using pureprint – their environmental print technology
Contents1 Financial highlights
Directors’ report2 Chairman’s statement4 Board of Directors5 Report of the Directors7 Operating and financial review
14 Corporate governance report16 Audit Committee report18 Remuneration report24 Corporate social responsibility report26 Statement of Directors’ responsibilities27 Independent auditors’ report to the members of Senior plc
Financial information28 Consolidated income statement28 Statements of recognised income and expense29 Balance sheets30 Cash flow statements31 Notes to the financial statements62 Five year summary
Other information63 Principal group undertakings64 Additional shareholder informationibc 2007 Financial calendaribc Officers and advisers
Senior plc Corporate profileSenior is an international manufacturing group with operations in 11 countries. Senior designs, manufactures and markets high technology components and systems for the principal original equipment producers in the worldwide civil aerospace, defence, diesel engine, exhaust system and energy markets.
Aerospace 51% of Group revenueEngine structures and mountings, fluid control systems, metallic high-pressure ducting,composite low-pressure ducting.
Flexonics 49% of Group revenueFlexible exhaust connectors, engine emission pipework, diesel fuel systems, metallic and fabric expansion joints, flexible metallic hoses, ventilation ducting.
The key events for the Company are set out below. Some ofthe dates are indicative only and may be subject to change.
1 MarchPreliminary announcement of 2006 annual results.
13 MarchPublication of Annual Report 2006.
27 AprilAnnual General Meeting.
2 May Shares ex-dividend for 2006 final dividend.
4 MayRecord date for shareholders on the register to receive the 2006 final dividend.
31 MayPayment of 2006 final dividend.
25 JunePre-close period statement.
2 AugustPreliminary announcement of 2007 interim results.
6 AugustPublication of Interim Report 2007.
31 OctoberShares ex-dividend for 2007 interim dividend.
2 NovemberRecord date for shareholders on the register to receive the 2007 interim dividend.
30 NovemberPayment of 2007 interim dividend.
17 DecemberPre-close period statement.
Secretary and Registered OfficeAndrew Bodenham59/61 High Street, Rickmansworth, Hertfordshire WD3 1RH
Registered in England and Wales No. 282772
RegistrarsLloyds TSB RegistrarsThe Causeway, Worthing, West Sussex BN99 6DA
AuditorsDeloitte & Touche LLP1 Woodborough Road, Nottingham NG1 3FG
SolicitorsSlaughter and MayOne Bunhill Row, London EC1Y 8YY
Principal UK Clearing Bankers Lloyds TSB Group plc25 Gresham Street, London EC2V 7HN
Investment BankersCitigroup Global Markets LimitedCitigroup Centre, 33 Canada Square, London E14 5LB
StockbrokersHoare Govett Limited250 Bishopsgate, London EC2M 4AA
2007 Financial Calendar Officers and Advisers

Senior plcAnnual Report 2006
Senior plc59/61 High StreetRickmansworthHertfordshireWD3 1RHUnited Kingdom
T +44 (0)1923 775 547F +44 (0)1923 896 [email protected]
Sen
ior
plc
An
nu
alR
epo
rt2006