Embed Size (px)
Citation preview

Senior Pay Report Including Chief Executive Remuneration Disclosure 2015/16


Senior Pay Report 1
Purpose of the Senior Pay Report
This report sets out the remuneration of chief executives (CEs) in the Public Service and State sector for
the year to 30 June 2016. It describes how much CEs were paid, how that has changed over time, and
the role of the State Services Commissioner in influencing that pay.
This report pulls together data on CE pay from across the State sector, and provides detailed information
on CE remuneration from three main groupings:
the Public Service – pay set by the Commissioner for most CEs
Crown entities – pay set by Crown entity boards (input from the Commissioner)
government CEs whose pay is set by the Remuneration Authority (no Commissioner influence).
To provide as full a picture as possible, also provided are some comparisons with other staff remuneration
across the Public Service, and with other CEs in the broader public and state sectors.
Senior Pay Report 2
Key Points
The State Services Commissioner
This report discloses the total remuneration paid to State sector chief executives in the 2015/16
financial year, running from 1 July 2015 to 30 June 2016.
This is the first report published by current State Services Commissioner Peter Hughes since he took
up the role on 4 July 2016 and reflects decisions made prior to his starting in the role.
The State Services Commissioner sets Chief Executive (CE) pay for the majority of Public Service
departments, and has varying degrees of influence across the broader State sector.
Total cost of Public Service CEs: $14.3 million
There were 29 Public Service departments in 2015/16. The total cost of Public Service CEs was $14.3
million over the year.
For 26 of these CEs, pay is set by the State Services Commissioner (the Remuneration Authority sets
pay for the other three). The Government caps spending on these 26 CEs: in 2015/16 the limit was
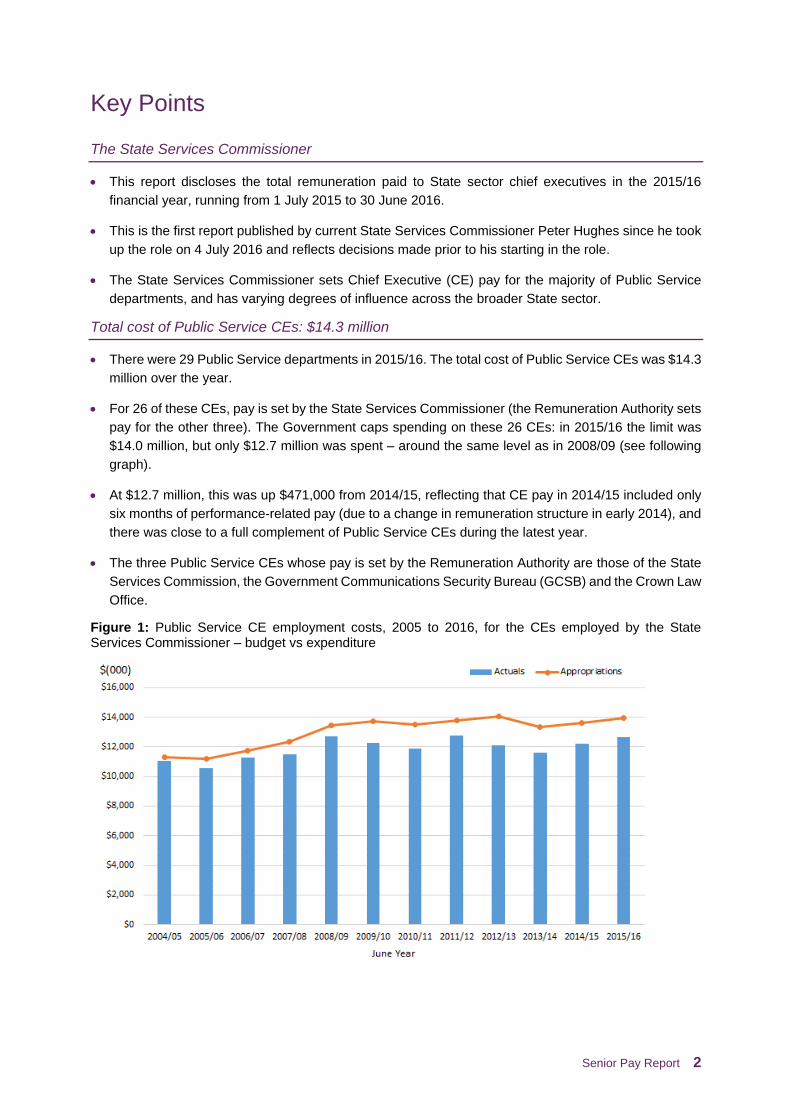
$14.0 million, but only $12.7 million was spent – around the same level as in 2008/09 (see following
graph).
At $12.7 million, this was up $471,000 from 2014/15, reflecting that CE pay in 2014/15 included only
six months of performance-related pay (due to a change in remuneration structure in early 2014), and
there was close to a full complement of Public Service CEs during the latest year.
The three Public Service CEs whose pay is set by the Remuneration Authority are those of the State
Services Commission, the Government Communications Security Bureau (GCSB) and the Crown Law
Office.
Figure 1: Public Service CE employment costs, 2005 to 2016, for the CEs employed by the State Services Commissioner – budget vs expenditure

Senior Pay Report 3
Average increase in base salary for Public Service CEs: 1.3%
In 2015/16, the average increase to base salary for Public Service CEs was 1.3% (excluding the three
CEs whose pay is set by the Remuneration Authority). This compares to an average increase of 0.7%
in the 2014/15 year.
Of the 26 CEs, 14 had their base salary reviewed in 2015/16 (ten at mid-term, and four on
reappointment), with movements ranging from 0% to 5.8%.
Average increase in total potential remuneration for Crown entity CEs: 3.4%
In 2015/16 there were 103 CE positions in statutory Crown entities (and subsidiaries). Their pay is set
by the Board of each Crown entity – the Commissioner is consulted in the process.
The average increase in total potential remuneration for Crown entity CEs was 3.4%, slightly higher
than the average of 3.1% seen in 2014/15.
As is the case every year, some Crown entity CEs receive additional increases to recognise job size
increases. This was the case for seven CEs during 2015/16. When these increases are excluded, the
average increase overall is reduced to 2.3%.
Public Service CE salary compared to employees: 5.5 times greater on average
The Human Resource Capability Report 2016 survey shows that for the latest year, the average base
salary of Public Service CEs was 5.5 times the average pay of their employees (including managers).
This ratio has been relatively stable over recent years (decreasing slightly from 5.8 in 2012), indicating
Public Service CE pay is moving in line with the average for their staff. These figures are modest
compared to the pay ratios of publically listed New Zealand firms.

Senior Pay Report 4
Overview of Senior Pay in the State Sector and Beyond, and the State Services Commissioner’s Role
Role of the State Services Commissioner
The State Services Commissioner (the Commissioner) has a broad role in
setting or influencing senior pay across the State sector, with a level of
influence that ranges from complete control to no direct influence at all.
The Commissioner sets CE pay in the majority of Public Service
departments, but has a different role with Crown entities, where CE pay is
set by each Board. For Tertiary Education Institutions (TEIs) and District
Health Boards (DHBs), Boards must seek the Commissioner’s agreement
to their decision. For all other Crown entities, Boards must consult the
Commissioner but retain decision-making authority.
The remuneration policy applied during the period of this report was that CE
remuneration should be flexible, transparent, with modest increases that are
performance-related, and take account of business issues such as
recruitment, retention, and affordability. The Commissioner also provided
guidelines for considering changes to Public Service and Crown entity CE
pay within the 2015/16 period.
Levels of remuneration in 2015/16
The graph below plots remuneration against job size for different types of public and private sector CEs.
Figure 2: Total remuneration by job size and sector
As should be expected, the graph shows a clear relationship between remuneration and job size (as
measured by independent consultants) – the ‘larger’ the job, the higher the pay.
Commissioner’s level of influence in setting CE pay:
Public Service Sets
TEIs & DHBs Agrees
Other Crown entities
Consults
Other state & private sector (inc. where pay is set by the Remuneration Authority)
No direct influence
Senior Pay Report 5
The graph shows each group for which the Commissioner has a different role in influencing senior pay.
The different lines show that the greater the influence, the lower the levels of pay (for the same size of
job). Accordingly, the bottom line is for Public Service CEs, whose pay is set by the Commissioner.
Changes to remuneration in 2015/16
The Government expects remuneration changes across the State sector to be met within existing funding
levels, demonstrate value for money, and not get ahead of the private sector.
Increases to Public Service and Crown entity CEs’ remuneration packages, over the 2015/16 year, are
generally within the guidelines that were set and therefore in line with movements in the broader State
sector.
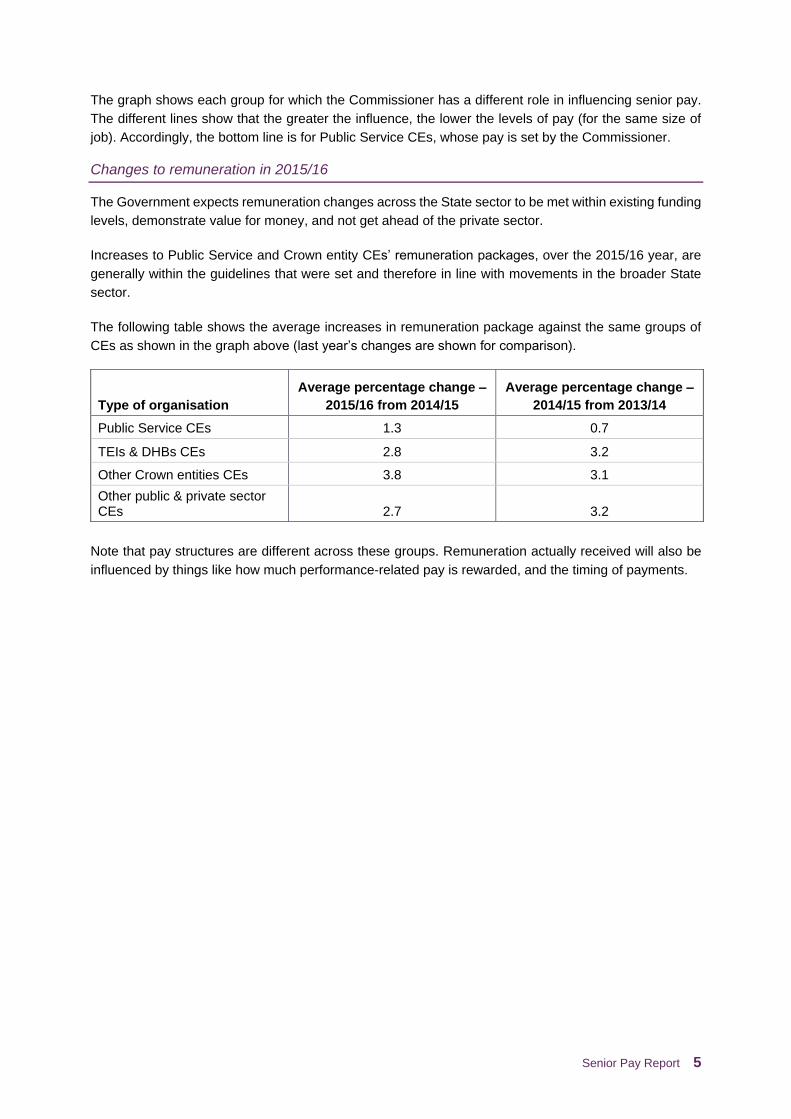
The following table shows the average increases in remuneration package against the same groups of
CEs as shown in the graph above (last year’s changes are shown for comparison).
Note that pay structures are different across these groups. Remuneration actually received will also be
influenced by things like how much performance-related pay is rewarded, and the timing of payments.
Type of organisation
Average percentage change –
2015/16 from 2014/15
Average percentage change –
2014/15 from 2013/14
Public Service CEs 1.3 0.7
TEIs & DHBs CEs 2.8 3.2
Other Crown entities CEs 3.8 3.1
Other public & private sector CEs 2.7 3.2

Senior Pay Report 6
Public Service Chief Executives in 2015/16
In 2015/16, the Public Service comprised 28 departments and 1 departmental agency – the now
disestablished Canterbury Earthquake Recovery Authority – meaning there were 29 CE positions (see
the table below for a full list of these departments).
The Commissioner was the employer of 26 of these and responsible for
managing their performance and setting their pay (under the State Sector Act
1988). For the remaining three departments (the State Services Commission, the
Government Communications Security Bureau (GCSB) and the Crown Law
Office), pay is set by the Remuneration Authority.
Total cost of Public Service CEs: $14.3 million
The total cost of CEs for Public Service departments was $14.3 million over the
2015/16 year (all 29 departments).
For the 26 CEs employed by the State Services Commissioner, Government
caps the funding: in 2015/16 the limit was $14.0 million, but only $12.7 million
was spent – around the same level as in 2008/09 (see following graph).
This was up $471,000 from 2014/15. This reflects that 2014/15 pay levels
included only six months of performance-related pay (due to a change in
remuneration structure in early 2014), and there was close to a full complement
of Public Service CEs during the latest year.
Figure 1: Public Service CE employment costs, 2005 to 2016, for the CEs employed by the State Services Commissioner – budget vs expenditure
Average increase in base salary for Public Service CEs: 1.3%
The average increase to remuneration for Public Service CEs was 1.3%
(excluding the three CEs whose pay is set by the Remuneration Authority). This
compares to an average increase of 0.7% in the 2014/15 year. Of the 26 CEs,
14 had their target remuneration reviewed in 2015/16 (ten at mid-term, and four
on reappointment), with movements ranging from 0% to 5.8%.
The Public Service in 2015/16:
Ministry of Business, Innovation & Employment
Canterbury Earthquake Recovery Authority1
Department of Conservation
Department of Corrections
Ministry for Culture & Heritage
Ministry of Defence
Ministry of Education
Education Review Office
Ministry for the Environment
Ministry of Foreign Affairs & Trade
Ministry of Health
Inland Revenue Department
Department of Internal Affairs
Ministry of Justice
Land Information New Zealand
Ministry of Māori Development (Te Puni Kōkiri)
New Zealand Customs Service
Ministry for Pacific Peoples
Ministry for Primary Industries
Department of the Prime Minister & Cabinet
Serious Fraud Office
Ministry of Social Development
Statistics New Zealand
Ministry of Transport
The Treasury
Ministry for Women
Crown Law Office2
GCSB2
State Services Commission2
1 Disestablished
2 CE pay set by the Remuneration Authority

Senior Pay Report 7
Other Government and Crown Entity Chief Executives in 2015/16
As described above, the Commissioner’s influence in setting CE pay extends into the broader State
sector, but at a lesser level. This includes the provision of guidelines that changes to Public Service and
Crown entity CE pay should remain within.
In 2015/16 there were 103 CE positions in Crown entities, and their subsidiaries
(for a full list of these, see the tables at the back of this report). Terms and
conditions for these CEs are set by their Boards (as employer), who must work
with the Commissioner in doing so. For Tertiary Education Institutions (TEIs) and
District Health Boards (DHBs), Boards must seek the Commissioner’s agreement
to their decision. For all other Crown entities, Boards must consult the
Commissioner but retain decision-making authority.
The Remuneration Authority is responsible for the remuneration of 12 CEs of
government agencies and officers of parliament (including the Commissioner).
For these CEs, the Commissioner has no direct role in setting terms and
conditions.
However, while the Commissioner may have no direct role in many situations,
there is still considerable interest from across sectors in the Commissioner’s
decisions, recommendations and guidelines. The Remuneration Authority in
particular liaises with the State Services Commission in setting its remuneration
ranges. This recognises that both the Authority and the Commission set
remuneration in the public sector, and it makes sense to align approaches, as far
as possible.
Total potential remuneration increases across Crown entity CEs
During 2015/16, the average percentage increase in total potential remuneration across the 103 Crown
entity CEs was 3.4%, slightly higher than the average of 3.1% seen in 2014/15.
As is the case every year, some Crown entity CEs receive additional increases to recognise job size
increases (as measured by independent consultants). This was the case for seven CEs during 2015/16.
When these additional increases are excluded, the average increase overall is reduced to 2.3% (and the
median to 2.0%).
This table summarises the increases to total remuneration packages for CEs across different types of
Crown entity in 2015/16:
Type of organisation
Average percentage change –
2015/16 from 2014/15
Average percentage change –
excluding job size increase
District Health Boards 2.6 2.0
Tertiary Education Institutions 2.9 2.4
Other statutory Crown entities 3.8 2.3
Government CE pay set by the Remuneration Authority:
New Zealand Defence Force
Office of the Ombudsman
Parliamentary Counsel Office
Office of the Clerk of the House of Representatives
New Zealand Police
Office of the Auditor-General
Government Communications Security Bureau
New Zealand Security Intelligence Service
Parliamentary Service
Parliamentary Commissioner for the Environment
Crown Law Office
State Services Commission

Senior Pay Report 8
Fixed remuneration package increases for other public and private sector CEs in 2015/16
By comparison, CEs in the broader public and private sectors (where the Commissioner has no direct
influence) had an average increase of 2.7% in fixed remuneration package in 2015/16.
Included in these numbers are the CEs whose pay is set by the Remuneration Authority (again, the
Commissioner has no direct influence). For these CEs, the pay scale used by the Authority indicated
increases of less than 2% in 2015/16.

Senior Pay Report 9
Senior Pay Compared to Other Public Service Staff
The State Services Commissioner sets the remuneration of most Public Service CEs; the CEs in turn set
the remuneration of their managers; and so on. All Public Service leaders face the same need to ensure
they can attract and retain highly skilled and qualified people while being restrained when spending public
money.
Comparing Public Service CE and deputy CE remuneration
Performance expectations for CEs are designed so they can flow through to their second tier leaders
(e.g. deputies). This is important so that leadership teams are focusing their attention in the same
direction, and work to broadly similar expectations of performance.
It is also important that remuneration for the two groups is broadly similar where job size/complexity
overlaps between the two groups. This recognises that while the responsibilities may vary between CE
and deputy positions, these second tier roles can also be very large and complex jobs with a lot of
responsibility.
Keeping remuneration for the two groups similar where job size/complexity overlaps enables a
comprehensive range of senior leadership career development options – allowing people in large second
tier roles to progress to smaller CE roles (and vice versa). The graph below demonstrates this overlap
and shows the strong correlation between job size and remuneration.
Figure 3: Public Service – CE (tier 1) and Deputy CE (tier-2) – remuneration by job size, 2016
Some second tier managers receive higher remuneration than CEs with similar sized roles. This can
occur with second tier managers in large agencies and CEs in small agencies.

Senior Pay Report 10
Comparing remuneration for different levels of staff in the Public Service
The State Services Commission’s Human Resources Capability (HRC) survey provides a snapshot of
the base salaries of staff in the Public Service as at 30 June each year. The following table summarises
how these have changed for different levels of staff over the last five years (2012-2016). The average
annual increase in base salary of all Public Service CEs was 1.4% across these five years, which is lower
than for managers at around 3% and other employees at 2.4%.
Public Service Employees
Average Base Salary
30 Jun 2012
Average Base Salary
30 Jun 2016
Average Annual
Pay Increase
2012-2016
Tier-1 CEs $385,386 $406,732 1.4%
Tier-2 e.g. deputy CEs $237,098 $269,846 3.3%
Tier-3 managers $158,184 $178,019 3.0%
Other managers $99,991 $112,356 3.0%
Other staff $60,692 $66,738 2.4%
All employees (excluding CEs) $66,958 $73,504 2.4%
The average base salary of Public Service CEs in 2016 was 5.5 times the average pay of their employees.
This ratio has been relatively stable over recent years (decreasing slightly from 5.8 in 2012), indicating
Public Service CE pay is moving in line with the average for their staff. The pay ratio is slightly higher at
6.6 times when compared to the larger total remuneration package of CEs that includes additional
performance-related pay or other benefits.
However, these ratios are modest compared to the market ratios of publically listed New Zealand firms.
CEs are now paid 30 to 50 times more than the average wage of workers, according to the recent
research on New Zealand pay ratios by Dr Roberts at the Business School of Otago University. http://www.otago.ac.nz/business/research/department/otago119826.html
For more information about the remuneration paid in the Public Service, read the Remuneration section
of the Public Service Workforce Data webpages at: http://ww.ssc.govt.nz/public-service-workforce-
data/hrc-remuneration

Senior Pay Report 11
Chief Executive Remuneration – Detailed Disclosure
The following tables outline all remuneration received by CEs across the Public Service, in Crown entities,
and those whose remuneration is determined by the Remuneration Authority in the 2015/16 calendar
year. This provides transparency for the taxpaying public around the level of remuneration received by
senior State servants, and is in line with the requirements of the Companies Act 1993 (section 211).
Remuneration figures include the full range of benefits that CEs may receive, either in cash (base pay,
performance related pay, superannuation) or in ‘kind’ (such as company cars or additional annual leave).
While the main body of this report primarily discusses the latest decisions from pay reviews, the following
tables describe all remuneration actually received between 1 July 2015 and 30 June 2016.
There are a broad range of influences on total payments each year, which explain why the two sets of
numbers may vary. While the data in the tables allow users to draw some general conclusions about
levels of pay, this range of influences means it’s not feasible to draw links between changes in pay and
the results of pay reviews or performance discussions.
In 2015/16 figures for Public Service CEs show a significant impact from a change in approach to
remuneration and review in early-2014. This resulted in the 2014/15 year including only six months’ worth
(pro-rated) of any performance payments, while the latest year has included 12 months’ worth. This has
resulted in some apparently significant year-on-year increases for those earning performance payments.
Influencing factors, which impact on reported figures to a greater or lesser extent in all financial years,
include:
The remuneration received in the latest year largely reflects decisions made on performance in the
previous year (or sometimes before).
CEs may have worked only part of the year.
Payments may include contractual entitlements at the end of a CE’s term.
The timing of pay periods during the year which may result in a CE receiving 27 fortnightly pays during
the year.
The timing of performance-related payments (year by year, there could be zero, one or even two
payments depending on timing of decisions and scheduled payment dates).
Changes in job size.
The technical notes attached to each of the following tables will highlight where some of these factors are
affecting a CE’s pay significantly.
Senior Pay Report 12
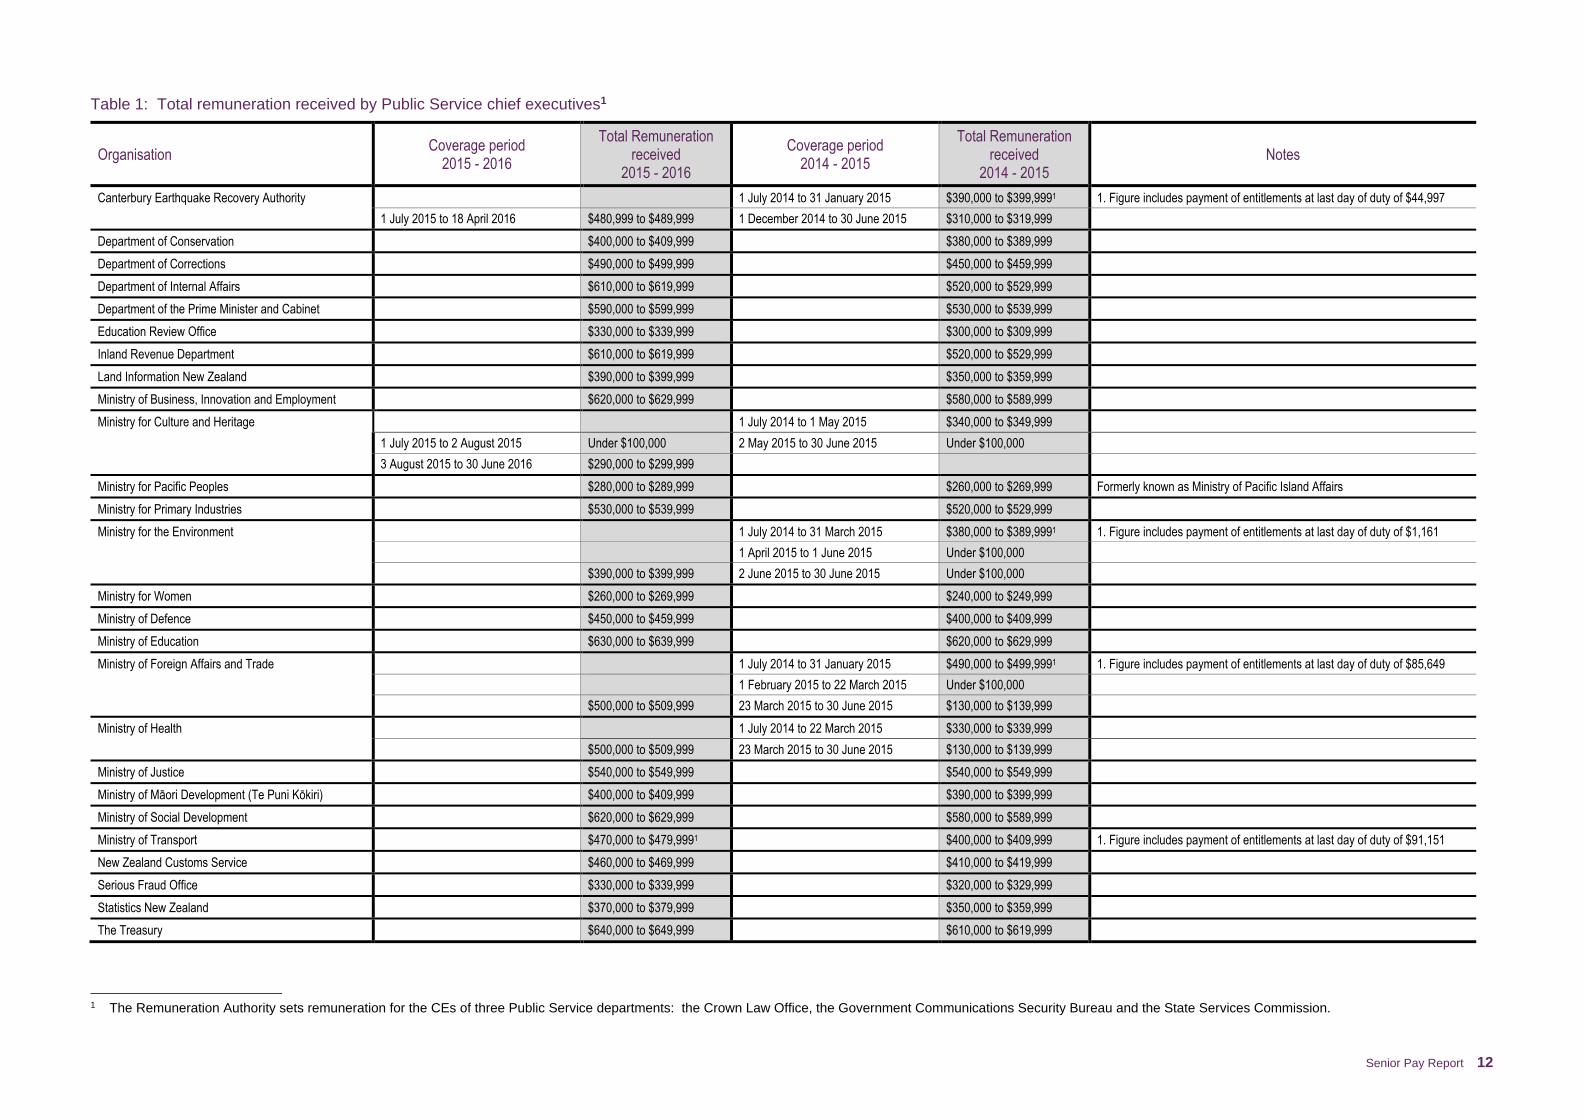
Table 1: Total remuneration received by Public Service chief executives1
Organisation Coverage period
2015 - 2016
Total Remuneration received
2015 - 2016
Coverage period 2014 - 2015
Total Remuneration received
2014 - 2015 Notes
Canterbury Earthquake Recovery Authority 1 July 2014 to 31 January 2015 $390,000 to $399,9991 1. Figure includes payment of entitlements at last day of duty of $44,997
1 July 2015 to 18 April 2016 $480,999 to $489,999 1 December 2014 to 30 June 2015 $310,000 to $319,999
Department of Conservation $400,000 to $409,999 $380,000 to $389,999
Department of Corrections $490,000 to $499,999 $450,000 to $459,999
Department of Internal Affairs $610,000 to $619,999 $520,000 to $529,999
Department of the Prime Minister and Cabinet $590,000 to $599,999 $530,000 to $539,999
Education Review Office $330,000 to $339,999 $300,000 to $309,999
Inland Revenue Department $610,000 to $619,999 $520,000 to $529,999
Land Information New Zealand $390,000 to $399,999 $350,000 to $359,999
Ministry of Business, Innovation and Employment $620,000 to $629,999 $580,000 to $589,999
Ministry for Culture and Heritage 1 July 2014 to 1 May 2015 $340,000 to $349,999
1 July 2015 to 2 August 2015 Under $100,000 2 May 2015 to 30 June 2015 Under $100,000
3 August 2015 to 30 June 2016 $290,000 to $299,999
Ministry for Pacific Peoples $280,000 to $289,999 $260,000 to $269,999 Formerly known as Ministry of Pacific Island Affairs
Ministry for Primary Industries $530,000 to $539,999 $520,000 to $529,999
Ministry for the Environment 1 July 2014 to 31 March 2015 $380,000 to $389,9991 1. Figure includes payment of entitlements at last day of duty of $1,161
1 April 2015 to 1 June 2015 Under $100,000
$390,000 to $399,999 2 June 2015 to 30 June 2015 Under $100,000
Ministry for Women $260,000 to $269,999 $240,000 to $249,999
Ministry of Defence $450,000 to $459,999 $400,000 to $409,999
Ministry of Education $630,000 to $639,999 $620,000 to $629,999
Ministry of Foreign Affairs and Trade 1 July 2014 to 31 January 2015 $490,000 to $499,9991 1. Figure includes payment of entitlements at last day of duty of $85,649
1 February 2015 to 22 March 2015 Under $100,000
$500,000 to $509,999 23 March 2015 to 30 June 2015 $130,000 to $139,999
Ministry of Health 1 July 2014 to 22 March 2015 $330,000 to $339,999
$500,000 to $509,999 23 March 2015 to 30 June 2015 $130,000 to $139,999
Ministry of Justice $540,000 to $549,999 $540,000 to $549,999
Ministry of Māori Development (Te Puni Kōkiri) $400,000 to $409,999 $390,000 to $399,999
Ministry of Social Development $620,000 to $629,999 $580,000 to $589,999
Ministry of Transport $470,000 to $479,9991 $400,000 to $409,999 1. Figure includes payment of entitlements at last day of duty of $91,151
New Zealand Customs Service $460,000 to $469,999 $410,000 to $419,999
Serious Fraud Office $330,000 to $339,999 $320,000 to $329,999
Statistics New Zealand $370,000 to $379,999 $350,000 to $359,999
The Treasury $640,000 to $649,999 $610,000 to $619,999
1 The Remuneration Authority sets remuneration for the CEs of three Public Service departments: the Crown Law Office, the Government Communications Security Bureau and the State Services Commission.
Senior Pay Report 13
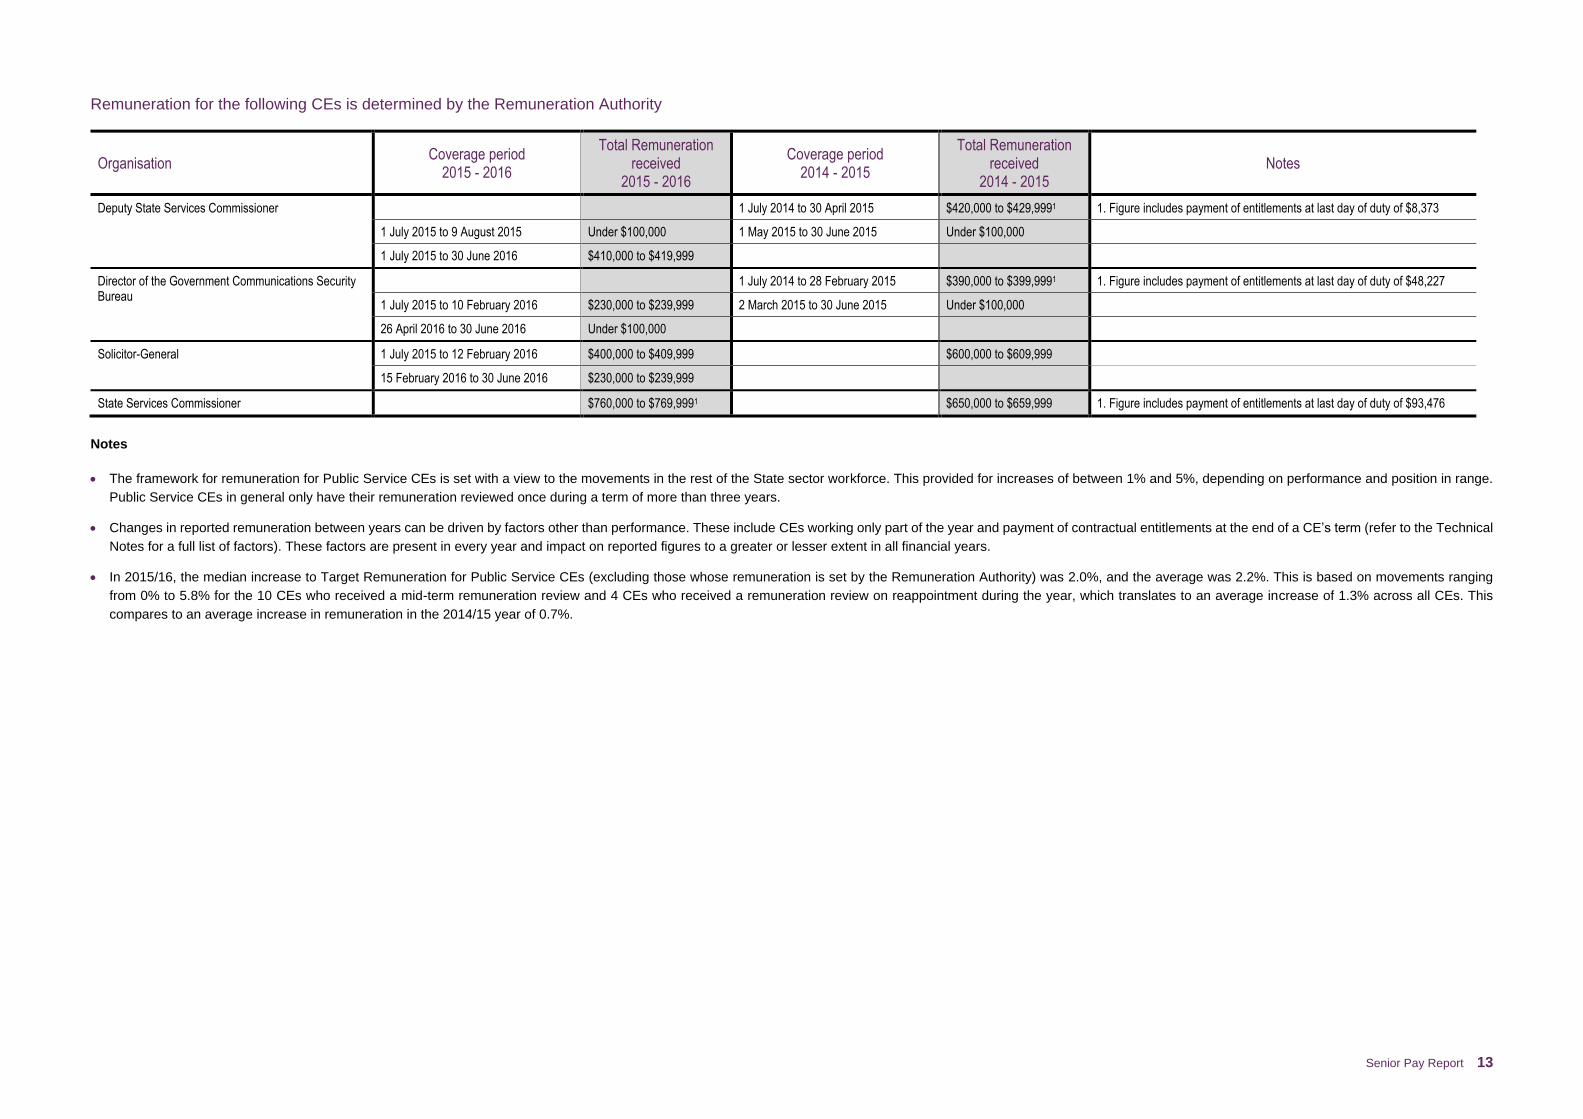
Remuneration for the following CEs is determined by the Remuneration Authority
Organisation Coverage period
2015 - 2016
Total Remuneration received
2015 - 2016
Coverage period 2014 - 2015
Total Remuneration received
2014 - 2015 Notes
Deputy State Services Commissioner 1 July 2014 to 30 April 2015 $420,000 to $429,9991 1. Figure includes payment of entitlements at last day of duty of $8,373
1 July 2015 to 9 August 2015 Under $100,000 1 May 2015 to 30 June 2015 Under $100,000
1 July 2015 to 30 June 2016 $410,000 to $419,999
Director of the Government Communications Security Bureau
1 July 2014 to 28 February 2015 $390,000 to $399,9991 1. Figure includes payment of entitlements at last day of duty of $48,227
1 July 2015 to 10 February 2016 $230,000 to $239,999 2 March 2015 to 30 June 2015 Under $100,000
26 April 2016 to 30 June 2016 Under $100,000
Solicitor-General 1 July 2015 to 12 February 2016 $400,000 to $409,999 $600,000 to $609,999
15 February 2016 to 30 June 2016 $230,000 to $239,999
State Services Commissioner $760,000 to $769,9991 $650,000 to $659,999 1. Figure includes payment of entitlements at last day of duty of $93,476
Notes
The framework for remuneration for Public Service CEs is set with a view to the movements in the rest of the State sector workforce. This provided for increases of between 1% and 5%, depending on performance and position in range.
Public Service CEs in general only have their remuneration reviewed once during a term of more than three years.
Changes in reported remuneration between years can be driven by factors other than performance. These include CEs working only part of the year and payment of contractual entitlements at the end of a CE’s term (refer to the Technical
Notes for a full list of factors). These factors are present in every year and impact on reported figures to a greater or lesser extent in all financial years.
In 2015/16, the median increase to Target Remuneration for Public Service CEs (excluding those whose remuneration is set by the Remuneration Authority) was 2.0%, and the average was 2.2%. This is based on movements ranging
from 0% to 5.8% for the 10 CEs who received a mid-term remuneration review and 4 CEs who received a remuneration review on reappointment during the year, which translates to an average increase of 1.3% across all CEs. This
compares to an average increase in remuneration in the 2014/15 year of 0.7%.
Senior Pay Report 14
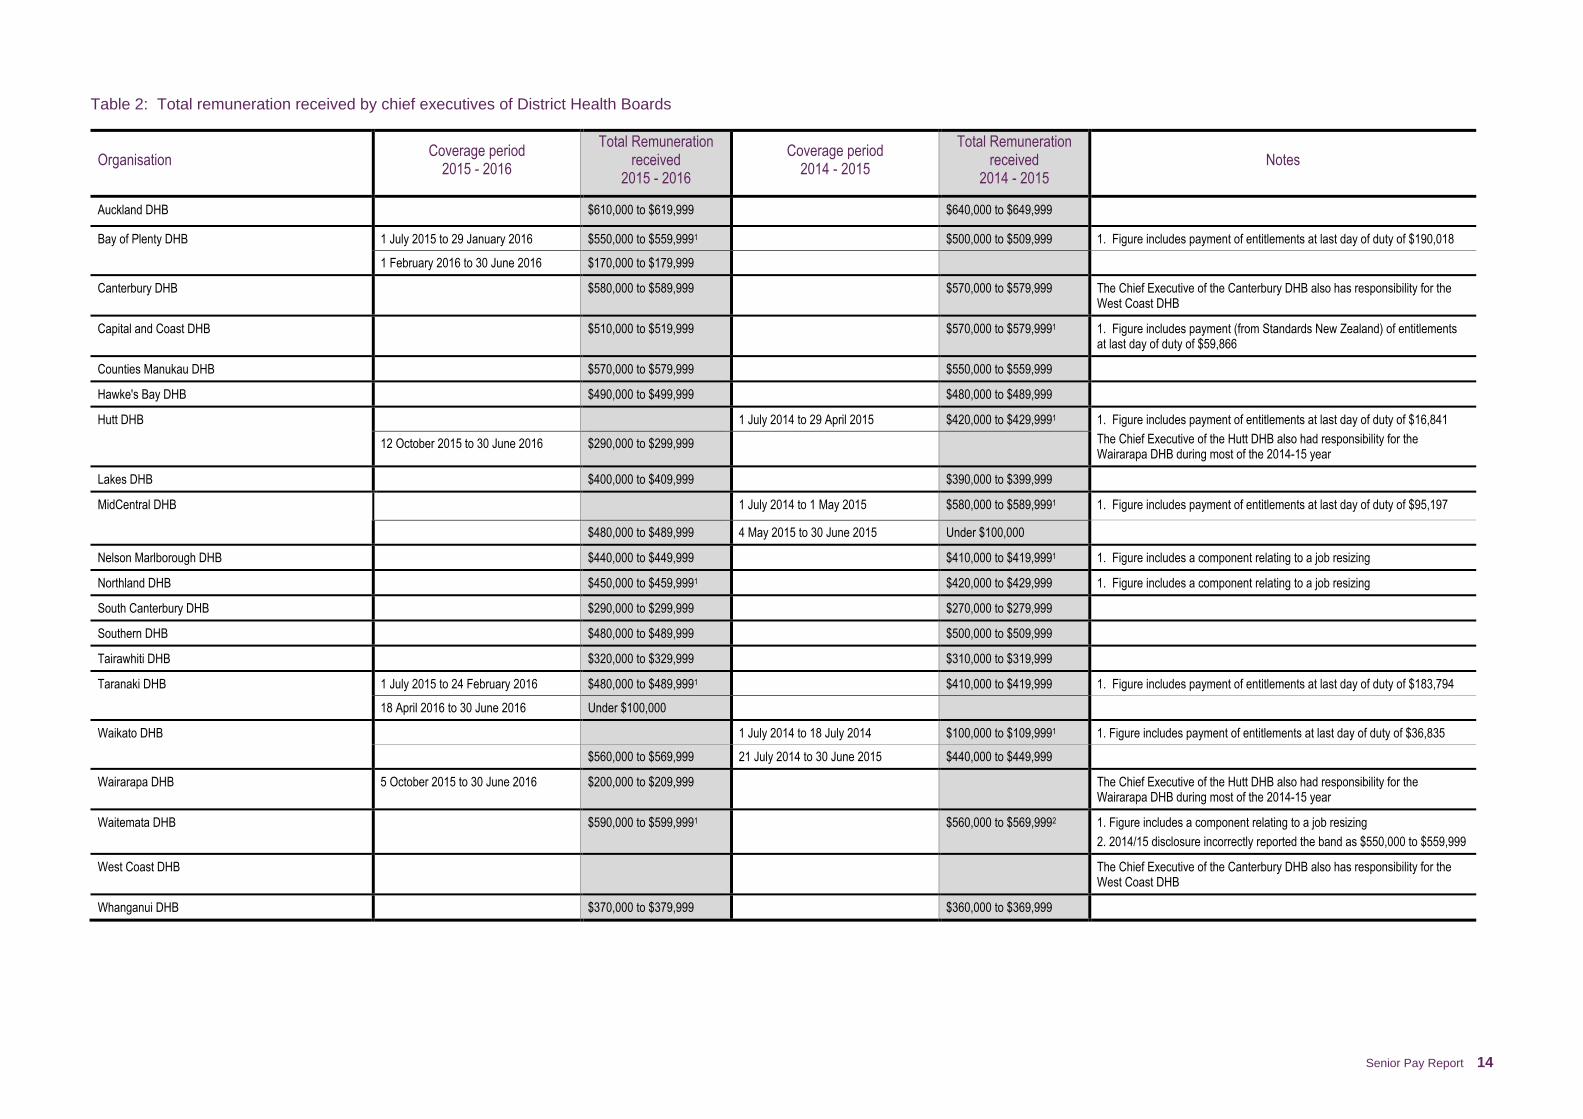
Table 2: Total remuneration received by chief executives of District Health Boards
Organisation Coverage period
2015 - 2016
Total Remuneration received
2015 - 2016
Coverage period 2014 - 2015
Total Remuneration received
2014 - 2015 Notes
Auckland DHB $610,000 to $619,999 $640,000 to $649,999
Bay of Plenty DHB 1 July 2015 to 29 January 2016 $550,000 to $559,9991 $500,000 to $509,999 1. Figure includes payment of entitlements at last day of duty of $190,018
1 February 2016 to 30 June 2016 $170,000 to $179,999
Canterbury DHB $580,000 to $589,999 $570,000 to $579,999 The Chief Executive of the Canterbury DHB also has responsibility for the West Coast DHB
Capital and Coast DHB $510,000 to $519,999 $570,000 to $579,9991 1. Figure includes payment (from Standards New Zealand) of entitlements at last day of duty of $59,866
Counties Manukau DHB $570,000 to $579,999 $550,000 to $559,999
Hawke's Bay DHB $490,000 to $499,999 $480,000 to $489,999
Hutt DHB 1 July 2014 to 29 April 2015 $420,000 to $429,9991 1. Figure includes payment of entitlements at last day of duty of $16,841
The Chief Executive of the Hutt DHB also had responsibility for the Wairarapa DHB during most of the 2014-15 year
12 October 2015 to 30 June 2016 $290,000 to $299,999
Lakes DHB $400,000 to $409,999 $390,000 to $399,999
MidCentral DHB 1 July 2014 to 1 May 2015 $580,000 to $589,9991 1. Figure includes payment of entitlements at last day of duty of $95,197
$480,000 to $489,999 4 May 2015 to 30 June 2015 Under $100,000
Nelson Marlborough DHB $440,000 to $449,999 $410,000 to $419,9991 1. Figure includes a component relating to a job resizing
Northland DHB $450,000 to $459,9991 $420,000 to $429,999 1. Figure includes a component relating to a job resizing
South Canterbury DHB $290,000 to $299,999 $270,000 to $279,999
Southern DHB $480,000 to $489,999 $500,000 to $509,999
Tairawhiti DHB $320,000 to $329,999 $310,000 to $319,999
Taranaki DHB 1 July 2015 to 24 February 2016 $480,000 to $489,9991 $410,000 to $419,999 1. Figure includes payment of entitlements at last day of duty of $183,794
18 April 2016 to 30 June 2016 Under $100,000
Waikato DHB 1 July 2014 to 18 July 2014 $100,000 to $109,9991 1. Figure includes payment of entitlements at last day of duty of $36,835
$560,000 to $569,999 21 July 2014 to 30 June 2015 $440,000 to $449,999
Wairarapa DHB 5 October 2015 to 30 June 2016 $200,000 to $209,999 The Chief Executive of the Hutt DHB also had responsibility for the Wairarapa DHB during most of the 2014-15 year
Waitemata DHB $590,000 to $599,9991 $560,000 to $569,9992 1. Figure includes a component relating to a job resizing
2. 2014/15 disclosure incorrectly reported the band as $550,000 to $559,999
West Coast DHB The Chief Executive of the Canterbury DHB also has responsibility for the West Coast DHB
Whanganui DHB $370,000 to $379,999 $360,000 to $369,999

Senior Pay Report 15
Notes
District Health Board (DHB) CE remuneration is set by the Board after consultation with the State Services Commissioner. Under the New Zealand Public Health and Disability Act 2000, DHBs are required to seek the Commissioner’s
consent for changes to their CEs’ remuneration. The Commissioner provides all board chairs with guidance when considering increases to CE remuneration which is consistent with remuneration movements in the broader State sector
workforce. This indicates the Commissioner’s expectations for reasonable increases, taking into account individual performance, and a CE’s position in a remuneration range.
The Commissioner provides all board chairs with guidance when considering increases to CE remuneration which is also consistent with remuneration movements in the broader State sector workforce. This indicates the Commissioner’s
expectations for reasonable increases, taking into account individual performance, and a CE’s position in a remuneration range. The guidance indicated increases for CEs meeting expectations of between 0% and 3%.
Changes in reported remuneration between years can be driven by factors other than performance. These include payment of contractual entitlements at the end of a CE’s term (refer to the Technical Notes for a full list of factors). These
factors are present in every year and impact on reported figures to a greater or lesser extent in all financial years.
For the 2015/2016 year, the average increase to total remuneration packages for District Health Board CEs (whose remuneration reviews were completed and advised to SSC by 30 June 2016) was 2.6%, and the median was 2.0%.
Excluding the additional increase related to a job resizing, the average increase was 2.0%, and the median was 2.0%.
Senior Pay Report 16
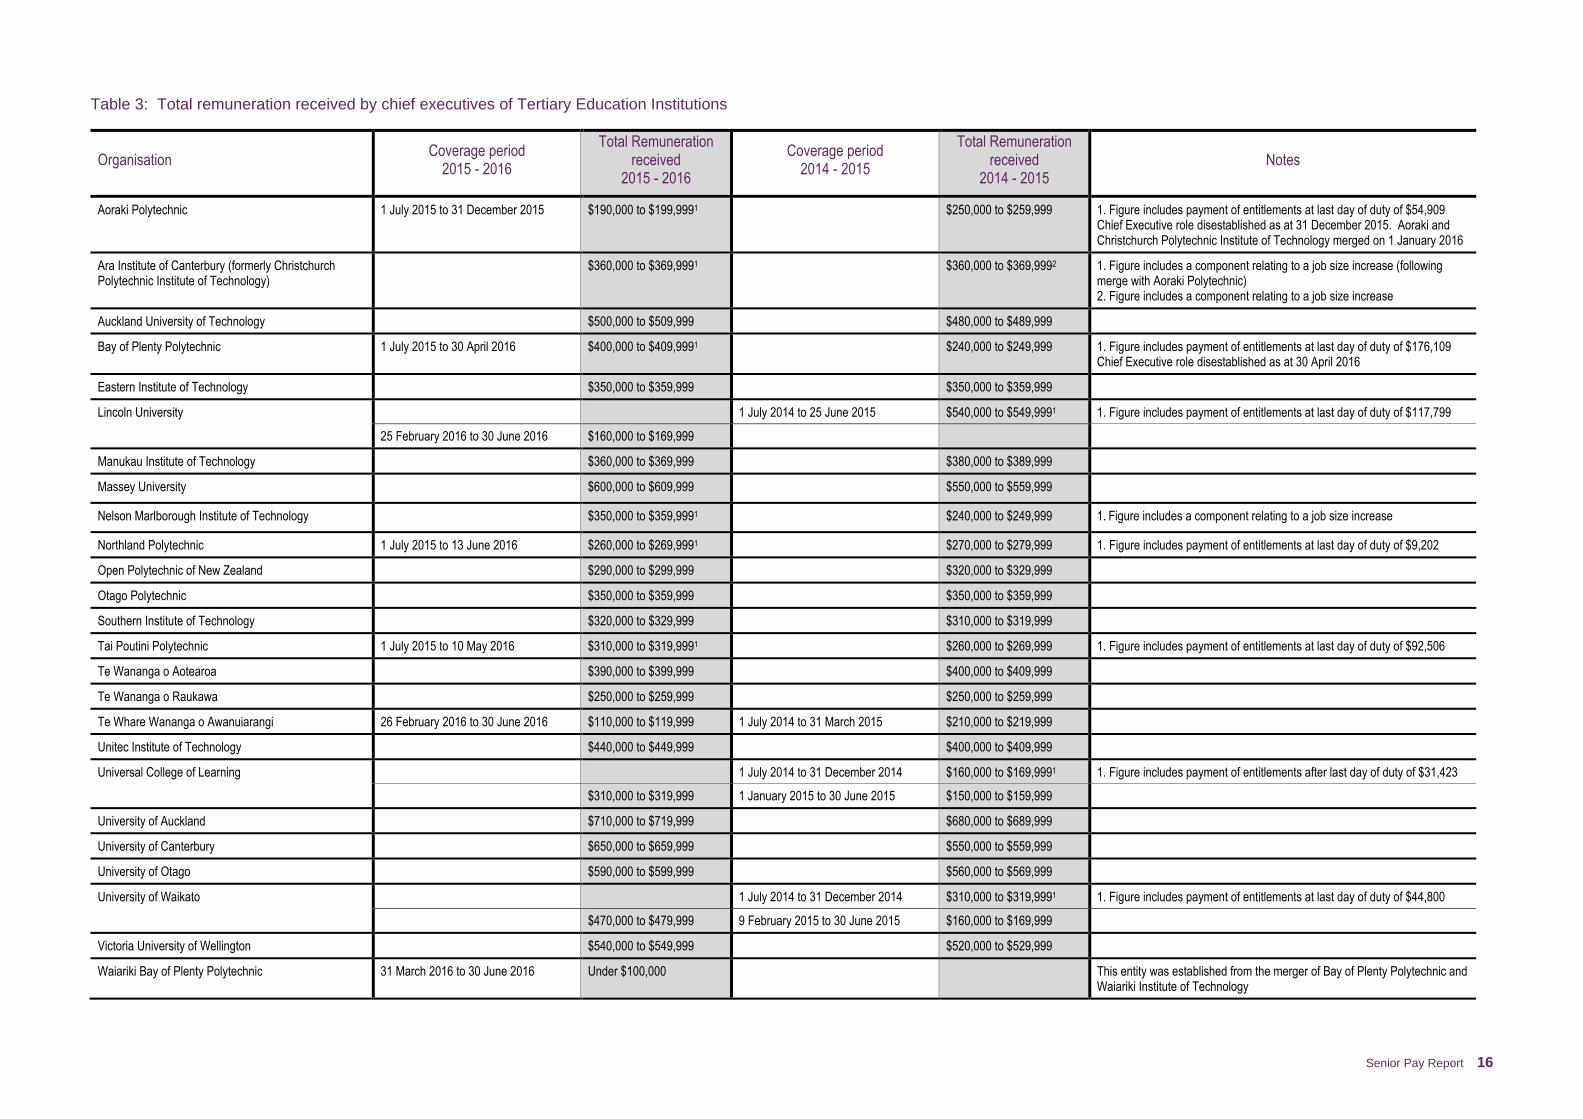
Table 3: Total remuneration received by chief executives of Tertiary Education Institutions
Organisation Coverage period
2015 - 2016
Total Remuneration received
2015 - 2016
Coverage period 2014 - 2015
Total Remuneration received
2014 - 2015 Notes
Aoraki Polytechnic 1 July 2015 to 31 December 2015 $190,000 to $199,9991 $250,000 to $259,999 1. Figure includes payment of entitlements at last day of duty of $54,909 Chief Executive role disestablished as at 31 December 2015. Aoraki and Christchurch Polytechnic Institute of Technology merged on 1 January 2016
Ara Institute of Canterbury (formerly Christchurch Polytechnic Institute of Technology)
$360,000 to $369,9991 $360,000 to $369,9992 1. Figure includes a component relating to a job size increase (following merge with Aoraki Polytechnic) 2. Figure includes a component relating to a job size increase
Auckland University of Technology $500,000 to $509,999 $480,000 to $489,999
Bay of Plenty Polytechnic 1 July 2015 to 30 April 2016 $400,000 to $409,9991 $240,000 to $249,999 1. Figure includes payment of entitlements at last day of duty of $176,109 Chief Executive role disestablished as at 30 April 2016
Eastern Institute of Technology $350,000 to $359,999 $350,000 to $359,999
Lincoln University 1 July 2014 to 25 June 2015 $540,000 to $549,9991 1. Figure includes payment of entitlements at last day of duty of $117,799
25 February 2016 to 30 June 2016 $160,000 to $169,999
Manukau Institute of Technology $360,000 to $369,999 $380,000 to $389,999
Massey University $600,000 to $609,999 $550,000 to $559,999
Nelson Marlborough Institute of Technology $350,000 to $359,9991 $240,000 to $249,999 1. Figure includes a component relating to a job size increase
Northland Polytechnic 1 July 2015 to 13 June 2016 $260,000 to $269,9991 $270,000 to $279,999 1. Figure includes payment of entitlements at last day of duty of $9,202
Open Polytechnic of New Zealand $290,000 to $299,999 $320,000 to $329,999
Otago Polytechnic $350,000 to $359,999 $350,000 to $359,999
Southern Institute of Technology $320,000 to $329,999 $310,000 to $319,999
Tai Poutini Polytechnic 1 July 2015 to 10 May 2016 $310,000 to $319,9991 $260,000 to $269,999 1. Figure includes payment of entitlements at last day of duty of $92,506
Te Wananga o Aotearoa $390,000 to $399,999 $400,000 to $409,999
Te Wananga o Raukawa $250,000 to $259,999 $250,000 to $259,999
Te Whare Wananga o Awanuiarangi 26 February 2016 to 30 June 2016 $110,000 to $119,999 1 July 2014 to 31 March 2015 $210,000 to $219,999
Unitec Institute of Technology $440,000 to $449,999 $400,000 to $409,999
Universal College of Learning 1 July 2014 to 31 December 2014 $160,000 to $169,9991 1. Figure includes payment of entitlements after last day of duty of $31,423
$310,000 to $319,999 1 January 2015 to 30 June 2015 $150,000 to $159,999
University of Auckland $710,000 to $719,999 $680,000 to $689,999
University of Canterbury $650,000 to $659,999 $550,000 to $559,999
University of Otago $590,000 to $599,999 $560,000 to $569,999
University of Waikato 1 July 2014 to 31 December 2014 $310,000 to $319,9991 1. Figure includes payment of entitlements at last day of duty of $44,800
$470,000 to $479,999 9 February 2015 to 30 June 2015 $160,000 to $169,999
Victoria University of Wellington $540,000 to $549,999 $520,000 to $529,999
Waiariki Bay of Plenty Polytechnic 31 March 2016 to 30 June 2016 Under $100,000 This entity was established from the merger of Bay of Plenty Polytechnic and Waiariki Institute of Technology

Senior Pay Report 17
Organisation Coverage period
2015 - 2016
Total Remuneration received
2015 - 2016
Coverage period 2014 - 2015
Total Remuneration received
2014 - 2015 Notes
Waiariki Institute of Technology 1 July 2015 to 30 April 2016 $380,000 to $389,9991 $290,000 to $299,999 1. Figure includes payment of entitlements at last day of duty of $112,257
Role disestablished on 30 April 2016
Waikato Institute of Technology $430,000 to $439,999 $350,000 to $359,9991 1. Figure includes a component relating to a job size increase; does not include performance payment, actioned after 30 June 2015
Wellington Institute of Technology 1 July 2014 to 31 March 2015 $430,000 to $439,9991 1. Figure includes payment of entitlements at last day of duty of $40,899 Role disestablished 30 March 2015 and new role of Chief Executive of Whitireia and Weltec established.
Western Institute of Technology $230,000 to $239,999 $230,000 to $239,999
Whitireia Community Polytechnic 1 July 2014 to 31 March 2015 $390,000 to $399,9991 1. Figure includes payment of entitlements at last day of duty of $29,694 Role disestablished 30 March 2015 and new role of Chief Executive of Whitireia and Weltec established.
Whitireia Community Polytechnic / Wellington Institute of Technology
$380,000 to $389,999 1 April 2015 to 30 June 2015 Under $100,000 New role of Chief Executive of Whitireia and Weltec established 1 April 2015
Notes
Tertiary Education Institution (TEI) CE remuneration is set by the TEI Board after consultation with the State Services Commissioner. Under the State Sector Act 1988, TEIs are required to seek the Commissioner’s concurrence for
changes to their CEs’ remuneration. The Commissioner provides all board chairs with guidance when considering increases to CE remuneration which is consistent with remuneration movements in the broader State sector workforce.
This indicates the Commissioner’s expectations for reasonable increases, taking into account individual performance, and a CE’s position in a remuneration range.
The Commissioner provides all board chairs with guidance when considering increases to CE remuneration which is also consistent with remuneration movements in the broader State sector workforce. This indicates the Commissioner’s
expectations for reasonable increases, taking into account individual performance, and a CE’s position in a remuneration range. The guidance indicated increases for CEs meeting expectations of between 0% and 3%.
Changes in reported remuneration between years can be driven by factors other than performance. These include CEs working only part of the year and payment of contractual entitlements at the end of a CE’s term (refer to the technical
notes for a full list of factors). These factors are present in every year and impact on reported figures to a greater or lesser extent in all financial years.
For the 2015/2016 year, the average increase to total remuneration packages for Tertiary Education Institution CEs (whose remuneration reviews were completed and advised to SSC by 30 June 2016) was 2.9%, and the median was
2.4%. Excluding the additional increases related to job resizing, the average increase was 2.4%, and the median was 2.0%
Senior Pay Report 18
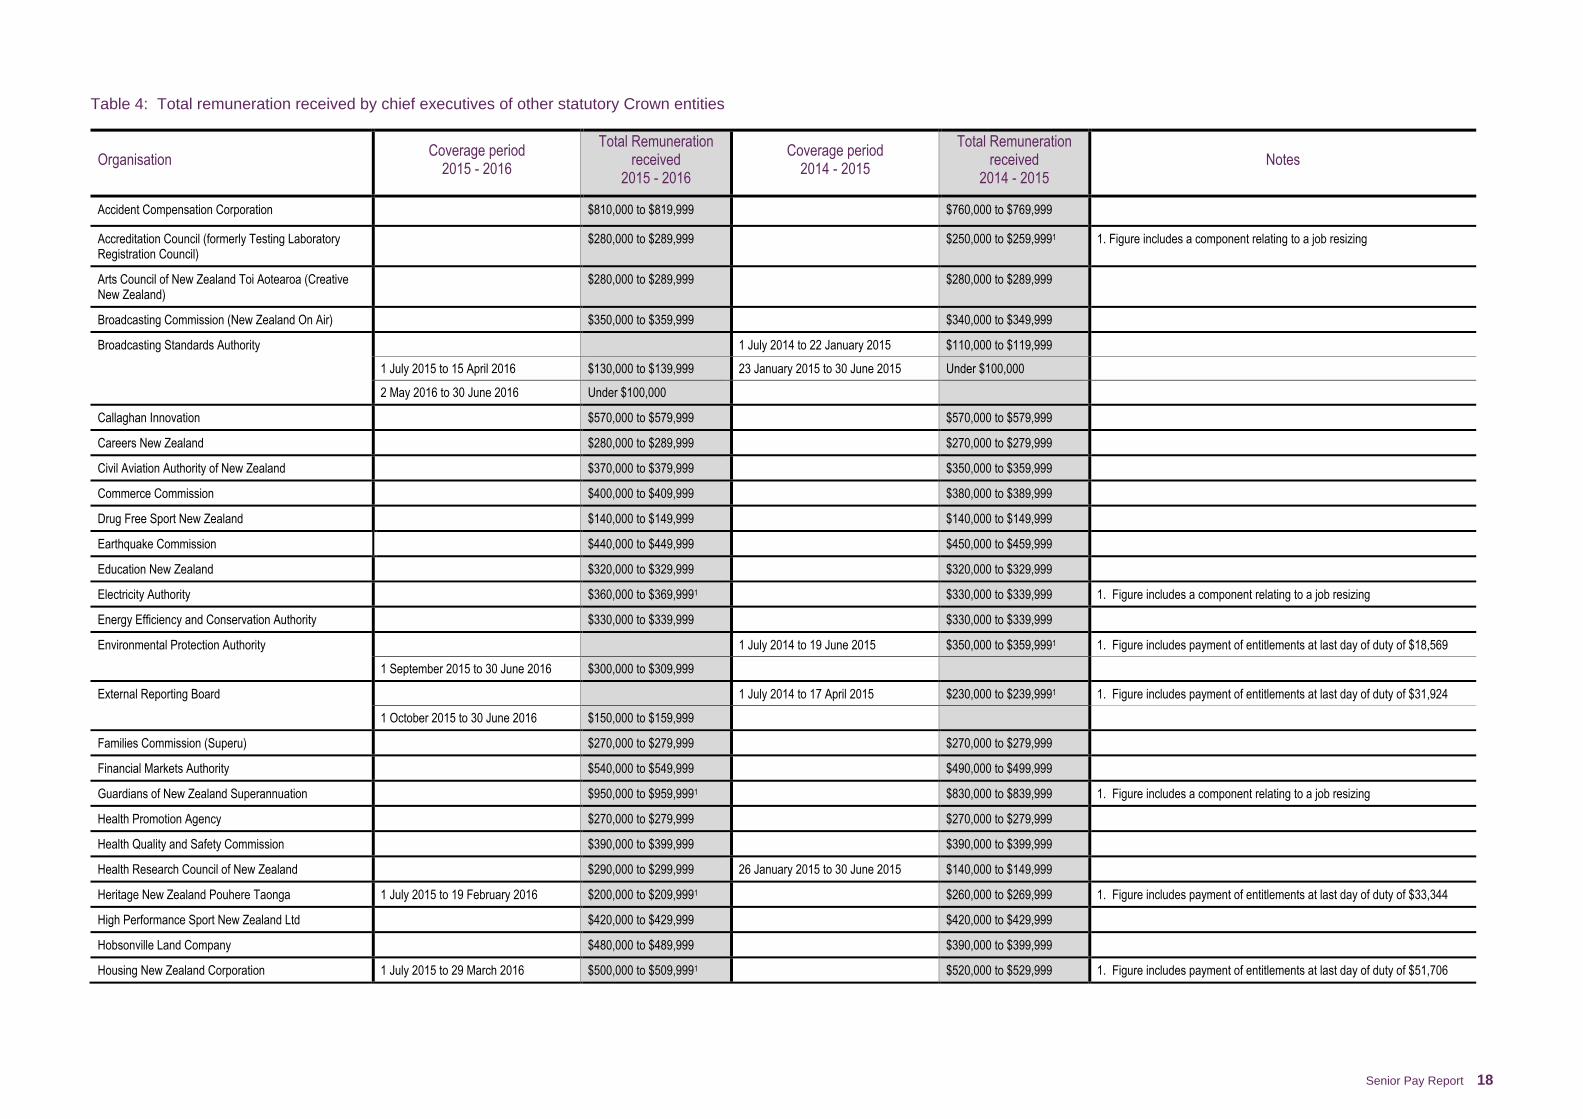
Table 4: Total remuneration received by chief executives of other statutory Crown entities
Organisation Coverage period
2015 - 2016
Total Remuneration received
2015 - 2016
Coverage period 2014 - 2015
Total Remuneration received
2014 - 2015 Notes
Accident Compensation Corporation $810,000 to $819,999 $760,000 to $769,999
Accreditation Council (formerly Testing Laboratory Registration Council)
$280,000 to $289,999 $250,000 to $259,9991 1. Figure includes a component relating to a job resizing
Arts Council of New Zealand Toi Aotearoa (Creative New Zealand)
$280,000 to $289,999 $280,000 to $289,999
Broadcasting Commission (New Zealand On Air) $350,000 to $359,999 $340,000 to $349,999
Broadcasting Standards Authority 1 July 2014 to 22 January 2015 $110,000 to $119,999
1 July 2015 to 15 April 2016 $130,000 to $139,999 23 January 2015 to 30 June 2015 Under $100,000
2 May 2016 to 30 June 2016 Under $100,000
Callaghan Innovation $570,000 to $579,999 $570,000 to $579,999
Careers New Zealand $280,000 to $289,999 $270,000 to $279,999
Civil Aviation Authority of New Zealand $370,000 to $379,999 $350,000 to $359,999
Commerce Commission $400,000 to $409,999 $380,000 to $389,999
Drug Free Sport New Zealand $140,000 to $149,999 $140,000 to $149,999
Earthquake Commission $440,000 to $449,999 $450,000 to $459,999
Education New Zealand $320,000 to $329,999 $320,000 to $329,999
Electricity Authority $360,000 to $369,9991 $330,000 to $339,999 1. Figure includes a component relating to a job resizing
Energy Efficiency and Conservation Authority $330,000 to $339,999 $330,000 to $339,999
Environmental Protection Authority 1 July 2014 to 19 June 2015 $350,000 to $359,9991 1. Figure includes payment of entitlements at last day of duty of $18,569
1 September 2015 to 30 June 2016 $300,000 to $309,999
External Reporting Board 1 July 2014 to 17 April 2015 $230,000 to $239,9991 1. Figure includes payment of entitlements at last day of duty of $31,924
1 October 2015 to 30 June 2016 $150,000 to $159,999
Families Commission (Superu) $270,000 to $279,999 $270,000 to $279,999
Financial Markets Authority $540,000 to $549,999 $490,000 to $499,999
Guardians of New Zealand Superannuation $950,000 to $959,9991 $830,000 to $839,999 1. Figure includes a component relating to a job resizing
Health Promotion Agency $270,000 to $279,999 $270,000 to $279,999
Health Quality and Safety Commission $390,000 to $399,999 $390,000 to $399,999
Health Research Council of New Zealand $290,000 to $299,999 26 January 2015 to 30 June 2015 $140,000 to $149,999
Heritage New Zealand Pouhere Taonga 1 July 2015 to 19 February 2016 $200,000 to $209,9991 $260,000 to $269,999 1. Figure includes payment of entitlements at last day of duty of $33,344
High Performance Sport New Zealand Ltd $420,000 to $429,999 $420,000 to $429,999
Hobsonville Land Company $480,000 to $489,999 $390,000 to $399,999
Housing New Zealand Corporation 1 July 2015 to 29 March 2016 $500,000 to $509,9991 $520,000 to $529,999 1. Figure includes payment of entitlements at last day of duty of $51,706

Senior Pay Report 19
Organisation Coverage period
2015 - 2016
Total Remuneration received
2015 - 2016
Coverage period 2014 - 2015
Total Remuneration received
2014 - 2015 Notes
Human Rights Commission 1 July 2014 to 15 January 2015 $270,000 to $279,9991 1. Figure includes payment of entitlements at last day of duty of $111,955
$240,000 to $249,999 16 January 2015 to 30 June 2015 Under $100,000
Maritime New Zealand (Maritime Safety Authority of New Zealand)
$310,000 to $319,999 $300,000 to $309,999
Museum of New Zealand Te Papa Tongarewa 1 July 2014 to 8 September 2014 $150,000 to $159,9991 1. Figure includes payment of entitlements at last day of duty of $90,770
$480,000 to $489,999 24 November 2014 to 30 June 2015 $290,000 to $299,999
New Zealand Antarctic Institute (Antarctica New Zealand)
$320,000 to $329,999 $310,000 to $319,999
New Zealand Artificial Limb Service 1 July 2014 to 25 January 2015 $180,000 to $189,9991 1. Figure includes a component relating to a job resizing
$190,000 to $199,9992 26 January 2015 to 30 June 2015 Under $100,000 2. Figure includes payment of entitlements at last day of duty of $32,571
New Zealand Blood Service 1 July 2014 to 17 April 2015 $350,000 to $359,9991 1. Figure includes payment of entitlements at last day of duty of $61,979
$270,000 to $279,999 18 April 2015 to 30 June 2015 Under $100,000
New Zealand Film Commission $290,000 to $299,999 $260,000 to $269,999
New Zealand Fire Service Commission $400,000 to $409,999 $400,000 to $409,999
New Zealand Food Innovation Ltd (Foodbowl) 1 July 2015 to 31 December 2015 $130,000 to $139,999 $290,000 to $299,999
1 January 2016 to 30 June 2016 Under $100,000
New Zealand Lotteries Commission $460,000 to $469,999 $440,000 to $449,999
New Zealand Productivity Commission $170,000 to $179,999 $160,000 to $169,999
New Zealand Qualifications Authority $450,000 to $459,999 $440,000 to $449,999
New Zealand Symphony Orchestra $260,000 to $269,999 $250,000 to $259,999
New Zealand Teachers Council 1 July 2014 to 3 September 2014 Under $100,0001 1. Figure includes payment of entitlements at last day of duty of $63,903 Organisation replaced by Education Council of Aotearoa NZ from 1 July 2015
New Zealand Tourism Board (Tourism New Zealand) $490,000 to $499,999 $590,000 to $599,999
New Zealand Trade and Enterprise $640,000 to $649,9991 $570,000 to $579,999 1. Figure includes a component relating to a job resizing
New Zealand Transport Agency 1 July 2015 to 18 December 2015 $710,000 to $719,9991 $660,000 to $669,9992 1. Figure includes payment of entitlements at last day of duty of $259,989 2. Figure includes a component relating to a job resizing
1 March 2016 to 30 June 2016 $180,000 to $189,999
New Zealand Walking Access Commission 1 July 2015 to 26 February 2016 $150,000 to $159,9991 $170,000 to $179,999 1. Figure includes payment of entitlements at last day of duty of $26,302
29 February 2016 to 30 June 2016 Under $100,000
Pharmaceutical Management Agency $390,000 to $399,999 $380,000 to $389,9991 1. Figure includes a component relating to a job resizing
Public Trust $480,000 to $489,999 $470,000 to $479,999
Real Estate Agents Authority $230,000 to $239,999 $230,000 to $239,999
Social Workers Registration Board $140,000 to $149,999 $140,000 to $149,999
Sport New Zealand $380,000 to $389,999 $370,000 to $379,999

Senior Pay Report 20
Organisation Coverage period
2015 - 2016
Total Remuneration received
2015 - 2016
Coverage period 2014 - 2015
Total Remuneration received
2014 - 2015 Notes
Standards Council (Standards New Zealand) Standards Council became part of the Ministry of Business Innovation and Employment on 1 March 2016
Takeovers Panel $280,000 to $289,999 $290,000 to $299,999
Te Reo Whakapuaki Irirangi (Te Māngai Pāho, Māori Broadcasting Funding Agency)
$220,000 to $229,999 $220,000 to $229,9991 1. Figure includes a component relating to a job resizing
Te Taura Whiri I Te Reo Māori (Māori Language Commission)
16 August 2014 to 31 October 2014 Under $100,0001 1. Figure includes payment of entitlements after last day of duty of $22,100
31 August 2015 to 30 June 2016 $150,000 to $159,999
Telarc SAI Ltd 1 July 2014 to 7 November 2014 $130,000 to $139,9991 1. Figure includes payment of entitlements after last day of duty of $21,600. Figure also includes component relating to a job resizing
$210,000 to $219,999 1 April 2015 to 30 June 2015 Under $100,000
Tertiary Education Commission $500,000 to $509,999 $470,000 to $479,999
Transport Accident Investigation Commission $220,000 to $229,999 $220,000 to $229,999
Worksafe New Zealand $310,000 to $319,999 $340,000 to $349,999
Notes
Crown entity CE remuneration is set by the Board after consultation with the State Services Commissioner. Under the Crown Entities Act 2004, Boards of other statutory Crown entities (excluding District Health Boards and Tertiary
Education Institutions) are responsible for setting their CEs’ remuneration but are required to consult with the Commissioner on changes to their CEs’ remuneration. The Commissioner provides all board chairs with guidance when
considering increases to CE remuneration which is consistent with remuneration movements in the broader State sector workforce. This indicates the Commissioner’s expectations for reasonable increases, taking into account individual
performance, and a CE’s position in a remuneration range.
The Commissioner provides all board chairs with guidance when considering increases to CE remuneration which is also consistent with remuneration movements in the broader State sector workforce. This indicates the Commissioner’s
expectations for reasonable increases, taking into account individual performance, and a CE’s position in a remuneration range. The guidance indicated increases for CEs meeting expectations of between 0% and 3%.
Changes in reported remuneration between years can be driven by factors other than performance. These include CEs working only part of the year and payment of contractual entitlements at the end of a CE’s term (refer to the technical
notes for a full list of factors). These factors are present in every year and impact on reported figures to a greater or lesser extent in all financial years.
For the 2015/2016 year, the average increase to total remuneration packages for Other Statutory Crown entity CEs (whose remuneration reviews were completed and advised to SSC by 30 June 2016) was 3.8%, and the median was
2.7%. Excluding the additional increases related to job resizing, the average increase was 2.3%, and the median was 2.6%.

Senior Pay Report 21
Table 5: Total remuneration received by chief executives and other senior staff under the jurisdiction of the Remuneration Authority
The CEs included in this table have their remuneration set by the Remuneration Authority.
Organisation Coverage Period
2015 – 2016
Total Remuneration received
2015 - 2016
Coverage Period 2014 - 2015
Total Remuneration received
2014 - 2015 Notes
Chief of the New Zealand Defence Force $650,000 to $659,999 $630,000 to $639,999
Chief Ombudsman 1 July 2015 to 9 December 2015 $200,000 to $209,9991 $370,000 to $379,999 1. Figure includes payment of entitlements at last day of service of $38,864
10 December 2015 to 30 June 2016 $200,000 to $209,999
Chief Parliamentary Counsel 1 July 2015 to 6 May 2016 $350,000 to $359,9991 $380,000 to $389,999 1. Figure includes payment of entitlements at last day of service of $10,668
7 May 2016 to 30 June 2016 Under $100,000
Clerk of the House of Representatives 1 July 2015 to 5 July 2015 $250,000 to $259,9991 $360,000 to $369,999 1. Figure includes payment of entitlements at last day of service of $250,000
6 July 2015 to 30 June 2016 $360,000 to $369,999
Commissioner of Police $670,000 to $679,999 $680,000 to $689,999
Controller and Auditor-General $570,000 to $579,999 $560,000 to $569,999
Deputy State Services Commissioner 1 July 2014 to 30 April 2015 $420,000 to $429,9991 1. Figure includes payment of entitlements at last day of duty of $8,373
1 July 2015 to 9 August 2015 Under $100,000 1 May 2015 to 30 June 2015 Under $100,000
1 July 2015 to 30 June 2016 $410,000 to $419,999
Director of the Government Communications Security Bureau
1 July 2014 to 28 February 2015 $390,000 to $399,9991 1. Figure includes payment of entitlements at last day of duty of $48,227
1 July 2015 to 10 February 2016 $230,000 to $239,999 2 March 2015 to 30 June 2015 Under $100,000
26 April 2016 to 30 June 2016 Under $100,000
Director of the New Zealand Security Intelligence Service
$370,000 to $379,999 $370,000 to $379,999
General Manager of the Parliamentary Service $350,000 to $359,999 $340,000 to $349,999
Parliamentary Commissioner for the Environment $320,000 to $329,999 $310,000 to $319,999
Solicitor-General 1 July 2015 to 12 February 2016 $400,000 to $409,999 $600,000 to $609,999
15 February 2016 to 30 June 2016 $230,000 to $239,999
State Services Commissioner $760,000 to $769,9991 $650,000 to $659,999 1. Figure includes payment of entitlements at last day of duty of $93,476
Notes
The CEs included in this table have their remuneration set by the Remuneration Authority.
The Remuneration Authority reviews the remuneration of all positions in its jurisdiction every year. Section 14 of the Remuneration Authority Act 1977 provides that once the Authority has made a determination, the recipients of that
determination cannot decline or amend it in any way.
At the time of establishing the pay scale for 2015/2016 (May to August 2015) the volatility in commodity prices, particularly in the dairy sector, was causing some stress on economic projections. In line with the requirement in the
Remuneration Act 1977 to take into consideration adverse economic circumstances, the Authority held its payline increase to less than 2%, slightly below the wage movements in the public sector.
Changes in reported remuneration between years can be driven by factors other than performance. These include CEs working only part of the year and payment of contractual entitlements at the end of a CE’s term (refer to the Technical
Notes for a full list of factors). These factors are present in every year and impact on reported figures to a greater or lesser extent in all financial years.

Senior Pay Report 22
CE Disclosures
Technical Notes
Cabinet has agreed that remuneration paid to Public Service and Crown entity CEs should be disclosed
annually in one location. This provides transparency for the taxpaying public around the level of
remuneration received by senior State servants.
This report is based on total remuneration received over the course of the year including base salary,
performance related payments, superannuation contributions and any other benefits received, such as
additional leave. It may include entitlements paid at the end of a contract, such as payment of outstanding
annual leave balances.
Public Service, district health board, tertiary education institution and other statutory Crown entity
information has been separated into four tables:
Tables 1 to 4 present remuneration information for CEs of organisations across the State sector where
the Commissioner has an influence over their remuneration: the Public Service and the wider State
sector2. Remuneration paid to acting CEs from within the relevant organisations is not included, except
for Public Service departments where the Commissioner sets remuneration.
The CEs included in Table 5 have their remuneration set by the Remuneration Authority.
The sums reported in the tables are largely consistent with the requirements of section 211 of the
Companies Act 1993. They reflect the total remuneration received by the employee in the financial year
indicated. Where the reported remuneration is for a period of less than 12 months, the effective period is
indicated.
The information disclosed each year presents the total remuneration actually received by each CE for the
financial year in $10,000 bands. Total remuneration includes any benefit received by the CE that is
specified in their employment agreement, such as performance pay, employer contributions to
superannuation, the value of the use of a vehicle, any annual leave in excess of the 20 days per annum,
and any end of term entitlements paid.
The non-Public Service organisations listed supplied their own information. While the State Services
Commission has checked the accuracy of the information to the best of its ability, the final responsibility
for accuracy lies with the body that sets the remuneration.
Increases in remuneration for CEs between the 2014/15 and 2015/16 years generally relate to a CE’s
performance in the 2015/16 year. However, movements in remuneration for individual CEs from year to
year need to be interpreted with caution for a number of reasons:
The timing of pay periods during the year, which may result in a CE receiving 27 fortnightly pays during
the year. This occurred in 2015/16.
The timing of performance and remuneration reviews and performance payments can result in one or
more than one performance payment being made during the year, and back-pay of any remuneration
increases. In 2014/15 performance payments for Public Service CEs covered a performance period
of six months only and were pro-rated accordingly.
2 Table 4 does not include organisations that are not Crown entities but are required by their enabling legislation to consult the
Commissioner on their CE’s remuneration, such as the Māori Television Service.

Senior Pay Report 23
Measured job size increases leading to an increase in remuneration (CE job sizing is undertaken by
independent consultants).
Some CEs started the role sometime after the beginning of the year, so their payment for the year is
for part of the year only.
Some CEs finish in their role during the year. The figure disclosed as the payment on the last day of
duty refers to their contractual entitlements which may include retiring leave, annual leave not taken
and employer superannuation payments owing on end of term entitlements.
Some CEs received a remuneration increase to address a job size increase. (When a CE’s role is
considered to have changed in scale, scope and/or complexity, an independent consultant is engaged
to review the job size. An increase in job size sometimes results in an increase in pay.)
Entitlements on the last day of duty, which may include retiring leave, annual leave not taken, employer
superannuation payments owing on end of term entitlements.
Previous reports contained details of staff earning more than $100,000. This information can now be
found on SSC’s website http://www.ssc.govt.nz/public-service-workforce-data/hrc-remuneration
For more information on Public Service executive management see this report:
http://www.ssc.govt.nz/approach-statesector-executive-management