Embed Size (px)
DESCRIPTION
This is my completed senior design project for Mining Engineering Majors at Virginia Tech. This site is an iron mine located between New York City and Philadelphia. Group members: Evan Halleran, Ryan Ward, Annette Thomas, Lucas Carver
Citation preview
REL Co. CEO’s
8 May 2013
Erik Westman Associate Professor Virginia Polytechnic Institute and State University 108A Holden Hall Blacksburg, VA 24060 Professor Westman, This report presents all the components needed for planning, starting, operating, and closing the Bass River Mine. This site will be an iron mine in south eastern New Jersey near the cities of Philadelphia and New York City. This report provides the basic information needed to start a mining project near Bass River New Jersey. The material is based off drill hole data provided to the company and this design has been underway for almost an entire year. There is information regarding the exploration of the site and the determination of its economic feasibility. The report also contains a mine site design, the equipment needed, and maps of surface/processing facilities needed. Included are all regulations presented by the state of New Jersey and the U.S. government. The report contains theoretical calculations for all the production needed to completely mine all ore economic at the site. Finally, the report contains the information for the closure and reclamation of the mine site. We are presenting the mine design with the hopes that all components are ready so the site can be purchased. Please contact us at your soonest convenience with all questions and comments so that we may continue toward our goal at the Bass River Mine site. Sincerely, REL Co. CEOs Lucas Carver, Evan Halleran, Annette Thomas, Ryan Ward Encl. 16 Chapter Reports, Appendixes, and Works Cited
Bass River Mine Site
Table of Contents i
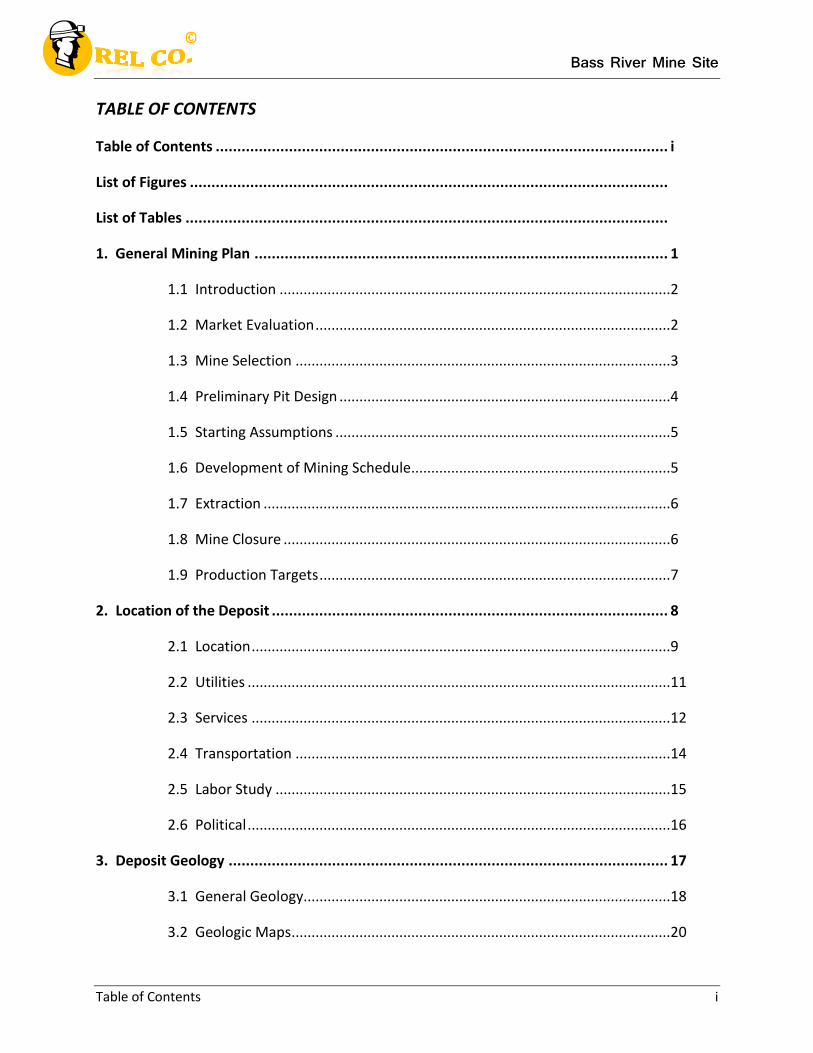
TABLE OF CONTENTS
Table of Contents ......................................................................................................... i
List of Figures ...............................................................................................................
List of Tables ................................................................................................................
1. General Mining Plan ................................................................................................ 1
1.1 Introduction ..................................................................................................2
1.2 Market Evaluation .........................................................................................2
1.3 Mine Selection ..............................................................................................3
1.4 Preliminary Pit Design ...................................................................................4
1.5 Starting Assumptions ....................................................................................5
1.6 Development of Mining Schedule.................................................................5
1.7 Extraction ......................................................................................................6
1.8 Mine Closure .................................................................................................6
1.9 Production Targets ........................................................................................7
2. Location of the Deposit ............................................................................................ 8
2.1 Location .........................................................................................................9
2.2 Utilities ..........................................................................................................11
2.3 Services .........................................................................................................12
2.4 Transportation ..............................................................................................14
2.5 Labor Study ...................................................................................................15
2.6 Political ..........................................................................................................16
3. Deposit Geology ...................................................................................................... 17
3.1 General Geology ............................................................................................18
3.2 Geologic Maps ...............................................................................................20
Bass River Mine Site
Table of Contents ii
3.3 Stratigraphic Data .........................................................................................20
3.4 Deposit Data ..................................................................................................21
3.5 Property Cross-Sections ................................................................................22
4. Deposit Exploration ................................................................................................. 25
4.1 Exploration Program .....................................................................................26
4.2 Tabulated Drill Hole Data ..............................................................................28
4.3 Deposit and Seam Properties........................................................................28
4.4 Related Strata Properties ..............................................................................30
4.5 Exploration Maps ..........................................................................................30
5. Reserve Estimation .................................................................................................. 33
5.1 Overview .......................................................................................................34
5.2 Preliminary Estimation ..................................................................................34
5.3 Detailed Estimation .......................................................................................37
5.4 Reserve Summary .........................................................................................38
6. Mining Equipment ................................................................................................... 39
6.1 Drilling and Blasting .......................................................................................40
6.2 Excavation Equipment ..................................................................................40
6.3 Primary haulage Equipment..........................................................................42
6.4 Miscellaneous Production Equipment ..........................................................44
6.5 Equipment Performance ...............................................................................47
6.6 Mining and Ancillary Equipment Costs .........................................................48
7. Health and Safety .................................................................................................... 50
7.1 Pertinent Regulations ...................................................................................51
7.2 Potential Hazards ..........................................................................................53
Bass River Mine Site
Table of Contents iii
7.3 Contact Personnel .........................................................................................54
7.4 Education and Training .................................................................................55
7.5 Inspecitons ....................................................................................................56
7.6 Emergency Response Plan (ERP) ...................................................................57
7.7 Hazard Identification and Controls ...............................................................59
8. Surface Facilities ...................................................................................................... 62
8.1 Introduction ..................................................................................................63
8.2 Surface Construction .....................................................................................63
8.3 Surface Structures .........................................................................................64
8.4 Surface Facilities ............................................................................................66
8.5 Surface Facility Cost ......................................................................................67
9. Detailed Mine Design ............................................................................................... 69
9.1 Overview .......................................................................................................70
9.2 Development .................................................................................................72
9.3 Detailed Extraction Plan ................................................................................74
9.4 Closure ..........................................................................................................83
10. Processing Facilities ............................................................................................... 86
10.1 Site Description ...........................................................................................87
10.2 Beneficiation Studies ..................................................................................88
10.3 Processing Equipment Cost .........................................................................90
11. Materials Handling ................................................................................................. 92
11.1 Description ..................................................................................................93
11.2 Layout ..........................................................................................................93
11.3 Handling Systems ........................................................................................94
Bass River Mine Site
Table of Contents iv
11.4 Storage ........................................................................................................95
11.5 Equipment Specifications ............................................................................96
11.6 Materials Handling Costs ............................................................................98
12. Personnel Requirements ........................................................................................ 102
12.1 Staffing Plan ................................................................................................103
12.2 Upper Management ....................................................................................103
12.3 Mining Operations ......................................................................................104
12.4 Processing Operations ................................................................................108
12.5 Other Personnel ..........................................................................................110
12.6 Personnel Costs ...........................................................................................113
13. Environmental Impacts and Sustainability .............................................................. 117
13.1 Land Surface Effects ....................................................................................118
13.2 Biological Effects .........................................................................................119
13.3 Hydrological Effects ....................................................................................119
13.4 Air Quality Effects........................................................................................120
13.5 Societal Effects ............................................................................................121
13.6 Miscellaneous Effects..................................................................................121
13.7 Mine Permits ...............................................................................................121
13.8 Reclamation ................................................................................................122
13.9 Sustainability Plan .......................................................................................124
13.10 Environmental Cost Summary ..................................................................125
14. Contractual Agreements ........................................................................................ 127
14.1 Ownership ...................................................................................................128
14.2 Mining Lease ...............................................................................................130
Bass River Mine Site
Table of Contents v
14.3 Market Evaluation .......................................................................................130
14.4 Sales Contract .............................................................................................131
15. Cost and Feasibility Analysis ................................................................................... 134
15.1 Estimated Capital Cost ................................................................................135
15.2 Estimated Operating Cost ...........................................................................136
15.3 Accounting Information ..............................................................................137
15.4 Feasibility Analysis ......................................................................................139
16. Summary and Conclusions...................................................................................... 144
16.1 Mine Description .........................................................................................145
16.2 Technical Issues and Concerns ....................................................................146
16.3 Financial Feasibility .....................................................................................147
16.4 Conclusion and Recommendation ..............................................................148
References ................................................................................................................... 149
Appendices .................................................................................................................. 154
Appendix B ...........................................................................................................B-1
Appendix C ...........................................................................................................C-1
Appendix D ...........................................................................................................D-1
Appendix E ...........................................................................................................E-1
Appendix F ...........................................................................................................F-1
Appendix H ...........................................................................................................H-1
Appendix I ............................................................................................................I-1
Appendix J ............................................................................................................J-1
Appendix K ...........................................................................................................K-1
Appendix L ............................................................................................................L-1
Bass River Mine Site
Table of Contents vi
Appendix N ...........................................................................................................N-1
Appendix O ...........................................................................................................O-1
Bass River Mine Site
List of Figures vii
LIST OF FIGURES
Figure 1-1: Google Map Image of Bass River Property ..........................................................4
Figure 2-1: Location of West Tuckerton and Bass River Mine ...............................................9
Figure 2-2: Topography Map of the Bass River Mine Property .............................................10
Figure 2-3: Hammonton Airport and Atlantic City Expressway .............................................15
Figure 3-1: Geologic Regions of New Jersey ..........................................................................19
Figure 3-2: Drill Hole Positioning and Cross-Section Cut Lines ..............................................22
Figure 3-3: East-West and North-South Cross-Sections of Bass River Mine Site ..................23
Figure 3-4: Three Dimensional View of Geological Columns .................................................24
Figure 4-1: Block Site Model Using Carlson Mining Software ...............................................27
Figure 4-2: Composition of the Cohansey Formation ............................................................29
Figure 4-3: Bass River Mine Drill Hole Depth Map ................................................................31
Figure 4-4: Bass River Mine Drill Hole Elevation Map ...........................................................32
Figure 5-1: Surface Borehole Location and Preliminary Estimation Triangles ......................36
Figure 6-1: CAT 6030-FS .........................................................................................................41
Figure 6-2: CAT 6018-FS .........................................................................................................42
Figure 6-3: CAT 789c Haul Truck ............................................................................................43
Figure 6-4: CAT 785D Haul Truck ...........................................................................................44
Figure 6-5: Sanho Hydraulic Rock Breaker .............................................................................45
Figure 6-6: CASE 1150K Crawler ............................................................................................46
Figure 6-7: Mack Granite Water Truck ..................................................................................47
Figure 9-1: Mining Operation Layout .....................................................................................71
Figure 9-2: Development Schedule ........................................................................................74
Figure 9-3: Blast Design Layout ..............................................................................................77
Bass River Mine Site
List of Figures viii
Figure 9-4: Pit and Bench Layout ...........................................................................................78
Figure 9-5: Wedge Sliding ......................................................................................................79
Figure 9-6: Plane Sliding .........................................................................................................80
Figure 9-7: Toppling Failure ...................................................................................................80
Figure 9-8: Detailed Mine Closure Schedule .........................................................................84
Figure 11-1: Mine Layout .......................................................................................................94
Figure 14-1: Google Map of Bass River Mine Property .........................................................129
Figure 15-1: Capital Cost for Bass River Mine ........................................................................136
Figure 15-2: Annual Operating Cost for Bass River Mine ......................................................137
Figure 15-3: Cash Flow Diagram ............................................................................................140
Figure 15-4: Cumulative Net Present Value...........................................................................141
Figure 15-5: Net Present Value Sensitivity Analysis ..............................................................142
Figure 15-6: Rate of Return Sensitivity Analysis ....................................................................142
Figure B-1: Towns Near West Tuckerton and Bass River Mine .............................................B-1
Figure C-1: Detailed Geologic Map of New Jersey .................................................................C-1
Figure C-2: New Jersey Geological Survey .............................................................................C-2
Figure C-3: 7.5 Minute Quadrangle Map of Oswego Lake ....................................................C-3
Figure C-4: Topography Map of Southern Burlington County, New Jersey ..........................C-4
Figure F-1: 6018FS Full Simulation .........................................................................................F-1
Figure F-2: 6030FS Full Simulation .........................................................................................F-2
Figure H-1: Bass River Mine Surface Facility Layout ..............................................................H-4
Figure I-1: Bench Timeline Photo (Pit 1, Bench 2) .................................................................I-1
Figure I-2: Bench Timeline Photo (Pit 1, Bench 8) .................................................................I-1
Figure I-3: Bench Timeline Photo (Pit 2, Bench 2) .................................................................I-2
Bass River Mine Site
List of Figures ix
Figure I-4: Bench Timeline Photo (Pit 2, Bench 6) .................................................................I-2
Figure J-1: Aggflow Circuit .....................................................................................................J-1
Figure K-1: Conveyor System Layout .....................................................................................K-1
Figure O-1: Screenshot of DCF-ROR Analysis .........................................................................O-1
Bass River Mine Site
List of Tables x
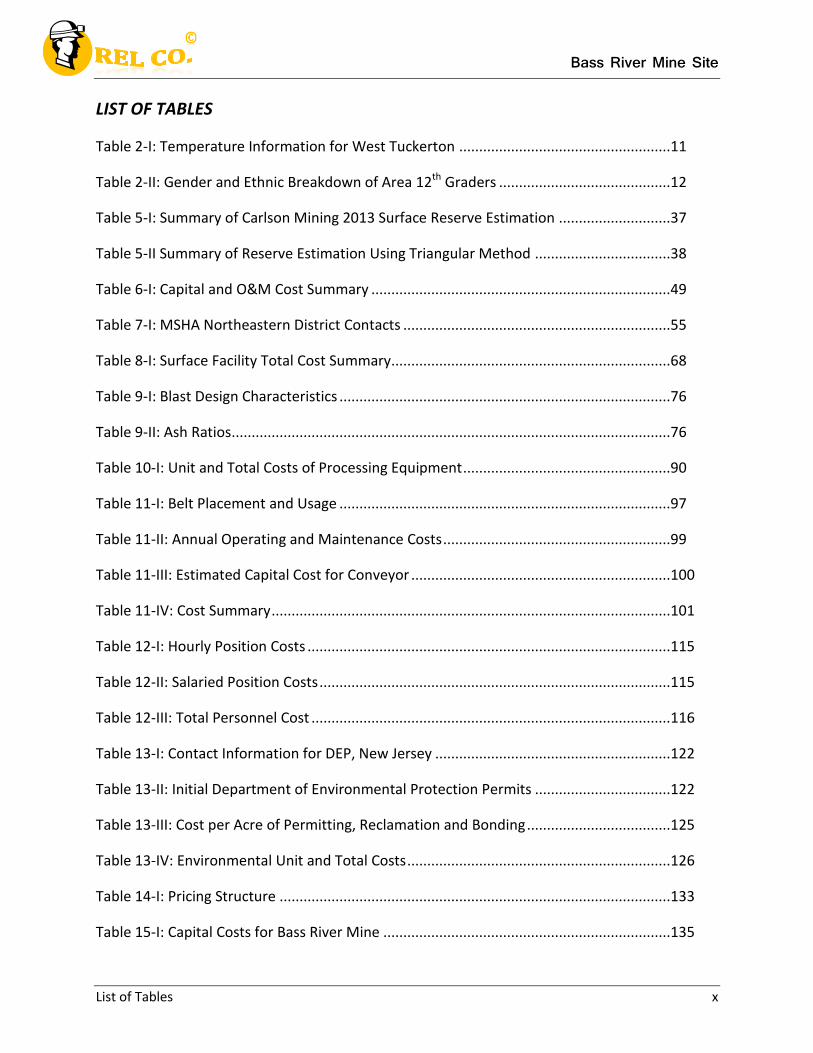
LIST OF TABLES
Table 2-I: Temperature Information for West Tuckerton .....................................................11
Table 2-II: Gender and Ethnic Breakdown of Area 12th Graders ...........................................12
Table 5-I: Summary of Carlson Mining 2013 Surface Reserve Estimation ............................37
Table 5-II Summary of Reserve Estimation Using Triangular Method ..................................38
Table 6-I: Capital and O&M Cost Summary ...........................................................................49
Table 7-I: MSHA Northeastern District Contacts ...................................................................55
Table 8-I: Surface Facility Total Cost Summary......................................................................68
Table 9-I: Blast Design Characteristics ...................................................................................76
Table 9-II: Ash Ratios ..............................................................................................................76
Table 10-I: Unit and Total Costs of Processing Equipment ....................................................90
Table 11-I: Belt Placement and Usage ...................................................................................97
Table 11-II: Annual Operating and Maintenance Costs .........................................................99
Table 11-III: Estimated Capital Cost for Conveyor .................................................................100
Table 11-IV: Cost Summary ....................................................................................................101
Table 12-I: Hourly Position Costs ...........................................................................................115
Table 12-II: Salaried Position Costs ........................................................................................115
Table 12-III: Total Personnel Cost ..........................................................................................116
Table 13-I: Contact Information for DEP, New Jersey ...........................................................122
Table 13-II: Initial Department of Environmental Protection Permits ..................................122
Table 13-III: Cost per Acre of Permitting, Reclamation and Bonding ....................................125
Table 13-IV: Environmental Unit and Total Costs ..................................................................126
Table 14-I: Pricing Structure ..................................................................................................133
Table 15-I: Capital Costs for Bass River Mine ........................................................................135
Bass River Mine Site
List of Tables xi
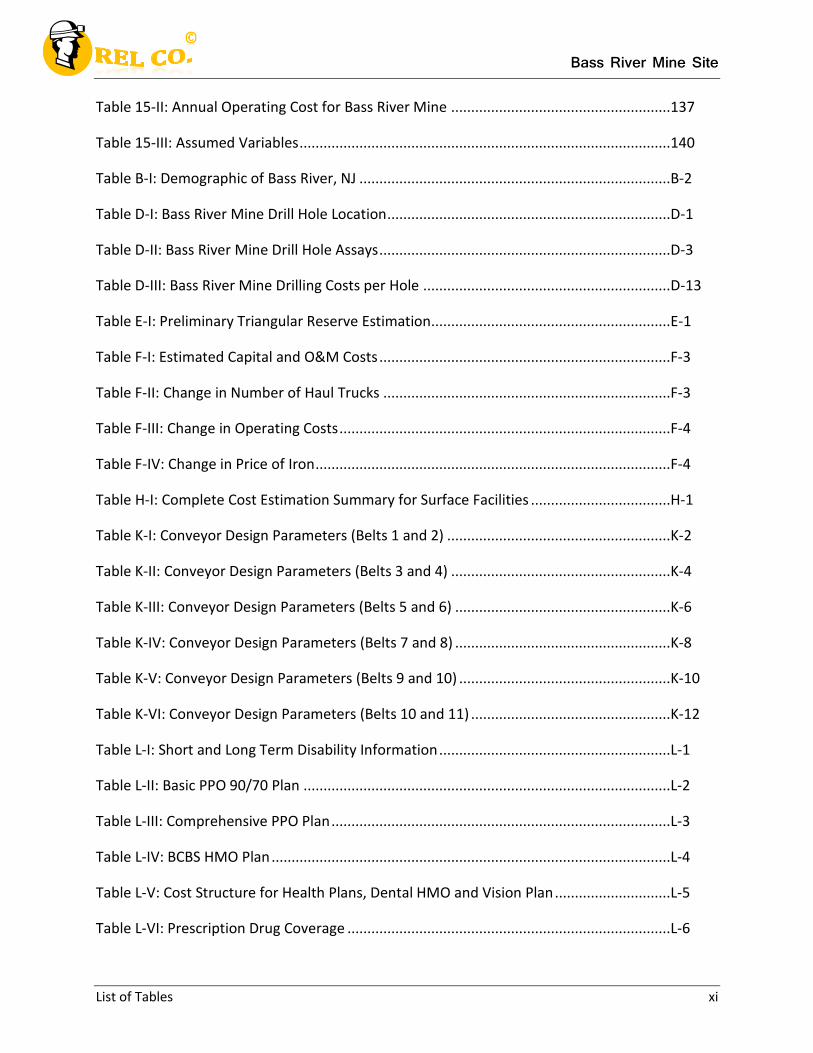
Table 15-II: Annual Operating Cost for Bass River Mine .......................................................137
Table 15-III: Assumed Variables .............................................................................................140
Table B-I: Demographic of Bass River, NJ ..............................................................................B-2
Table D-I: Bass River Mine Drill Hole Location .......................................................................D-1
Table D-II: Bass River Mine Drill Hole Assays .........................................................................D-3
Table D-III: Bass River Mine Drilling Costs per Hole ..............................................................D-13
Table E-I: Preliminary Triangular Reserve Estimation............................................................E-1
Table F-I: Estimated Capital and O&M Costs .........................................................................F-3
Table F-II: Change in Number of Haul Trucks ........................................................................F-3
Table F-III: Change in Operating Costs ...................................................................................F-4
Table F-IV: Change in Price of Iron .........................................................................................F-4
Table H-I: Complete Cost Estimation Summary for Surface Facilities ...................................H-1
Table K-I: Conveyor Design Parameters (Belts 1 and 2) ........................................................K-2
Table K-II: Conveyor Design Parameters (Belts 3 and 4) .......................................................K-4
Table K-III: Conveyor Design Parameters (Belts 5 and 6) ......................................................K-6
Table K-IV: Conveyor Design Parameters (Belts 7 and 8) ......................................................K-8
Table K-V: Conveyor Design Parameters (Belts 9 and 10) .....................................................K-10
Table K-VI: Conveyor Design Parameters (Belts 10 and 11) ..................................................K-12
Table L-I: Short and Long Term Disability Information ..........................................................L-1
Table L-II: Basic PPO 90/70 Plan ............................................................................................L-2
Table L-III: Comprehensive PPO Plan .....................................................................................L-3
Table L-IV: BCBS HMO Plan ....................................................................................................L-4
Table L-V: Cost Structure for Health Plans, Dental HMO and Vision Plan .............................L-5
Table L-VI: Prescription Drug Coverage .................................................................................L-6
Bass River Mine Site
List of Tables xii
Table L-VII: 401(k) Plan ..........................................................................................................L-6
Table L-VIII: Vacation Day Allotment .....................................................................................L-6
Table L-IX: Sick Leave Allotment ............................................................................................L-7
Table L-X: Group Life Insurance Rates ...................................................................................L-7
Table N-I: Population Data – New Jersey ...............................................................................N-1
Table N-II: Iron Steel Mill, Ferroalloy Manufacturing ............................................................N-2

Bass River Mine Site
General Mining Plan 1
REL Company
Chapter 1
Bass River Mine Project: General Mining Plan
Bass River Mine Site
General Mining Plan 2
1.1 Introduction
At Bass River Mine, magnesium iron silicate is surface mined and processed into
magnesium and iron separately. The mine is located 30 minutes north of Galloway, New Jersey.
The Bass River Mine consists of 2,500 acres of land with all mining rights and property rights
belonging to REL Co. REL Co.’s mission is to provide quality material for steel mills to propel the
building of infrastructure. A key objective of REL Co. is to provide safe working conditions for all
employees while minimizing mining effects on the environment. REL Co. promises to provide
quality health care for employees and their families while giving back to the community
through the establishment of special programs.
1.2 Market Evaluation
The potential market for REL Co is varied and substantial. Iron and magnesium are both
components in steel production. The Bass River Mine being located between the cities of
Philadelphia and New York City provides a large amount of demand for iron and magnesium
due to infrastructural growth and renewal. Each person in the United States uses an average of
400 pounds of steel per year (bbc). The population growth for Philadelphia and New York City
averages at 2.2 percent per year. The population of both cities is ten million in total, so the
growth rate is 220,000 people each year. This leads to 44 million pounds of steel demand
growth in the market. The market value of iron hit a high in 2011 and while decreasing, the
value has recently shown stabilization. Magnesium prices have been stable for the last three
years after hitting a large spike and then return to normal pricing.
Bass River Mine Site
General Mining Plan 3
1.3 Mine Selection
Open pit mining is a type of surface mining that suits relatively shallow deposits. By
utilizing the technique of drilling and blasting, the rock matter can be broken down into more
manageable sizes. The broken rock then can be transported to waste piles or processing
facilities. As the mine progresses, benches are created to both create mine depth and allow
equipment to traverse the site (Journal for Transportation of Materials in Bulk). The range of
core samples from the selected mine site indicate that magnesium iron is spread throughout
the entire depth, with the deepest core sample reaching just 580 feet below the surface. An
open pit mining operation would be the best option for extraction.
With the relative depth of the ore being so close to the surface open pit mining is the
most feasible option for extraction. The core samples indicate that there is less than 20 feet of
waste material above the deposit. In the best case scenario, 20 feet of overburden will be
removed to access the deposit down to 580 feet. This shows that profitable magnesium iron
can be very easily without worrying about the expensive removal of worthless material. This
means the theoretical stripping ratio could be as high as .04. With such a low stripping ratio, a
large amount of ore can be extracted, therefore increasing profitability.
Other methods of surface mining include contour mining, dredging, mountaintop
removal, placer mining and strip mining. Being located on a relatively flat parcel of land,
contour mining and mountaintop removal mining do not apply to the type of deposit the
magnesium iron is contained within. Dredging is for underwater deposits, again, does not apply
to the current deposit. Placer mining cannot be done since the deposit is not riverbed based or
Bass River Mine Site
General Mining Plan 4
alluvial in nature. Strip mining is essentially the same process of open pit mining but is more
focused on the removal of coal (Greatmining). Therefore, the most effective method will be
open pit.
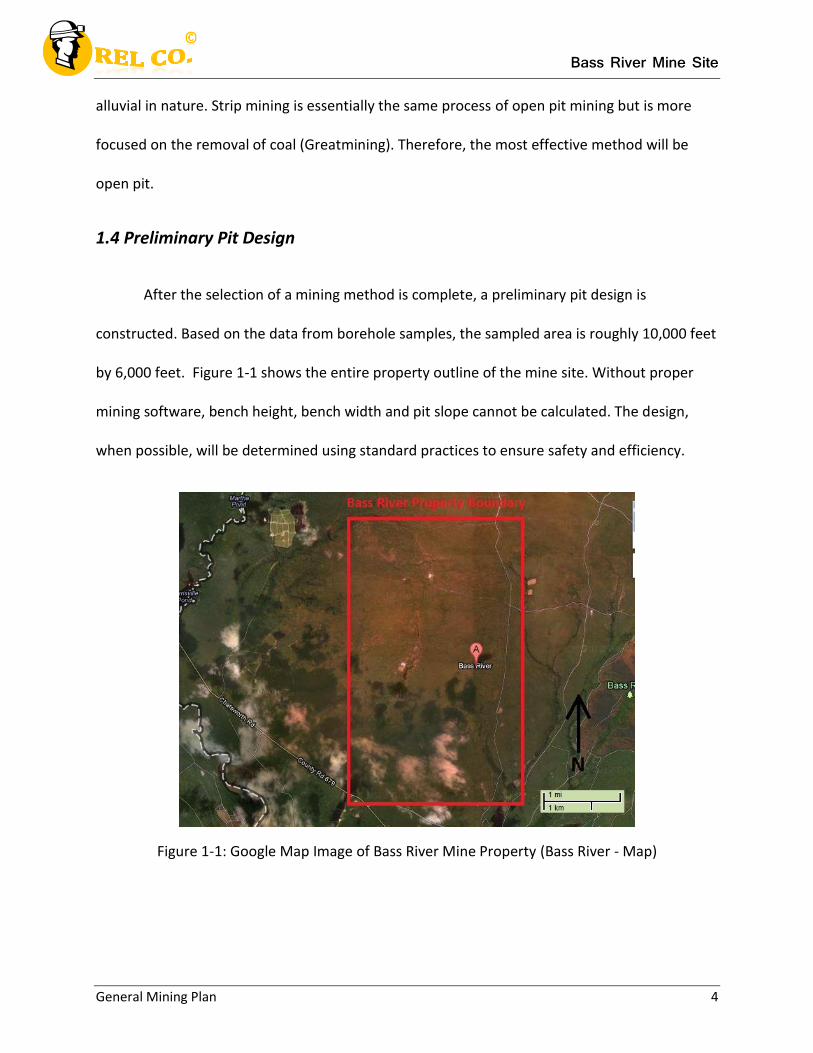
1.4 Preliminary Pit Design
After the selection of a mining method is complete, a preliminary pit design is
constructed. Based on the data from borehole samples, the sampled area is roughly 10,000 feet
by 6,000 feet. Figure 1-1 shows the entire property outline of the mine site. Without proper
mining software, bench height, bench width and pit slope cannot be calculated. The design,
when possible, will be determined using standard practices to ensure safety and efficiency.
Figure 1-1: Google Map Image of Bass River Mine Property (Bass River - Map)
Bass River Mine Site
General Mining Plan 5
1.5 Starting Assumptions
The Bass River magnesium iron mine will operate 52 weeks a year. The mine will
operate at 10 shifts a week, with two shifts per day. Taking into account down time at the plant
and necessary maintenance, the mine will produce sellable material 305 days a year. These
assumptions were used in the following evaluations of the Bass River mine.
1.6 Development of Mining Schedule
The development phase for the mine consists of a feasibility study. This study will take
place during the first year, after which temporary permits will be acquired for the
environmental survey so that the mining area can be purchased. To be able to obtain full
permits, an assessment of the environment must occur. With the assessment complete,
permits for the buildings, mineral removal, water usage, noise and air will be obtained. The
acquisition of all these surveys, permits and studies will take in the area of four years to
complete.
Once the permitting process is complete the development of the actual mining area can
occur. To begin, security fencing will be installed around the work area. Entry, exit and haul
roads will also be created on the property. Once this infrastructure is complete, a project team
will be selected to help oversee the continued production of the mine area. The team will then
begin work on the processing facilities and basic structures that the plant needs. Such
structures include truck garages and electrical switch houses. While the processing facilities are
being completed, the removal of overburden will begin from the mine site. The waste material
Bass River Mine Site
General Mining Plan 6
will be stored at a dump site on the mine property. The entire time from development until the
pit is ready to begin temporary production is around six years. In year seven, pit one will begin
production of material but will not be operating fully until year nine. After year nine the mine
will be in full production in its primary pit.
1.7 Extraction
Mining is planned to commence in year seven of the project. The average iron
magnesium content of the area being mined is 17.23% MgFe. The overburden that is removed
from this area will be stored in the waste site mentioned in the development section. The ore
that is taken from the pit will be hauled to primary crusher in the processing facility. Stock piles
will be created for the material to be placed in so the crusher will always have a supply of
material.
1.8 Mine Closure
The mine will continue through the production phase until all useable ore has been
removed. Once the production has been completed, reclamation and closure for the mine site
will begin. Throughout the reclamation process, the mined area will be turned back into a
hazard free area. During the development stage, an environmental bond will be purchased. In
order to get the bond funds back, the mine must follow its reclamation plan as stated in the
environmental assessment. A state commissioner will come to inspect the area after
reclamation is complete. Based on the compliance of federal and state regulations during
Bass River Mine Site
General Mining Plan 7
reclamation, the company can receive some or all money back spent on an environmental
bond.
1.9 Production Targets
The mine will produce 4 million tons of ore per year at a grade of 65% MgFe. To reach
this production the mine will have to remove 18.7 million tons of raw ore. This value was
calculated by using the recovery percentages and the concentration of ore sent to the plant.
The ore entering the plant has a grade of 17.23% MgFe, with the recovery percentages at 85%
and 95%. Avoiding outside factors, the plant runs 305 days a year. This will allow daily
production to be 61,312 tons and the shift production to be 30,656 tons.

Bass River Mine Site
Location of the Deposit 8
REL Company
Chapter 2
Bass River Mine Project: Location of the Deposit
Bass River Mine Site
Location of the Deposit 9
2.1 Location
The town of West Tuckerton is located in Little Egg Harbor Township, NJ. West
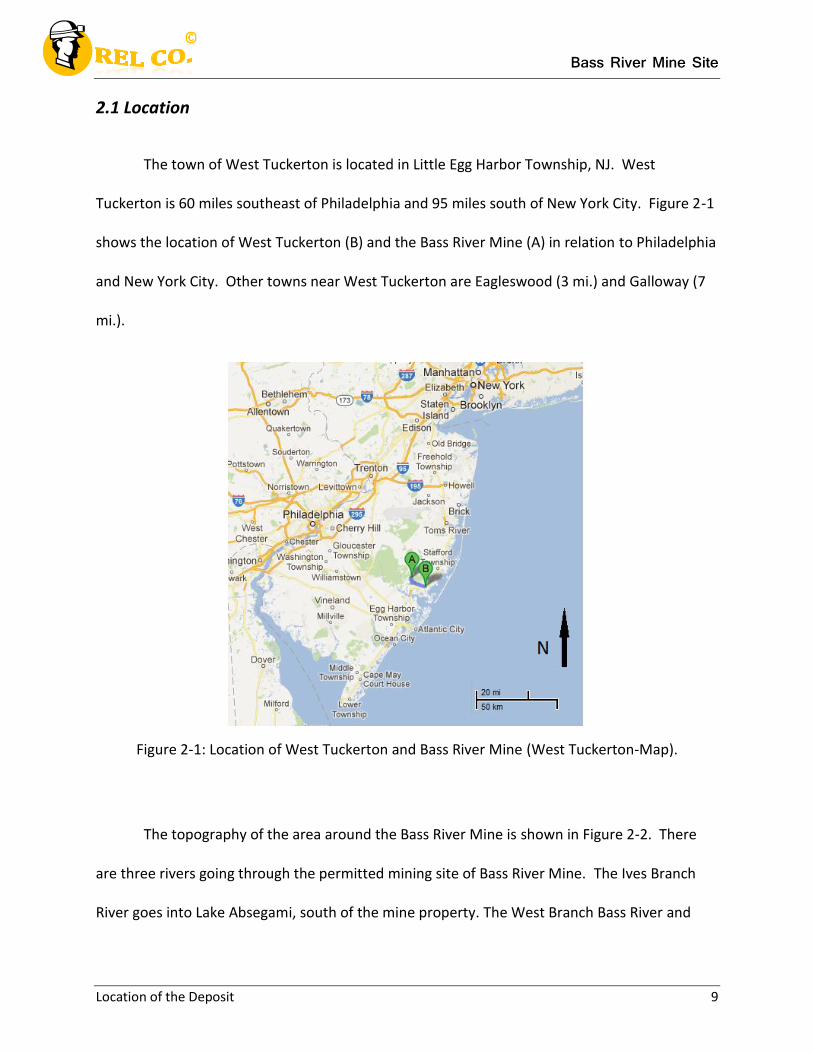
Tuckerton is 60 miles southeast of Philadelphia and 95 miles south of New York City. Figure 2-1
shows the location of West Tuckerton (B) and the Bass River Mine (A) in relation to Philadelphia
and New York City. Other towns near West Tuckerton are Eagleswood (3 mi.) and Galloway (7
mi.).
Figure 2-1: Location of West Tuckerton and Bass River Mine (West Tuckerton-Map).
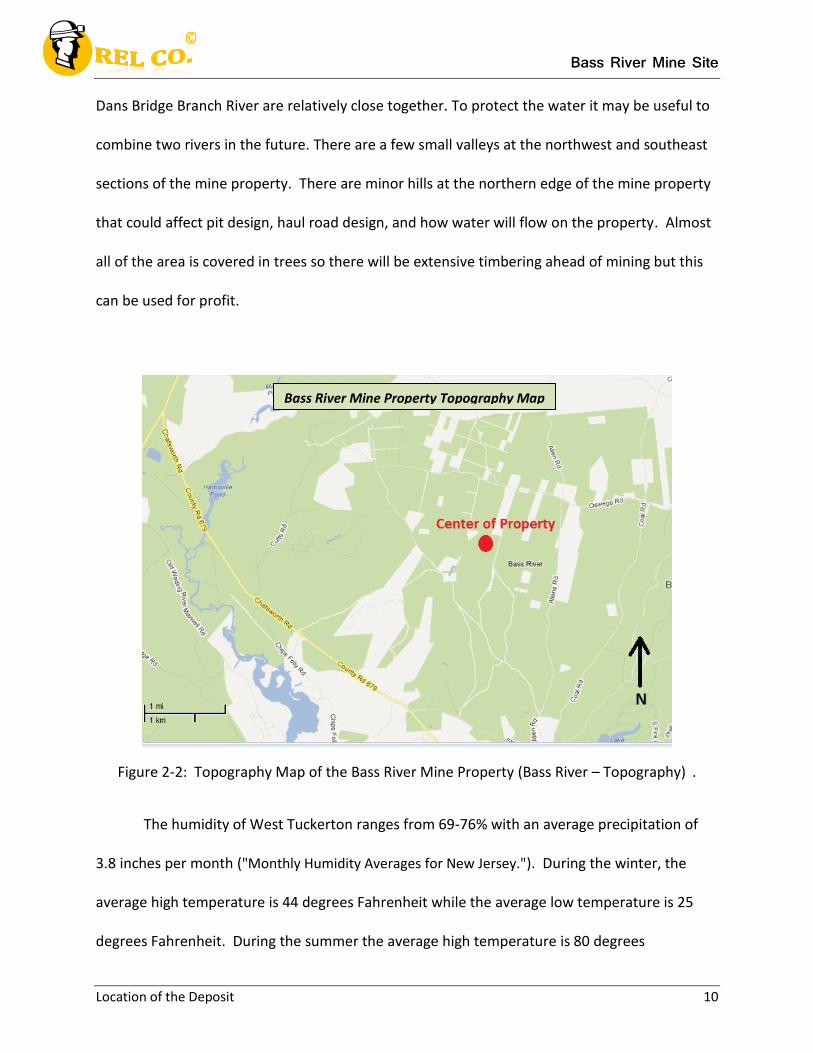
The topography of the area around the Bass River Mine is shown in Figure 2-2. There
are three rivers going through the permitted mining site of Bass River Mine. The Ives Branch
River goes into Lake Absegami, south of the mine property. The West Branch Bass River and
Bass River Mine Site
Location of the Deposit 10
Dans Bridge Branch River are relatively close together. To protect the water it may be useful to
combine two rivers in the future. There are a few small valleys at the northwest and southeast
sections of the mine property. There are minor hills at the northern edge of the mine property
that could affect pit design, haul road design, and how water will flow on the property. Almost
all of the area is covered in trees so there will be extensive timbering ahead of mining but this
can be used for profit.
Figure 2-2: Topography Map of the Bass River Mine Property (Bass River – Topography) .
The humidity of West Tuckerton ranges from 69-76% with an average precipitation of
3.8 inches per month ("Monthly Humidity Averages for New Jersey."). During the winter, the
average high temperature is 44 degrees Fahrenheit while the average low temperature is 25
degrees Fahrenheit. During the summer the average high temperature is 80 degrees
Bass River Mine Property Topography Map
Bass River Mine Site
Location of the Deposit 11
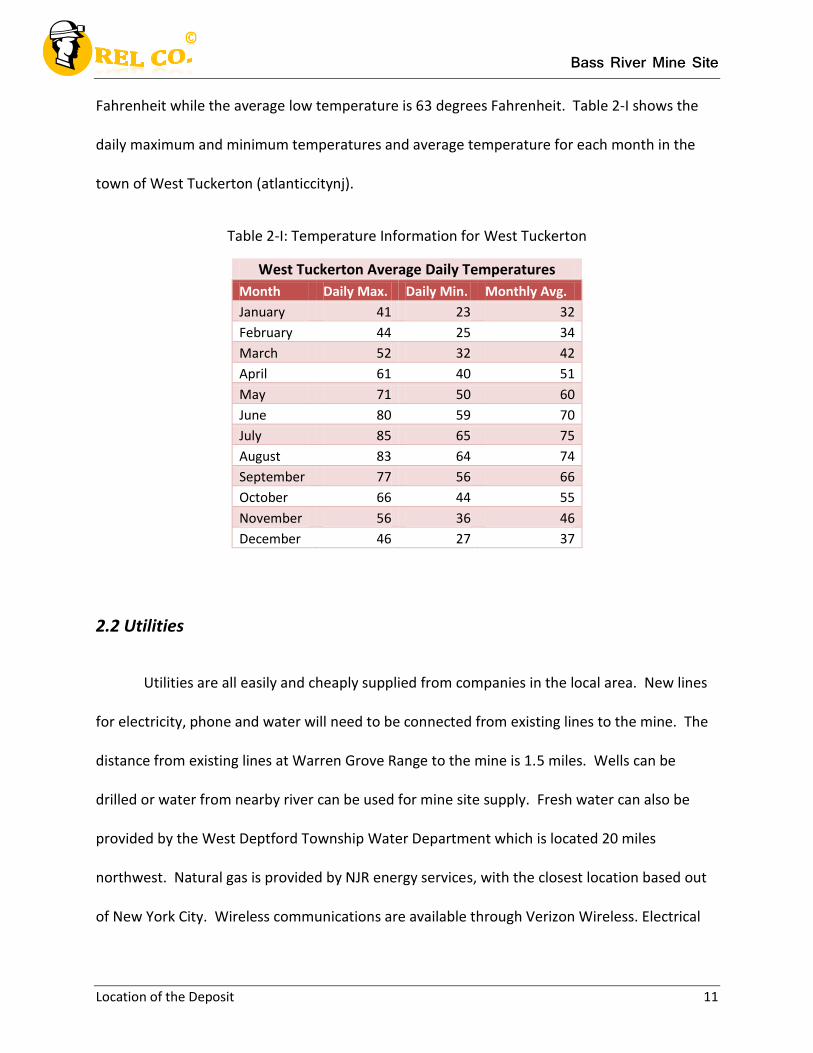
Fahrenheit while the average low temperature is 63 degrees Fahrenheit. Table 2-I shows the
daily maximum and minimum temperatures and average temperature for each month in the
town of West Tuckerton (atlanticcitynj).
Table 2-I: Temperature Information for West Tuckerton
West Tuckerton Average Daily Temperatures
Month Daily Max. Daily Min. Monthly Avg.
January 41 23 32
February 44 25 34
March 52 32 42
April 61 40 51
May 71 50 60
June 80 59 70
July 85 65 75
August 83 64 74
September 77 56 66
October 66 44 55
November 56 36 46
December 46 27 37
2.2 Utilities
Utilities are all easily and cheaply supplied from companies in the local area. New lines
for electricity, phone and water will need to be connected from existing lines to the mine. The
distance from existing lines at Warren Grove Range to the mine is 1.5 miles. Wells can be
drilled or water from nearby river can be used for mine site supply. Fresh water can also be
provided by the West Deptford Township Water Department which is located 20 miles
northwest. Natural gas is provided by NJR energy services, with the closest location based out
of New York City. Wireless communications are available through Verizon Wireless. Electrical
Bass River Mine Site
Location of the Deposit 12
service for the area is available from Warshauer Electric Supply, which has an office two miles
southeast in Little Egg Harbor. Waste disposal services can be contracted from a local
company.
2.3 Services
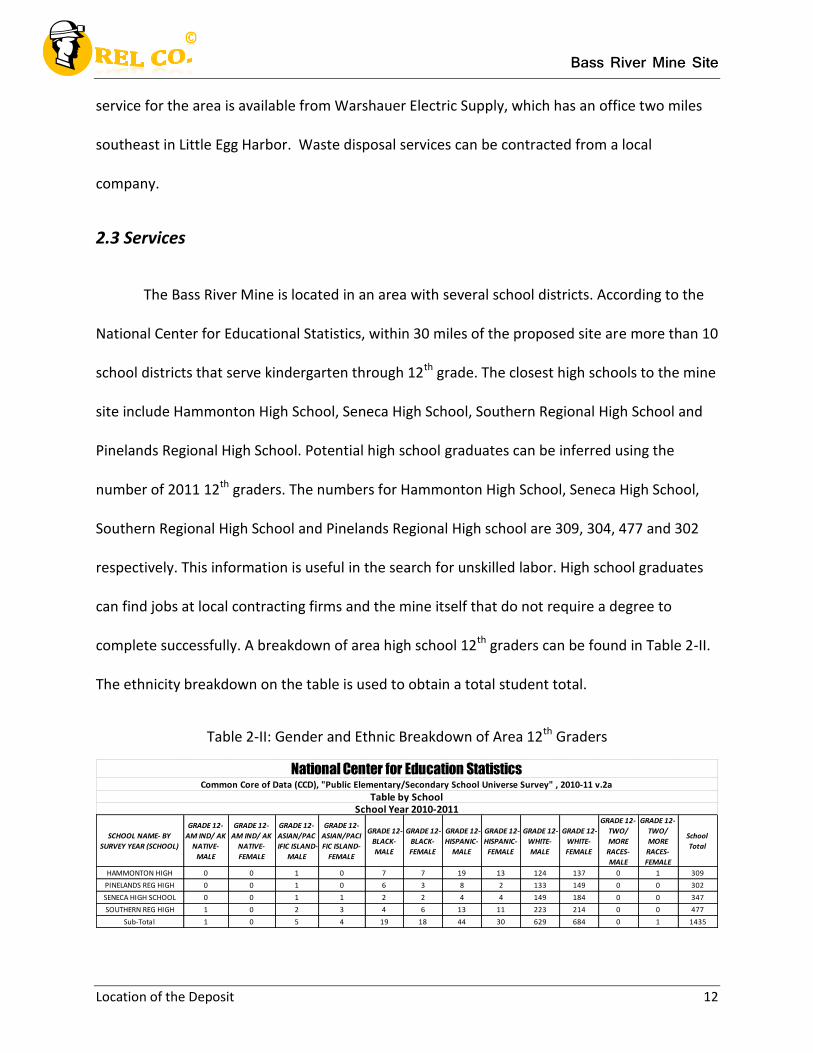
The Bass River Mine is located in an area with several school districts. According to the
National Center for Educational Statistics, within 30 miles of the proposed site are more than 10
school districts that serve kindergarten through 12th grade. The closest high schools to the mine
site include Hammonton High School, Seneca High School, Southern Regional High School and
Pinelands Regional High School. Potential high school graduates can be inferred using the
number of 2011 12th graders. The numbers for Hammonton High School, Seneca High School,
Southern Regional High School and Pinelands Regional High school are 309, 304, 477 and 302
respectively. This information is useful in the search for unskilled labor. High school graduates
can find jobs at local contracting firms and the mine itself that do not require a degree to
complete successfully. A breakdown of area high school 12th graders can be found in Table 2-II.
The ethnicity breakdown on the table is used to obtain a total student total.
Table 2-II: Gender and Ethnic Breakdown of Area 12th Graders
SCHOOL NAME- BY
SURVEY YEAR (SCHOOL)
GRADE 12-
AM IND/ AK
NATIVE-
MALE
GRADE 12-
AM IND/ AK
NATIVE-
FEMALE
GRADE 12-
ASIAN/PAC
IFIC ISLAND-
MALE
GRADE 12-
ASIAN/PACI
FIC ISLAND-
FEMALE
GRADE 12-
BLACK-
MALE
GRADE 12-
BLACK-
FEMALE
GRADE 12-
HISPANIC-
MALE
GRADE 12-
HISPANIC-
FEMALE
GRADE 12-
WHITE-
MALE
GRADE 12-
WHITE-
FEMALE
GRADE 12-
TWO/
MORE
RACES-
MALE
GRADE 12-
TWO/
MORE
RACES-
FEMALE
School
Total
HAMMONTON HIGH 0 0 1 0 7 7 19 13 124 137 0 1 309
PINELANDS REG HIGH 0 0 1 0 6 3 8 2 133 149 0 0 302
SENECA HIGH SCHOOL 0 0 1 1 2 2 4 4 149 184 0 0 347
SOUTHERN REG HIGH 1 0 2 3 4 6 13 11 223 214 0 0 477
Sub-Total 1 0 5 4 19 18 44 30 629 684 0 1 1435
National Center for Education StatisticsCommon Core of Data (CCD), "Public Elementary/Secondary School Universe Survey" , 2010-11 v.2a
Table by SchoolSchool Year 2010-2011

Bass River Mine Site
Location of the Deposit 13
Institutions for higher education in the region are mainly smaller, county or community
colleges. Located within a 50 mile radius of the mine site, Atlantic Community College,
Burlington County College, Camden County College, Ocean County College and Richard
Stockton College have campuses. Larger Institutions such as universities are harder to find with
the immediate area. Rowan University is located 60 miles away, Villanova University is 90 miles
away and Drexel is 91 miles away. Each of these institutions, along with the smaller colleges,
offers some math and engineering concentrations. The closest institutions that offer degrees in
mining and minerals engineering are Pennsylvania State University and the University of
Pittsburgh-Pittsburgh Campus. Distances from the mine site are 250 and 360 miles respectively.
Finding qualified mining engineers for the mine is essential for smooth and efficient operation.
The data shows that most graduates and experienced engineers will have to travel and relocate
to accommodate the new mine site
The Region around the Bass River Mine site is surrounded with advanced medical
centers and hospitals. Southern Ocean County Hospital is located in Little Egg Harbor Township,
just 10 miles from the mine. William Kessler Memorial Hospital in Hammonton is located only
20 miles away. The most advanced hospital in the area is Harrah’s Regional Trauma Center. This
facility is located only 28 miles away and has medevac capabilities. There are also numerous
physicians and smaller surgery centers within the area for less urgent medical care.
Heavy equipment will need to be hauled into the mine site. Unfortunately, there are no
heavy equipment retailers in the immediate area. For most heavy equipment, Trico Equipment,
located 50 miles away, would be utilized. The next closest retailer would be Rush and Parker
Bass River Mine Site
Location of the Deposit 14
Heavy Equipment located south east of Philadelphia. The delivery distance would be around 60
miles. The nearest shop that could service heavy equipment is located in Bridgeton about 70
miles away. The business does offer onsite repair along with several other businesses around
the state.
2.4 Transportation
The Bass River Mine is located in a rural area of New Jersey and Country Rd 542 will be
used to access the quarry. This road leads to the town of Hammonton, NJ which gives access to
Atlantic City Expressway. The Expressway will allow materials to be hauled toward Philadelphia
were both interstates 295 and 95 are located. These major interstates will allow for easy
transport of material to wherever it needs to go in the United States.
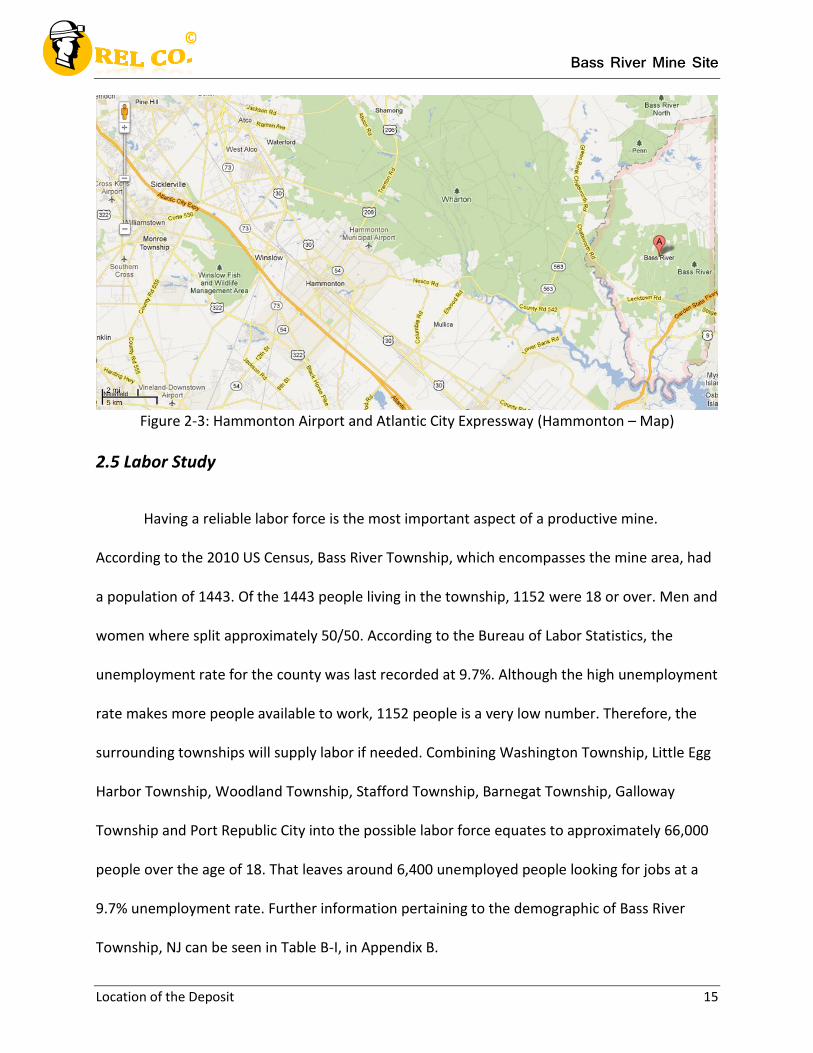
The town of Hammonton also has Hammonton Municipal Airport. Figure 2-3 shows the
location of the airport. This airport can provide easy access to many international airports.
Some of these include Douglas International Airport and Dulles International Airport in
Washington D.C. Having the ability to fly workers in from around the country and world will
help fill needed positions at the mine.
Bass River Mine Site
Location of the Deposit 15
Figure 2-3: Hammonton Airport and Atlantic City Expressway (Hammonton – Map)
2.5 Labor Study
Having a reliable labor force is the most important aspect of a productive mine.
According to the 2010 US Census, Bass River Township, which encompasses the mine area, had
a population of 1443. Of the 1443 people living in the township, 1152 were 18 or over. Men and
women where split approximately 50/50. According to the Bureau of Labor Statistics, the
unemployment rate for the county was last recorded at 9.7%. Although the high unemployment
rate makes more people available to work, 1152 people is a very low number. Therefore, the
surrounding townships will supply labor if needed. Combining Washington Township, Little Egg
Harbor Township, Woodland Township, Stafford Township, Barnegat Township, Galloway
Township and Port Republic City into the possible labor force equates to approximately 66,000
people over the age of 18. That leaves around 6,400 unemployed people looking for jobs at a
9.7% unemployment rate. Further information pertaining to the demographic of Bass River
Township, NJ can be seen in Table B-I, in Appendix B.
Bass River Mine Site
Location of the Deposit 16
As previously explained, there are a lack of institutions around Bass River Township that
offer a degree in mining and minerals engineering. Such is the case that most of the workforce
requiring this degree will be from outside the regional area. People from accredited universities
and colleges with a mining and minerals engineering program must be brought into the area.
There is also a lack of major mining activity in the area. This means that experienced miners and
mining engineers have to relocate in order for them to work at Bass River mine.
2.6 Political
The Bass River Mine is located in such a way as to prevent disturbances with local home
owners and the wildlife in the area. There would be no serious issues inside the surrounding
communities with starting a magnesium iron mine. When mining is completed in the area, a
complete reclamation will be performed as per state and federal laws. This will return the
mined area to its original state before mining.
Bass River Mine Site
Deposit Geology 17
REL Company
Chapter 3
Bass River Mine Project: Deposit Geology
Bass River Mine Site
Deposit Geology 18
3.1 General Geology
New Jersey varies from wooded mountains to coastal cities with a variety of minerals
mined throughout the state. Minerals mined in New Jersey consist of iron, magnetite,
limestone, zinc, marble, granite, gravel, clay and greensand. The most well-known minerals
produced in New Jersey are crushed stone and greensand (Findthedata). The southern part of
New Jersey has sand, clay and some shale for mineral resources. Shale, siltstone and sandstone
make up most minerals in the middle of New Jersey. Northeastern New Jersey consists of
basalt, shale, sandstone and diabase. The Northwestern part of New Jersey contains gneiss,
granite, marble, shale, limestone and iron.
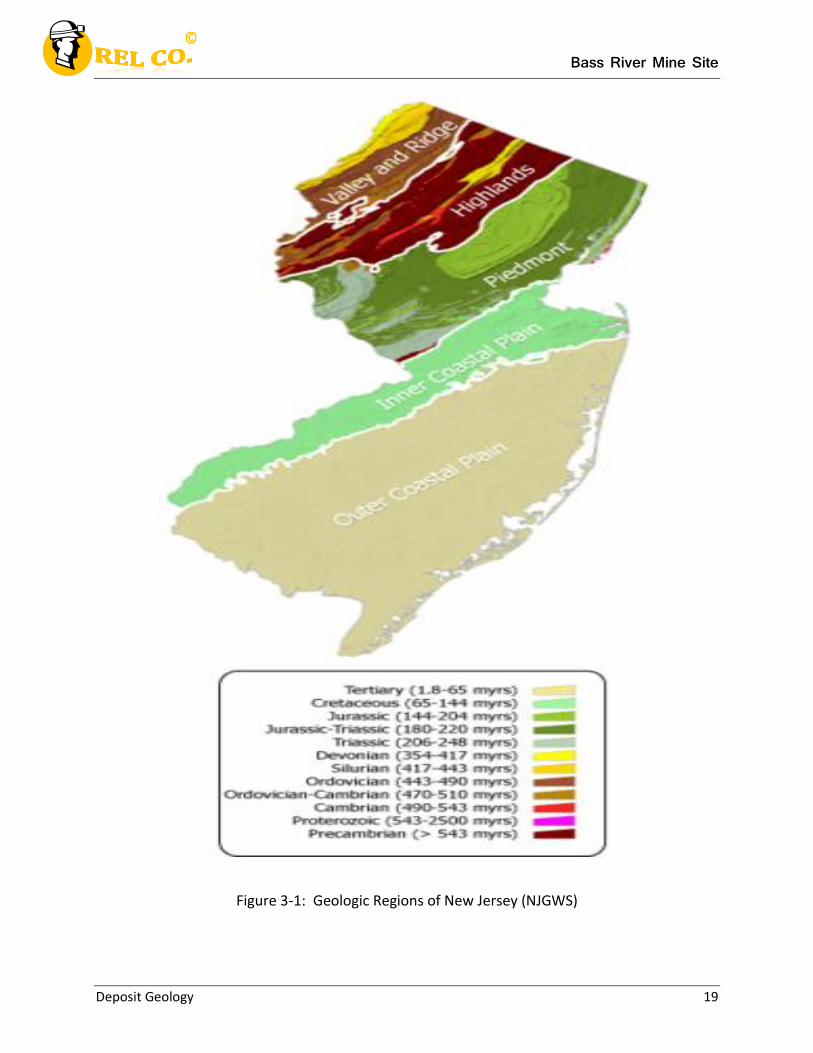
New Jersey can be broken into five different geographic regions, which includes valley
and ridge, highlands, piedmont, inner coastal plain and outer coastal plain. The location of the
five different regions is shown in Figure 3-1. A more detailed geologic map of New Jersey can be
found in the Appendix as Figure C-1. Bass River is located in the outer coastal plain region in
Burlington, New Jersey, which is covered a great deal by the “Pine Barrens.” The Pine Barrens
have bog iron ore seams located throughout. These seams formed near water ways and wet
meadows. The seams of bog iron are located in the alluvium deposits which are shown in Figure
C-2 of the Appendix (NJGWS).
Bass River Mine Site
Deposit Geology 19
Figure 3-1: Geologic Regions of New Jersey (NJGWS)
Bass River Mine Site
Deposit Geology 20
3.2 Geologic Maps
A topographic 7.5 minute quadrangle map is located in the appendix as Figure C-3. This
shows the topography for the Oswego Lake Quadrangle. A topography map for Burlington
County, New Jersey, is shown in the appendix as Figure C-4. The quadrangle map and the
topography map show the elevation contour around Bass River. Bass River is close to water
bodies such as sea level plains, rivers and lakes, which make the area ideal for bog iron seams.
3.3 Stratigraphic Data
The Bass River Mine site is located relatively close to the shoreline of New Jersey. A
large area of southeast New Jersey is part of the Cohansey Formation, including the mine site.
The Cohansey Formation is made up primarily of various sands. Grain sizes are from fine to
course. There are areas of dark and light clay beds throughout the formation. Dark clay beds
come from the lignified wood that once sparsely populated the area. There are also parts of
the formation that contain potassium feldspar, mainly in less weathered areas. The original
thickness is not known because of the erosive properties in the area. The deepest areas of the
formation are near Atlantic City. Depths have been recorded as deep as 351 feet (USGS). From
this point, the base of the formation rises rapidly to the south and north. The Cohansey
Formation has a geological age from the Middle Miocene.
Underneath the Cohansey Formation lies the Upper and Lower Kirkwood Formations. In
the Upper Kirkwood Formation, like the Cohansy, sand is the major constituent. Quartz and
siliceous rock fragments make up a large part of the sand minerals. Feldspar makes up a small

Bass River Mine Site
Deposit Geology 21
percentage of the sand minerals. The Lower Kirkwood Formation contains a large amount of
clay and silt. There is also sand present in this layer. The two formations are combined with
respect to the depth and this allows the total thickness to be approximately 300 feet. The
geological age for both formations is between 5 and 25 million years (USGS).
3.4 Deposit Data
Bass River, NJ, is in a unique position when it comes to the Cohansey Formation.
Groundwaters in most of New Jersey contain large amounts of iron. The water flows through
the sandy Cohansey Formation and the dissolved iron makes its way to the surface. Upon
reaching the surface water locations, such as swamps, springs or bogs, iron-hungry bacteria
precipitate a chemical reaction (MCVSD). From this chemical process, ore bodies that are
formed are shallow films. In case of the Bass River Mine, deposits formed over time creating an
ore body from depths as shallow as 20 feet.
The primary rock type in the Bass River area is alluvium. According to the NJGWS,
alluvium is “a general term for clay, silt, sand, gravel or similar unconsolidated detrital material,
deposited during comparatively recent geologic time by a stream or other body of running
water, assorted or semi-sorted sediment.” Within this deposit, iron can cement the particulate
together creating ironstone.
Due to the nature of a sedimentary coast line, there are no syncline or anticline folds in
the region. Most sedimentary rock is gently deposited through water flow. The strike and dip
of the Cohansey Formation, Upper Kirkwood Formation and Lower Kirkwood Formation are not
present.
Bass River Mine Site
Deposit Geology 22
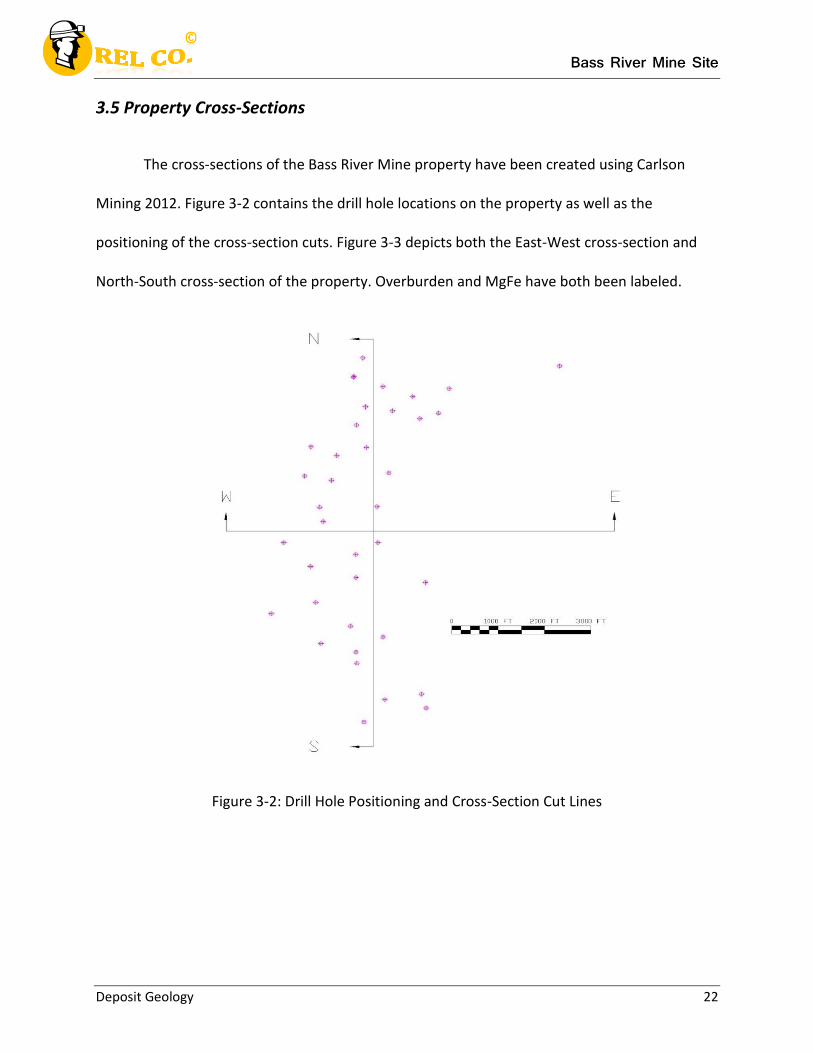
3.5 Property Cross-Sections
The cross-sections of the Bass River Mine property have been created using Carlson
Mining 2012. Figure 3-2 contains the drill hole locations on the property as well as the
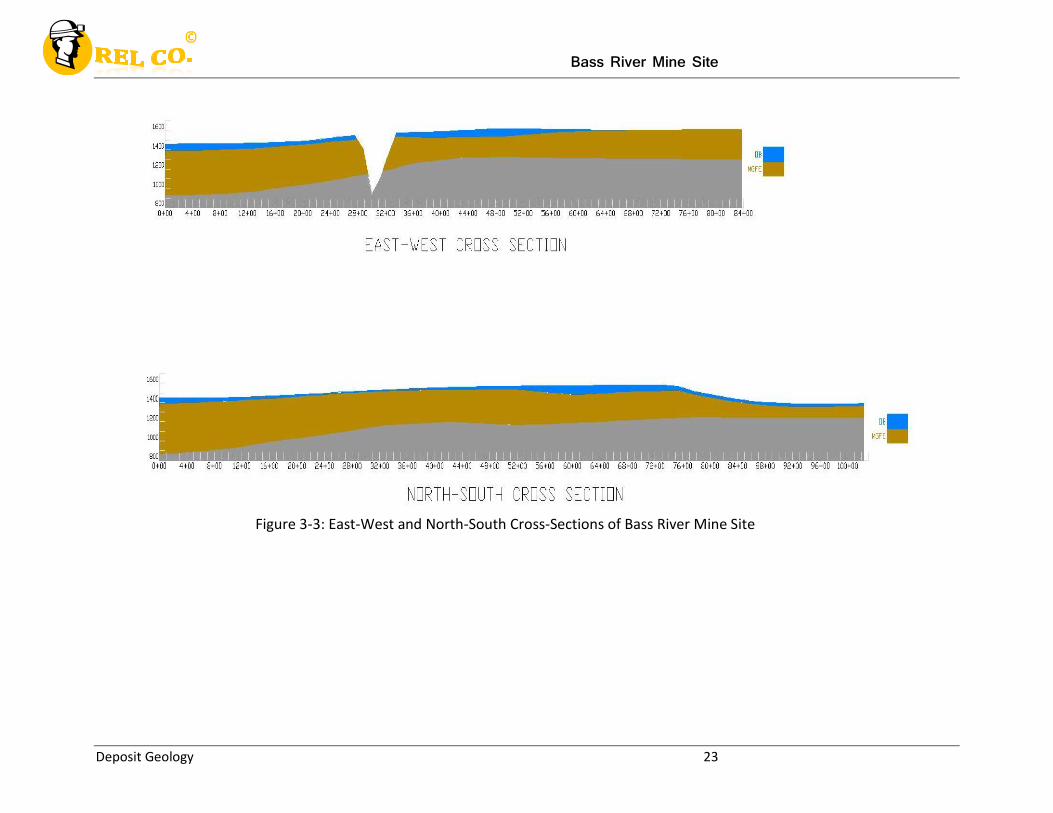
positioning of the cross-section cuts. Figure 3-3 depicts both the East-West cross-section and
North-South cross-section of the property. Overburden and MgFe have both been labeled.
Figure 3-2: Drill Hole Positioning and Cross-Section Cut Lines
Bass River Mine Site
Deposit Geology 23
Figure 3-3: East-West and North-South Cross-Sections of Bass River Mine Site
Bass River Mine Site
Deposit Geology 24
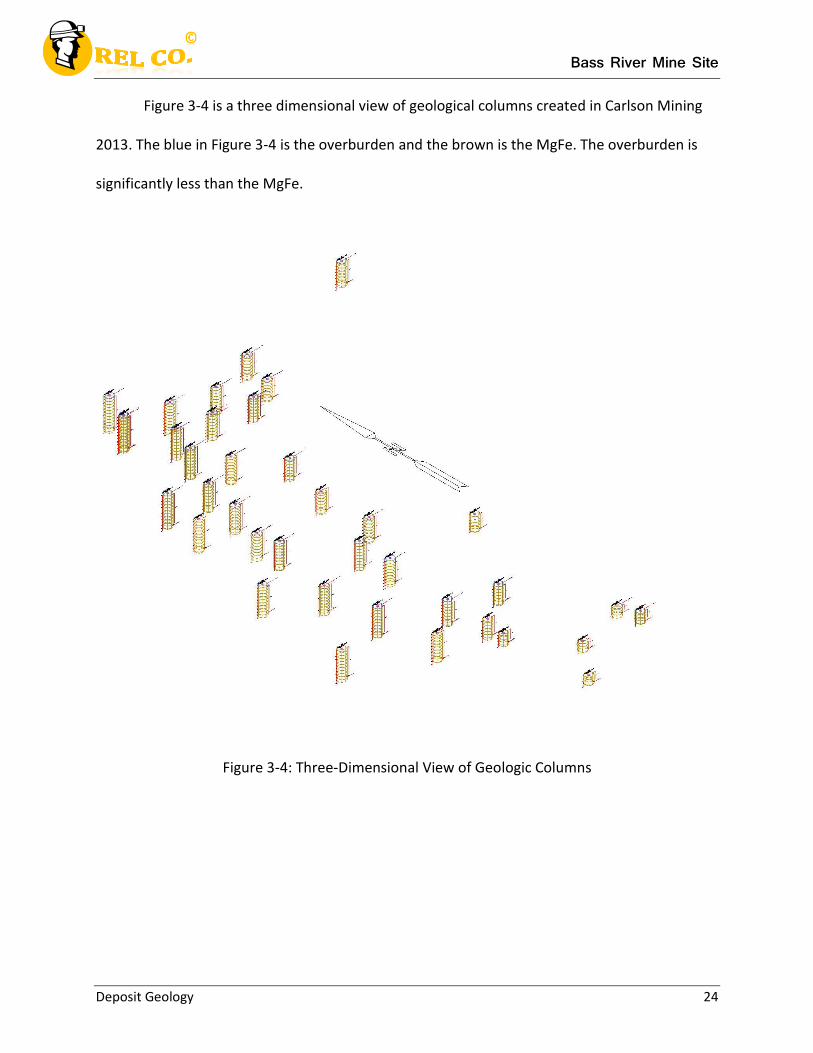
Figure 3-4 is a three dimensional view of geological columns created in Carlson Mining
2013. The blue in Figure 3-4 is the overburden and the brown is the MgFe. The overburden is
significantly less than the MgFe.
Figure 3-4: Three-Dimensional View of Geologic Columns
Bass River Mine Site
Deposit Exploration 25
REL Company
Chapter 4
Bass River Mine Project: Deposit Exploration
Bass River Mine Site
Deposit Exploration 26
4.1 Explorations Program
Bass River Mine is located in an area that is not normally known for magnesium and iron
mining. REL Co. has conducted detailed exploration techniques to determine if the area would
be able to produce profit. This particular site in the Bass River area was selected because it had
rich concentrations of both magnesium and iron. Different exploration techniques were used to
obtain data, including core hole drilling, rotary drilling and geophysics.
Geophysics was used to map the basic structure of the mine site. A combination of
resistivity and sonic velocity tests were used to identify the thickness and quality of the ore
seams. No major faults were recorded in the area during the duration of the tests. Geophysical
tests were used not only during the beginning of the exploration phase, but also while drilling
was being conducted.
Seam thickness, the exact location of the seam and the quality of the seam at the Bass
River area were calculated using core hole drilling. The initial plan for the mine was to drill a
grid with 1,000-foot spacing. However, because of the general topography of the area, it was
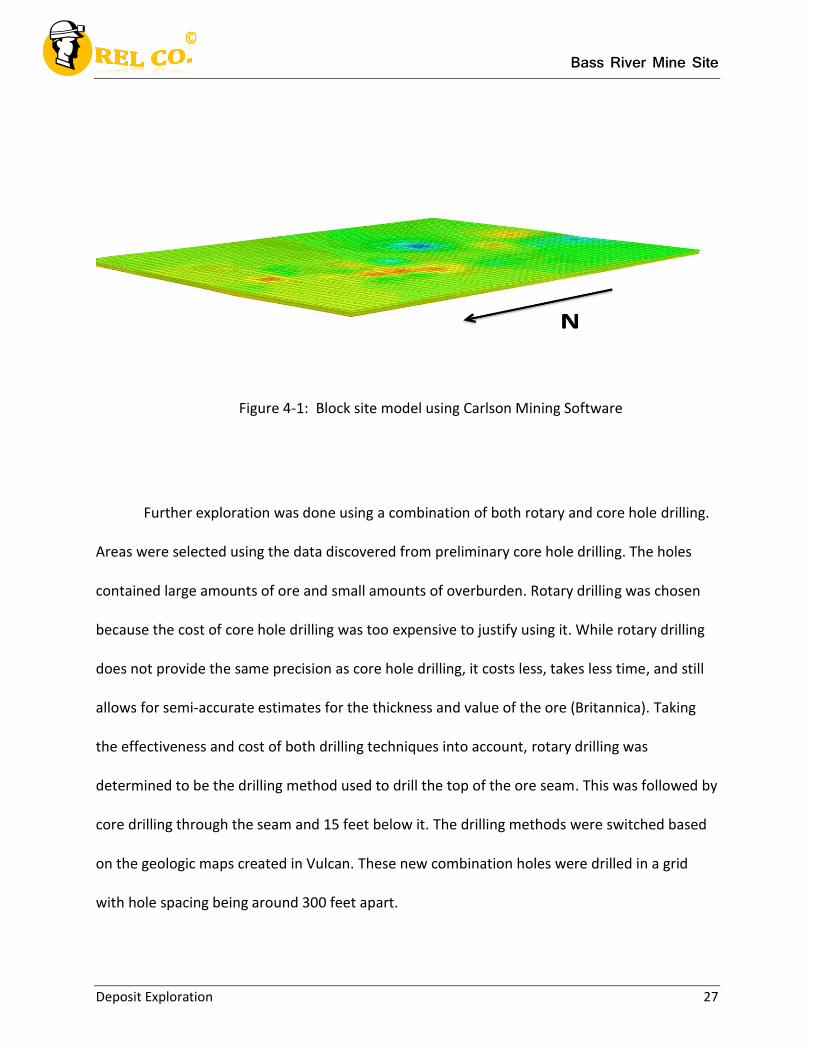
not possible to drill the grid exactly as planned. A general geologic model was created using
core hole data in Carlson as show in Figure 4-1. This model explains the geology and the mineral
composition of the area.
Bass River Mine Site
Deposit Exploration 27
Figure 4-1: Block site model using Carlson Mining Software
Further exploration was done using a combination of both rotary and core hole drilling.
Areas were selected using the data discovered from preliminary core hole drilling. The holes
contained large amounts of ore and small amounts of overburden. Rotary drilling was chosen
because the cost of core hole drilling was too expensive to justify using it. While rotary drilling
does not provide the same precision as core hole drilling, it costs less, takes less time, and still
allows for semi-accurate estimates for the thickness and value of the ore (Britannica). Taking
the effectiveness and cost of both drilling techniques into account, rotary drilling was
determined to be the drilling method used to drill the top of the ore seam. This was followed by
core drilling through the seam and 15 feet below it. The drilling methods were switched based
on the geologic maps created in Vulcan. These new combination holes were drilled in a grid
with hole spacing being around 300 feet apart.
Bass River Mine Site
Deposit Exploration 28
The cost of the provided drilling program was $378,400 dollars for 38 bore holes and a
total distance of 15,200 feet. The combined cost of drilling for both the rotary method and core
hole method was approximately $25 per foot drilled. This cost does not account for outside
factors at the mine such as ground conditions, extra costs or driller error. This cost also ignores
exploration costs to cover the geologic mapping of the area. While this process costs a large
amount of capital, it supports information that is crucial to the effectiveness of the mine.
4.2 Tabulated Drill Hole Data
REL Co. compiled and analyzed data from 38 drill holes located throughout the property.
Appendix D contains the data for the 38 site drill holes. Table D-I contains the northing, easting
and elevation for each hole. Table D-II contains the assay information for each drill hole at
varying levels. Based on a relatively soft deposit, average cost per foot is $25. As previously
stated, this cost is solely the expense for drilling the exploratory holes. Drilling costs for each
hole is given in Table D-III.
4.3 Deposit and Seam Properties
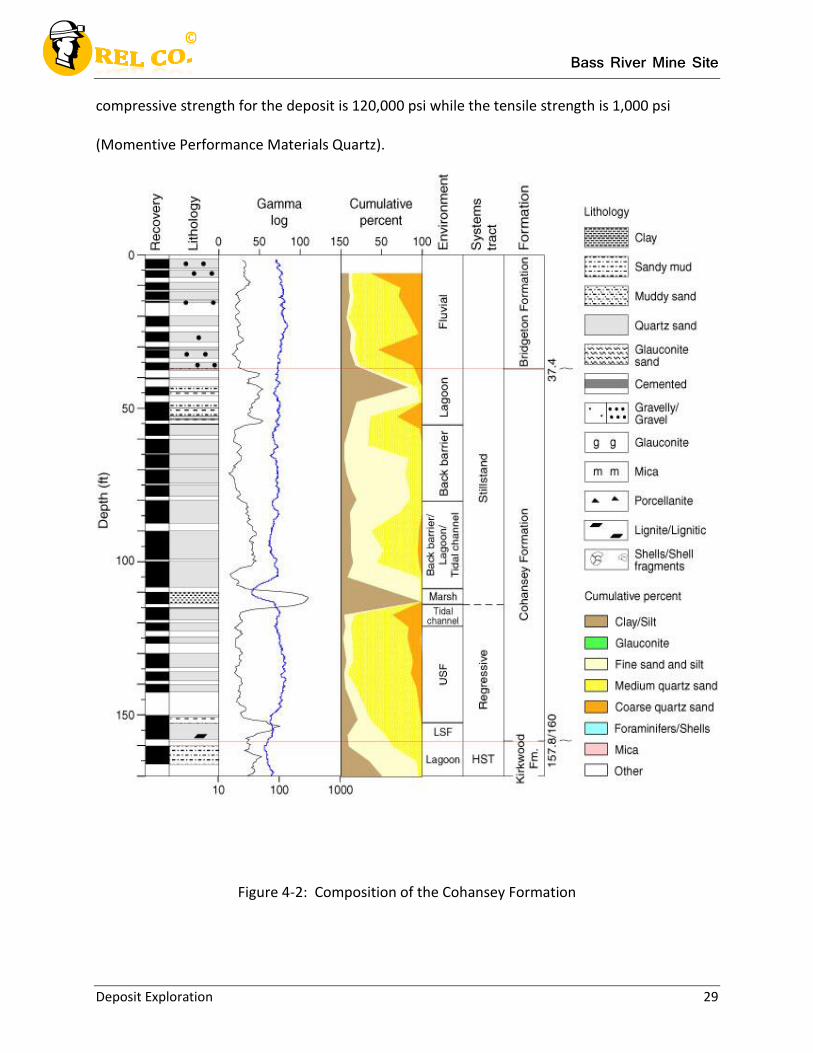
The deposit being mined by REL CO. is an alluvium deposit. The alluvium deposit starts
as a high quantity sand but after 100 feet, becomes medium quartz and clay. The relative
composition of the deposit can be seen in Figure 4-2 (Ocean Drilling Program). The average
bank density of the alluvium deposit is 200 pounds per cubic foot. The alluvium deposit has an
average loose density of 140 pounds per cubic foot, an angle of repose of 36 degrees and a
swell factor of 0.3 for a gravel mix with clay. The shear strength of the deposit is 8,000 psi. The
Bass River Mine Site
Deposit Exploration 29
compressive strength for the deposit is 120,000 psi while the tensile strength is 1,000 psi
(Momentive Performance Materials Quartz).
Figure 4-2: Composition of the Cohansey Formation
Bass River Mine Site
Deposit Exploration 30
This deposit has an average range from 20 to 450 feet deep. The depth from the surface
to the deposit varies from 50 feet at the left of the mine property to five feet at the right side of
the mine property. The assay of magnesium iron for the deposit ranges from 10% at the top of
the deposit to 30% at the deepest parts of the deposit. The chemical properties of the deposit
are most similar to those of quartz and iron, as those are the two main minerals in the deposit.
Quartz is a very stable element so there will be little chemical reaction from it. Due to the wet
nature of the deposit the iron when exposed to air can combine with oxygen to form iron oxide.
4.4 Related Strata Properties
Above the alluvium deposit is a salt march and estuarine deposit which is composed of
clay and sand. This deposit is the overburden above the alluvium deposit. This overburden
varies from 5 feet deep at the right side of the property to 50 feet deep at the left side of the
property. The wet clay and sand mix has an average density of 110 pounds per cubic foot. The
shear strength for the salt march and estuarine deposit is 6,000 psi (Simetric). The sand and clay
will have little chemical reaction during the mining process.
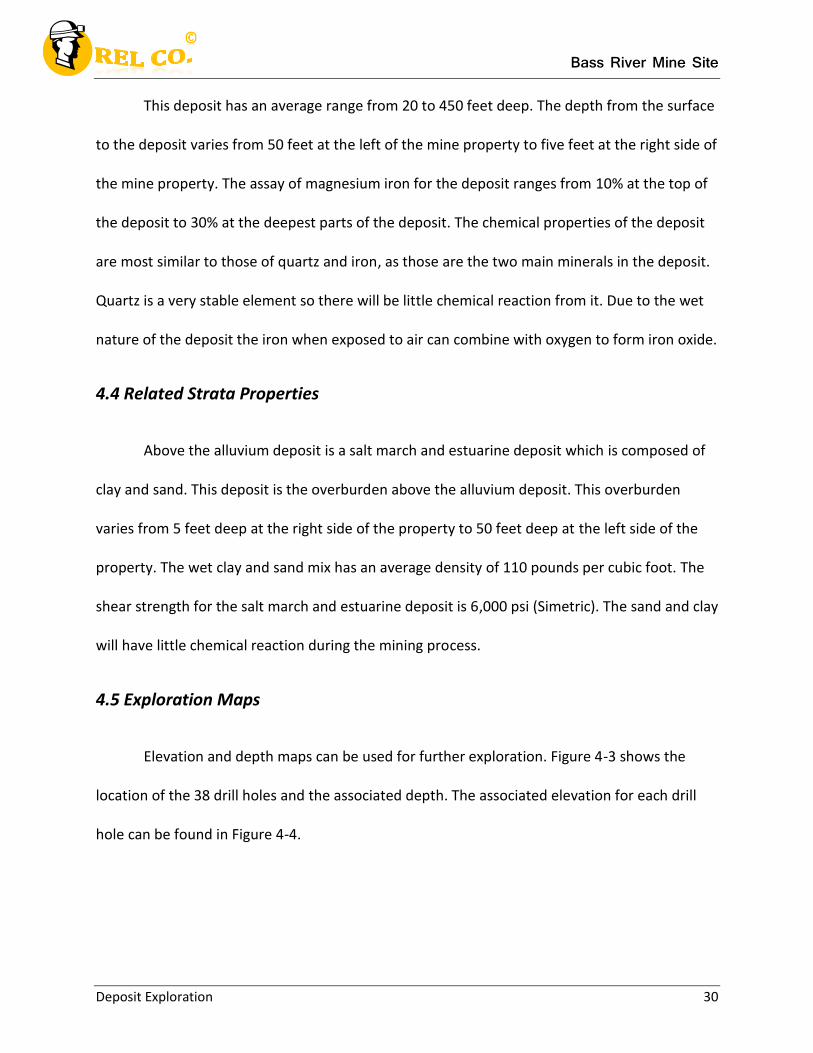
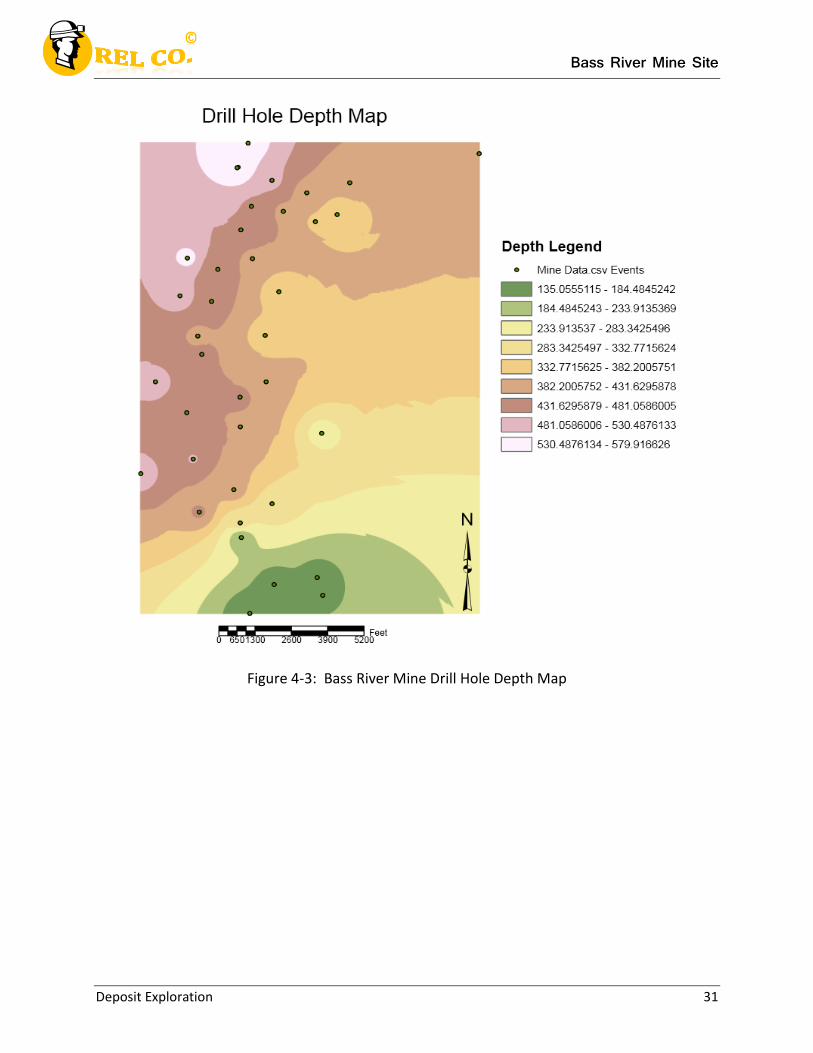
4.5 Exploration Maps
Elevation and depth maps can be used for further exploration. Figure 4-3 shows the
location of the 38 drill holes and the associated depth. The associated elevation for each drill
hole can be found in Figure 4-4.
Bass River Mine Site
Deposit Exploration 31
Figure 4-3: Bass River Mine Drill Hole Depth Map
Bass River Mine Site
Deposit Exploration 32
Figure 4-4: Bass River Mine Drill Hole Elevation Map

Bass River Mine Site
Reserve Estimation 33
REL Company
Chapter 5
Bass River Mine Project: Reserve Estimation
Bass River Mine Site
Reserve Estimation 34
5.1 Overview
Reserve estimation is one of the key tasks in mine design. Reserve estimation is the
process by which economically recoverable ore can be evaluated quantitatively. There are a
variety of reserve estimation techniques that may be employed to find estimates for Bass River
Mine. The methods for reserve estimation include polygonal estimation, contour estimation,
triangular estimation and inverse distance estimation. An estimation of the reserve ore tonnage
at Bass River Mine was done using the triangulation method. The triangulation method
provides a preliminary reserve estimation while more accurate detail estimations can be
provided using a computer program, such as Carlson Mining. The reason computer programs
are more accurate is because the distribution variables, such as grade and ore body thicknesses
can be skewed and difficult to use. The purpose of a preliminary reserve estimation is to
provide a range of values the detailed estimations should resemble. Thirty-eight boreholes
were used to calculate reserve estimation.
5.2 Preliminary Estimation
To obtain a preliminary value for the magnesium iron reserves in tons, the triangulation
method was used. The triangulation method takes the average weight of the assay of three
different boreholes and the volume that is created between them to obtain the tonnage of a
triangular prism. The steps below describe the triangulation method used to find the
preliminary estimation.
Bass River Mine Site
Reserve Estimation 35
1. The location of all of the boreholes was plotted on a Northing and Easting coordinate
system. When this was completed lines were drawn between adjacent boreholes to
form triangles.
2. The surface area of each triangle was then calculated using the distances between the
boreholes.
3. The depth of each triangle was calculated using a weighted average of borehole depths
and the distance from boreholes to the center of the triangles.
4. The overall average grade of each triangle was found using a weight average of the
boreholes grades and the distance from the center of the triangle. When this calculation
was completed the value was used as the uniform grade for the prism.
5. With the average depth and areas calculated, the volume of each prism can be found.
6. The vertical volume must be multiplied by the density of the rock to give the total rock
weight.
7. The total rock weight must be multiplied by the average grade gave the reserve
estimation.
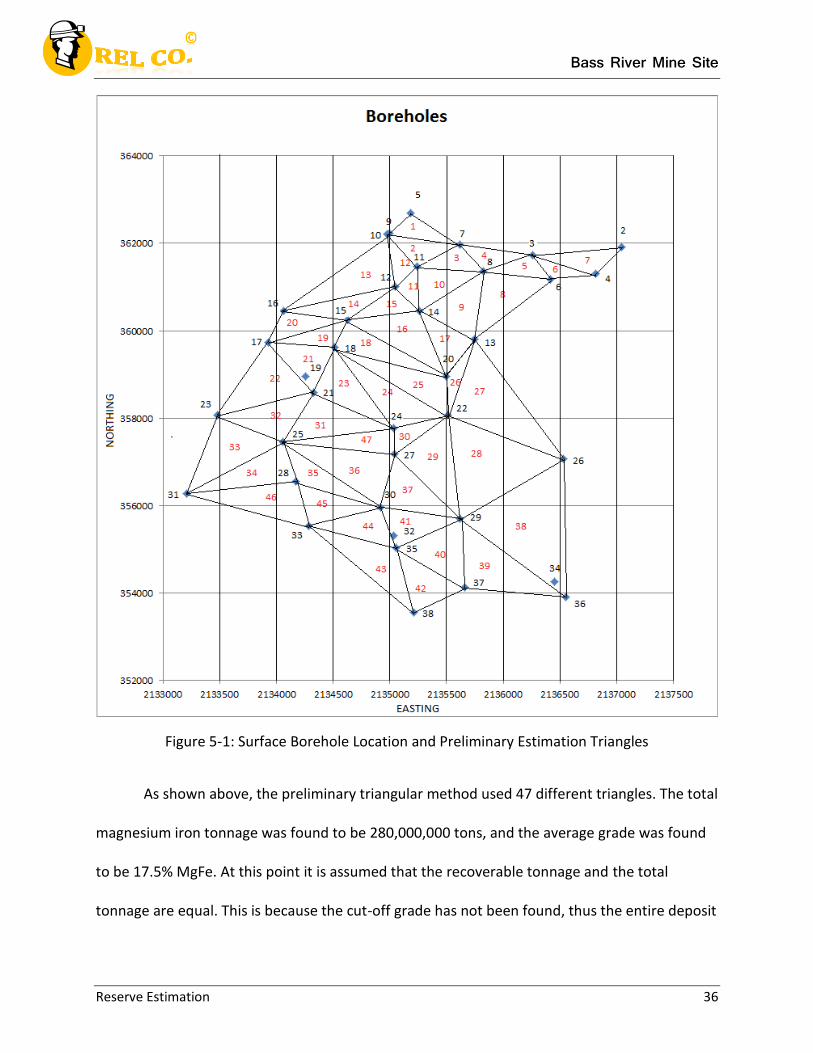
The Northing and Easting coordinate system for the Bass River Mine with the
estimations from the triangular method are shown in Figure 5-1.
Bass River Mine Site
Reserve Estimation 36
Figure 5-1: Surface Borehole Location and Preliminary Estimation Triangles
As shown above, the preliminary triangular method used 47 different triangles. The total
magnesium iron tonnage was found to be 280,000,000 tons, and the average grade was found
to be 17.5% MgFe. At this point it is assumed that the recoverable tonnage and the total
tonnage are equal. This is because the cut-off grade has not been found, thus the entire deposit
Bass River Mine Site
Reserve Estimation 37
is viewed as profitable. The area, average depth, overall ore grade and MgFe tonnage for each
triangle is shown in Table E-I of the Appendix.
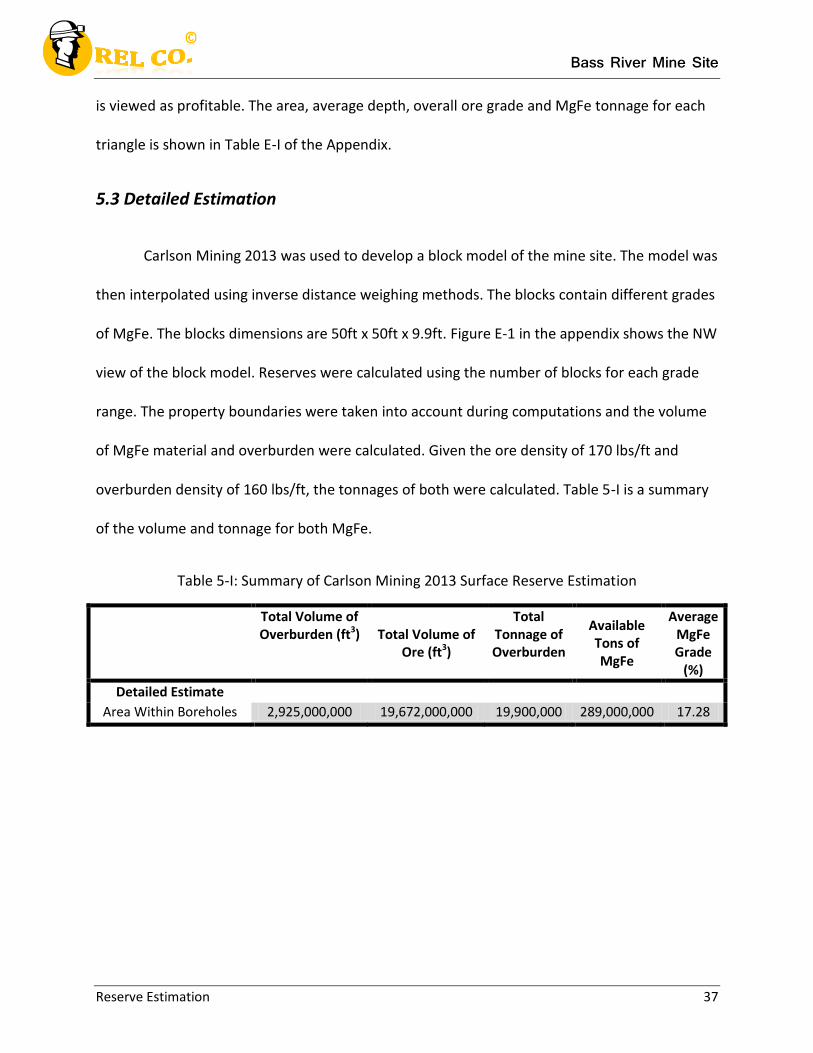
5.3 Detailed Estimation
Carlson Mining 2013 was used to develop a block model of the mine site. The model was
then interpolated using inverse distance weighing methods. The blocks contain different grades
of MgFe. The blocks dimensions are 50ft x 50ft x 9.9ft. Figure E-1 in the appendix shows the NW
view of the block model. Reserves were calculated using the number of blocks for each grade
range. The property boundaries were taken into account during computations and the volume
of MgFe material and overburden were calculated. Given the ore density of 170 lbs/ft and
overburden density of 160 lbs/ft, the tonnages of both were calculated. Table 5-I is a summary
of the volume and tonnage for both MgFe.
Table 5-I: Summary of Carlson Mining 2013 Surface Reserve Estimation
Total Volume of Overburden (ft3) Total Volume of
Ore (ft3)
Total Tonnage of Overburden
Available Tons of MgFe
Average MgFe Grade
(%)
Detailed Estimate
Area Within Boreholes 2,925,000,000 19,672,000,000 19,900,000 289,000,000 17.28
Bass River Mine Site
Reserve Estimation 38
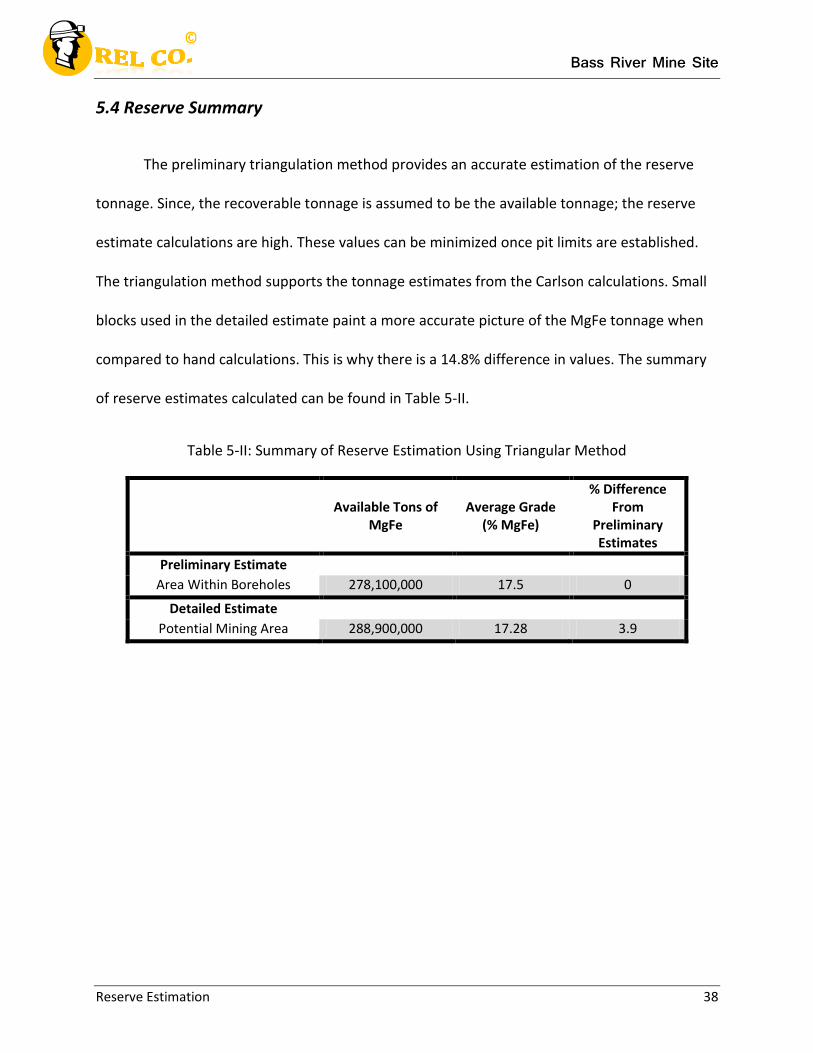
5.4 Reserve Summary
The preliminary triangulation method provides an accurate estimation of the reserve
tonnage. Since, the recoverable tonnage is assumed to be the available tonnage; the reserve
estimate calculations are high. These values can be minimized once pit limits are established.
The triangulation method supports the tonnage estimates from the Carlson calculations. Small
blocks used in the detailed estimate paint a more accurate picture of the MgFe tonnage when
compared to hand calculations. This is why there is a 14.8% difference in values. The summary
of reserve estimates calculated can be found in Table 5-II.
Table 5-II: Summary of Reserve Estimation Using Triangular Method
Available Tons of
MgFe Average Grade
(% MgFe)
% Difference From
Preliminary Estimates
Preliminary Estimate
Area Within Boreholes 278,100,000 17.5 0
Detailed Estimate
Potential Mining Area 288,900,000 17.28 3.9

Bass River Mine Site
Mining Equipment 39
REL Company
Chapter 6
Bass River Mine Project: Mining Equipment
Bass River Mine Site
Mining Equipment 40
6.1 Drilling and Blasting
Drilling and blasting will be contracted to a local company while excavation and haulage
will be done by REL Co. Blasting and drilling will be contracted to the same company. REL Co.
will require the contractor to blast 200,000 tons per week. Each bench will have a height of 50
feet with nine benches to maximum depth. The blasting for each bench will require between
90 and 100 holes to be drilled at. The cost per foot drilled is between eight and 12 dollars. Cost
per week for drilling will be on average $78,500.
6.2 Excavation Equipment
Excavation will be carried out by one large and one medium shovel. Shovels will be
purchased from CAT as they are the only company that sells larger equipment nearby. The
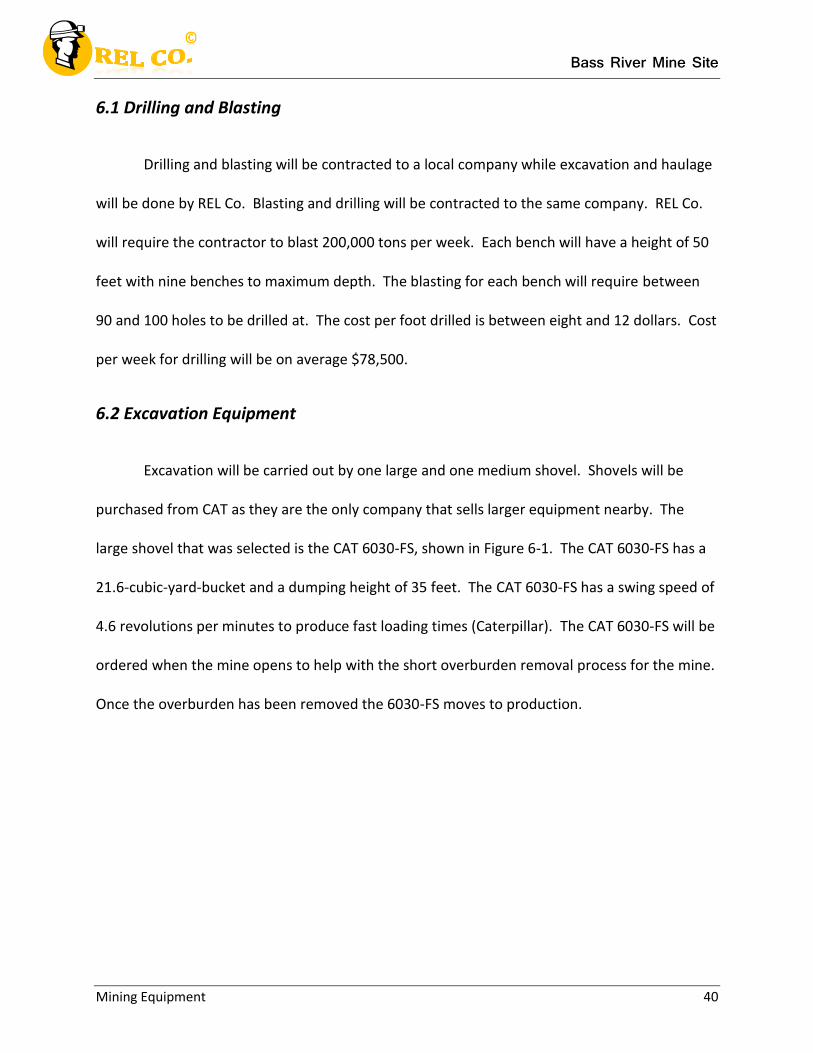
large shovel that was selected is the CAT 6030-FS, shown in Figure 6-1. The CAT 6030-FS has a
21.6-cubic-yard-bucket and a dumping height of 35 feet. The CAT 6030-FS has a swing speed of
4.6 revolutions per minutes to produce fast loading times (Caterpillar). The CAT 6030-FS will be
ordered when the mine opens to help with the short overburden removal process for the mine.
Once the overburden has been removed the 6030-FS moves to production.
Bass River Mine Site
Mining Equipment 41
Figure 6-1: The CAT 6030-FS shovel (Caterpillar).
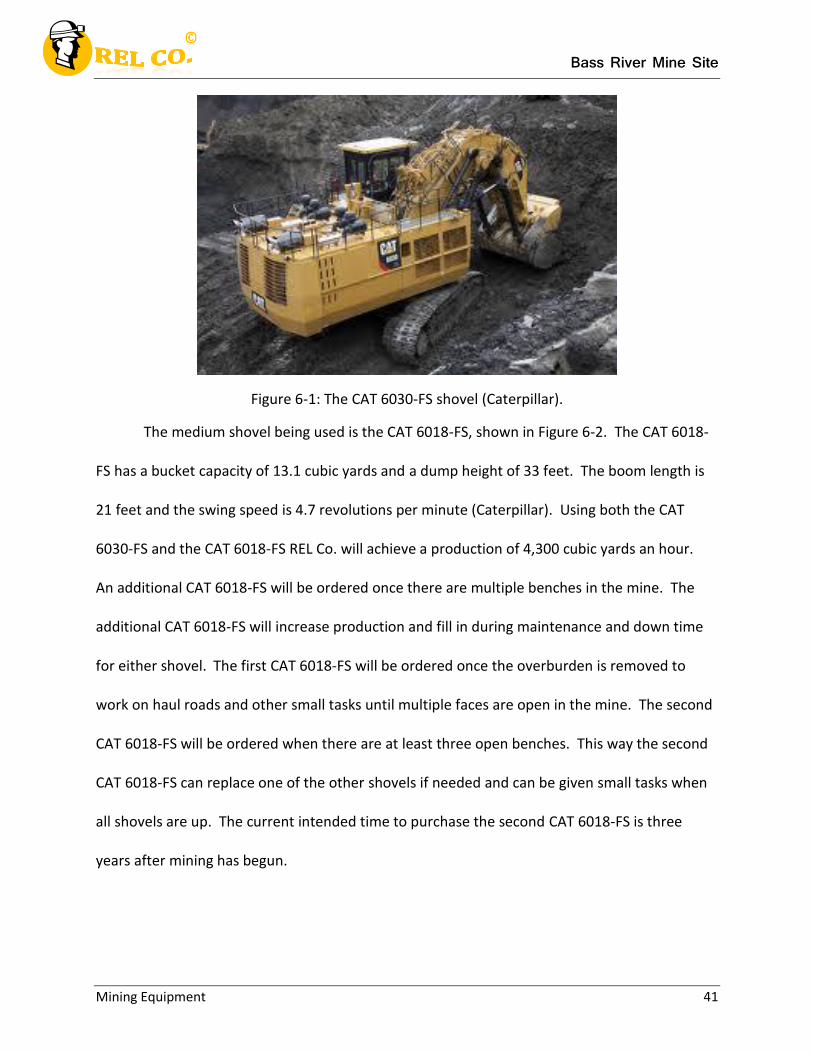
The medium shovel being used is the CAT 6018-FS, shown in Figure 6-2. The CAT 6018-
FS has a bucket capacity of 13.1 cubic yards and a dump height of 33 feet. The boom length is
21 feet and the swing speed is 4.7 revolutions per minute (Caterpillar). Using both the CAT
6030-FS and the CAT 6018-FS REL Co. will achieve a production of 4,300 cubic yards an hour.
An additional CAT 6018-FS will be ordered once there are multiple benches in the mine. The
additional CAT 6018-FS will increase production and fill in during maintenance and down time
for either shovel. The first CAT 6018-FS will be ordered once the overburden is removed to
work on haul roads and other small tasks until multiple faces are open in the mine. The second
CAT 6018-FS will be ordered when there are at least three open benches. This way the second
CAT 6018-FS can replace one of the other shovels if needed and can be given small tasks when
all shovels are up. The current intended time to purchase the second CAT 6018-FS is three
years after mining has begun.
Bass River Mine Site
Mining Equipment 42
Figure 6-2: CAT 6018-FS shovel (Caterpillar).
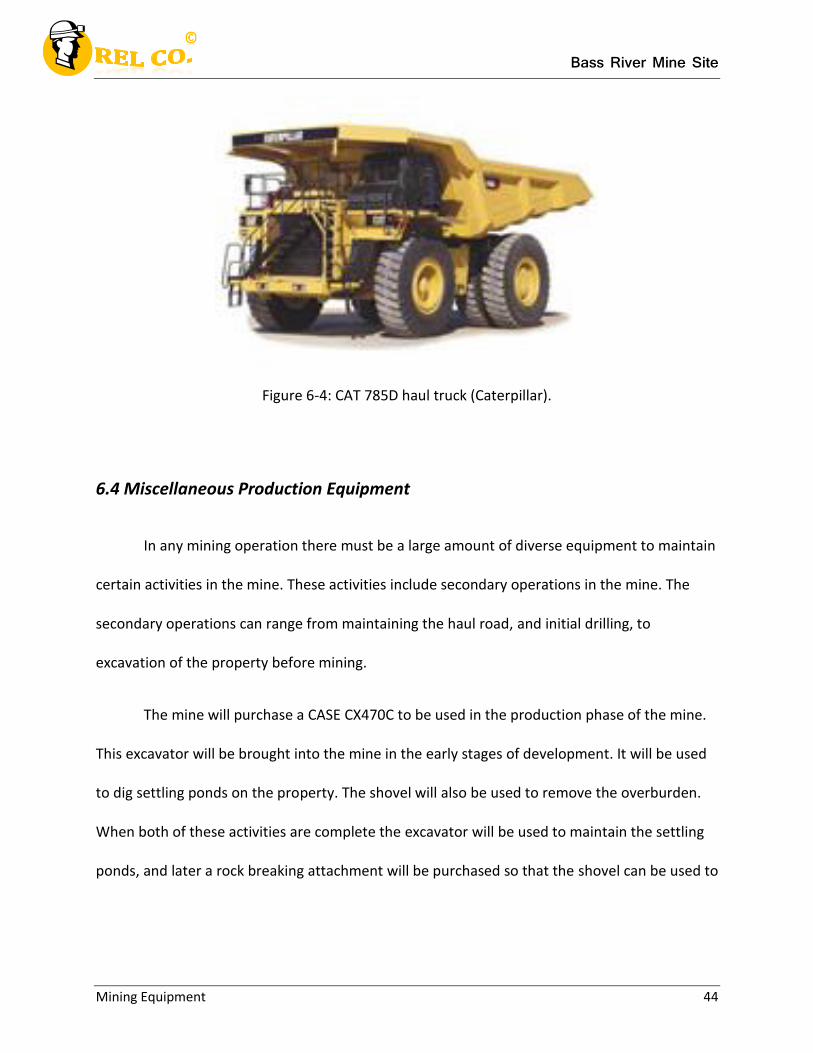
6.3 Primary Haulage Equipment
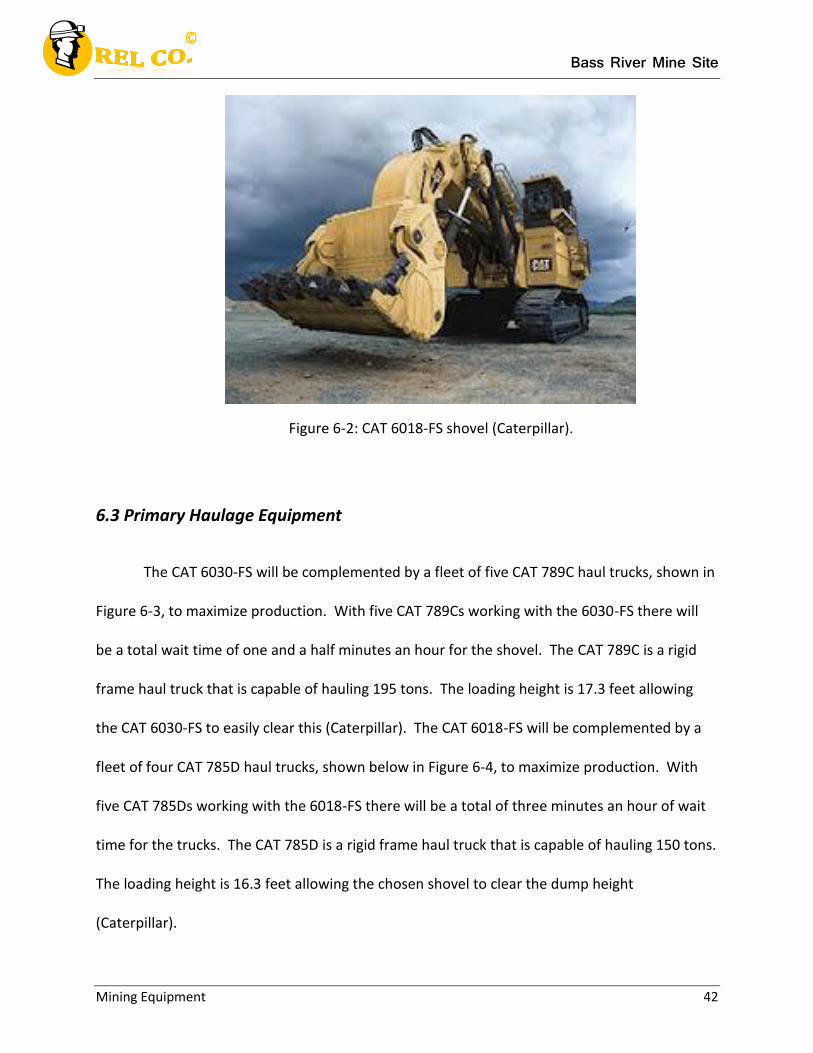
The CAT 6030-FS will be complemented by a fleet of five CAT 789C haul trucks, shown in
Figure 6-3, to maximize production. With five CAT 789Cs working with the 6030-FS there will
be a total wait time of one and a half minutes an hour for the shovel. The CAT 789C is a rigid
frame haul truck that is capable of hauling 195 tons. The loading height is 17.3 feet allowing
the CAT 6030-FS to easily clear this (Caterpillar). The CAT 6018-FS will be complemented by a
fleet of four CAT 785D haul trucks, shown below in Figure 6-4, to maximize production. With
five CAT 785Ds working with the 6018-FS there will be a total of three minutes an hour of wait
time for the trucks. The CAT 785D is a rigid frame haul truck that is capable of hauling 150 tons.
The loading height is 16.3 feet allowing the chosen shovel to clear the dump height
(Caterpillar).
Bass River Mine Site
Mining Equipment 43
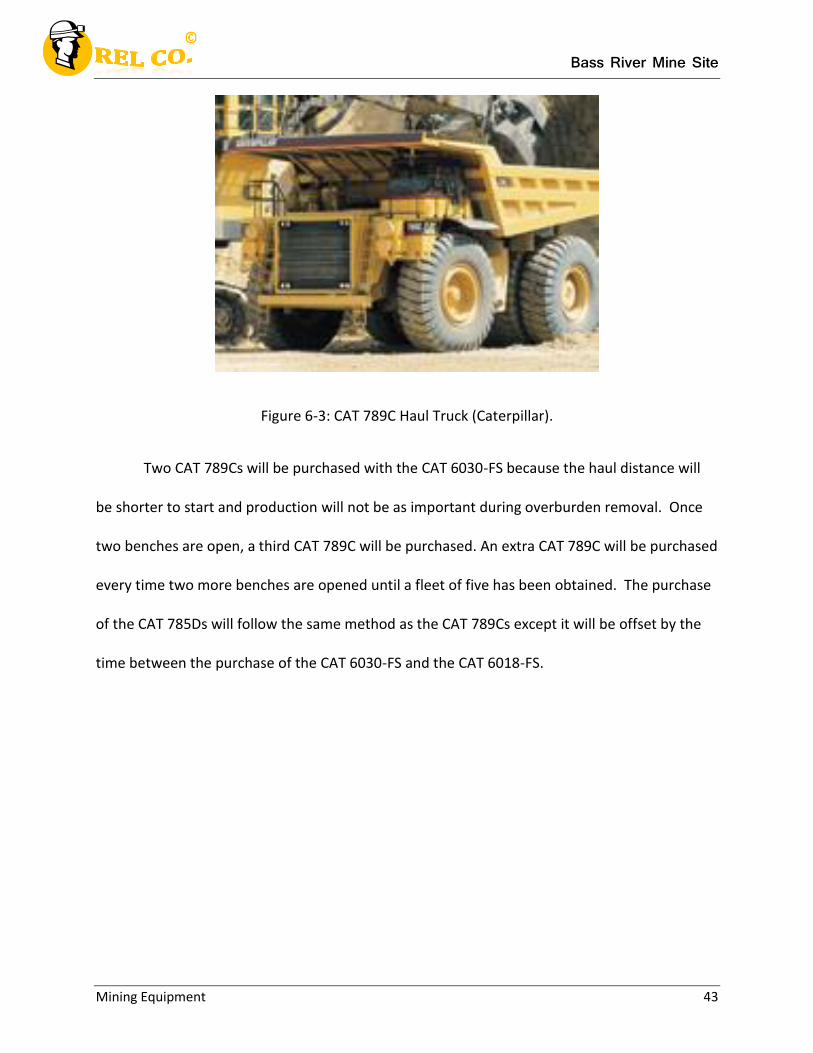
Figure 6-3: CAT 789C Haul Truck (Caterpillar).
Two CAT 789Cs will be purchased with the CAT 6030-FS because the haul distance will
be shorter to start and production will not be as important during overburden removal. Once
two benches are open, a third CAT 789C will be purchased. An extra CAT 789C will be purchased
every time two more benches are opened until a fleet of five has been obtained. The purchase
of the CAT 785Ds will follow the same method as the CAT 789Cs except it will be offset by the
time between the purchase of the CAT 6030-FS and the CAT 6018-FS.
Bass River Mine Site
Mining Equipment 44
Figure 6-4: CAT 785D haul truck (Caterpillar).
6.4 Miscellaneous Production Equipment
In any mining operation there must be a large amount of diverse equipment to maintain
certain activities in the mine. These activities include secondary operations in the mine. The
secondary operations can range from maintaining the haul road, and initial drilling, to
excavation of the property before mining.
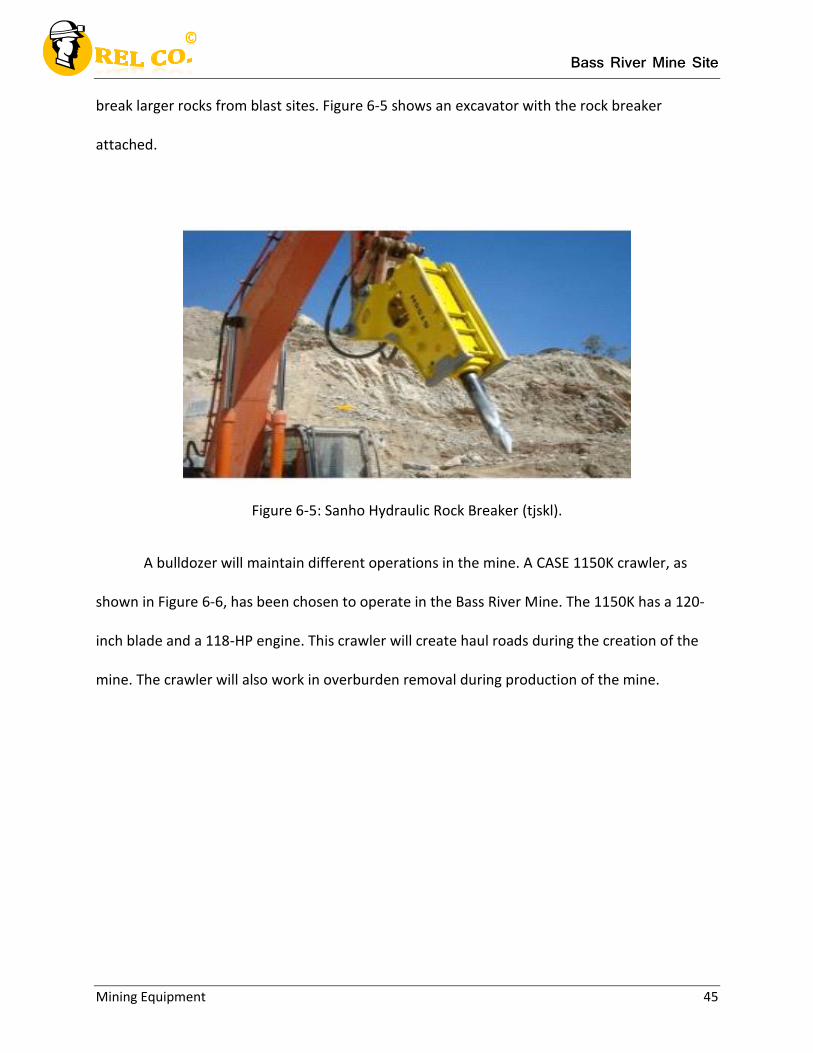
The mine will purchase a CASE CX470C to be used in the production phase of the mine.
This excavator will be brought into the mine in the early stages of development. It will be used
to dig settling ponds on the property. The shovel will also be used to remove the overburden.
When both of these activities are complete the excavator will be used to maintain the settling
ponds, and later a rock breaking attachment will be purchased so that the shovel can be used to
Bass River Mine Site
Mining Equipment 45
break larger rocks from blast sites. Figure 6-5 shows an excavator with the rock breaker
attached.
Figure 6-5: Sanho Hydraulic Rock Breaker (tjskl).
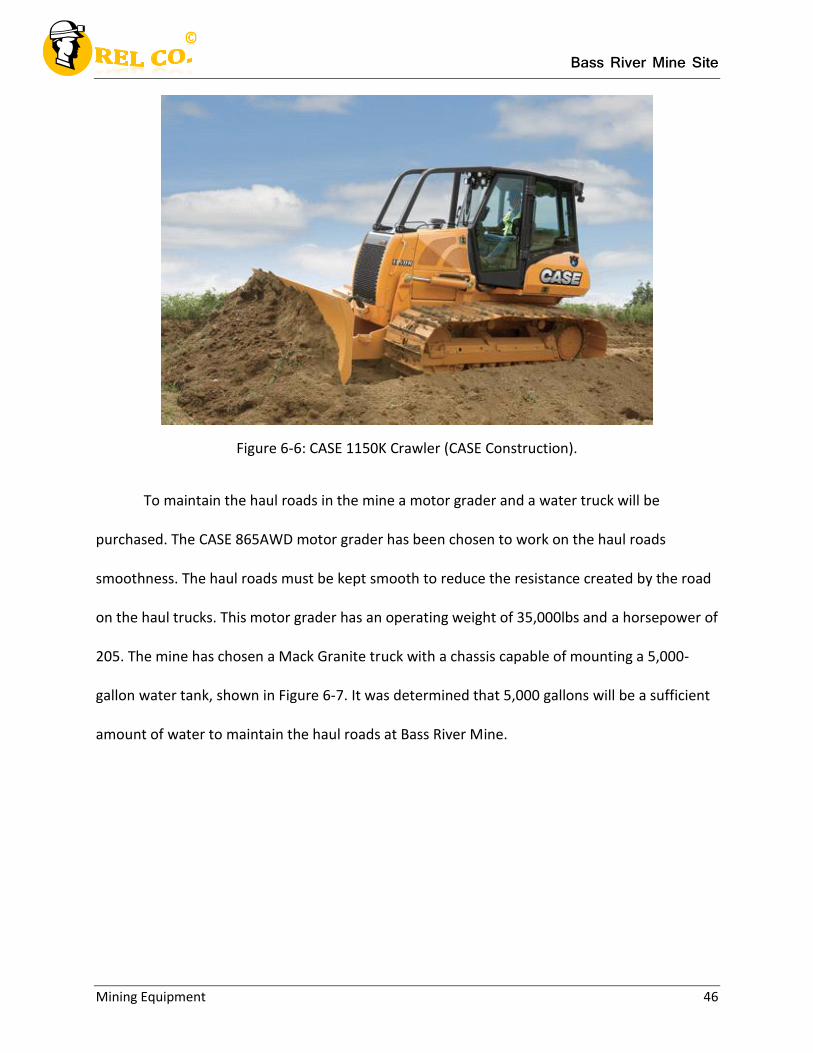
A bulldozer will maintain different operations in the mine. A CASE 1150K crawler, as
shown in Figure 6-6, has been chosen to operate in the Bass River Mine. The 1150K has a 120-
inch blade and a 118-HP engine. This crawler will create haul roads during the creation of the
mine. The crawler will also work in overburden removal during production of the mine.
Bass River Mine Site
Mining Equipment 46
Figure 6-6: CASE 1150K Crawler (CASE Construction).
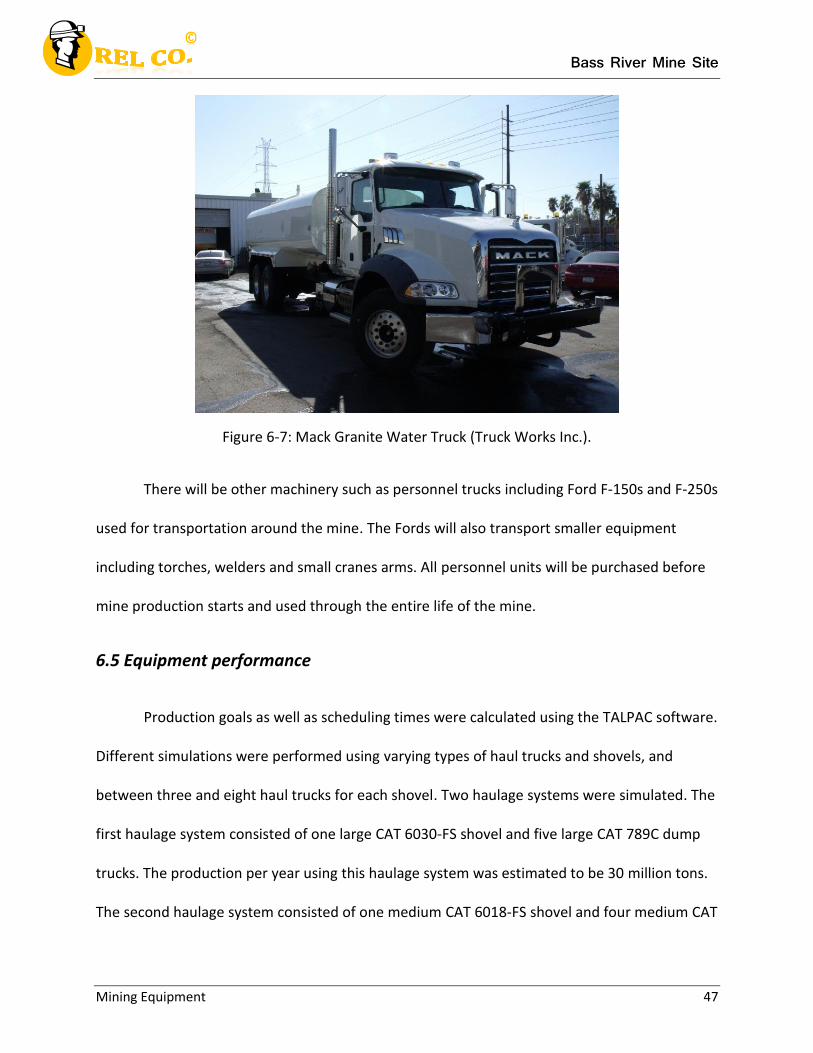
To maintain the haul roads in the mine a motor grader and a water truck will be
purchased. The CASE 865AWD motor grader has been chosen to work on the haul roads
smoothness. The haul roads must be kept smooth to reduce the resistance created by the road
on the haul trucks. This motor grader has an operating weight of 35,000lbs and a horsepower of
205. The mine has chosen a Mack Granite truck with a chassis capable of mounting a 5,000-
gallon water tank, shown in Figure 6-7. It was determined that 5,000 gallons will be a sufficient
amount of water to maintain the haul roads at Bass River Mine.
Bass River Mine Site
Mining Equipment 47
Figure 6-7: Mack Granite Water Truck (Truck Works Inc.).
There will be other machinery such as personnel trucks including Ford F-150s and F-250s
used for transportation around the mine. The Fords will also transport smaller equipment
including torches, welders and small cranes arms. All personnel units will be purchased before
mine production starts and used through the entire life of the mine.
6.5 Equipment performance
Production goals as well as scheduling times were calculated using the TALPAC software.
Different simulations were performed using varying types of haul trucks and shovels, and
between three and eight haul trucks for each shovel. Two haulage systems were simulated. The
first haulage system consisted of one large CAT 6030-FS shovel and five large CAT 789C dump
trucks. The production per year using this haulage system was estimated to be 30 million tons.
The second haulage system consisted of one medium CAT 6018-FS shovel and four medium CAT
Bass River Mine Site
Mining Equipment 48
785D dump trucks. The production per year using this haulage system was estimated to be 18
million tons. The availability of both the shovels was 85% and 100% for the dump trucks. With
production values from the simulation the mine life will be 10 years. A summary of TALPAC
simulations of loading analysis and haul road analysis can be found in Appendix F as Figure F-1
and F-2. Sensitivity Analysis was done comparing change in net profit, shown in Appendix F as
Tables F-II through F-IV. In these tables the number of haul trucks, operating and maintenance
costs, or price of iron were changed to affect the analysis.
6.6 Mining and Ancillary Equipment Costs
The estimates for equipment costs were based on prices obtained from used equipment
auctions, Ford Motor Company’s website and Mine & Mill Equipment Costs Estimator's Guide
(infomine) for capital and operating costs. The online auction searches were used for
equipment not found in the estimators guide. Pieces include the CAT 6030-FS and CAT 6018-FS-
FS. Based on the used price, an approximate new price was calculated. The Mine and Mill
Equipment Costs Estimator’s Guide contained pertinent information relating to the remaining
equipment. The per unit capital cost for similar equipment is given. The operating and
maintenance cost for the various equipment is also detailed in the guide.
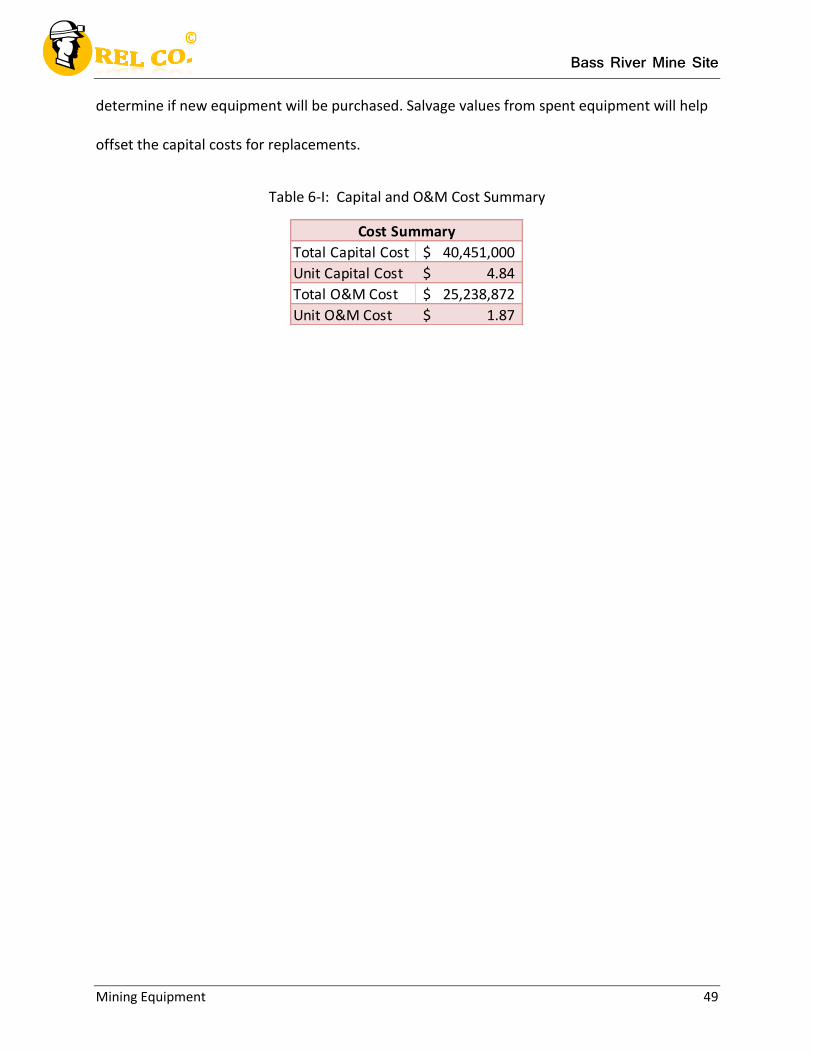
Table 6-I shows the generalized cost summary of the project. Table F-I in Appendix F
contains the cost information for all the equipment being bought to bring the mine to full
production. The table assumes full time usage of machinery. Based on the mines equipment
needs, certain machinery may not be operating full time. The different aspects of mine life will
Bass River Mine Site
Mining Equipment 49
determine if new equipment will be purchased. Salvage values from spent equipment will help
offset the capital costs for replacements.
Table 6-I: Capital and O&M Cost Summary
Total Capital Cost 40,451,000$
Unit Capital Cost 4.84$
Total O&M Cost 25,238,872$
Unit O&M Cost 1.87$
Cost Summary
Bass River Mine Site
Health and Safety 50
REL Company
Chapter 7
Bass River Mine Project: Health and Safety
Bass River Mine Site
Health and Safety 51
7.1 Pertinent Regulations
Opening a mine in New Jersey requires that regulations created by state and federal
agencies are followed. If compliance is not met, financial and operational consequences could
threaten the future of the mine. The state of New Jersey does not have an expansive history of
mining such as Virginia or Arizona. In this case, federal regulations will provide the bulk of
health and safety regulations and guidelines. If regulations overlap, the strictest instance will be
adopted at Bass River.
The federal agency overseeing the health and safety standards of Bass River Mine is the
Mine Safety and Health Administration (MSHA). The agency is further put under the United
States Department of Labor (DOL). The regulations set by MSHA are compiled in the Code of
Federal Regulations (CFR). Chapter 30 in the CFR pertains to mineral resources and mining
operations. The chapter is further divided into subsections on surface metal mine operations,
which include sections G, H, I, K and M.
Subchapter G highlights filing and administrative requirements in parts 40-45.
Subchapter H contains regulations on proper education and training in parts 49-49. This
includes both miners and mine rescue teams. Part 50 of subchapter I outlines reporting and
investigation of accidents, injuries, illness, employment and production in mines. Subchapter K
describes health and safety standards in metal/nonmetal mines in parts 56 and 58. The final
subchapter, M, regulates occupational noise levels.
Bass River Mine Site
Health and Safety 52
Mine safety is regulated Under the Department of Labor and Workforce Development
(LWD) of New Jersey. The LWD helps to set standards in all mining industries in New Jersey and
particularly defines mine safety by stating:
The Mine Safety Act (N.J.S.A. 34:6-98.1 et seq.) along with the Pits and Quarries
Regulations (N.J.A.C. 12:185) provides for the safety and health of workers and for the
construction, operation, and maintenance of pits and quarries in the interest of the life,
health and safety of employees, as well as protection of property. The Mine Safety Act
also provides for the development of safety educational programs. (Mine Safety Act &
Pits and Quarries Regulations).
The Mine Safety Act 34:6-89.7 specifically addresses safety; however safety protocol and
guidelines are outlined in other sections of the act. In chapter 185 of the administrative codes
and statutes, mining operations are divided into separate sections. Subsections 1-31 cover
areas such as accident reports, protective equipment, and dust control and all of the
regulations set by the state are used in conjunction with the Code of Federal Regulations.
While the vast majority of mine health and safety regulations are from MSHA and
DLWD, regulations will be used from other agencies such as Federal Railroad Administration
(FRA), Environmental Protection Agency (EPA), National Transportation Safety Board (NTSB)
and Chemical Safety and Hazard Investigation Board (CSB) depending on operations and
jurisdictions.
Bass River Mine Site
Health and Safety 53
7.2 Potential Hazards
Mining operations at Bass River Mine present many safety concerns and potential
hazards. It is our goal to control these hazards and maintain a safe work environment for our
employees. While the company’s goal is to eliminate hazards, it is inevitable that disturbances
and injuries will occur. Each incident is assigned a rank and type, the examples of which are
outlined below:
Mine Fires
o Rare but can cause significant damage and loss of life from the actual fire or fumes
created.
Mine Explosions
o Rare but can cause major structural damage on top of the physical blast and fumes.
Industrial Hygiene
o If industrial hygiene is not practiced, minor incidents such as slipping or minor cuts
can escalate to broken bones or even death.
Noise
o Depending on noise levels, hearing loss can occur immediately or slowly over time.
Respirable Dust
o While not as significant a threat as in an underground mine, dust may cause short
term discomfort and long term health issues.
Ground Control
o Has a high degree of danger due to the scale and damage that can be caused.
Electrical
o Electrocution can be fatal and lack of power to the mine site can potentially cause
other issues.
Power Equipment
Bass River Mine Site
Health and Safety 54
o The danger level can be both high and low depending on the situation. Death can
result from large equipment accidents or slow damage to operators due to
continued operation.
After identifying hazards they must be classified by severity and the frequency of the
hazard. After classification, resources can be allocated based on the need to control the hazard.
Classification can also take into account the property damage severity rate. MSHA can use
these rates to determine a pattern of violations. If a pattern is found, hefty fines or closure
orders can be established (Karmis 2012).
7.3 Contact Personnel
In the event of an incident, the company will be contacted as well as regulatory agencies
such as MSHA. The people that will be contacted from the corporate level include the mine
foreman, the Director of Health and Safety, mine manager, and the Vice president of REL Co.
operations. The mine foreman can be contacted through wireless handheld radio on the mine
property. The foreman will notify the mine manager through wireless radio or through
cellphone. The mine manager will contact the Director of Health and Safety and the Vice
president of REL Co. operations using numbers listed in the mine office on site. The mine
manager will go over the incident with the Director of Health and Safety to decide what further
actions need to be taken and what agencies need to be contacted. MSHA may need to be
contacted, in which case either the mine manager or the Director of Health and Safety will
contact the MSHA Northeastern District. Contact personnel from MSHA can be found in Table
7-I.
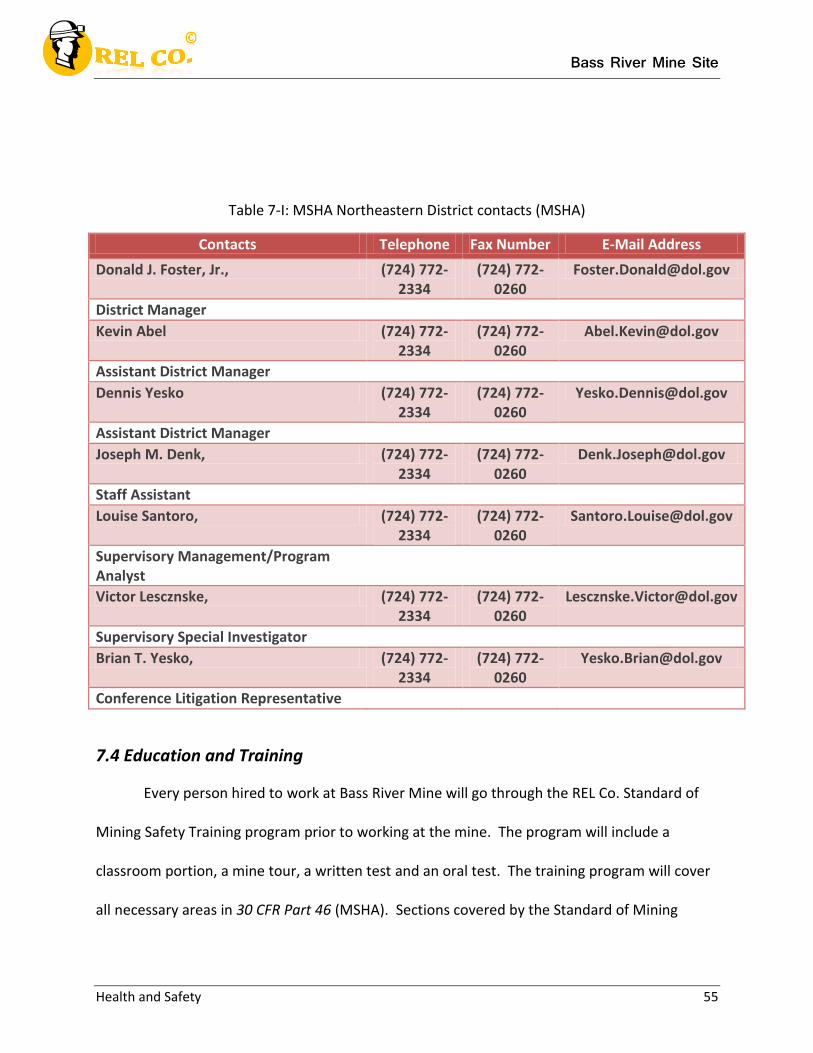
Bass River Mine Site
Health and Safety 55
Table 7-I: MSHA Northeastern District contacts (MSHA)
Contacts Telephone Fax Number E-Mail Address
Donald J. Foster, Jr., (724) 772-2334
(724) 772-0260
District Manager
Kevin Abel (724) 772-2334
(724) 772-0260
Assistant District Manager
Dennis Yesko (724) 772-2334
(724) 772-0260
Assistant District Manager
Joseph M. Denk, (724) 772-2334
(724) 772-0260
Staff Assistant
Louise Santoro, (724) 772-2334
(724) 772-0260
Supervisory Management/Program Analyst
Victor Lescznske, (724) 772-2334
(724) 772-0260
Supervisory Special Investigator
Brian T. Yesko, (724) 772-2334
(724) 772-0260
Conference Litigation Representative
7.4 Education and Training
Every person hired to work at Bass River Mine will go through the REL Co. Standard of
Mining Safety Training program prior to working at the mine. The program will include a
classroom portion, a mine tour, a written test and an oral test. The training program will cover
all necessary areas in 30 CFR Part 46 (MSHA). Sections covered by the Standard of Mining
Bass River Mine Site
Health and Safety 56
Safety Training program include new miner hire, experienced miner hire, task training, annual
refresher training and site hazard awareness training. All training will be recorded and certified
by MSHA and all records will be kept on site in the office. All training occurs during normal shift
hours and miners are paid for their time during training.
The Standard of Mining Safety Training program consists of 24 hours of training that
focus on helping miners understand rules and regulations as well as the importance of them.
Avoidance and prevention of hazards at the mine site will be covered to reduce incidents at the
mine. Health and Safety standards will be covered so miners understand their rights to a safe
work environment. The emergency response plan for Bass River Mine will be reviewed during
the training program. A review of miner’s rights and representatives will be given. Respiratory
device use will be covered to help prevent serious harm the miners in case of a serious incident.
Finally a first aid course will be given to all miners within four months of their employment.
Experienced miners will be given 10 hours of training covering all topics listed by MSHA
for newly hired experienced miners. Every 12 months each miner will go through an eight-hour
annual refresher course that will review miner health and safety issues as well as any new
hazards at the mine site. If a miner is assigned a new task he or she will go through new task
training by a qualified experienced miner or the mine foreman if he is capable of such training
(MSHA).
7.5 Inspections
The Mine Safety and Health Administration will be responsible for all inspections
conducted at the mine site. Since the mine is a surface mine, there will be a minimum of two
Bass River Mine Site
Health and Safety 57
unannounced inspections per year conducted by MSHA. Mine personnel may accompany the
MSHA officer during these inspections. The MSHA officer may also choose to attend any safety
meeting during the course of the inspection. The MSHA officer may also converse with mine
employees as part of the inspection. Complaints from the neighborhood surrounding the mine
property as well as internal complaints, warrants an inspection at any time in addition to the
two mandatory inspections per year.
The evaluation criteria during inspections are noise, dust control and electrical
compliance issues. Other than these issues, the mine is evaluated as a whole for any
compliance issues. Volume IV of the program policy manual at the MSHA website lists laws that
need to be followed for metal/nonmetal mines. A camera might be used during the inspection
to gather evidence in case of an accident. As part of the inspection, dust and mist surveys may
be conducted to evaluate control measures. The maximum values permissible for noise and
dust can be found in 30 CFR, Parts 56 and 57. In cases where dust or noise values exceed the
accepted limit, a citation may be issued. In extreme cases, especially when a violation results in
a serious hazard, citations may contain legal penalties, including jail time. Violations leading to
serious hazards are termed significant and substantial.
7.6 Emergency Response Plan (ERP)
MHSA issued a final rule implementing Section 2 of the Mine Improvement and New
Emergency Response (MINER) Act of 2006. It states that:
Mine operators to increase the availability of emergency breathing devices, provide
improved training on the use of the devices, improve emergency evacuation and drill
Bass River Mine Site
Health and Safety 58
training, install lifelines for emergency evacuation, and require immediate notification
of MSHA in the event of an accident (Mine Safety and Health Administration (MSHA) -
Home Page).
This Act caused Bass River Mine to make a revised version of their Emergency Response
Plan. The devised emergency response plan was also a result of risk assessment of all the
potential dangers and emergency situations that might arise at the Bass River Mine. Mandatory
training will be provided to every employee at the mine.
In case of an emergency at Bass River Mine, a siren will be sounded throughout the
mine and the nature of the emergency will be broadcast on all radio frequencies. The first step
in any emergency is to evacuate from the location. The response plan must consulted during an
emergency to develop an appropriate response depending on the nature of the accident. The
foreman at the site determines the nature of the situation after consulting with the health and
safety director. MSHA must be contacted regardless of the nature of the emergency. An
adequate number of communications and tracking devices will be provided throughout the
mine to ensure speedy emergency response. All the equipment including communication
devices at the mine needs to be in compliance with the plan at all times. Audits will be
conducted on a yearly basis to include improvements to the ERP at Bass River Mine. A Mine
rescue team will be formed, consisting of some of well trained employees. Additional
information for all employees on the ERP is provided on the MSHA website. All employees at
Bass River Mine will also be encouraged to keep up with the incident and fatality reports on
Bass River Mine Site
Health and Safety 59
MSHA’s website to increase awareness of potentially dangerous situations that might arise at a
surface mine.
7.7 Hazard Identification and Controls
Maintaining a high standard of health and safety is important to REL Co. for many
different reasons. Determining different hazards and controlling these problems can help to
provide a safe worker area for our miners. Bass River mine is an open pit mine so some hazards
to consider are highwall failure, respirable dust, noise, electrical, and powered equipment.
The first hazard that can be identified is highwall failure, which occurs when the pit wall
becomes unstable because of poor design or bad blasting techniques. This failure can cause
large rocks to fall from the wall and injure employees and/or damage equipment. Two steps will
be taken to control highwall failure. The first and most important step is to design the highwall
in a way that prevents failure. By knowing the characteristics of the rock the highwall is made of
it will be possible to obtain the strength, stress and strain. With these values, a correct design
can be created. Another way to address the danger of highwall failure is employee education.
Education is important in order to of the unpredictable nature of a highwall, even if it is well
designed. Employees will be told to watch for cracks in the wall, new water springs appearing
and other signs of deterioration.
Respirable dust is a hazard that appears in above ground mining if a large amount of
dust is inhaled. To maintain low dust levels, a water truck will be used on haul roads to keep
dust down and equipment, such as crushers, will have built in sprayer systems. If employees
Bass River Mine Site
Health and Safety 60
must work in areas where dust is a problem, they will be required to wear respirator masks and
to keep the area ventilated with a fan to circulate fresh air.
Electrical hazards are common in mines, predominantly including exposed wires and
hazards caused by working on equipment. If working areas are not maintained, wires can be
cut, exposing employees to high voltages that can be lethal. Working on equipment that has
not been properly locked out can be equally deadly. To help to control the hazards REL Co. will
maintain high standards among workers that will keep work areas safe and clean. If an exposed
wire is discovered, it will be fixed by covering the wire with electric tape or replacing the wire.
REL Co. will have a training course that explains the procedure of locking out equipment to
prevent injury and they will also have posters in areas and locks that will easily educate
employees to promote a safe environment.
A major concern for an above ground mine is noise pollution because the noise effects
the employees at the mine and the surrounding community. Noises can come from many
different pieces and can range from the noise a motor makes to the sound of material being
loaded into haul trucks. Equipment operators and plant workers are the most likely to suffer
from noise pollution and will be provided adequate hearing protection such as ear plugs or ear
muffs. The noise that travels outside the quarry should dissipate before it reaches the
surrounding community because of the location of Bass River mine.
The final consideration for REL Co. is the danger of powered equipment. This equipment
can cause a serious threat to the workers in the vehicles and the workers around the vehicles.
Drivers can lose control of their vehicles if haul roads are designed poorly causing crashes that
Bass River Mine Site
Health and Safety 61
injure both the driver and the surrounding equipment. Workers around trucks are also at risk of
being hit by vehicles because a driver cannot see them. To help control these hazards, cameras
will be installed on large vehicles such as loaders and haul trucks. This will allow drivers to
observe the area behind their truck that is normally a blind spot. Haul roads will also be
designed to help prevent accidents. Berms will also be put into place along haul roads to
prevent trucks that veer off of the road.
Bass River Mine Site
Surface Facilities 62
REL Company
Chapter 8
Bass River Mine Project: Surface Facilities
Bass River Mine Site
Surface Facilities 63
8.1 Introduction
The chapter will cover all the surface facility requirements for the Bass River Mine. The
surface facility requirements include the layout, structure description and the cost associated
with the construction and maintenance of the facilities. The surface facilities constructed at
Bass River Mine will be responsible for meeting the electrical, mechanical, maintenance and
storage needs of the mine. The surface facility layout will also house the administrative
department for Bass River Mine.
8.2 Surface Construction
Bass River Mine will have all the essential operational facilities located at a centralized
location. These facilities will include the administrative office, a bathhouse, parking garages and
storage buildings among other building and access facilities. The warehouse will be placed in
the middle of the facility complex, attached to a light vehicle parking garage. The bathhouse
connected to the administrative office will be placed to the southeast of the warehouse. The
bathhouse and the warehouse are within close proximity to each other to allow ease of access.
The heavy vehicle garage, the maintenance/fabrication shop and the auxiliary storage building
will be built on the southeast side of the warehouse adjacent to the administrative office. The
main objective of placing the former facilities close to each other is to ensure speed and
efficient maintenance of equipment. The storage lot will be placed to the northeast of the
warehouse and the main parking lot and the fuel station will be to the north of the warehouse.
There will be a second, smaller parking lot behind the administrative building. The parking lot
will have enough capacity to service the vehicles of employees working at Bass River Mine
Bass River Mine Site
Surface Facilities 64
administrative office. There will be a building for storage of explosives at the southwest corner
of the smaller parking lot. The building will be built at the considerable distance from all the
other surface facilities to ensure safety of the mine and its employees.
A power distribution building and a kVA substation responsible for providing power to
the surface facilities at Bass River Mine will be built. The building will be located behind the
auxiliary storage building and will have power lines running throughout all of the surface
facilities. The surface facilities will be fenced in at the southwest corner of the warehouse.
Apart from power lines and fencing, roadways will be built to simplify access. A basic design of
the surface facility layout is provided in the Appendix H as Figure H-I.
8.3 Surface Structures
A mine is comprised of different structures that all serve a distinct purposes. The
primary purpose of the buildings near the entrance will be employee and administrative
service. A warehouse and a shop to house different mechanical and electrical components will
be necessary. Building sheds will also be constructed to hold bulk items that will be used
frequently. Finally, structures such as extra storage buildings and a power distribution building
will be built.
A 5,000 square-foot building will contain the mine bath house and will be located next
to an identical building housing the administrative offices. The administrative building will
contain the computer and data equipment that mine personnel will use to conduct day to day
operations. The bath house will provide shower facilities and storage for employees personal
affects. Also located at the mine entry will be a security building of 2,200 square-feet. There will
Bass River Mine Site
Surface Facilities 65
be surveillance equipment to monitor the activities of the people who come in and out of the
mine. This building will also take care of the check-ins of vehicles and deliveries.
Assistance with mechanical needs and fabrication will be provided by a 5,625 square-
foot shop. It will contain all of the tools that are need for the repair of all equipment on the site
and have a full fabrication area to assist with random needs of the mine. A 1,750 square-foot
light vehicle garage and a 9,000 square-foot heavy vehicle garage will be used for everyday
upkeep of the vehicles and storage during non-working hours.
A 40,000 square-foot warehouse will be built with receiving docks on each side and
provide storage for all the extra parts for the processing plant and mine. The warehouse will
house all mining tools that are not stored in the employee storage in the bath house. A 5,625
square-foot auxiliary storage shed will be built to house extra equipment and material that is
not being kept in the garages or the warehouse. Things such as oil and lubrication for the non-
vehicular equipment will be stored in the auxiliary shed. There will be two specific reinforced
buildings that will be built to store all explosives on site. One will be 900 square-feet and the
other will be 2,500 square-feet.
There will be two onsite lots for parking and storing vehicles. The parking lot is 15,000
square-feet and will be used for employee and guest parking with a capacity of around 70
vehicles. The storage lot will be 90,000 square feet and used to store extra equipment that is
not being used and for spent mechanical items that will soon be removed from the site.
Finally, a power distribution building will be built to supply the rest of the mine with
power that is created at the substation. The distribution building will contain all of the switches
that are run to the equipment in the plant. It will have a lock out station with locks and tags for
Bass River Mine Site
Surface Facilities 66
safely shutting off equipment during maintenance. The building will be 1,200 square-feet and
will have rubber floor mats to protect employees that go inside to lock out equipment. There
will also be a small computer system in the building that will monitor the activity of the
different pieces of equipment in the mine. The computer will provide the ability to shut down
different components of the mine in case of an emergency.
8.4 Support Facilities
Bass River Mine is located next to multiple towns such as Tuckerton and Manahawkin,
which allows the mine to connect to the water and sewage systems of Tuckerton. There will be
lines of water for buildings for washing and also clean water lines for employees, which will be
connected to the administrative building. Workers will be given coated metal water bottles to
ensure the safety of the water. Secondary clean water lines will run to the light vehicle garage
and the maintenance/fabrication shop.
A KVA substation will be used to power all operations for the Bass River Mine, which will
be run by Atlantic City Electric. The substation will be inaccessible to miners at the site for
safety and a concrete slab will be below the substation and extend out with a fence
surrounding the area. Power lines will be connected from the substation to the guard post, the
bathhouse and the auxiliary storage. A series of power lines will run to the fabrication shop and
to the heavy and light vehicle garages from the auxiliary storage. Lamp posts will be located
next to the entrance and the guard post to make sure there are no trespassers. External lighting
will be located on the building to illuminate the roadway to keep miners safe from vehicles and
to give a safe walkway to the parking lot. The parking lot and storage lot will both have lamp
posts to provide vision for anyone trying to find their car or an item in the storage lot.
Bass River Mine Site
Surface Facilities 67
A weigh station will be located just before the entrance requiring the weight leaving to
be recorded allowing for better efficiency. A chain link fence ten feet high will run around the
entire property of the mine site to prevent civilian accidents and to prevent theft. A small
auxiliary storage building will be located near the front of the property next to the fabrication
shop.
8.5 Surface Facility Costs
Determining the cost of various surface facilities at Bass River Mine was done using
multiple sources. Most of the sources were websites pertaining to the specific building style
and type. Information was also back checked against the Mining Cost Service provided by
CostMine. From these sources, an estimated price for building construction was developed. The
building construction price is called the “capital cost” and includes the cost of material, delivery
and construction labor. The cost of replacement for certain facilities and areas was also
considered. Gravel lots need multiple replacement cycles in order to provide a smooth driving
and parking service. Other buildings may need replacement in the future, but it has yet to be
determined. Therefore, the replacement costs are set at zero. Operating and maintenance costs
for surface facilities were more difficult to calculate so a separate average cost per square foot
was determined for office areas, shops/garages and warehouses.
All the figures determined by cost analysis are estimates. This means that the actual
figures may vary at differing levels. Total cost for the project is estimated to be just shy of
$2,000,000. Unit capital cost for the expected 42 million ton extraction per year is $0.49 per
ton. Unit operating and maintenance cost for expected extraction is $0.05 per ton. The actual
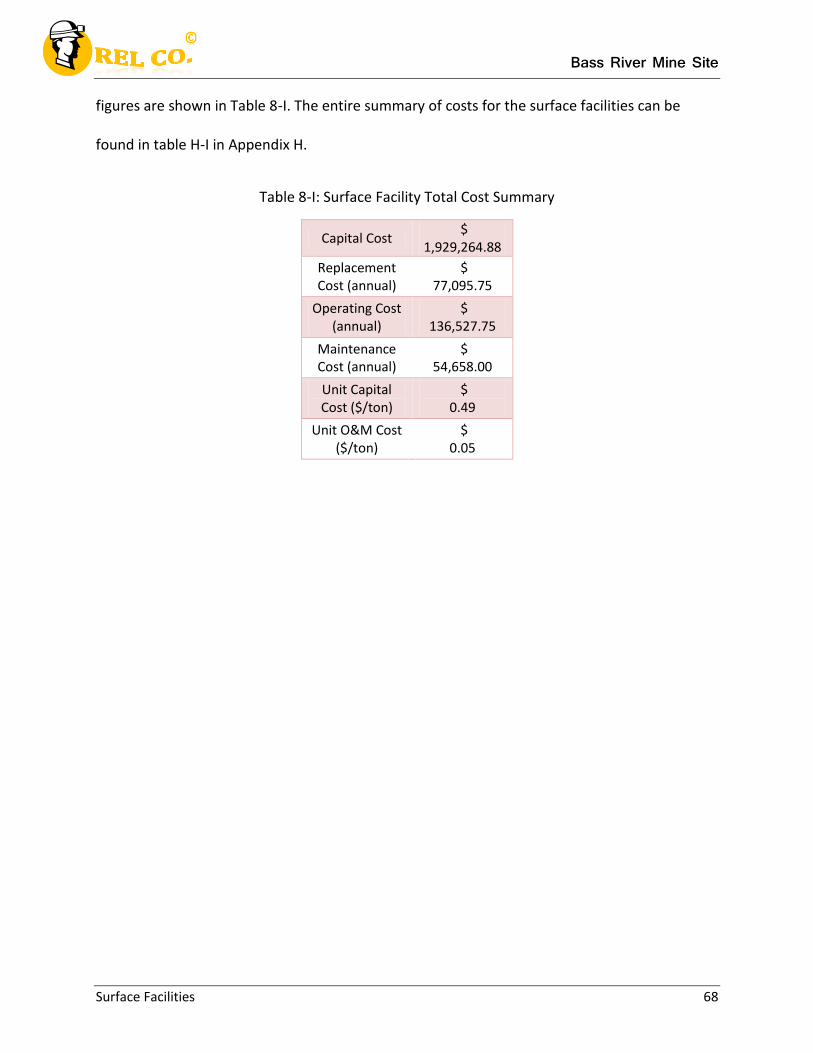
Bass River Mine Site
Surface Facilities 68
figures are shown in Table 8-I. The entire summary of costs for the surface facilities can be
found in table H-I in Appendix H.
Table 8-I: Surface Facility Total Cost Summary
Capital Cost $
1,929,264.88
Replacement Cost (annual)
$ 77,095.75
Operating Cost (annual)
$ 136,527.75
Maintenance Cost (annual)
$ 54,658.00
Unit Capital Cost ($/ton)
$ 0.49
Unit O&M Cost ($/ton)
$ 0.05

Bass River Mine Site
Detailed Mining Plan 69
REL Company
Chapter 9
Bass River Mine Project: Detailed Mine Design
Bass River Mine Site
Detailed Mining Plan 70
9.1 Overview
REL Co. will extract iron magnesium from the Cohansey Formation in Bass River, New
Jersey, and sell the product to steel manufacturers. Bass River Mine is an open pit mining
operation that will produce 7.1 million tons of iron magnesium ore per year, at close to 100%
iron. The exploration results show that the mine pit will be approximately 1400 acres, placed in
the middle of the mining property. The higher grade ore is found at very shallow depths
between five and 50 feet below the surface. The mining property extends to double the size of
the pit, leaving room for stockpiles, overburden and distance to nearby structures to lower
values of noise and dust. The processing plant and other surface facilities are located to the
north of the pit on level ground.
Preliminary excavation of the overburden is done by one CAT 3060-FS and one CAT
3018-FS. Haul trucks will transport the excavated overburden to the southern part of the mine
property and a muck pile will be created. After the overburden is removed, blasting will be used
to fracture the ore before excavation. Material will be hauled to the crusher using Caterpillar
haul trucks. Afterwards the material will be loaded into the crusher using a small Caterpillar
front shovel.
Pit design is based on the exploration program that has been conducted. The largest
depth for the pit will be 500 feet, below which the iron magnesium is unprofitable. The pit
angle is 60 degrees from horizontal; the benches will be 95 feet wide with a height of 42 feet.
The haul route will follow the benches for transportation of ore and personnel between the
surface facilities and the pit. The general layout for Bass River Mine is shown in Figure 9-1.
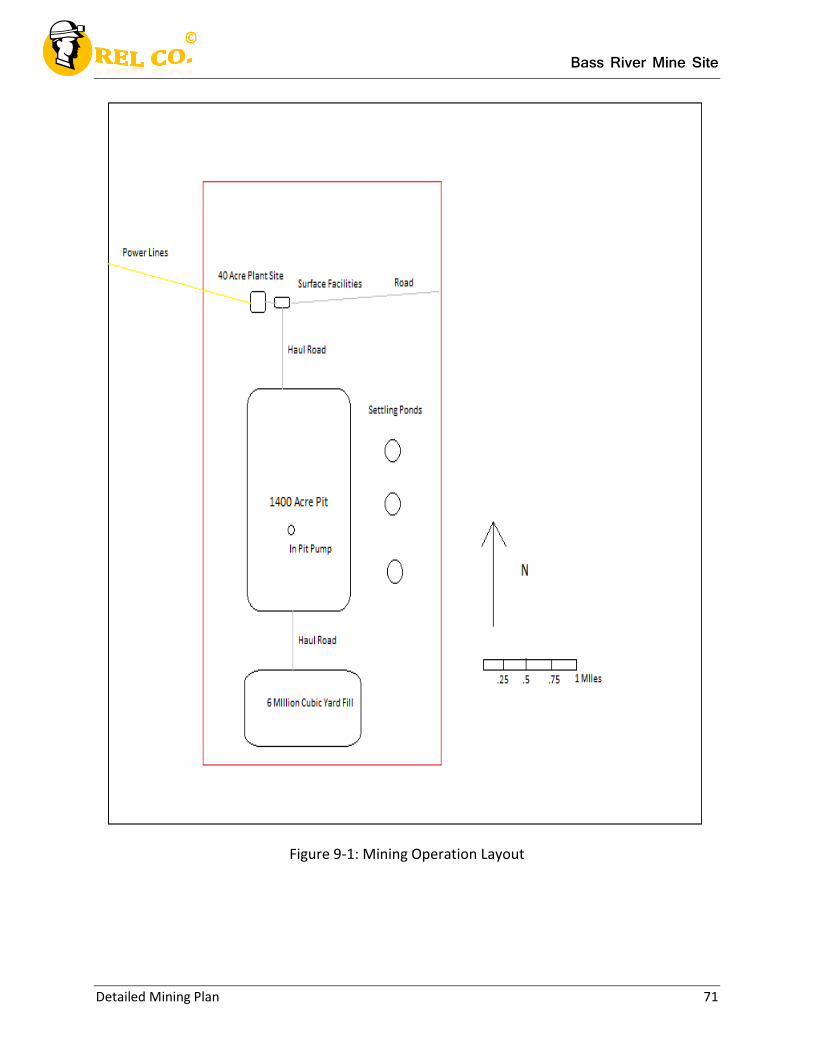
Bass River Mine Site
Detailed Mining Plan 71
Figure 9-1: Mining Operation Layout
Bass River Mine Site
Detailed Mining Plan 72
9.2 Development
After the exploration program is completed and studies are determined, the first step is
to obtain permits for mining and purchase the land. Local special use, environmental,
reclamation, industrial storm water, construction and general permits will be obtained to start
the mining process. A community gather will be held and the board will vote for the acceptance
of the permit. The reclamation permit is obtained by designing and submitting an appropriate
reclamation plan and paying a bond in case the REL Co is unable to fulfill the reclamation plan.
The industrial storm water and construction general permits are submitted to the New Jersey
Department of Environmental Protection (NJDEP). REL Co. will buy the land instead of leasing
the land and paying royalties. All permitting will be handled by the REL Co. legal team. The land
purchase and permitting is to be completed between February 2015 and July 2015 to keep to
the schedule.
After land purchase and permitting is completed, roads and surface facilities will be
constructed to support further activities. As the surface facilities are completed, utilities will be
connected from the surrounding areas. After the surface facilities are built the processing plant
will be constructed. Haul roads will be graded and constructed while the processing plant is
under construction. All construction before mining will be contracted to a local company.
General roads and parking lots are to be completed no later than October 2015. The storage lot
and auxiliary storage will be completed during October and November of 2015. The vehicle
garages, kVa substation and power distribution buildings will be constructed between
December 2015 and January 2016. The administrative buildings and warehouse will be

Bass River Mine Site
Detailed Mining Plan 73
constructed between February and April of 2016. Electricity connection as well as the
construction of the kVa substation and power distribution building is to be completed by
January 2016. The sewage and water systems as well as construction of surface facilities will be
completed by April 2016. Fencing will be constructed around the entire property between
October of 2015 and January 2016 to prevent people from entering the property as the first
surface facilities are finished. The processing plant will be constructed between April 2016 and
July 2016. Haul roads will be graded and paved during the processing plant construction to be
complete before July 2016.
The hiring of employees will begin as the processing plant and haul roads are finished.
Hiring will take place from July 2016 to September 2016. Some types of employees that will be
hired miners, mechanics, electricians, engineers, office staff and project managers. Hiring for
the Bass Rive Mine site will be advertised in local newspaper, billboards and other media
sources during the hiring process. The development steps are shown on a Gantt chart in Figure
9-2. The Gantt chart starts with the permitting process in February 2015 and ends with the
hiring process completed on September 2016.
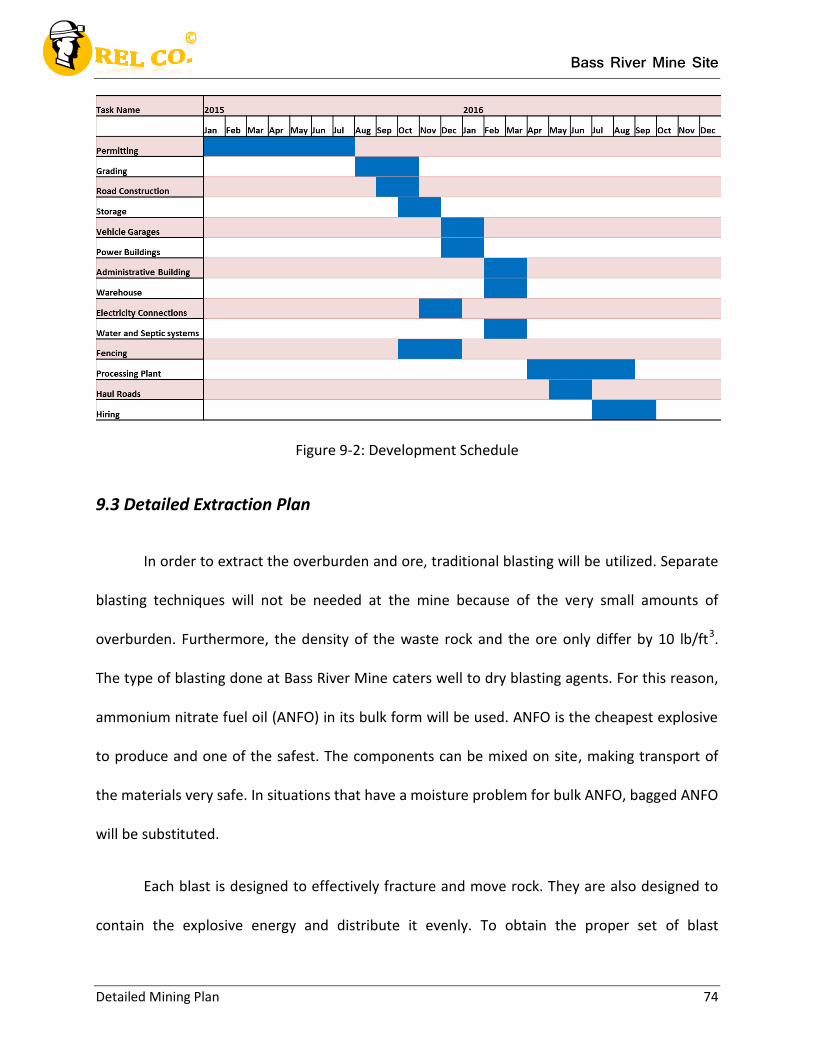
Bass River Mine Site
Detailed Mining Plan 74
Figure 9-2: Development Schedule
9.3 Detailed Extraction Plan
In order to extract the overburden and ore, traditional blasting will be utilized. Separate
blasting techniques will not be needed at the mine because of the very small amounts of
overburden. Furthermore, the density of the waste rock and the ore only differ by 10 lb/ft3.
The type of blasting done at Bass River Mine caters well to dry blasting agents. For this reason,
ammonium nitrate fuel oil (ANFO) in its bulk form will be used. ANFO is the cheapest explosive
to produce and one of the safest. The components can be mixed on site, making transport of
the materials very safe. In situations that have a moisture problem for bulk ANFO, bagged ANFO
will be substituted.
Each blast is designed to effectively fracture and move rock. They are also designed to
contain the explosive energy and distribute it evenly. To obtain the proper set of blast
Bass River Mine Site
Detailed Mining Plan 75
characteristics, certain values have to be calculated. Ash’s ratios will be used as the
mathematical formula to produce the following values (TCMRC):
De = Diameter of the explosive in the borehole (in).
B = Burden, distance from the charge measured perpendicularly to the nearest free face and in the direction that displacement will most likely occur at the time of charge firing (ft).
S = Spacing, distance between two holes such that the spacing is all measured perpendicular to its corresponding burden (ft).
H = Hole length (ft).
J = Subdrilling length, depth hole is drilled below the established floor (ft).
T = Collar distance, the portion of the borehole not containing explosive (ft).
Ash ratios are shown as equations solving for the unknown:
B = KBDe/12; KB = Burden ratio
S = Ks B; Ks = Spacing ratio
H = KH B; KH = Hole length ratio
J = KJ B; KJ = Subdrilling ratio
T = KT B; KT = Collar distance ratio
In addition to the above values, other critical information is shown in Tables 9-I and 9-II.
The blast design will produce 80,000 tons per shot. This means that in order to meet the 8,000
tons per hour production, a blast will occur every shift.
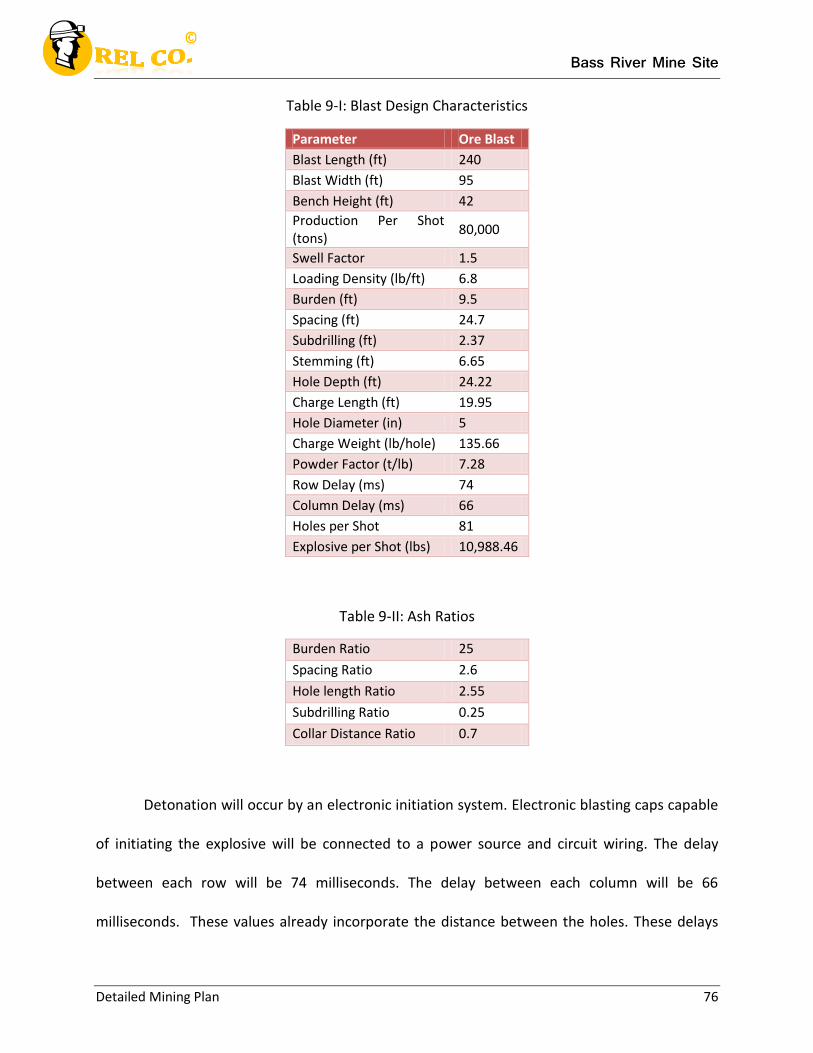
Bass River Mine Site
Detailed Mining Plan 76
Table 9-I: Blast Design Characteristics
Parameter Ore Blast
Blast Length (ft) 240
Blast Width (ft) 95
Bench Height (ft) 42
Production Per Shot (tons)
80,000
Swell Factor 1.5
Loading Density (lb/ft) 6.8
Burden (ft) 9.5
Spacing (ft) 24.7
Subdrilling (ft) 2.37
Stemming (ft) 6.65
Hole Depth (ft) 24.22
Charge Length (ft) 19.95
Hole Diameter (in) 5
Charge Weight (lb/hole) 135.66
Powder Factor (t/lb) 7.28
Row Delay (ms) 74
Column Delay (ms) 66
Holes per Shot 81
Explosive per Shot (lbs) 10,988.46
Table 9-II: Ash Ratios
Burden Ratio 25
Spacing Ratio 2.6
Hole length Ratio 2.55
Subdrilling Ratio 0.25
Collar Distance Ratio 0.7
Detonation will occur by an electronic initiation system. Electronic blasting caps capable
of initiating the explosive will be connected to a power source and circuit wiring. The delay
between each row will be 74 milliseconds. The delay between each column will be 66
milliseconds. These values already incorporate the distance between the holes. These delays
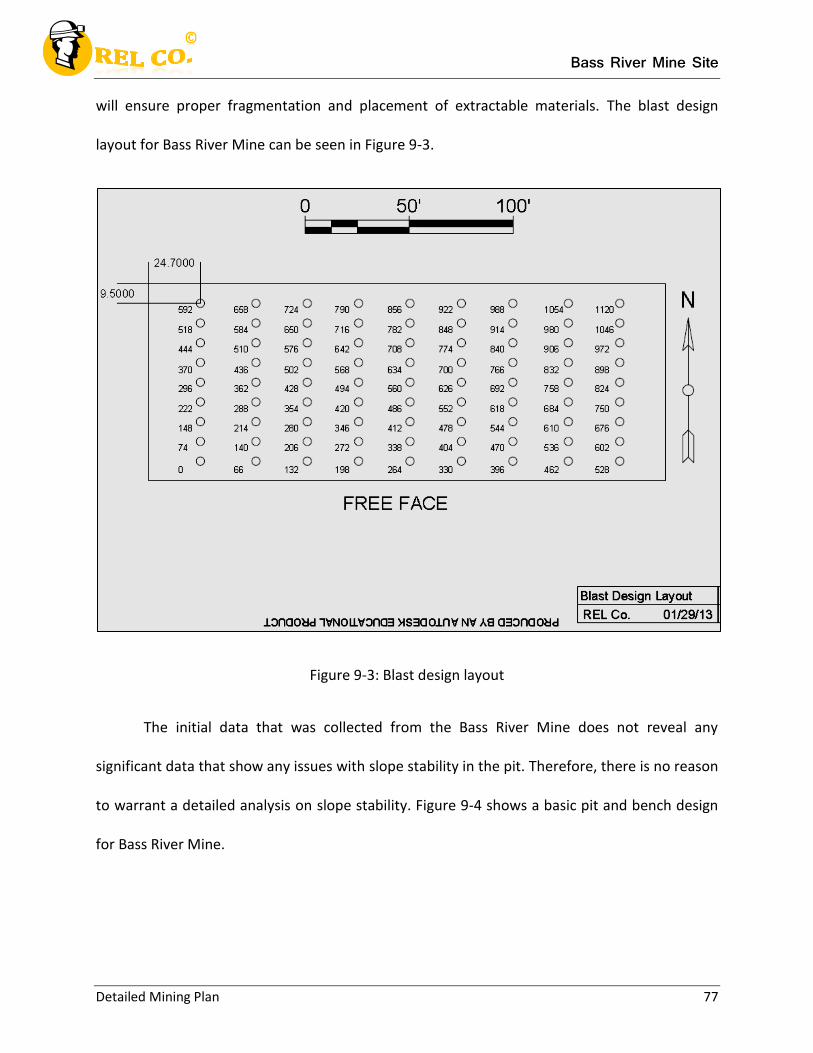
Bass River Mine Site
Detailed Mining Plan 77
will ensure proper fragmentation and placement of extractable materials. The blast design
layout for Bass River Mine can be seen in Figure 9-3.
Figure 9-3: Blast design layout
The initial data that was collected from the Bass River Mine does not reveal any
significant data that show any issues with slope stability in the pit. Therefore, there is no reason
to warrant a detailed analysis on slope stability. Figure 9-4 shows a basic pit and bench design
for Bass River Mine.
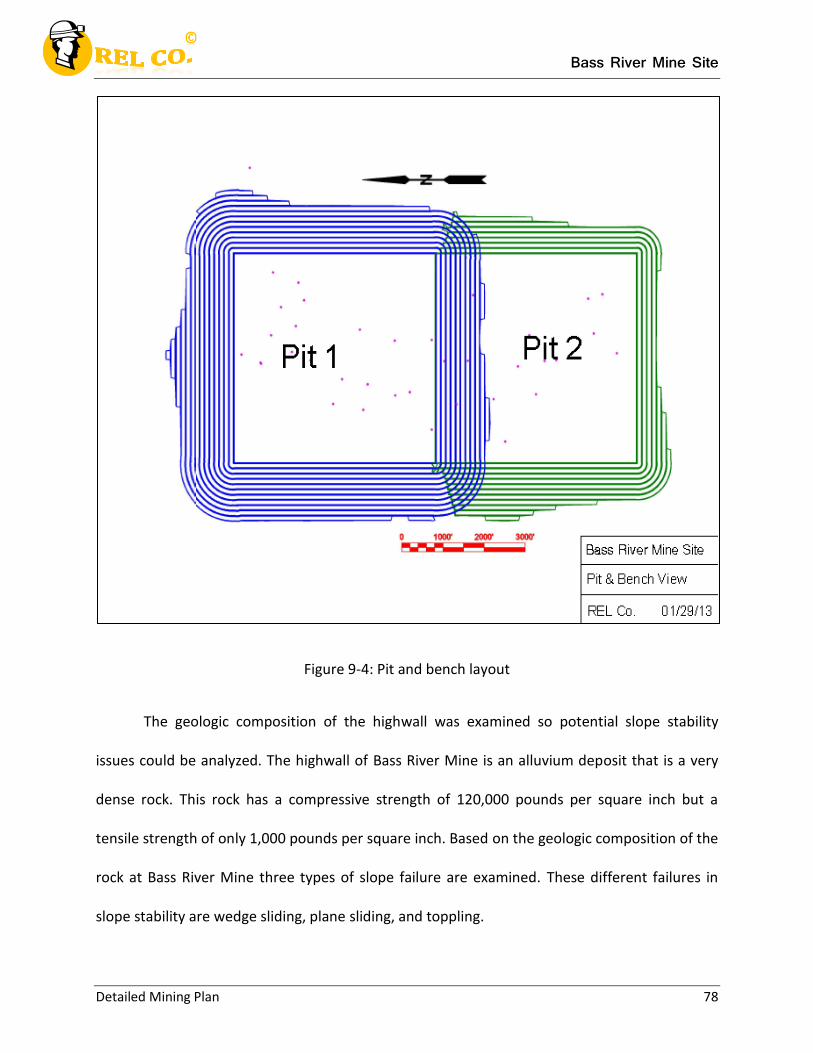
Bass River Mine Site
Detailed Mining Plan 78
Figure 9-4: Pit and bench layout
The geologic composition of the highwall was examined so potential slope stability
issues could be analyzed. The highwall of Bass River Mine is an alluvium deposit that is a very
dense rock. This rock has a compressive strength of 120,000 pounds per square inch but a
tensile strength of only 1,000 pounds per square inch. Based on the geologic composition of the
rock at Bass River Mine three types of slope failure are examined. These different failures in
slope stability are wedge sliding, plane sliding, and toppling.
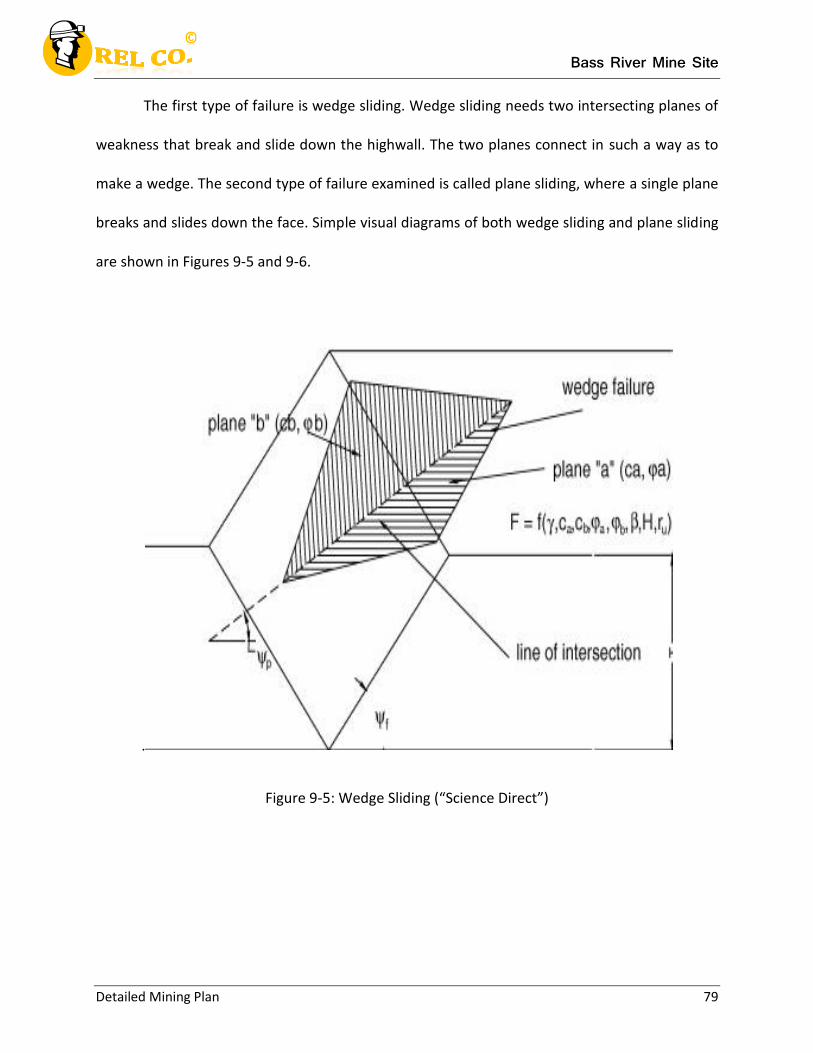
Bass River Mine Site
Detailed Mining Plan 79
The first type of failure is wedge sliding. Wedge sliding needs two intersecting planes of
weakness that break and slide down the highwall. The two planes connect in such a way as to
make a wedge. The second type of failure examined is called plane sliding, where a single plane
breaks and slides down the face. Simple visual diagrams of both wedge sliding and plane sliding
are shown in Figures 9-5 and 9-6.
.
Figure 9-5: Wedge Sliding (“Science Direct”)
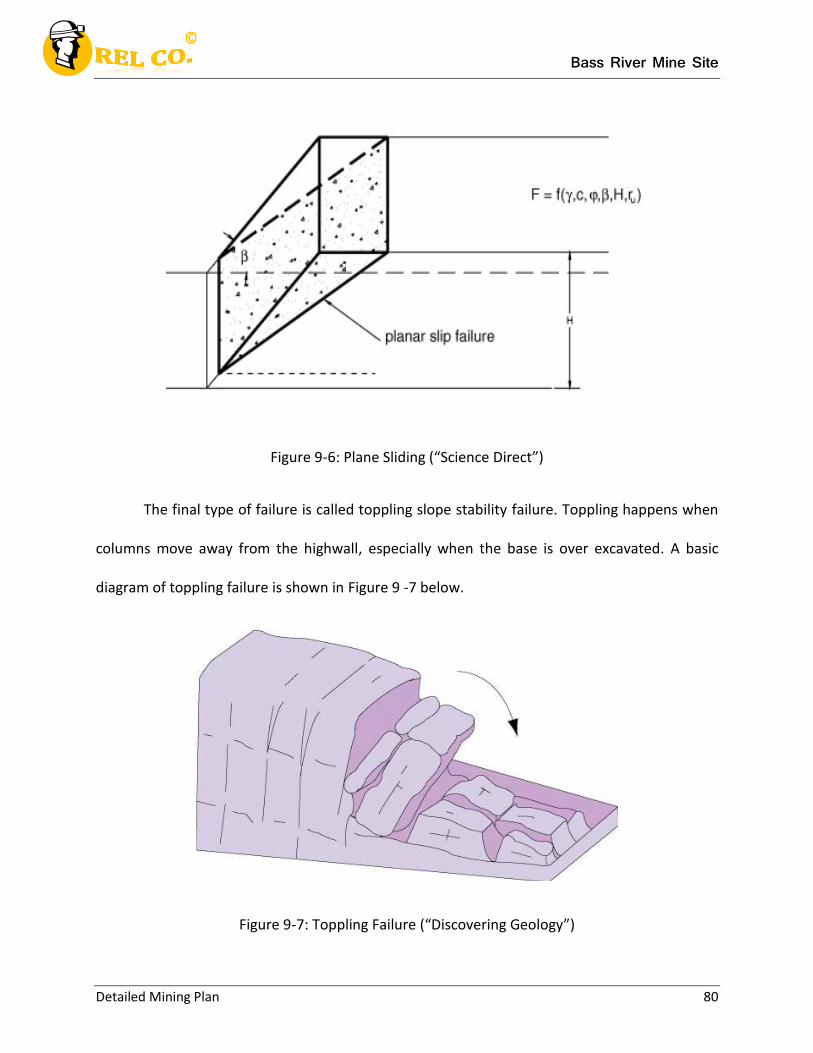
Bass River Mine Site
Detailed Mining Plan 80
Figure 9-6: Plane Sliding (“Science Direct”)
The final type of failure is called toppling slope stability failure. Toppling happens when
columns move away from the highwall, especially when the base is over excavated. A basic
diagram of toppling failure is shown in Figure 9 -7 below.
Figure 9-7: Toppling Failure (“Discovering Geology”)
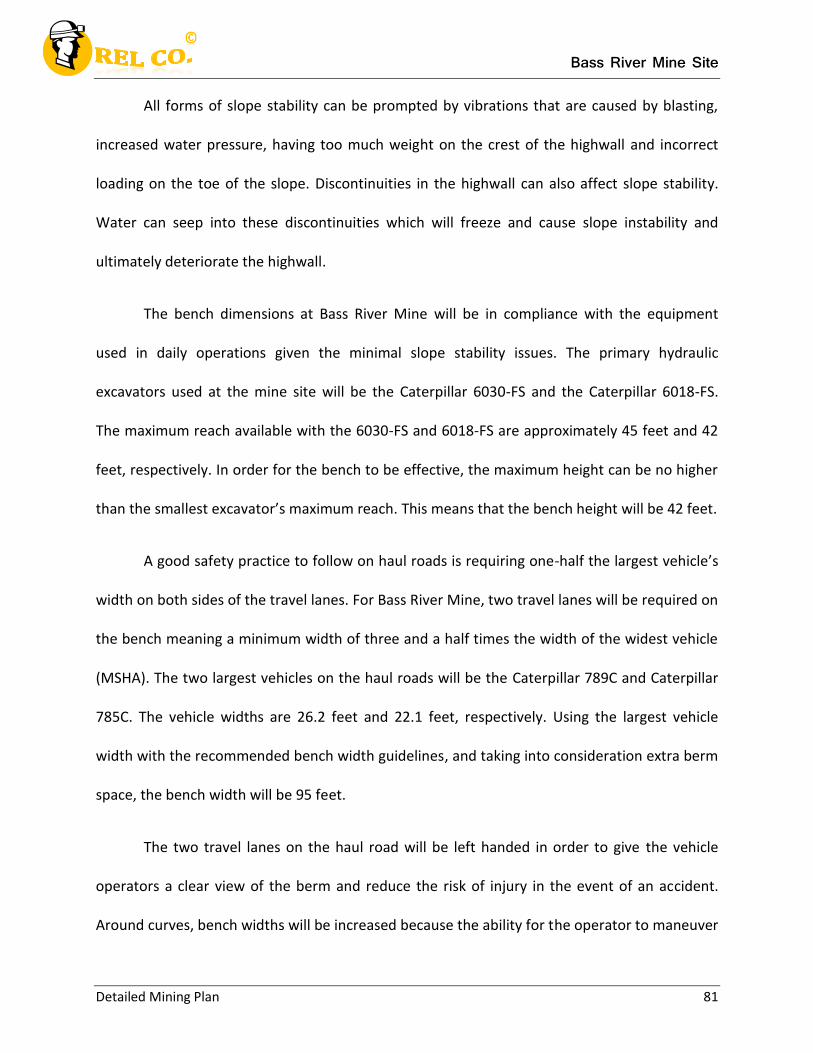
Bass River Mine Site
Detailed Mining Plan 81
All forms of slope stability can be prompted by vibrations that are caused by blasting,
increased water pressure, having too much weight on the crest of the highwall and incorrect
loading on the toe of the slope. Discontinuities in the highwall can also affect slope stability.
Water can seep into these discontinuities which will freeze and cause slope instability and
ultimately deteriorate the highwall.
The bench dimensions at Bass River Mine will be in compliance with the equipment
used in daily operations given the minimal slope stability issues. The primary hydraulic
excavators used at the mine site will be the Caterpillar 6030-FS and the Caterpillar 6018-FS.
The maximum reach available with the 6030-FS and 6018-FS are approximately 45 feet and 42
feet, respectively. In order for the bench to be effective, the maximum height can be no higher
than the smallest excavator’s maximum reach. This means that the bench height will be 42 feet.
A good safety practice to follow on haul roads is requiring one-half the largest vehicle’s
width on both sides of the travel lanes. For Bass River Mine, two travel lanes will be required on
the bench meaning a minimum width of three and a half times the width of the widest vehicle
(MSHA). The two largest vehicles on the haul roads will be the Caterpillar 789C and Caterpillar
785C. The vehicle widths are 26.2 feet and 22.1 feet, respectively. Using the largest vehicle
width with the recommended bench width guidelines, and taking into consideration extra berm
space, the bench width will be 95 feet.
The two travel lanes on the haul road will be left handed in order to give the vehicle
operators a clear view of the berm and reduce the risk of injury in the event of an accident.
Around curves, bench widths will be increased because the ability for the operator to maneuver
Bass River Mine Site
Detailed Mining Plan 82
the vehicle is impaired. In order to prevent water problems, haul roads will be crowned. A
cross-slope of two percent will be utilized. Around curves, the bench will not be crowned.
Instead, it will be banked downwards 4% to promote drainage and prevent steering problems.
The grade of the haul roads will be no greater than 9% to prevent stop/start concerns and
ensure vehicle fuel efficiency. Water runoff from crowned and banked roads will flow into
roadside ditches. These ditches will ultimately flow to a sedimentation pond. Timeline photos
for Pit 1 and Pit 2 showing progression in terms of benches can found in Figures I-1, I-2, I-3 and
I-4 of Appendix I.
The detailed extraction schedule for the Bass River Mine has been created to ensure the
mine reaches its goal of 41,000,000 tons of rock per year. The large amount of overburden
removed will be placed in overburden storage areas. The overburden storage area will be in
the northwest sector of the mine behind the pit. The location of the storage area will provide
quick and easy access from the pit to the overburden disposal area. The area will be capable of
holding millions of tons of overburden. The removal of overburden will begin at the end of the
sixth year of development so that production can begin in the seventh year.
The extraction goal of 41,000,000 tons will most likely not be met until Year 3 because
of continued development of the pit until the end of Year 2. The top soil removal and the
overburden stripping will commence at the end of Year 2. The pit will be fully developed by
Year 9 of the project and the primary pit will be in full operation. After this point, extra
overburden and waste rock will be removed with the purpose of expanding the pit to maintain
production rates. The pit schedule can be modified to adjust to the fluctuating market. If the
Bass River Mine Site
Detailed Mining Plan 83
41,000,000 tons of ore are not being sold then production will be decreased to meet the
demands of the market.
The development of the mine will be completed by Year 7 and overburden removal and
extraction of targeted ore will commence in Year 9. In Year 33 of the mine, the primary pit will
be expanded to maintain the amount of ore needed to be removed from the mine. The second
and last pit expansion will last the mine for the rest of the 50 year mine life. The development
of the pit will be close to the processing plant to reduce haulage costs and increase efficiency of
production.
9.4 Closure
The closure of a mine is an extremely important aspect of mine design and requires
detailed planning. In the case of Bass River Mine, the necessary environmental permits will be
acquired before the extraction phase. Closure at the mine site will start with scaled production
and proceed into Year 50 of the mine site. Closure will take a total of 2 years and will
commence with the decommissioning of the CAT 3018-FS in January of 2064 and CAT 3060-FS
April of 2064. The in-pit conveyor will be decommissioned and the explosive magazine will be
deconstructed in April, 2064. The deconstruction of surface facilities will include breaking down
the bath house, ware house, garages and maintenance and the auxiliary shops and the storage
lot and will commence in January, 2065.
The pit closure activities and the waste management will commence in January, 2065.
The environmental and reclamation activities related to closure will start in January, 2065 and
will conclude by December. These activities include covering the mine area with topsoil, re-
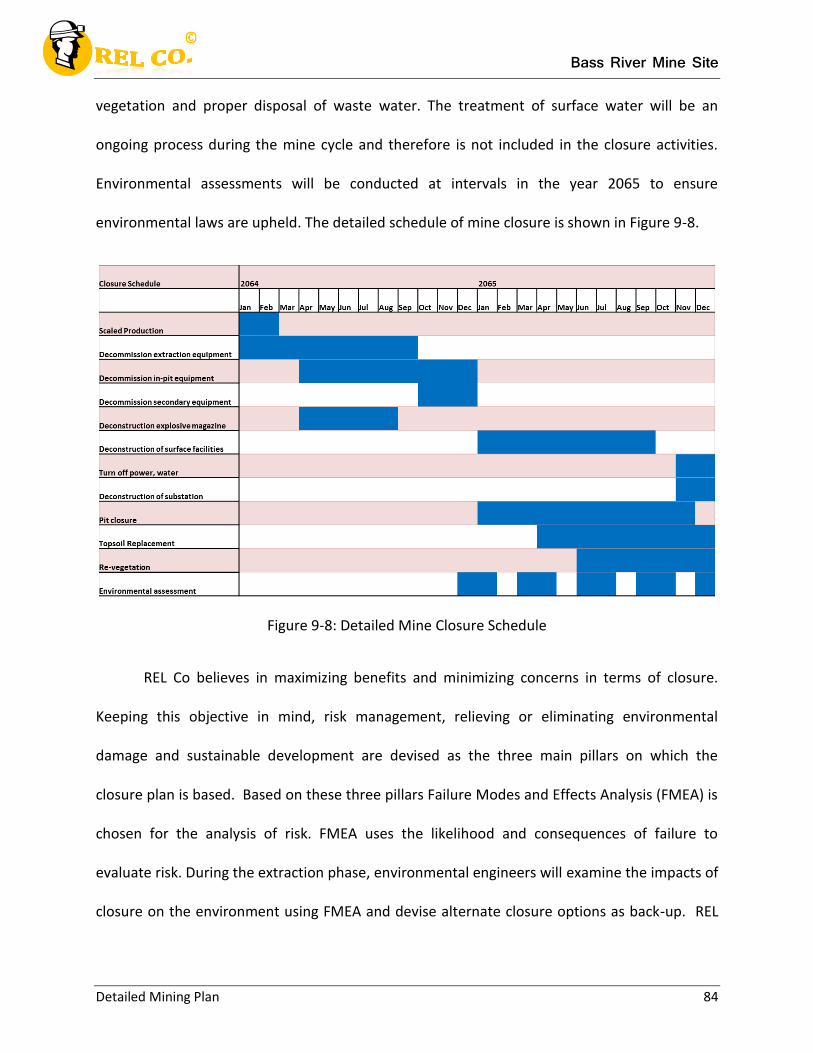
Bass River Mine Site
Detailed Mining Plan 84
vegetation and proper disposal of waste water. The treatment of surface water will be an
ongoing process during the mine cycle and therefore is not included in the closure activities.
Environmental assessments will be conducted at intervals in the year 2065 to ensure
environmental laws are upheld. The detailed schedule of mine closure is shown in Figure 9-8.
Figure 9-8: Detailed Mine Closure Schedule
REL Co believes in maximizing benefits and minimizing concerns in terms of closure.
Keeping this objective in mind, risk management, relieving or eliminating environmental
damage and sustainable development are devised as the three main pillars on which the
closure plan is based. Based on these three pillars Failure Modes and Effects Analysis (FMEA) is
chosen for the analysis of risk. FMEA uses the likelihood and consequences of failure to
evaluate risk. During the extraction phase, environmental engineers will examine the impacts of
closure on the environment using FMEA and devise alternate closure options as back-up. REL
Bass River Mine Site
Detailed Mining Plan 85
Co will take any steps necessary to minimize or eliminate environmental damage during
closure.
The three closure milestones are the decommissioning of the equipment, deconstruction of
the surface facilities and reclamation of the mined area as well as the surrounding area. These
milestones will occur in Year 49 and Year 50 of the mine cycle. The transfer of employees to
another mine facility is another REL Co priority during the closure phase. All employees are
guaranteed a position with the company after the mine closes.
An alternative to this plan is to start decommissioning and deconstruction during Year 49
and perform the environmental and reclamation activities during Year 50. However, this option
does not save any time. Deconstruction and decommissioning can be a tedious process and
they require more labor compared to with the environmental and reclamation aspects of
closure. Hence, decommissioning and deconstruction are spaced over a period of 2 years.

Bass River Mine Site
Processing Facilities 86
REL Company
Chapter 10
Bass River Mine Project: Processing Facilities
Bass River Mine Site
Processing Facilities 87
10.1 Site Description
Mineral processing is the method of separating valuable and saleable minerals from the
overburden and gangue, which is done at the processing facility. At Bass River Mine, the
processing facilities will be built close to the pit. The processing facilities will be built on the
southern end of the pit so that they can easily connect to the road system. In doing so,
transportation can be streamlined to the ore and equipment storage can be simplified. The
processing facility is will be constructed between the pit and the surface facilities to provide
ease of access and reduce haulage costs. The topography of the area will not have much effect
on the construction of the processing facilities because the mine has been designed in a
relatively flat area so large changes in elevation will not have to be considered.
A stock pile will be created near the primary crusher to make sure a constant flow is
maintained throughout the plant. The plant will contain custom made crushers, and feed into
one final stock pile, that will produce 10,000 tons an hour. Custom made crushers were decided
on because of the lack of standard crushers to meet the production requirement for Bass River
Mine. Processes in the plant will maintain the grade and quality of ore. The Bass River Mine
management will be sure that removed ore meets standards while maintaining production.
Bass River Mine Site
Processing Facilities 88
10.2 Beneficiation Studies
There are several ways to process the magnesium iron ore found at Bass River Mine.
Beneficiation will include chemical, magnetic separation and electrolytic processes. At Bass
River Mine, a dry magnetic separation process will be used to separate magnesium and iron.
The material from the pit will initially be transported with a maximum size of 24 inches. After
being fractured to less than 1 inch with jaw and cone crushers, the ore will undergo a magnetic
separation process. The iron present in the form of ferromagnetic particles will be separated
from the rest of the magnesium rich ore.
The ore will then undergo a chemical beneficiation process at a different facility using
hydrochloric acid, where the magnesia is dissolved in the hydrochloric acid and the insoluble
impurities are removed. The magnesia from magnesium chloride is then disassociated to form
magnesia using thermal reduction. Thermal reduction of magnesium chloride salt produces
chlorine gas which then passes through a scrubber system. The resulting cathode scrubber
liquid will then be discharged into the surface impoundment (EPA). The EPA does not identify
cathode scrubber liquid as a hazardous waste material and existing data backs this claim. The
chemical process will be done at a different facility because the cost of further fracturing is too
great for REL Co. Sizes much smaller than the 1 inch are required for the chemical process.
In order to support the proper amount of tonnage, computer software was used to
select the correct equipment for the processing operation. Aggflow, Bedrock’s plant simulation
software, was used in equipment selection and overall design. The Bass River Mine operation is
designed for 10,000 tons per hour. In order to size the material, two types of crushers will be
Bass River Mine Site
Processing Facilities 89
used. The custom built jaw crusher has a 150 HP capacity and will be used to fracture 285 tons
per hour of incoming rock. Raw material with sizes up to 24 inches is crushed to a size no larger
than 5 inches. Power usage by each of the units is approximately 660 kW. The secondary
crushing unit on site, with 4 units, is custom built. These units are used to further fracture the
material coming from the original screening unit and jaw crushers at a rate of 390 and 461 tons
per hour, respectively. Material with sizes from 5 inches to .625 inch is crushed to a size no
larger than 1 inch. Power usage by each of these units is 930 kW.
Two different types of screens are used to size material prior to and post crushing. The
primary screen to sort the raw material is a two-deck inclined unit. All material larger than 5.5
inches is separated by bars and continues to the primary jaw crushers. Material smaller than
5.5 inches but larger than .625 inch is separated by a screen and sent to secondary crushing.
Any undersized material to make it through both decks is already sized small enough and sent
to the stockpile to prevent entering the crushers. The five primary screens each process 2000
tons per hour. The secondary screen, located after the primary crushing units, is a one deck
inclined unit, where each deck is sized at .625 inch. Any material larger than .625 inch is sent to
secondary crushing units. Material that makes it through the screen is sent to the stockpile.
The five secondary screens each process 1140 tons per hour.
The remaining equipment used at the processing facility are stream splitters. These
units are used to separate the flow of material into two streams of 50%. Splitters following deck
one of the primary screen separate 1140 tons per hour into four 285 tons per hour streams.
Splitters following deck two of the primary screen separate 780 tons per hour into two 390 tons
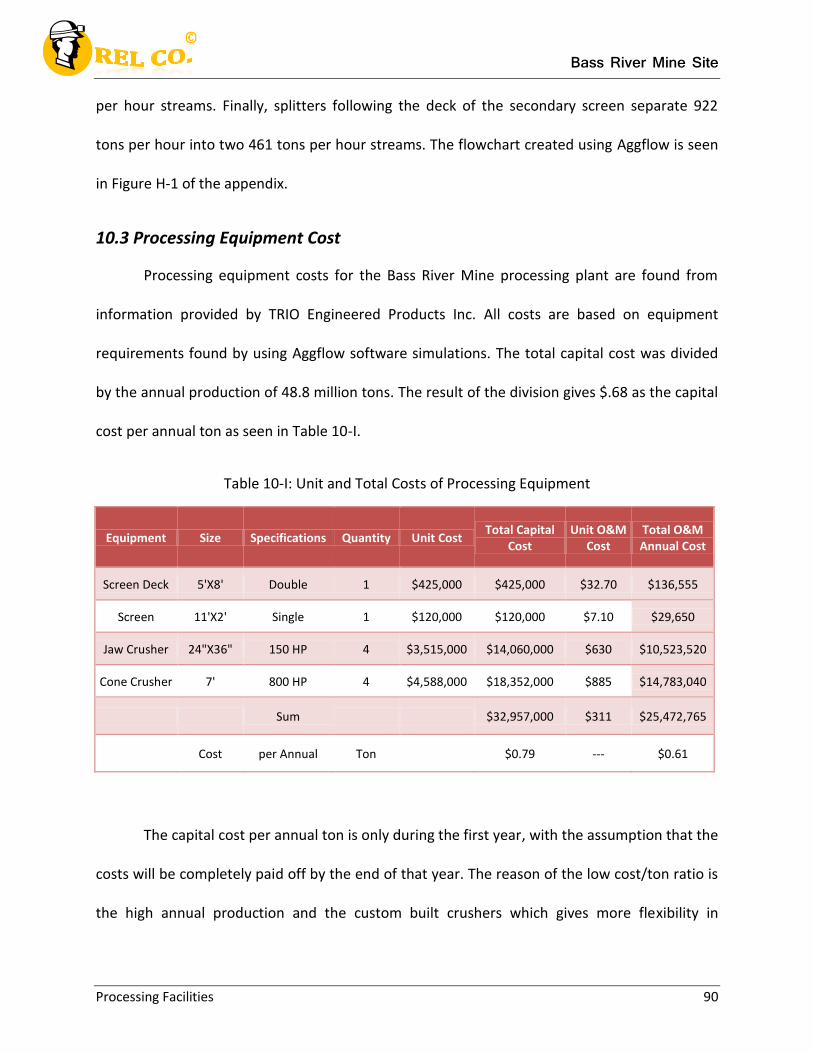
Bass River Mine Site
Processing Facilities 90
per hour streams. Finally, splitters following the deck of the secondary screen separate 922
tons per hour into two 461 tons per hour streams. The flowchart created using Aggflow is seen
in Figure H-1 of the appendix.
10.3 Processing Equipment Cost
Processing equipment costs for the Bass River Mine processing plant are found from
information provided by TRIO Engineered Products Inc. All costs are based on equipment
requirements found by using Aggflow software simulations. The total capital cost was divided
by the annual production of 48.8 million tons. The result of the division gives $.68 as the capital
cost per annual ton as seen in Table 10-I.
Table 10-I: Unit and Total Costs of Processing Equipment
Equipment Size Specifications Quantity Unit Cost Total Capital
Cost Unit O&M
Cost Total O&M Annual Cost
Screen Deck 5'X8' Double 1 $425,000 $425,000 $32.70 $136,555
Screen 11'X2' Single 1 $120,000 $120,000 $7.10 $29,650
Jaw Crusher 24"X36" 150 HP 4 $3,515,000 $14,060,000 $630 $10,523,520
Cone Crusher 7' 800 HP 4 $4,588,000 $18,352,000 $885 $14,783,040
Sum $32,957,000 $311 $25,472,765
Cost per Annual Ton $0.79 --- $0.61
The capital cost per annual ton is only during the first year, with the assumption that the
costs will be completely paid off by the end of that year. The reason of the low cost/ton ratio is
the high annual production and the custom built crushers which gives more flexibility in
Bass River Mine Site
Processing Facilities 91
dimension of equipment. The unit operation and maintenance cost were multiplied by the
number of hours the equipment would run during a year. The sum of the operation and
maintenance costs was divided by the total annual production of 48.8 million tons. The
resulting operation and maintenance cost is $.61 per ton of processes ore and capital cost is
$0.79/ton.

Bass River Mine Site
Materials Handling 92
REL Company
Chapter 11
Bass River Mine Project: Materials Handling
Bass River Mine Site
Materials Handling 93
11.1 Description
In order to have a successful operation, a detailed description of the materials handling
process and the store of all products after processing is required. Examples of such material
would be tailings, concentrate, ore and waste material. The cost for the design and the
construction of the different processing systems are also required for a mining operation. The
processing plant has the capacity for handling 42 million tons of material a year. Of the 42
million tons, 7.1 million tons of iron ore will be produced a year.
11.2 Layout
When working on a mine design, primary consideration is placed on how materials will
be handled during processing. The ore has to be monitored as it changes sizes; the different
equipment inside the plant has to be monitored to make sure it is preforming at peak
efficiency; and the equipment outside the plant has to be designed to meet production.
In the beginning of the process, ore is hauled from the pit to the processing plant on
trucks. Figure 11-1 shows that the plant is on the southeast side of pit number one. The pit will
be built in this spot so that as the pit is expanded, hauling distance for the trucks does not
dramatically increase. Once the material goes through the primary crusher it will be moved to
different stock piles and secondary crushers on conveyor belts. It will also be moved to the
separate stock piles and tailing piles via conveyor belts. Once the material has been completely
processed, a combination of front end loaders and conveyor belts will move the material. These
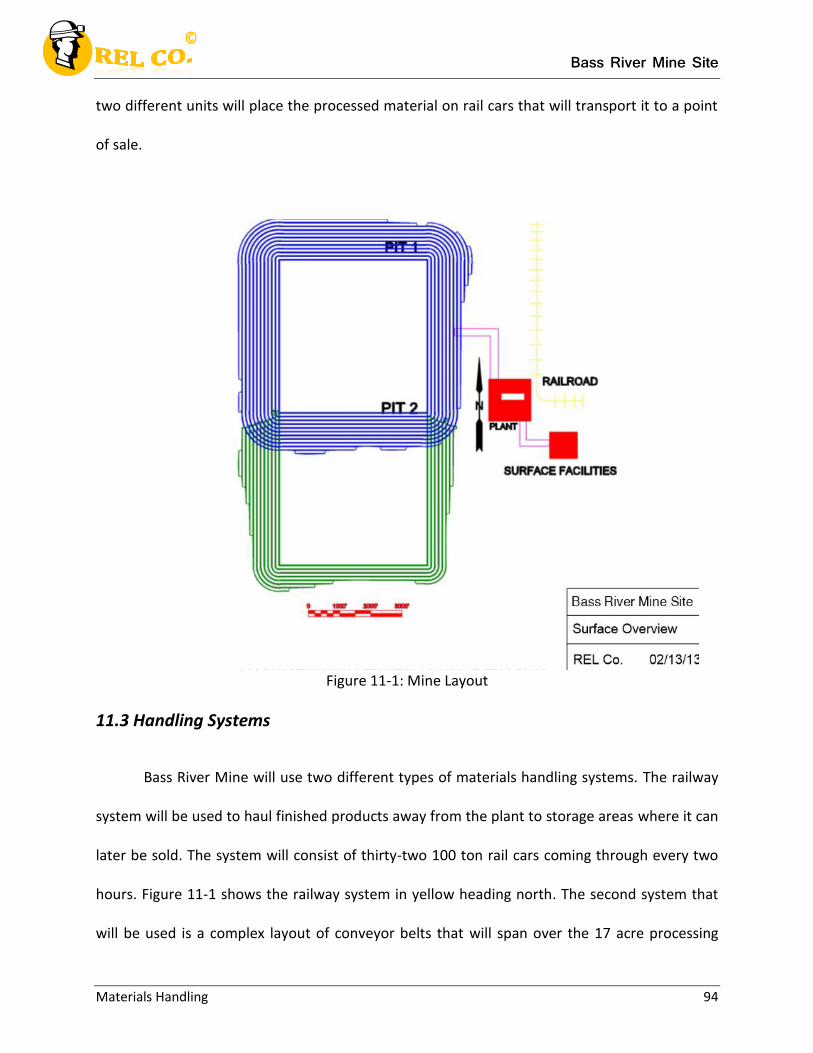
Bass River Mine Site
Materials Handling 94
two different units will place the processed material on rail cars that will transport it to a point
of sale.
Figure 11-1: Mine Layout
11.3 Handling Systems
Bass River Mine will use two different types of materials handling systems. The railway
system will be used to haul finished products away from the plant to storage areas where it can
later be sold. The system will consist of thirty-two 100 ton rail cars coming through every two
hours. Figure 11-1 shows the railway system in yellow heading north. The second system that
will be used is a complex layout of conveyor belts that will span over the 17 acre processing
Bass River Mine Site
Materials Handling 95
facility. The conveyor belt system layout can be seen in Figure K-1 of the appendix. Sizing of the
crushing and separating equipment are not to scale. Conveyor length and width are to scale and
positioned correctly.
11.4 Storage
For production demands to be met, multiple stockpiles will be needed. They include one
for primary crusher feed, two for secondary crusher feed, one for primary crusher product, four
for magnetic separator feed, one for separated iron and one for waste. The plant feed
stockpiles will be located close to the screen decks, while the magnetic separator feed
stockpiles will be located between the crushers and the magnetic separators. The waste
stockpile will be located at the back of the processing plant. The primary crusher feed stockpile
is designed to hold 80,000 tons of ore. This stockpile will be 40,000 square feet with an
ultimate height of 45 feet. The primary crusher product stockpile is to hold 50,000 tons and
have an area of 25,000 square feet. The magnetic separator feed stockpiles are designed to be
half the size of a primary crusher feed stockpile. The separated iron stockpile is designed to
hold 30,000 tons of product and be 15,000 square feet with a max height of 20 feet.
The secondary crusher feed piles are to hold 50,000 tons and have an area of 25,000
square feet. The waste stockpile is designed to hold 65,000 tons and have an area of 33,000
square feet with a max height of 38 feet. Figure K-1 shows the pile location and usage. All the
stockpiles were designed to hold enough ore to compensate for non-working days. Since there
are two shovels always working and one backup, the stockpiles are designed well above what is
needed. All stockpiles except the waste stockpiles will be located under roofed structures with
Bass River Mine Site
Materials Handling 96
a small concrete wall around to keep water out. With the structures for the ore, there will be no
contamination of water. The waste stockpiles will have less iron than the ground the water
usually flows through, so these stockpiles don’t require any cover. The rock from the waste
stockpiles will be transported by conveyor to large dump piles. The dump piles will have a total
area of 200 acres with a max height of 50 feet, providing piles large enough for one year of
production before the backfill begins.
Product will be shipped from the property on a daily basis. Due to the large amount of
product and the proximity of the railway, railway cars was selected as the most cost efficient
method to transport the product. The Tuckerton Railway is located five miles away, so a
connecting rail line will need to be added. The main station of this railway, located in
Tuckerton, is only seven miles away, so the product can be sent anywhere desired. The rail line
construction will be contracted out at approximately $14,000 per miles for a total cost of
$70,000. Two 1,700 ton loadout bins will be used to fill thirty-two 100 ton freight cars every
two hours. The loadout bins will be fed from the product stockpiles at the rate of 850 tons per
hour. Each bin will cost approximately $800,000 each.
11.5 Equipment Specifications
A conveyor is one of the most effective ways to move dry material from point to point.
Conveyors also have economic benefits when it comes to distances less than one mile. Barring
the high initial capital costs of installation, operation and maintenance costs are relatively low.
A conveyor system will be constructed at Bass River Mine to transport run-of-mine to the
processing facility and transport waste rock and ore within the processing facility.
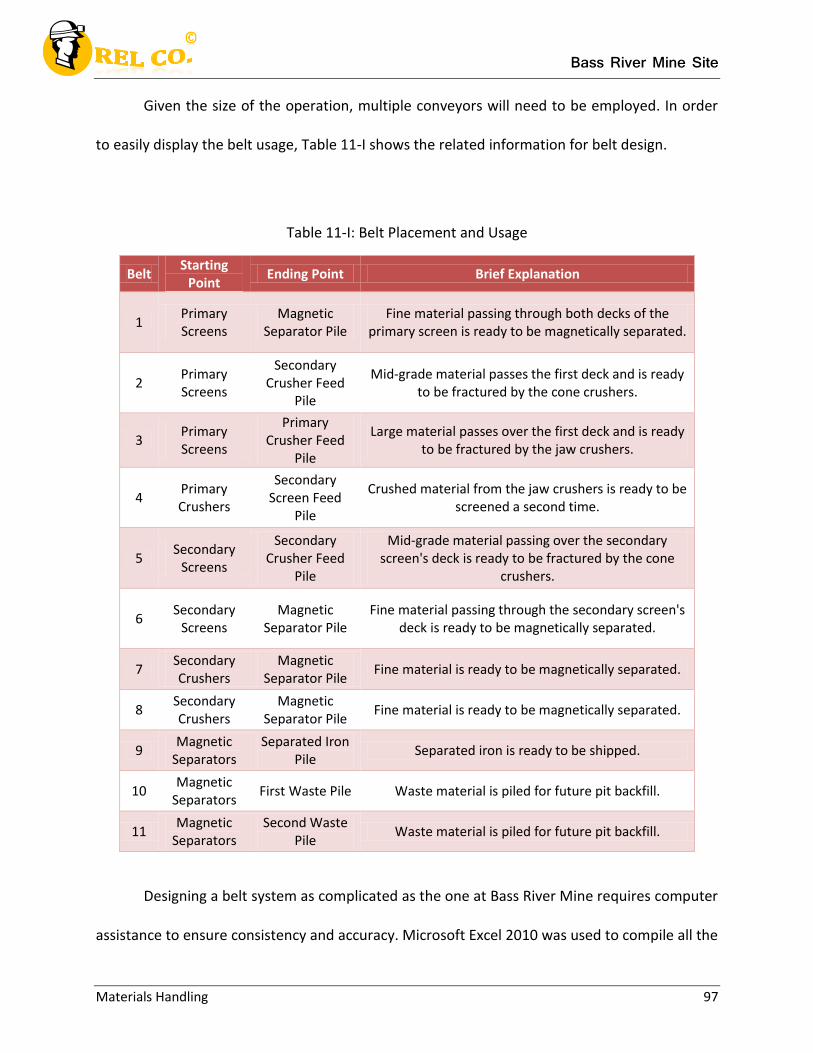
Bass River Mine Site
Materials Handling 97
Given the size of the operation, multiple conveyors will need to be employed. In order
to easily display the belt usage, Table 11-I shows the related information for belt design.
Table 11-I: Belt Placement and Usage
Belt Starting
Point Ending Point Brief Explanation
1 Primary Screens
Magnetic Separator Pile
Fine material passing through both decks of the primary screen is ready to be magnetically separated.
2 Primary Screens
Secondary Crusher Feed
Pile
Mid-grade material passes the first deck and is ready to be fractured by the cone crushers.
3 Primary Screens
Primary Crusher Feed
Pile
Large material passes over the first deck and is ready to be fractured by the jaw crushers.
4 Primary Crushers
Secondary Screen Feed
Pile
Crushed material from the jaw crushers is ready to be screened a second time.
5 Secondary
Screens
Secondary Crusher Feed
Pile
Mid-grade material passing over the secondary screen's deck is ready to be fractured by the cone
crushers.
6 Secondary
Screens Magnetic
Separator Pile Fine material passing through the secondary screen's
deck is ready to be magnetically separated.
7 Secondary Crushers
Magnetic Separator Pile
Fine material is ready to be magnetically separated.
8 Secondary Crushers
Magnetic Separator Pile
Fine material is ready to be magnetically separated.
9 Magnetic
Separators Separated Iron
Pile Separated iron is ready to be shipped.
10 Magnetic
Separators First Waste Pile Waste material is piled for future pit backfill.
11 Magnetic
Separators Second Waste
Pile Waste material is piled for future pit backfill.
Designing a belt system as complicated as the one at Bass River Mine requires computer
assistance to ensure consistency and accuracy. Microsoft Excel 2010 was used to compile all the
Bass River Mine Site
Materials Handling 98
information and execute the calculations. On the spreadsheet, all the calculated values are
colored black, while the variable inputs are colored in red. Some notable variables include belt
width, belt speed, idler spacing, length of belt, ore density and friction coefficients. The excel
file also has the belts split into sections in order to correctly calculate the required power for
each run. Operation costs are available based on an electricity cost of $.07 per kW-hr. A
complete account of the belt calculations can be seen in Tables K-I through K-VI in the
appendix.
In addition to the original calculations and assumptions for the conveyor belt system,
another option was considered. The second option taken was to increase the speed of the belt
while decreasing the overall width. The only drawback is that the maximum belt speed is 800
feet per minute so there is not much room for increase. The belt sizes are also at the high end
of possible use. Based on the results, decreasing the belt size and increasing the belt speed has
a higher operating cost. This is because belt sizes come in certain intervals and the jumps
between these sizes cause an issue.
11.6 Material Handling Costs
The annual operating cost for the design belt systems were calculated using electricity
costs of .07 kW-hr and 4,176 hours of operation. Table 11-II details this cost for each belt. The
estimated capital costs for the conveyor belt are shown in Table 11-III. The table includes the
cost for the belt drive, the belt drive components and the head and tail assemblies.
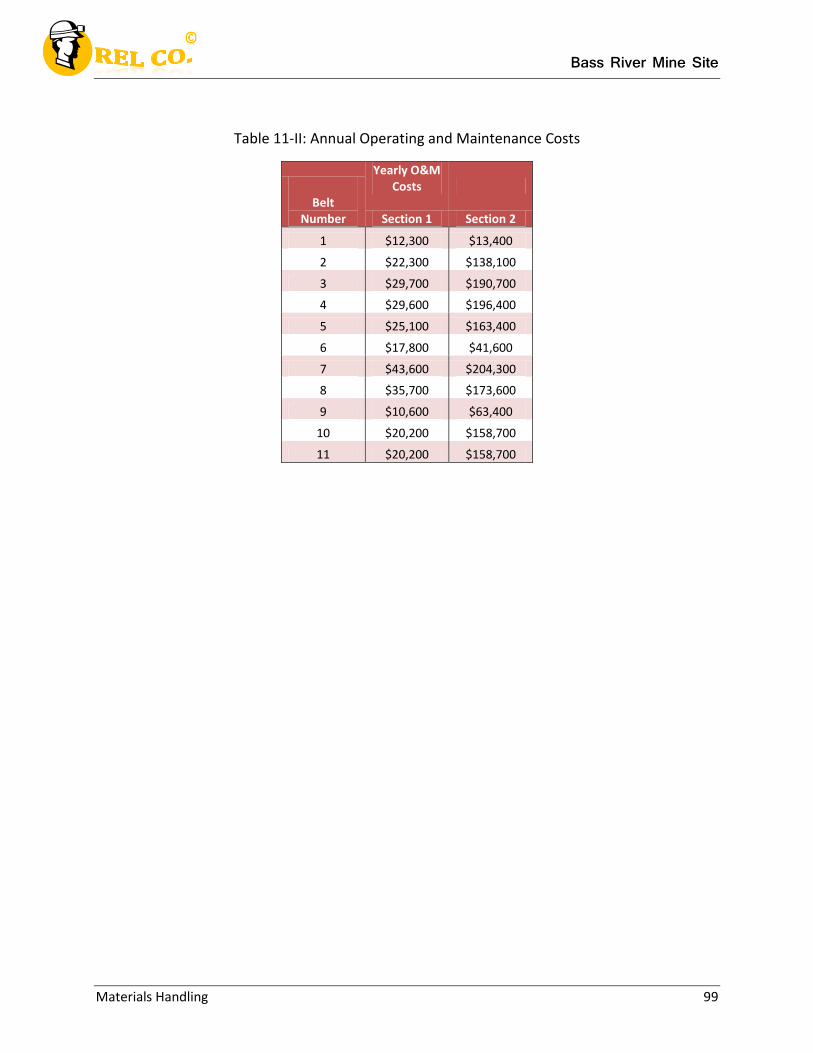
Bass River Mine Site
Materials Handling 99
Table 11-II: Annual Operating and Maintenance Costs
Yearly O&M
Costs Belt
Number Section 1 Section 2
1 $12,300 $13,400
2 $22,300 $138,100
3 $29,700 $190,700
4 $29,600 $196,400
5 $25,100 $163,400
6 $17,800 $41,600
7 $43,600 $204,300
8 $35,700 $173,600
9 $10,600 $63,400
10 $20,200 $158,700
11 $20,200 $158,700
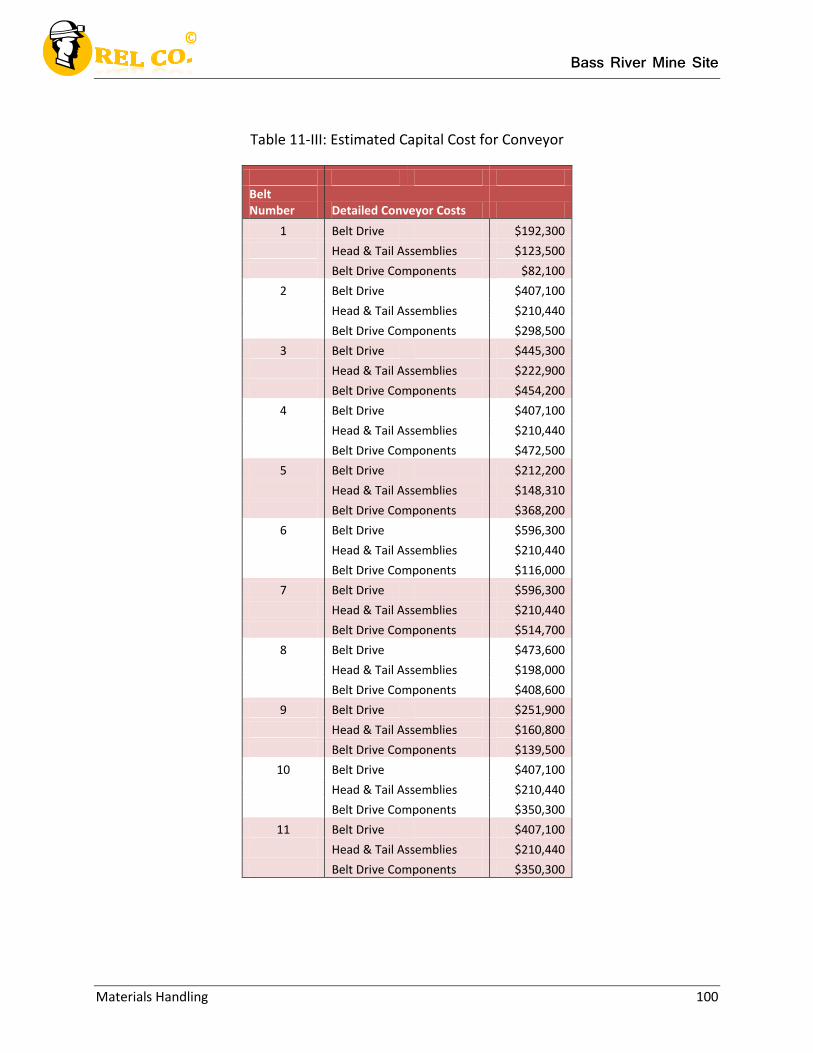
Bass River Mine Site
Materials Handling 100
Table 11-III: Estimated Capital Cost for Conveyor
Belt Number Detailed Conveyor Costs
1 Belt Drive $192,300
Head & Tail Assemblies $123,500
Belt Drive Components $82,100
2 Belt Drive $407,100
Head & Tail Assemblies $210,440
Belt Drive Components $298,500
3 Belt Drive $445,300
Head & Tail Assemblies $222,900
Belt Drive Components $454,200
4 Belt Drive $407,100
Head & Tail Assemblies $210,440
Belt Drive Components $472,500
5 Belt Drive $212,200
Head & Tail Assemblies $148,310
Belt Drive Components $368,200
6 Belt Drive $596,300
Head & Tail Assemblies $210,440
Belt Drive Components $116,000
7 Belt Drive $596,300
Head & Tail Assemblies $210,440
Belt Drive Components $514,700
8 Belt Drive $473,600
Head & Tail Assemblies $198,000
Belt Drive Components $408,600
9 Belt Drive $251,900
Head & Tail Assemblies $160,800
Belt Drive Components $139,500
10 Belt Drive $407,100
Head & Tail Assemblies $210,440
Belt Drive Components $350,300
11 Belt Drive $407,100
Head & Tail Assemblies $210,440
Belt Drive Components $350,300
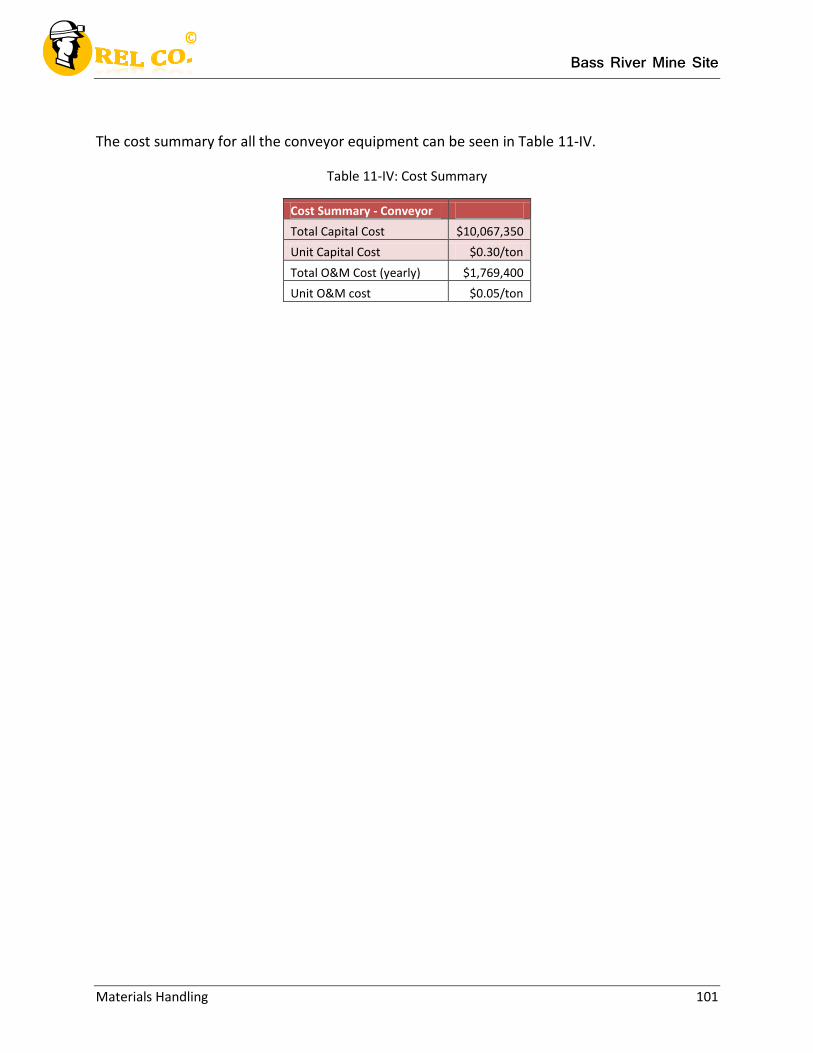
Bass River Mine Site
Materials Handling 101
The cost summary for all the conveyor equipment can be seen in Table 11-IV.
Table 11-IV: Cost Summary
Cost Summary - Conveyor
Total Capital Cost $10,067,350
Unit Capital Cost $0.30/ton
Total O&M Cost (yearly) $1,769,400
Unit O&M cost $0.05/ton

Bass River Mine Site
Personnel Requirements 102
REL Company
Chapter 12
Bass River Mine Project: Personnel Requirements
Bass River Mine Site
Personnel Requirements 103
12.1 Staffing Plan
Bass River Mine will be looking to hire individuals who are driven and innovative in the
field of mining. The company will not discriminate when hiring based on gender, age or
ethnicity. The company will not allow or support employees who are found to have a drug or
alcohol problem. For this reason the mine will be both an alcohol and drug free area with a zero
tolerance policy. All the personnel offices will be housed in the main office building near the
entrance to the mine. This will help all parts of the mine to communicate easily and if members
are away from the office we will use a radio communication system so that personnel will
always be in contact. The mine offices will be broken up into four major divisions which consist
of management, production, engineering and processing. Also, there will be a personal office
for the mine manager, the superintendent, the senior engineer, the human resources officer
and the health and safety officer.
12.2 Upper Management
It will be the job of the management to take care of all procedures that happen both on
and off the mine site. The mine manager will oversee everything pertaining to the mine
including the sale of the material off site. There will be a superintendent who will have the sole
job of taking care of the mining and processing that occurs on site. While the two positions will
have some overlaps, the mine manager will have the final say on what occurs at the mine.
The mine manager will be particularly concerned with the business aspect of the
company. He/she will work closely with the marketing department to help with the sale of ore.
Bass River Mine Site
Personnel Requirements 104
Sale of ore will include developing relationships with buyers seeing as how the company will
most likely consistently sell to the same companies. In this sense, the mine manager will work
very much like a public relations officer to the community and to the buyers. The mine manager
will work closely with the health and safety department as well by relaying the regulations and
updates to workers as well as lower management. Finally, the mine manager will work in the
mining and processing department to make sure everything is being processed to state and
federal specifications.
The superintendent holds a significant position in the organization and operation of the
everyday mining. He will work very closely with the basic labor force that extracts and
processes the ore. The position of superintendent will help the health and safety department
and the mine manager to organize safety meetings. Other responsibilities include enforcing
rules and regulations laid down by the mine manager. The superintendent will cooperate with
the engineering department to develop the design and progression of the pit. Finally, the job
entails participating in the processing facilities to make sure that rules set by the mine manager
are flowed during the processing phase.
12.3 Mining Operations
Mining operations at Bass River Mine will always be overseen by a shift foreman. The
shift foreman will communicate with the mine superintendent to make sure the operation
continues on schedule. The shift foreman will organize the operations of all general workers
and coordinate with the sectional foremen. Sectional foremen will coordinate with all workers
Bass River Mine Site
Personnel Requirements 105
for their section, along with all standard section workers including shovel operators, haul truck
operators, water truck operators, maintenance crew, mechanics and electricians.
Shift foreman:
Work will require great communication and leadership skills as well as good
organization and time management. Shift foreman responsibilities will include all sectional
foremen responsibilities, and the responsibilities stated below. The shift foreman will be
required to perform included duties but will not be limited to:
Have open communication lines between the mine superintendent and section foremen
Coordinate the tasks of all general workers, electricians, mechanics, maintenance crew and all workers not under the supervision of a sectional foreman
Sectional Foreman:
Work will require good communication, leadership, organizational and time
management skills. Sectional foreman will be required to perform included duties but will not
be limited to:
Direct workers in production and safety
Inspect all work areas and equipment pre-shift
Maintain and distribute records of production, safety and violations
Know and achieve all mining regulatory standards and laws
Bass River Mine Site
Personnel Requirements 106
General Workers:
Work is physically challenging and will require team work to achieve production
standards. The general worker will be required to perform included duties but will not be
limited to:
Transport equipment from the surface facilities to the mining area
Maintain benches properly
Manage and handle supplies
Maintain all roadways
Inspect work areas and equipment pre-shift
Assist others including the foreman, electricians, shovel operators, mine operator and haul truck operators
Operate machinery including the front shovels, water trucks and haul trucks
Shovel Operator:
Work is physically challenging and will require team work to achieve production
standards. Shovel operator duties will include but not be limited to those of the general worker
and the responsibilities listed below:
Operation of a front shovel on benches
Operate the shovel in a safe and efficient manner at all times
Assist the mechanics and electricians with repairs made on the shovel and other equipment
Bass River Mine Site
Personnel Requirements 107
Haul Truck Operator:
Work is physically challenging and will require team work to achieve production
standards. Haul truck operator duties will include but not be limited to those of the general
worker and the responsibilities listed below:
Operate a haul truck on benches
Operate a haul truck in a safe and efficient manner at all times
Assist the mechanics and electricians with repairs made on the haul truck and other equipment
Electrician:
Work is physically challenging and will require good communication and leadership
skills. Electrician duties will include but not be limited to the responsibilities listed below:
Have open lines of communication between the shift foreman, sectional foremen and any others with electrical work
Coordinate and manage all electrical work for the property
Know and achieve all mining regulatory standards and laws
Maintain and distribute records of performance, safety and violations
Select and obtain electrical equipment for the surface facilities
Mechanic:
Work is physically challenging and will require good communication and leadership
skills. Mechanic duties will include but not be limited to the responsibilities list below:
Have open lines of communication between the shift foreman, section foremen and any others with mechanic work
Coordinate and manage all electrical work for the property
Select and obtain mechanical equipment for the surface facilities
Maintain and distribute records of performance, safety and violations
Know and achieve all mining regulatory standards and laws
Bass River Mine Site
Personnel Requirements 108
12.4 Processing Operations
Processing operations at Bass River Mine will be handled by the senior processing
engineer. The senior processing engineer will establish communication with the rest of the crew
working at the processing facility to ensure safe and efficient work conditions. Due to the huge
production capacity of Bass River Mine (10,000 tons/hour), junior processing engineers will be
hired. Apart from the engineers, a facility manager, plant electricians, maintenance personnel
and truck drivers will be hired. Shift foremen will be hired for the processing plant to supervise
the day to day activities. It is imperative that all the crew working at the processing facility is
properly trained to ensure safe conditions. The responsibilities of each of the processing
operation personnel are listed below:
Senior Processing Engineer:
Supervise all activities at the processing facility
Establish a good line of communication between the shift foreman and the production crew
Oversee all the production, maintenance, management and office positions
Coordinate with Junior Processing Engineer to ensure the daily production requirements for the processing facility are met
Junior Processing Engineer:
Report to the Senior Processing Engineer twice a day
Assume responsibilities of complete control of the processing facility when senior processing engineer is absent
Make sure shipping details are handled efficiently by the facility manager
Bass River Mine Site
Personnel Requirements 109
Facility Manager:
Reports to the junior processing engineer daily about the activities at the processing facility
In charge of preparing a maintenance and electrical report once a week for all the equipment at the facility
Ensure production requirements for the processing facility are met daily
Communicates with the shift foreman daily to resolve any management issues
In charge of the shipping details at Bass River Mine.
Works towards resolving any issues with shipment and makes sure shipment is carried out in an orderly fashion
Plant Foreman:
Establishes a good line of communication with the facility manager
In charge of all the personnel requirements at the facility including hiring additional crew and resolving any day to day issues
In charge of calling maintenance in case of an issue with the equipment
Plant Electrician:
Establish a good line of communication with the shift foreman
Inspect electrical equipment at the facility once a day
Prepare a weekly report to be handed in to the facility manager about the electrical state of the equipment present at the facility
Work with the maintenance personnel to resolve any electrical issues at the facility
Maintenance Personnel:
Work with the foreman on any maintenance at the plant
Inspect the equipment once a week if not sooner for maintenance
Establish communication with the electrician to work on equipment as a team
Bass River Mine Site
Personnel Requirements 110
12.5 Other Personnel
There are other personnel required at Bass River Mine. Personnel are required for the
administrative department and the security of the mine. Administrative personnel include the
mine engineer, environmental engineer, project engineer, surveyor, health and safety director,
human resource representative, accountant and secretary. The following are the other mine
personal for Bass River Mine along with their responsibilities.
Mine Engineer:
Administrative head of the mine after the president of the mine
Oversee all activities at the mine
Approve final reports for the operation and processing departments
Establish an establishment with all personnel at the mine and report to the president of the mine
Environmental Engineer:
In charge of permitting at the mine
Work with the environmental specialists to make sure all environmental activities are monitored regularly
In charge of all reclamation activities and sustainable development at the mine
Work with EPA and local environmental agencies to ensure all environmental laws are upheld
Hold sessions once every 3 months to update the mine personnel on current environmental laws and regulations.
Bass River Mine Site
Personnel Requirements 111
Environmental specialist:
Report to the environmental engineer
Responsible for tasks to ensure “above and beyond compliance” for every facet of environmental issues are met at the mine site
Prepare a weekly report of the environmental activities to be submitted to the environmental engineer
Health and Safety Director:
Handle all issues with health and safety at the mine site
Inspect and monitor the operation and processing departments to ensure safe working conditions are met
Report to the Mine Engineer once a week on all health and safety issues at the mine
In the case of an incident at the mine, health and safety director assumes command until the emergency is over
Report all incidents to MHSA and work with the MHSA inspector to make sure safe working environment is maintained
Project Engineer:
Handle all the papers and design with operations
Work with mine engineer for scheduling twice a week
Work with environmental engineer and health and safety director and establish communication between them
Work with the Human Resources department to establish good rapport with the local community
Hold monthly sessions with the human resources department to provide a platform for the local community to express their issues
Monitor social license and work towards making sure the license is upheld at all times
Bass River Mine Site
Personnel Requirements 112
Human Resource Representative:
In charge of all clearance, hiring and insurance information for all personnel hired
Work with the project engineer on upholding social license and maintaining a good relationship between the industry and general public
In charge of all payment information for all mine personnel
Any issues to the human resources will be redirected to REL Co.
In communication with REL Co HR department to handle issues at the mine site
Accountant:
Responsible for accounts at the mine site
Work with the HR department and the project engineer to make sure all accounts are up to date and monitored on a regular basis
Secretary:
Work with the mine engineer to prepare documents for all the departments, the president of the mine and REL Co.
Mine Surveyor:
Report to the mine engineer
Survey when needed
Security guard:
In charge of security at the gates
Will work 8 hour shifts
contracted from private security agency
Bass River Mine Site
Personnel Requirements 113
12.6 Personnel Costs
Bass River Mine will be comprised of both an hourly and salaried workforce. This will be
true in all sectors of the operation including the production, processing and miscellaneous
units. Employees will be offered varying types of benefit packages in addition to the hourly or
salaried pay. Benefit packages include all the benefits provided to employees by the employer.
REL Co. will offer the benefits that are required by law such as unemployment, workman
compensation and disability insurance. In addition, benefits that are for the betterment of the
workforce will be offered. These benefits may include health insurance, prescription coverage,
dental insurance, vision care, life insurance, paid vacation leave, sick leave and a retirement
plan based on an individual’s position and desired expenditure. Each of the benefits will be
addressed and broken down for each package.
New Jersey statutes require that unemployment benefits, workers’ compensation and
disability insurance be available to employees working in the state. Each of these benefits is
offered at no cost to both full-time hourly and salaried employees. Unemployment payments
into a state fund are covered by REL Co. workers’ compensation coverage and disability
insurance are bought and paid for by REL Co. Table L-I in the appendix explains the short-term
and long-term disability insurance structure.
All other benefits are offered as extras to the employees working for REL Co. Health
benefits will be the most diverse and complex in the benefits packages. There will be three
offerings available to the employees. The Blue Cross Blue Shield (BCBS) options include the
Basic PPO 90/70 plan, the Comprehensive PPO Plan and the BCBS HMO Plan. The plan details
Bass River Mine Site
Personnel Requirements 114
are broken down in Table L-II, L-III and L-IV of the appendix. Optional dental and vision coverage
is available to all full time employees. The cost structure for the health plans, dental insurance
and vision coverage is shown in Table L-V of the appendix. In addition to health insurance,
employees are provided prescription drug coverage at no extra cost. Drug costs based on type
are outlined in Table L-VI in the appendix.
Retirement saving is crucial, and REL Co. encourages employees to plan for the future.
To help facilitate investments in retirement, a 401(k) program will be created. Based on
employment length with REL Co., the company will provide additional funds to the 401(k)
account. The guidelines are shown in Table L-VII of the appendix. Paid vacation and sick leave
days are also based on an employment history. Tables L-VIII and L-IX outline the vacation and
sick days that will be earned by employees. REL Co. also takes part in a group life insurance
program that offers discounted coverage to its employees. The monthly price per unit can be
seen in Table L-X of the appendix. One unit of coverage constitutes as $1,000.
An overall cost for each of the individual hourly positions is compiled into Table 12-I.
Overall cost for each of the individual salaried positions is compiled into Table 12-II.
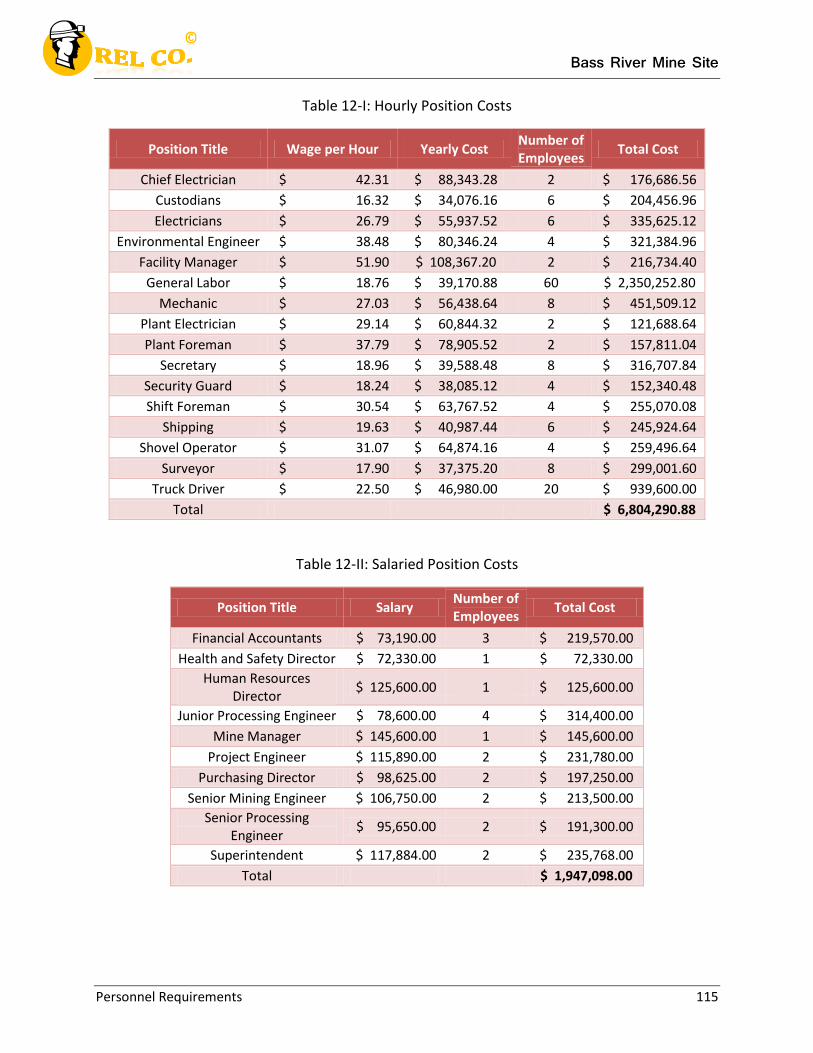
Bass River Mine Site
Personnel Requirements 115
Table 12-I: Hourly Position Costs
Position Title Wage per Hour Yearly Cost Number of Employees
Total Cost
Chief Electrician $ 42.31 $ 88,343.28 2 $ 176,686.56
Custodians $ 16.32 $ 34,076.16 6 $ 204,456.96
Electricians $ 26.79 $ 55,937.52 6 $ 335,625.12
Environmental Engineer $ 38.48 $ 80,346.24 4 $ 321,384.96
Facility Manager $ 51.90 $ 108,367.20 2 $ 216,734.40
General Labor $ 18.76 $ 39,170.88 60 $ 2,350,252.80
Mechanic $ 27.03 $ 56,438.64 8 $ 451,509.12
Plant Electrician $ 29.14 $ 60,844.32 2 $ 121,688.64
Plant Foreman $ 37.79 $ 78,905.52 2 $ 157,811.04
Secretary $ 18.96 $ 39,588.48 8 $ 316,707.84
Security Guard $ 18.24 $ 38,085.12 4 $ 152,340.48
Shift Foreman $ 30.54 $ 63,767.52 4 $ 255,070.08
Shipping $ 19.63 $ 40,987.44 6 $ 245,924.64
Shovel Operator $ 31.07 $ 64,874.16 4 $ 259,496.64
Surveyor $ 17.90 $ 37,375.20 8 $ 299,001.60
Truck Driver $ 22.50 $ 46,980.00 20 $ 939,600.00
Total $ 6,804,290.88
Table 12-II: Salaried Position Costs
Position Title Salary Number of Employees
Total Cost
Financial Accountants $ 73,190.00 3 $ 219,570.00
Health and Safety Director $ 72,330.00 1 $ 72,330.00
Human Resources Director
$ 125,600.00 1 $ 125,600.00
Junior Processing Engineer $ 78,600.00 4 $ 314,400.00
Mine Manager $ 145,600.00 1 $ 145,600.00
Project Engineer $ 115,890.00 2 $ 231,780.00
Purchasing Director $ 98,625.00 2 $ 197,250.00
Senior Mining Engineer $ 106,750.00 2 $ 213,500.00
Senior Processing Engineer
$ 95,650.00 2 $ 191,300.00
Superintendent $ 117,884.00 2 $ 235,768.00
Total $ 1,947,098.00
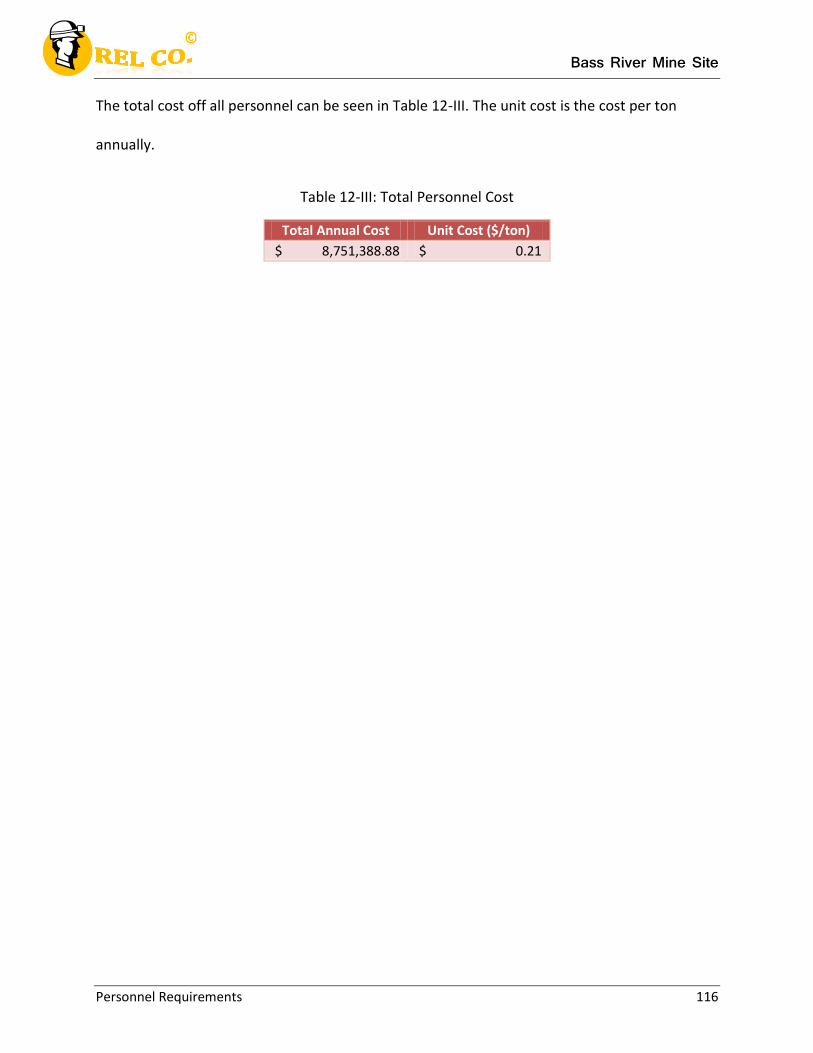
Bass River Mine Site
Personnel Requirements 116
The total cost off all personnel can be seen in Table 12-III. The unit cost is the cost per ton
annually.
Table 12-III: Total Personnel Cost
Total Annual Cost Unit Cost ($/ton)
$ 8,751,388.88 $ 0.21
Bass River Mine Site
Environmental Impacts and Sustainability 117
REL Company
Chapter 13
Bass River Mine Project: Environmental Impacts and Sustainability
Bass River Mine Site
Environmental Impacts and Sustainability 118
13.1 Land Surface Effects
The environmental footprint of Bass River Mine will be significantly larger than an
underground mining operation. All aspects of the operation will require a parcel of land for
development. The pit, buildings, roads, railways, stockpiles, processing facility and settling
ponds are included in the footprint of the REL Co. operation. The approximate area within the
property boundaries that will be utilized for mining activities is 1,000 acres. Considering the
area has little development, environmental impacts from erosion will occur.
The location of Bass River Mine is part of the Pine Barrens of South-Central New Jersey.
These Pine Barrens help shelter and solidify the ground material with their surface area and
root systems. In order to properly clear the land for pit and facility development, a large
amount of timbering will have to take place. When the timber and accompanying vegetation is
removed, the cleared area will be vulnerable to wind and rain driven erosion. In order to limit
the effects of erosion, vegetation of certain areas will take place. Berms around the pit and
sedimentation ponds will be reinforced with plant matter. Special attention will be given to
areas subjected to wind and drainage. In these areas, native plant materials with robust root
systems will be utilized. For permanent and semi-permanent surface facilities, shrubs and small
trees will be planted. This will help prevent soil erosion as well as protect the building from
strong weather effects. Stockpiles will be housed in simple structures to keep wind and rain
out. A concrete barrier will be constructed around the stockpiles to prevent direct erosion.
Finally, roadways and railways will have proper drainage and vegetation to prevent water
contamination. To effectively control erosion, constant monitoring will be carried out. If a
Bass River Mine Site
Environmental Impacts and Sustainability 119
source of erosion becomes a concern, natural or artificial erosion controls will be utilized to
minimize the issue.
13.2 Biological Effects
Bass River Mine will inevitably disturb the natural state of the mine property. By taking
special precautions and implementing proper environmental programs, the effects will be
minimized and temporary. Before any clearing can take place, the area must be documented.
This includes taking photos, studying wildlife, studying plant life and measuring key levels of
environmental materials. When clearing does commence, local wildlife will be displaced.
Fortunately, the subjected wildlife is not endangered and permits can be obtained. If wildlife
becomes a problem, solutions will be evaluated and implemented on a case by case basis. Plant
life will also be destroyed. In order to preserve the ecological integrity of the property, native
seed and plants will be used for erosion control. The entire mine site will eventually go through
a complete reclamation process. The same principles used during operations will be applied to
the reclamation as well.
13.3 Hydrological Effects
The area surrounding the Bass River Mine property contains several small waterways.
Operations should have little effect on the direct water quality of these streams. The alluvium
deposit comprising the ground material has low permeability and ground water effects will be
minimal. Settling ponds will be utilized to reduce sediment discharge. Any water being pumped
from the pit or being collected will be diverted to these ponds. All ponds will be lined to
Bass River Mine Site
Environmental Impacts and Sustainability 120
prevent any ground contamination if the water contains contaminants. Water quality levels will
be measured prior to development to ensure minimal deviation during operations. Monitoring
will take place throughout the entire mining process with particular emphasis on discharge
points. Clean Water Act regulations will dictate all appropriate water quality levels. Acid mine
drainage will be minimal at Bass River Mine because of the low water inflow. Water that must
be pumped out will be monitored for any extreme variations in pH levels and addressed with
remediation techniques when ranges are unacceptable. No chemical leaching processes are
used on site so this is also of little concern to hydrological integrity.
13.4 Air Quality Effects
The major concern with respect to air quality in an open pit mine is dust. Dust liberation
can result from a magnitude of surface activities. Drilling, blasting, loading, hauling, processing
and erosion all help move dust particles. The main dust suppression technique will be the use of
water trucks. Water or brine solutions will be sprayed on all active dirt haul roads to prevent
vehicles disturbing the roadway. Dust from blasting will be evaluated, and if necessary, the
blast parameters will be changed. Fugitive blast emissions are also of concern and will be
monitored. Diesel Particulate Matter (DPM) will also be released from the use of mining
equipment. The levels of DPM will not require attention because of the open nature of the
mine design.
Bass River Mine Site
Environmental Impacts and Sustainability 121
13.5 Societal Effects
Bass River, New Jersey is located in an area that has little development. This being said,
the localities surrounding Bass River are advanced and have all the infrastructure to support a
the standard quality of life. Given the ample road access and short distance to any needs, the
negative societal impact on the township will be minimal. The creation of Bass River Mine will
provide a large amount of jobs to the area. REL Co. will put emphasis on hiring locals and
offering quality positions.
13.6 Miscellaneous Effects
Bass River Mine is located in a sparsely populated area of New Jersey. Most residents
are miles away from the property boundaries. The few inhabitants that are located near the site
will not experience much disturbance. The land being cleared will not spread beyond what is
necessary. This means that the Pine Barrens surrounding the mine will remain intact. The trees
and vegetation will act as an effective barrier to visual blemishes and noise propagation.
Blasting will take place once a shift and will be timed to limit inconvenience to the surrounding
population. The vibrations created from the blast should not interfere with any well use in the
area. If there are concerns, REL Co. will work diligently with the locals to correct the issue.
13.7 Mine Permits
Bass River Mine will primarily be regulated by the Environmental Protection Agency, or
EPA. The EPA delegates many responsibilities to agencies in the state of operation. The New
Jersey Department of Environmental Protection is responsible for enforcing EPA regulations in
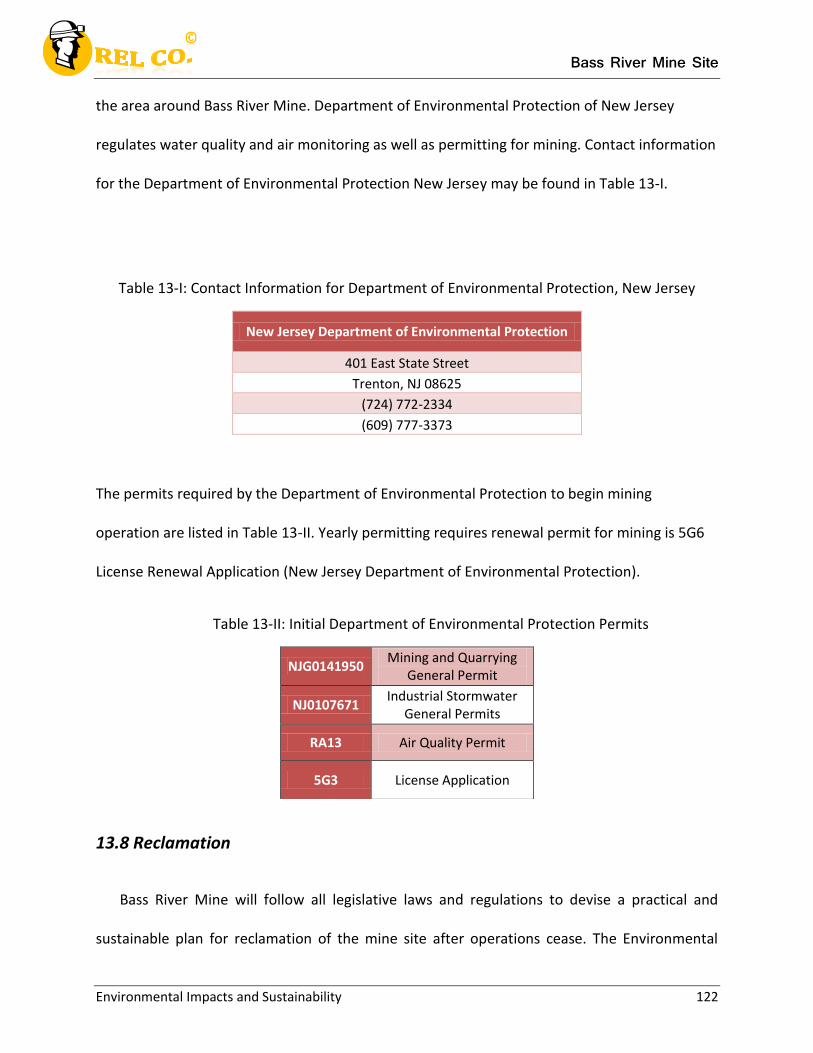
Bass River Mine Site
Environmental Impacts and Sustainability 122
the area around Bass River Mine. Department of Environmental Protection of New Jersey
regulates water quality and air monitoring as well as permitting for mining. Contact information
for the Department of Environmental Protection New Jersey may be found in Table 13-I.
Table 13-I: Contact Information for Department of Environmental Protection, New Jersey
New Jersey Department of Environmental Protection
401 East State Street
Trenton, NJ 08625
(724) 772-2334
(609) 777-3373
The permits required by the Department of Environmental Protection to begin mining
operation are listed in Table 13-II. Yearly permitting requires renewal permit for mining is 5G6
License Renewal Application (New Jersey Department of Environmental Protection).
Table 13-II: Initial Department of Environmental Protection Permits
13.8 Reclamation
Bass River Mine will follow all legislative laws and regulations to devise a practical and
sustainable plan for reclamation of the mine site after operations cease. The Environmental
NJG0141950 Mining and Quarrying
General Permit
NJ0107671 Industrial Stormwater
General Permits
RA13 Air Quality Permit
5G3 License Application
Bass River Mine Site
Environmental Impacts and Sustainability 123
Impact Statement (EIS) will be submitted to Environmental Protection Agency (EPA) before
operations commence and will be rectified if need be. As per the reclamation plan, all
decommissioned equipment will be moved away from the mine site. After deconstruction of
the administrative offices, reclamation activities will begin.
All water resources will be cleaned of any point source discharge according to the 402
permit established by the Clean Water Act (CWA).
All water resources will be cleaned of fill materials according to the 404 permit
established by CWA.
Waste facilities will be contoured in order to prepare and stabilize the rocks for the
topsoil cover.
All waste material will be disposed of in preparation for overburden replacement.
The overburden will be replaced in all areas excluding the pit.
Remaining overburden will be used to fill the pit up.
The pit will then be converted into a pond. The water will be maintained in order to
cultivate a fish population.
Chemicals will be monitored in the pond to ensure safe growth of fish and other
organisms.
The mine site will be covered with topsoil and a vegetative growth will be established.
The first stage of plants that are planted helps stabilize the ground and provide a better
support for the trees that are planted in the second stage of reclamation.
The plant and animal life that is reestablished will be similar to the flora and fauna that
is found around Bass River, New Jersey.
Bass River Mine Site
Environmental Impacts and Sustainability 124
The long-term reclamation plan will continue for 10 years with the main responsibility of
monitoring the reclamation plan in effect. Monitoring will be done monthly the first two
years, bi-monthly the next two years, and then once every six months for the next six
years. If any discrepancies are found the responsible authorities will be notified.
In addition to the current reclamation plan, new activities will be added or rectified
according to the federal and state reclamation laws. The Corporate Social Responsibility
Committee (CSR) will play a huge part providing a medium for communication between the
locals and the Bass River Mine Environmental Specialist. This will provide a platform for the
community to voice their opinions about the reclamation plan and bring their concerns to the
table as well. In addition to the reclamation plan, sustainable development will also play a huge
role in the mine closure activities.
13.9 Sustainability Plan
After reclamation efforts commence, the community members will be notified in order
to bring Bass River Mine environmentalists any ideas or plans they have for optimum use of the
site. Therefore, the sustainability plan is subject to change depending on the concerns and
expressions of the community. The plan that is devised by REL Co. for Bass River Mine is for the
mine site to be converted into a recreational facility that will be open to the public at a minor
fee. The minor fee will go to the community welfare committee that can be used by the
community members for the betterment of the community as a whole. The pit that is
converted into a pond will be used strictly for fishing purposes. There will be a shop established
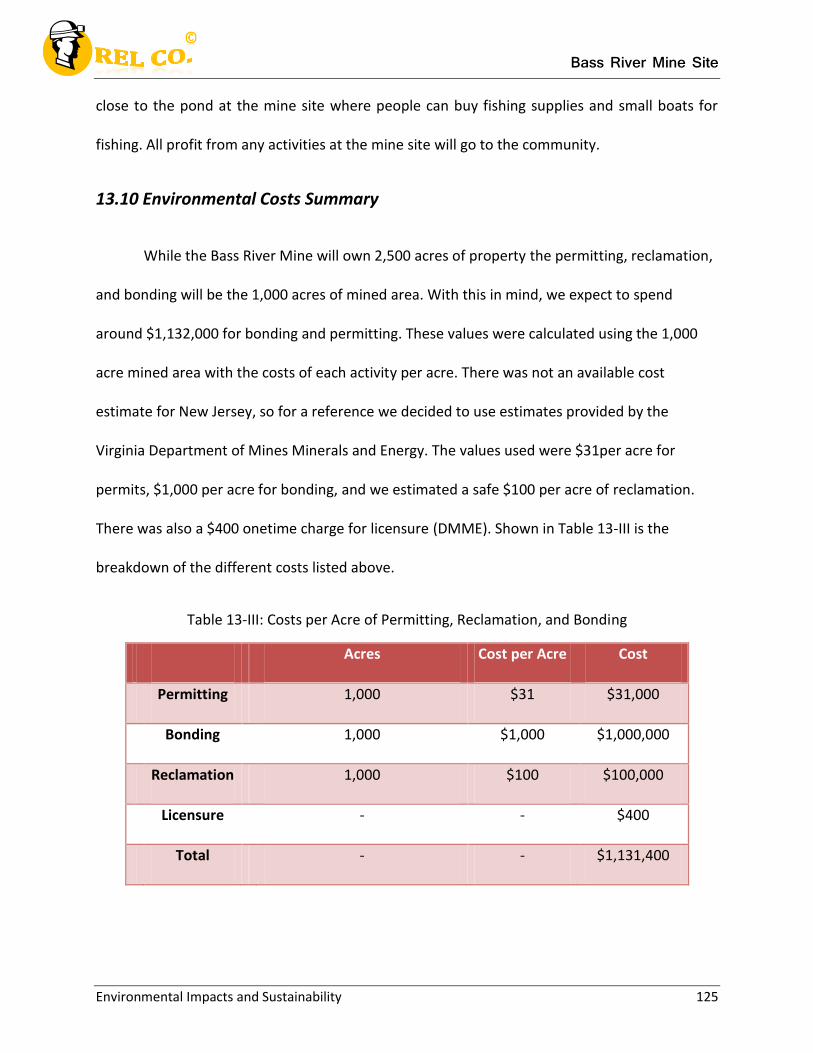
Bass River Mine Site
Environmental Impacts and Sustainability 125
close to the pond at the mine site where people can buy fishing supplies and small boats for
fishing. All profit from any activities at the mine site will go to the community.
13.10 Environmental Costs Summary
While the Bass River Mine will own 2,500 acres of property the permitting, reclamation,
and bonding will be the 1,000 acres of mined area. With this in mind, we expect to spend
around $1,132,000 for bonding and permitting. These values were calculated using the 1,000
acre mined area with the costs of each activity per acre. There was not an available cost
estimate for New Jersey, so for a reference we decided to use estimates provided by the
Virginia Department of Mines Minerals and Energy. The values used were $31per acre for
permits, $1,000 per acre for bonding, and we estimated a safe $100 per acre of reclamation.
There was also a $400 onetime charge for licensure (DMME). Shown in Table 13-III is the
breakdown of the different costs listed above.
Table 13-III: Costs per Acre of Permitting, Reclamation, and Bonding
Acres Cost per Acre Cost
Permitting 1,000 $31 $31,000
Bonding 1,000 $1,000 $1,000,000
Reclamation 1,000 $100 $100,000
Licensure - - $400
Total - - $1,131,400
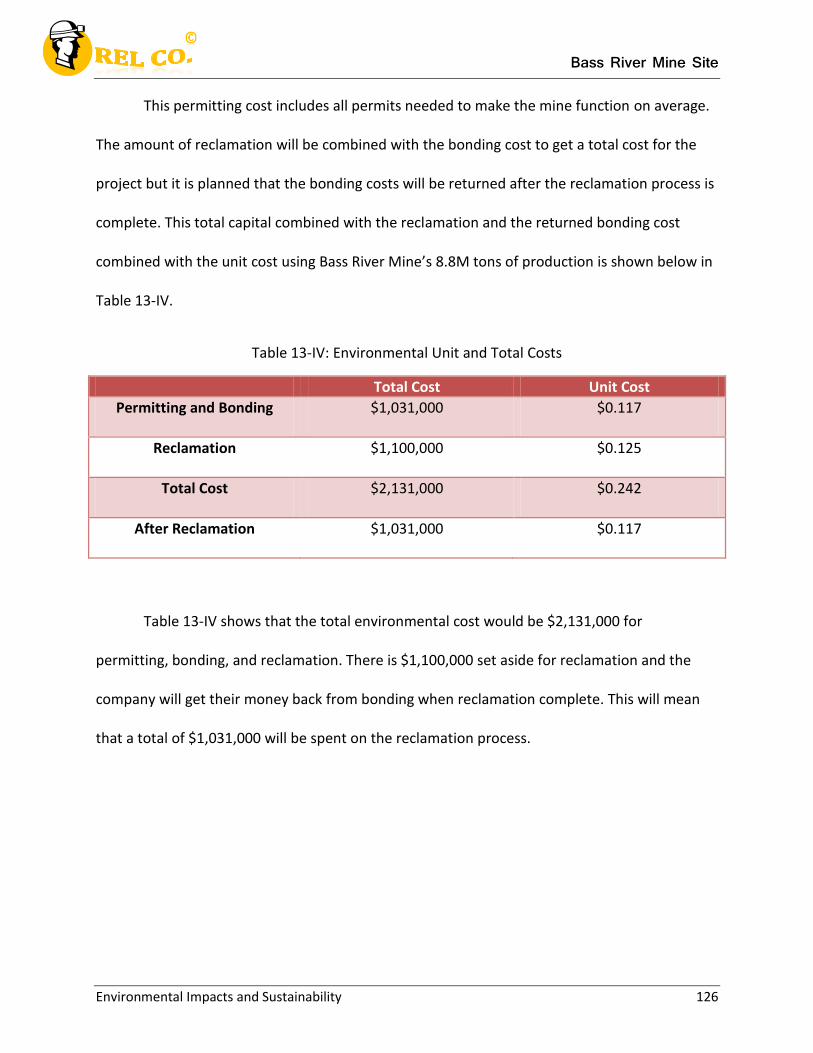
Bass River Mine Site
Environmental Impacts and Sustainability 126
This permitting cost includes all permits needed to make the mine function on average.
The amount of reclamation will be combined with the bonding cost to get a total cost for the
project but it is planned that the bonding costs will be returned after the reclamation process is
complete. This total capital combined with the reclamation and the returned bonding cost
combined with the unit cost using Bass River Mine’s 8.8M tons of production is shown below in
Table 13-IV.
Table 13-IV: Environmental Unit and Total Costs
Total Cost Unit Cost
Permitting and Bonding $1,031,000 $0.117
Reclamation $1,100,000 $0.125
Total Cost $2,131,000 $0.242
After Reclamation $1,031,000 $0.117
Table 13-IV shows that the total environmental cost would be $2,131,000 for
permitting, bonding, and reclamation. There is $1,100,000 set aside for reclamation and the
company will get their money back from bonding when reclamation complete. This will mean
that a total of $1,031,000 will be spent on the reclamation process.

Bass River Mine Site
Contractual Agreements 127
REL Company
Chapter 14
Bass River Mine Project: Contractual Agreements
Bass River Mine Site
Contractual Agreements 128
14.1 Ownership
Bass River Mine will be located on land purchased by REL Co. from the state of New
Jersey. This piece of land is located in Bass River inside the boundaries of Burlington County.
When development of the mine commences, a permanent address of 1200 Chatsworth Road,
Bass River, New Jersey 08224 will be established. The sales contract between REL Co. and New
Jersey will state a transactional area of 2500 acres. Based on 2012 statistics, the average price
of wooded area in the region is approximately $2,100 per acre (USDA). REL Co. and the state of
New Jersey will agree to a purchase price based on average market value. At 2500 acres, the
total purchase price will be $5,250,000.
As seen in Figure 14-1, the only permanent, paved road on the mine site is Chatsworth
Road. The road was created and is maintained by Burlington County. Under the sale contract,
the road will continue to be maintained by the county. If any damage occurs due to mining
activity or equipment, REL Co. will have to pay for repair. All other roads traversing the property
are comprised of compressed dirt. In some sections, gravel is added to the dirt to shore up the
roadbed. During the development and operation of the mine, all dirt and gravel roads will be
under REL Co. control. Roads may be created or eliminated based on operational discretion.
When mining is completed and reclamation begins, comparable access to varying parts of the
property will have to be built. Before resale to the state, dirt roads will be built in the
approximate areas of previous access ways. Roads will ensure that state and local officials can
travel the property if any emergency situations arise. The public may also use the roadways
after New Jersey reclaims property rights.
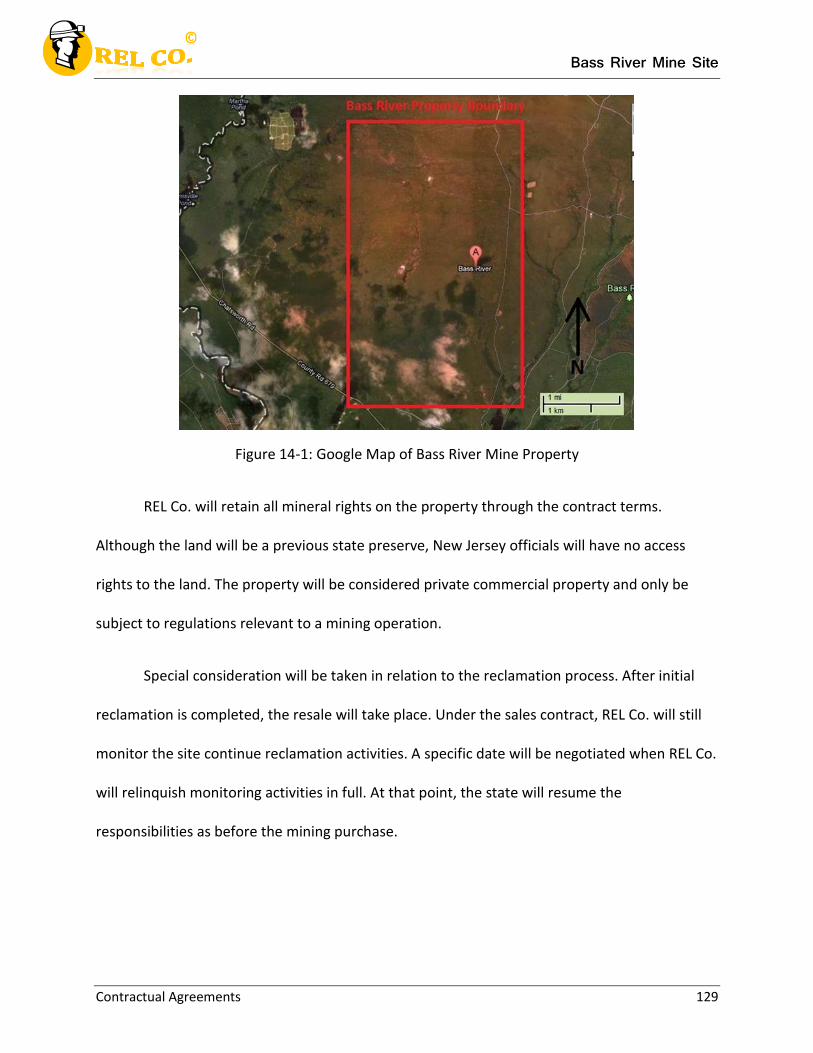
Bass River Mine Site
Contractual Agreements 129
Figure 14-1: Google Map of Bass River Mine Property
REL Co. will retain all mineral rights on the property through the contract terms.
Although the land will be a previous state preserve, New Jersey officials will have no access
rights to the land. The property will be considered private commercial property and only be
subject to regulations relevant to a mining operation.
Special consideration will be taken in relation to the reclamation process. After initial
reclamation is completed, the resale will take place. Under the sales contract, REL Co. will still
monitor the site continue reclamation activities. A specific date will be negotiated when REL Co.
will relinquish monitoring activities in full. At that point, the state will resume the
responsibilities as before the mining purchase.
Bass River Mine Site
Contractual Agreements 130
14.2 Mining Lease
Bass River Mine will not need to set up a royalty agreement because REL Co. will be
purchasing the land. The land will be acquired from the state of New Jersey so there will be no
royalty payments. There will not be a payment structure for the purchase of the land as it will
be purchased directly with company funds, and included in the capital cost of the mine, so
there will be no terms regarding lease. The closing agreement will be to sell the reclaimed land
back to the state of New Jersey after mining is complete. This agreement will be drafted when
the land is purchased and will be effective after mine closure. The agreement will state that the
land will be appraised by a third party after mining is complete and an amount will be agreed
upon for the sale.
14.3 Market Evaluation
Since magnesium, the byproduct of Iron-magnesium ore, is too expensive to process at
Bass River Mine, only iron will be considered a profitable resource for evaluation purposes. The
iron ore derived from the mine site will be sold to steel manufacturers in New Jersey. The
market that Bass River Mine will compete in is the Ocean County which falls under New Jersey
Metropolitan Statistical Area. The Ocean County includes many townships of which Tuckerton
Township (Bass River Mine) is a part. Other major Townships within close range of Bass River
Mine are Beach Haven Borough, Eagleswood Township, Little Egg Harbor Township and
Tuckerton Borough. The iron ore sold will be used in Iron and steel mills as well as the
manufacturing of ferroalloy.
Bass River Mine Site
Contractual Agreements 131
The population for Ocean County, the largest county in the state of New Jersey, grew
17.9% from 1990-2000 and grew 12.8% from 2000-2010. In 2010, according to the US Census
Bureau, the population in Ocean County was 576,567 with a projected growth of 0.01% in the
year 2012. Table N-1 of the appendix shows the increase in population in Ocean County along
with a distribution of the population in Beach Haven Borough, Eagleswood, Little Egg Township,
Tuckerton Borough and the entire state of New Jersey from the year 2000-2010.
According to the US Census Bureau, New Jersey accounted for 0.72% of all value of iron
and steel mill manufacturing shipment in the US. New Jersey ranked 16 in the nation in the
production of iron and steel. In the appendix, Table N-2 shows the ranking of iron and steel in
New Jersey in comparison with other states.
14.4 Sales Contract
REL Co. will create a contract for sales to be used when entering a business relationship
with customers. The sales contract will include important information such as the name of the
customer, the agreed upon price per ton of iron, the iron grade and size agreed upon, the
amount of iron, and the dates during which the iron is being supplied to the customer. Other
requests of the customer will be written on the sales contract. To complete the contract,
signatures must be obtained from the customer and either a REL Co. executive or the mine
manager of the Bass River Mine, along with any witness.
All customers of REL Co. will receive any agreed upon amount of iron ore product at
specified grade for the specified amount of time according to any outstanding sales contracts.
Any REL Co. customers that cancel a sales contract will be charged a termination fee of twenty
Bass River Mine Site
Contractual Agreements 132
5% of any remaining unpaid balanced for the contract. If any REL Co. customer does not pay the
amount agreed upon each month then a fee of 5% will be added to the total unpaid amount. If
a customer fails to pay for three consecutive terms REL Co. is able to terminate any sales
contract and seek legal action to collect any unpaid dues. On the other hand, if REL Co. is
unable to supply the customer with the agreed upon iron ore in the specifications arranged,
then the customer is able to cancel the sales contract.
If the iron ore product supplied by REL Co. fails to meet agreed upon specifications, then
a fee of 2.5% per ton will be paid back to the customer. If the iron ore product supplied by REL
Co. fails to meet the tonnage agreed upon, then a fee of 2% per ton will be paid back to the
customer. Any discrepancies in product specifications or tonnage are to be determined by the
customer and relayed to REL Co. with fourteen days of received shipment. If an event occurs
that are unpredicted, REL Co. and the customer can meet to change the sales contract or
terminate it.
The pricing structure for iron ore products supplied by REL Co. is shown in Table 14-I.
Contract pricing is based on two categories of contracts, small and large. Large contracts consist
of a purchase of more than 400,000 tons per year. Large contracts give a 10% discount over
small contracts to encourage large purchases. High grade iron ore is 65% grade or higher,
medium grade iron ore is between 60% and 65% grade iron. Prices are negotiable between the
customer and the one presiding over the sales contract.
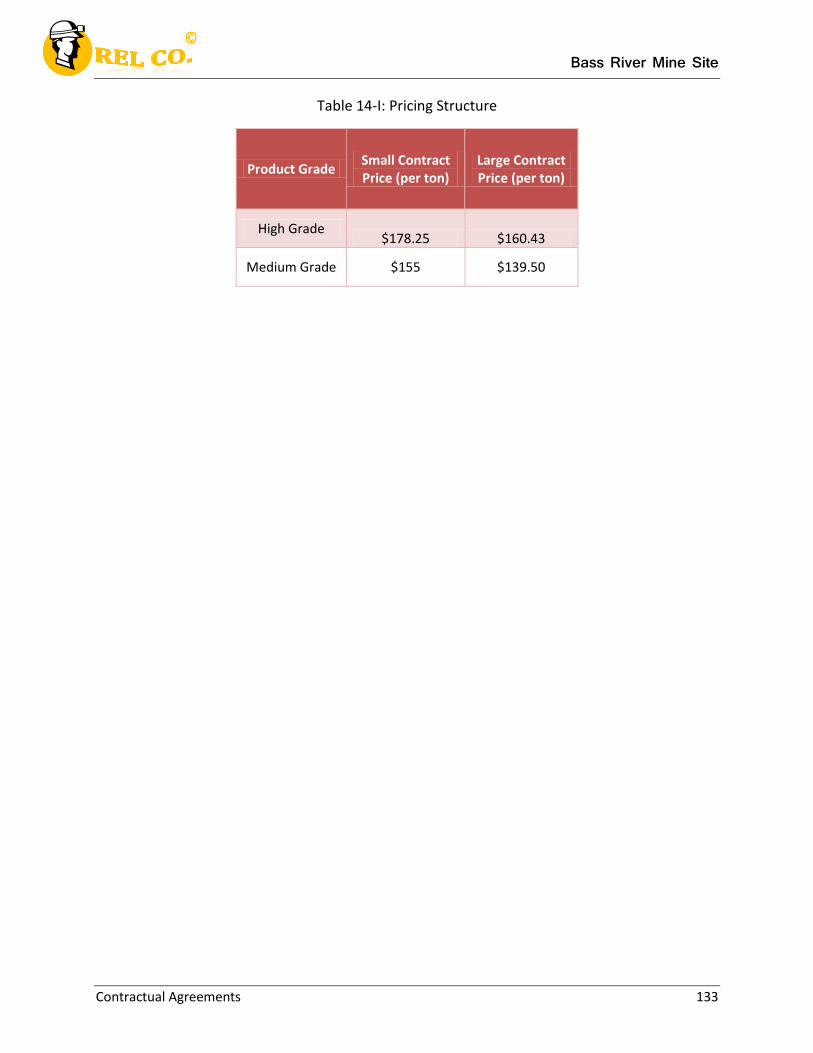
Bass River Mine Site
Contractual Agreements 133
Table 14-I: Pricing Structure
Product Grade Small Contract Price (per ton)
Large Contract Price (per ton)
High Grade $178.25 $160.43
Medium Grade $155 $139.50

Bass River Mine Site
Cost and Feasibility Analysis 134
REL Company
Chapter 15
Bass River Mine Project: Cost and Feasibility Analysis
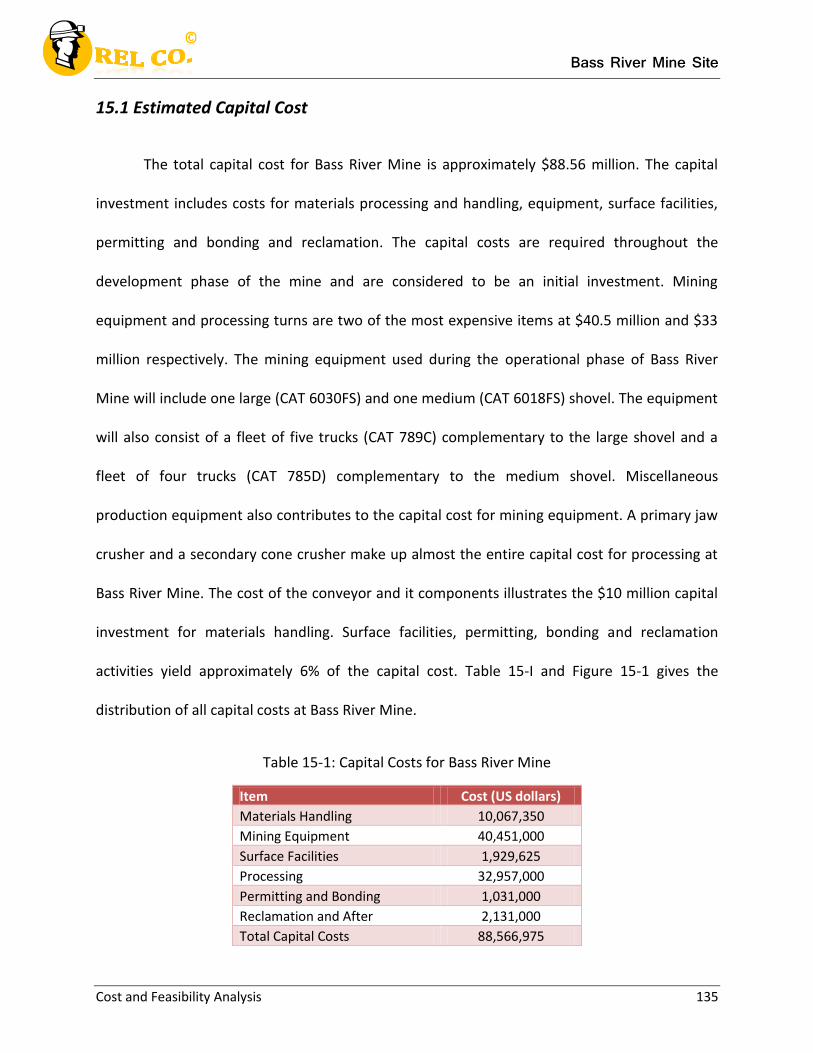
Bass River Mine Site
Cost and Feasibility Analysis 135
15.1 Estimated Capital Cost
The total capital cost for Bass River Mine is approximately $88.56 million. The capital
investment includes costs for materials processing and handling, equipment, surface facilities,
permitting and bonding and reclamation. The capital costs are required throughout the
development phase of the mine and are considered to be an initial investment. Mining
equipment and processing turns are two of the most expensive items at $40.5 million and $33
million respectively. The mining equipment used during the operational phase of Bass River
Mine will include one large (CAT 6030FS) and one medium (CAT 6018FS) shovel. The equipment
will also consist of a fleet of five trucks (CAT 789C) complementary to the large shovel and a
fleet of four trucks (CAT 785D) complementary to the medium shovel. Miscellaneous
production equipment also contributes to the capital cost for mining equipment. A primary jaw
crusher and a secondary cone crusher make up almost the entire capital cost for processing at
Bass River Mine. The cost of the conveyor and it components illustrates the $10 million capital
investment for materials handling. Surface facilities, permitting, bonding and reclamation
activities yield approximately 6% of the capital cost. Table 15-I and Figure 15-1 gives the
distribution of all capital costs at Bass River Mine.
Table 15-1: Capital Costs for Bass River Mine
Item Cost (US dollars)
Materials Handling 10,067,350
Mining Equipment 40,451,000
Surface Facilities 1,929,625
Processing 32,957,000
Permitting and Bonding 1,031,000
Reclamation and After 2,131,000
Total Capital Costs 88,566,975
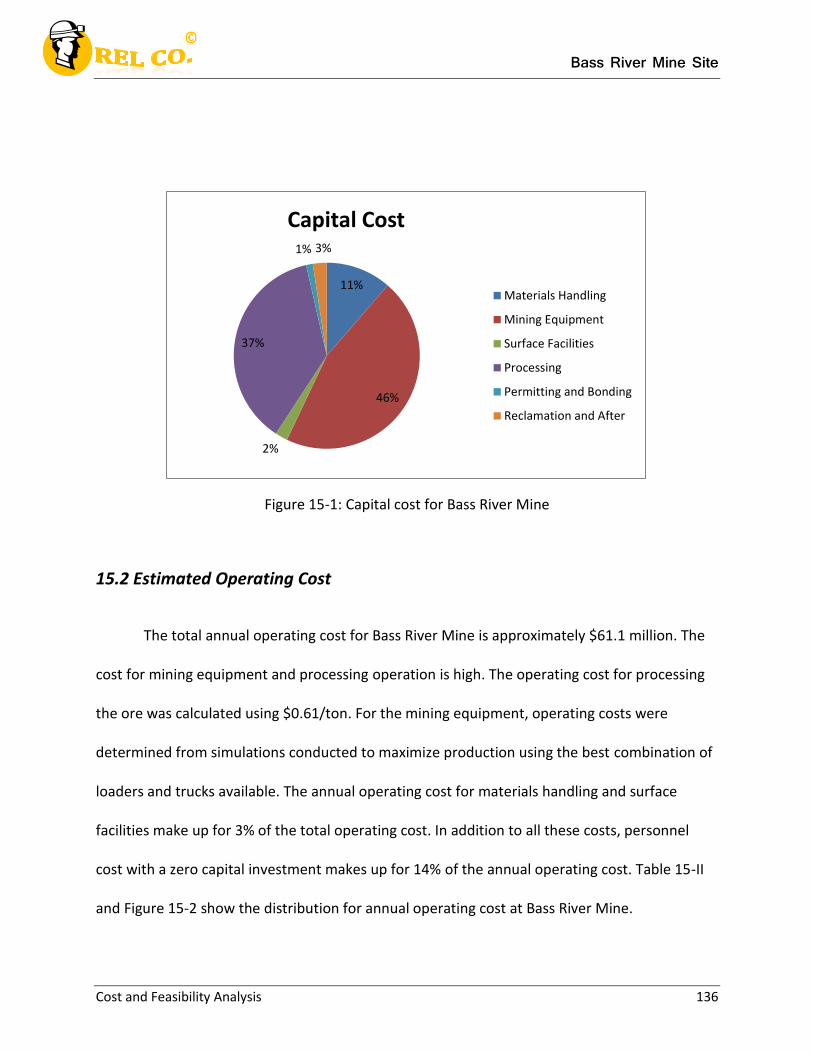
Bass River Mine Site
Cost and Feasibility Analysis 136
Figure 15-1: Capital cost for Bass River Mine
15.2 Estimated Operating Cost
The total annual operating cost for Bass River Mine is approximately $61.1 million. The
cost for mining equipment and processing operation is high. The operating cost for processing
the ore was calculated using $0.61/ton. For the mining equipment, operating costs were
determined from simulations conducted to maximize production using the best combination of
loaders and trucks available. The annual operating cost for materials handling and surface
facilities make up for 3% of the total operating cost. In addition to all these costs, personnel
cost with a zero capital investment makes up for 14% of the annual operating cost. Table 15-II
and Figure 15-2 show the distribution for annual operating cost at Bass River Mine.
11%
46%
2%
37%
1% 3%
Capital Cost
Materials Handling
Mining Equipment
Surface Facilities
Processing
Permitting and Bonding
Reclamation and After
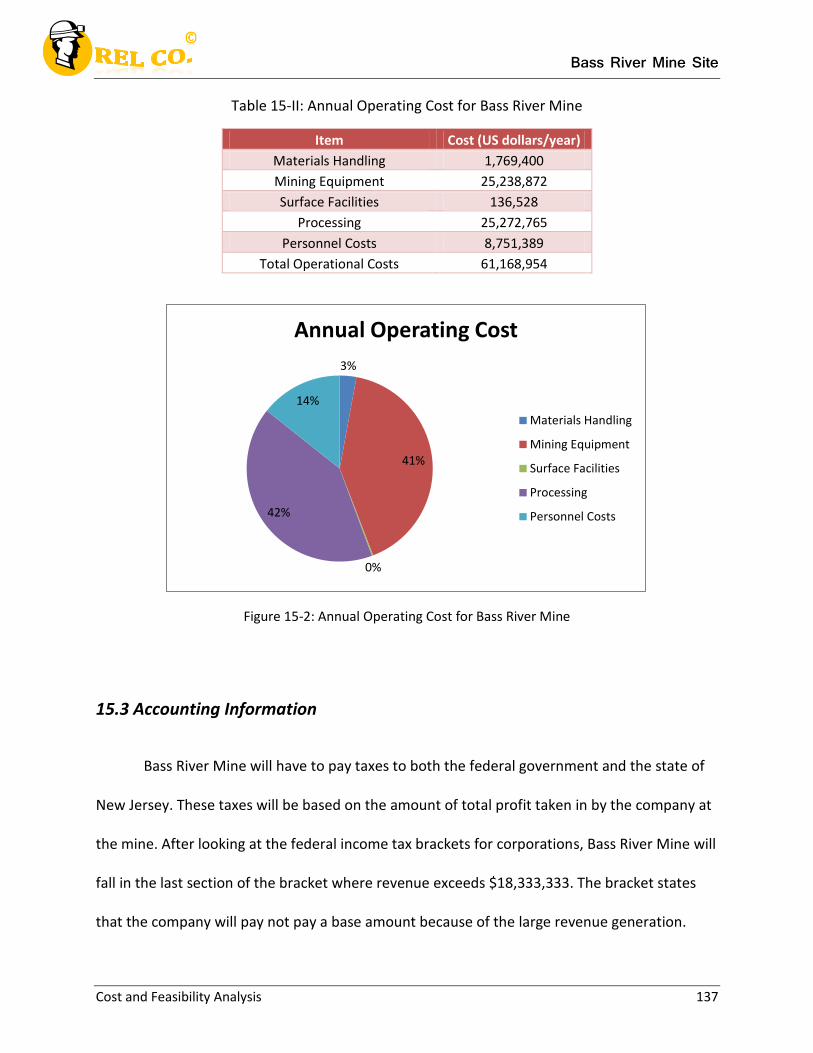
Bass River Mine Site
Cost and Feasibility Analysis 137
Table 15-II: Annual Operating Cost for Bass River Mine
Item Cost (US dollars/year)
Materials Handling 1,769,400
Mining Equipment 25,238,872
Surface Facilities 136,528
Processing 25,272,765
Personnel Costs 8,751,389
Total Operational Costs 61,168,954
Figure 15-2: Annual Operating Cost for Bass River Mine
15.3 Accounting Information
Bass River Mine will have to pay taxes to both the federal government and the state of
New Jersey. These taxes will be based on the amount of total profit taken in by the company at
the mine. After looking at the federal income tax brackets for corporations, Bass River Mine will
fall in the last section of the bracket where revenue exceeds $18,333,333. The bracket states
that the company will pay not pay a base amount because of the large revenue generation.
3%
41%
0%
42%
14%
Annual Operating Cost
Materials Handling
Mining Equipment
Surface Facilities
Processing
Personnel Costs
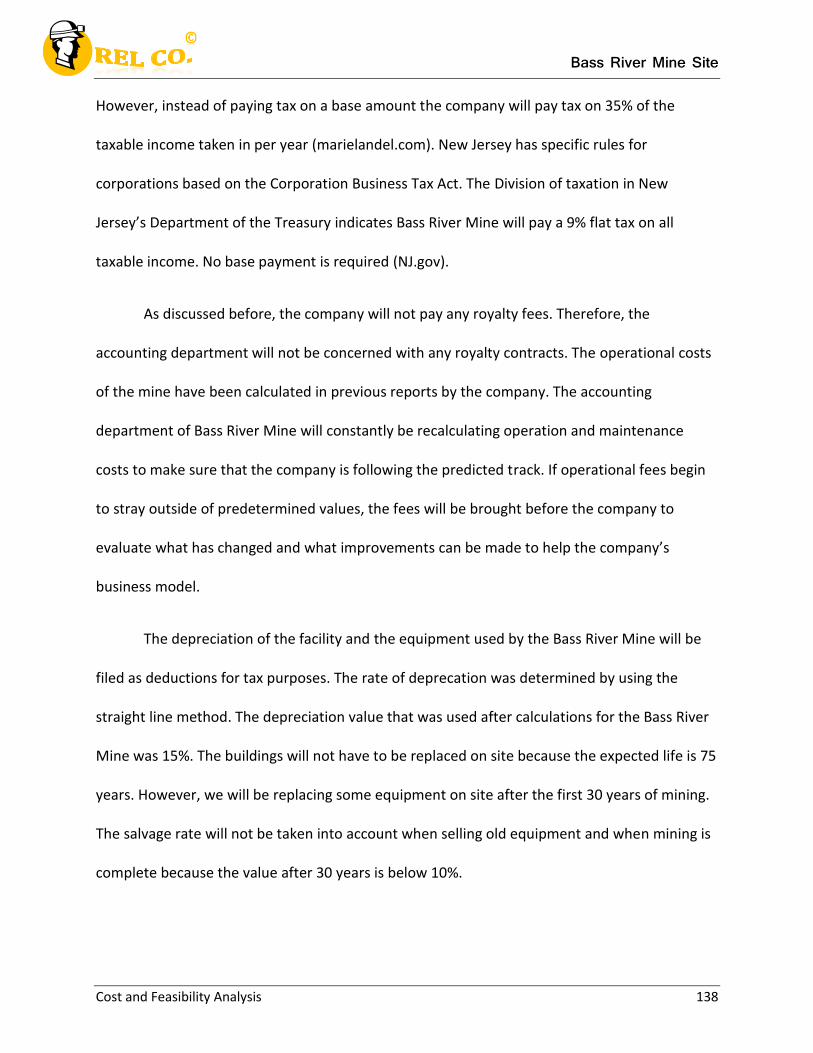
Bass River Mine Site
Cost and Feasibility Analysis 138
However, instead of paying tax on a base amount the company will pay tax on 35% of the
taxable income taken in per year (marielandel.com). New Jersey has specific rules for
corporations based on the Corporation Business Tax Act. The Division of taxation in New
Jersey’s Department of the Treasury indicates Bass River Mine will pay a 9% flat tax on all
taxable income. No base payment is required (NJ.gov).
As discussed before, the company will not pay any royalty fees. Therefore, the
accounting department will not be concerned with any royalty contracts. The operational costs
of the mine have been calculated in previous reports by the company. The accounting
department of Bass River Mine will constantly be recalculating operation and maintenance
costs to make sure that the company is following the predicted track. If operational fees begin
to stray outside of predetermined values, the fees will be brought before the company to
evaluate what has changed and what improvements can be made to help the company’s
business model.
The depreciation of the facility and the equipment used by the Bass River Mine will be
filed as deductions for tax purposes. The rate of deprecation was determined by using the
straight line method. The depreciation value that was used after calculations for the Bass River
Mine was 15%. The buildings will not have to be replaced on site because the expected life is 75
years. However, we will be replacing some equipment on site after the first 30 years of mining.
The salvage rate will not be taken into account when selling old equipment and when mining is
complete because the value after 30 years is below 10%.
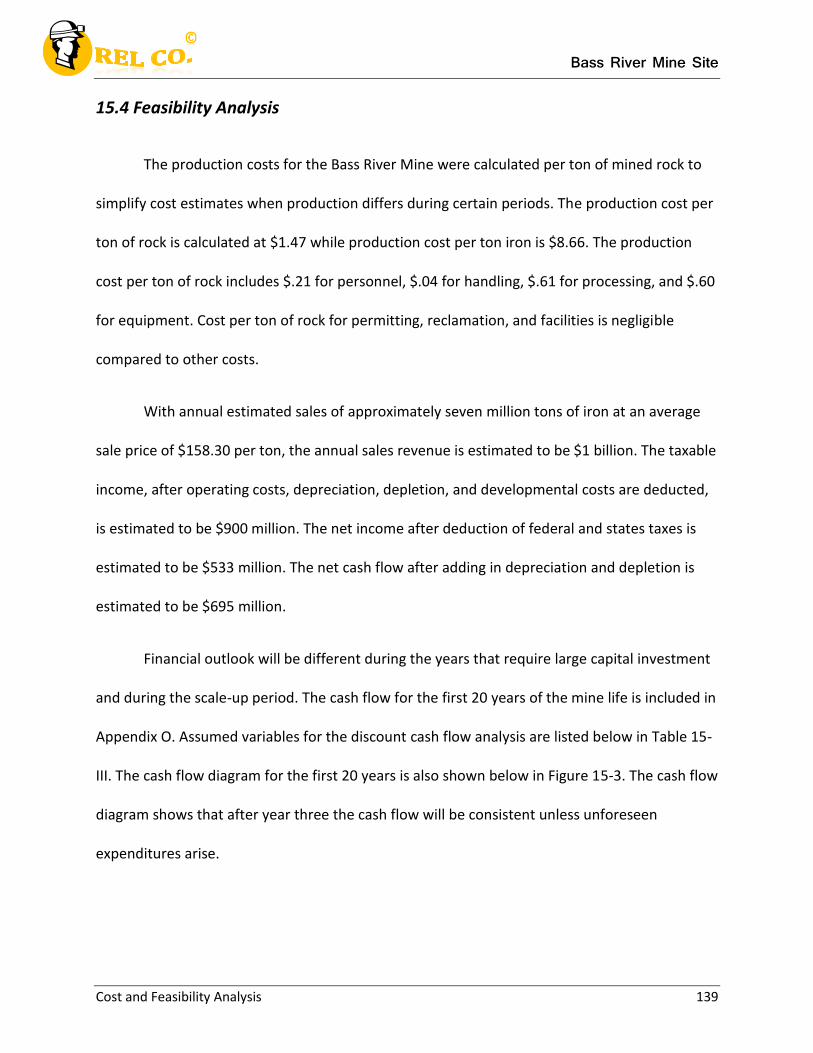
Bass River Mine Site
Cost and Feasibility Analysis 139
15.4 Feasibility Analysis
The production costs for the Bass River Mine were calculated per ton of mined rock to
simplify cost estimates when production differs during certain periods. The production cost per
ton of rock is calculated at $1.47 while production cost per ton iron is $8.66. The production
cost per ton of rock includes $.21 for personnel, $.04 for handling, $.61 for processing, and $.60
for equipment. Cost per ton of rock for permitting, reclamation, and facilities is negligible
compared to other costs.
With annual estimated sales of approximately seven million tons of iron at an average
sale price of $158.30 per ton, the annual sales revenue is estimated to be $1 billion. The taxable
income, after operating costs, depreciation, depletion, and developmental costs are deducted,
is estimated to be $900 million. The net income after deduction of federal and states taxes is
estimated to be $533 million. The net cash flow after adding in depreciation and depletion is
estimated to be $695 million.
Financial outlook will be different during the years that require large capital investment
and during the scale-up period. The cash flow for the first 20 years of the mine life is included in
Appendix O. Assumed variables for the discount cash flow analysis are listed below in Table 15-
III. The cash flow diagram for the first 20 years is also shown below in Figure 15-3. The cash flow
diagram shows that after year three the cash flow will be consistent unless unforeseen
expenditures arise.
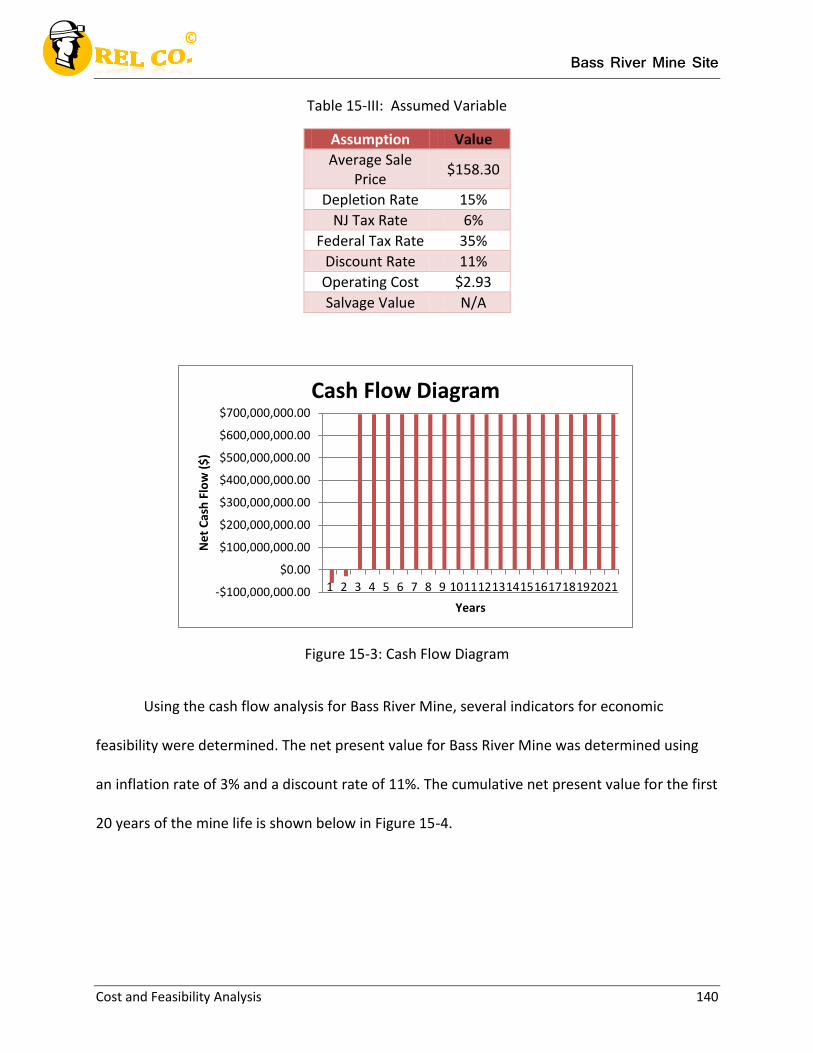
Bass River Mine Site
Cost and Feasibility Analysis 140
Table 15-III: Assumed Variable
Assumption Value
Average Sale Price
$158.30
Depletion Rate 15%
NJ Tax Rate 6%
Federal Tax Rate 35%
Discount Rate 11%
Operating Cost $2.93
Salvage Value N/A
Figure 15-3: Cash Flow Diagram
Using the cash flow analysis for Bass River Mine, several indicators for economic
feasibility were determined. The net present value for Bass River Mine was determined using
an inflation rate of 3% and a discount rate of 11%. The cumulative net present value for the first
20 years of the mine life is shown below in Figure 15-4.
-$100,000,000.00
$0.00
$100,000,000.00
$200,000,000.00
$300,000,000.00
$400,000,000.00
$500,000,000.00
$600,000,000.00
$700,000,000.00
1 2 3 4 5 6 7 8 9 101112131415161718192021
Ne
t C
ash
Flo
w (
$)
Years
Cash Flow Diagram
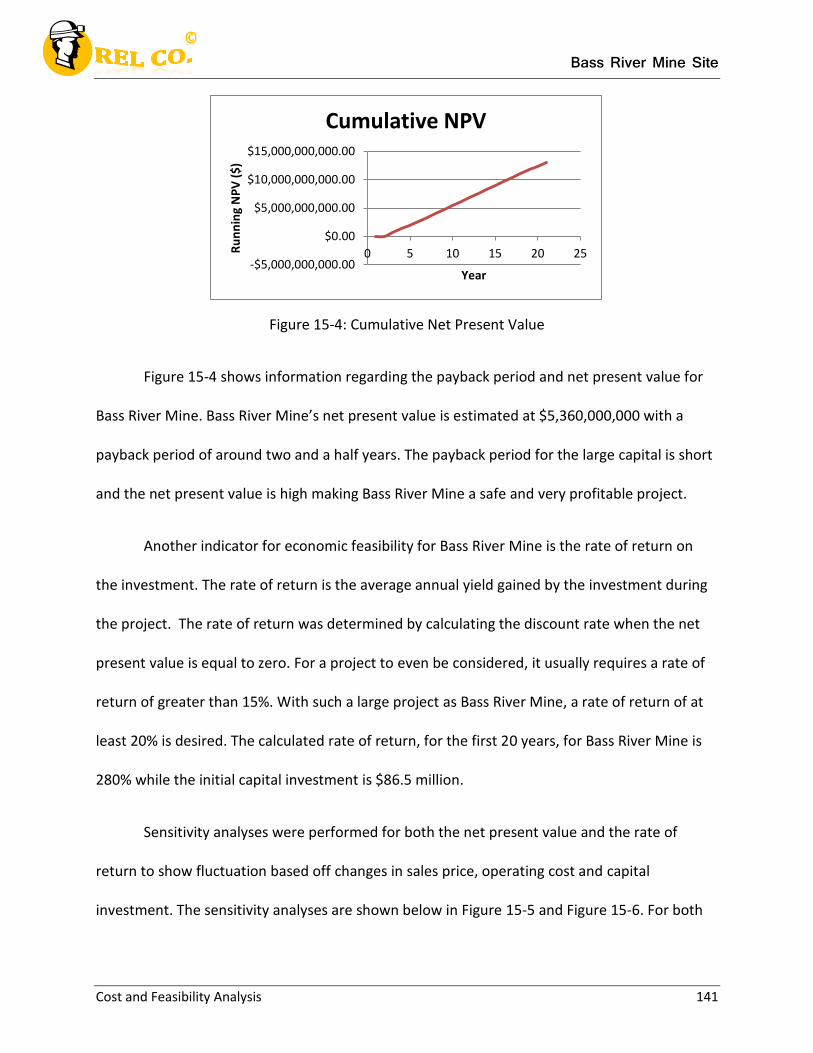
Bass River Mine Site
Cost and Feasibility Analysis 141
Figure 15-4: Cumulative Net Present Value
Figure 15-4 shows information regarding the payback period and net present value for
Bass River Mine. Bass River Mine’s net present value is estimated at $5,360,000,000 with a
payback period of around two and a half years. The payback period for the large capital is short
and the net present value is high making Bass River Mine a safe and very profitable project.
Another indicator for economic feasibility for Bass River Mine is the rate of return on
the investment. The rate of return is the average annual yield gained by the investment during
the project. The rate of return was determined by calculating the discount rate when the net
present value is equal to zero. For a project to even be considered, it usually requires a rate of
return of greater than 15%. With such a large project as Bass River Mine, a rate of return of at
least 20% is desired. The calculated rate of return, for the first 20 years, for Bass River Mine is
280% while the initial capital investment is $86.5 million.
Sensitivity analyses were performed for both the net present value and the rate of
return to show fluctuation based off changes in sales price, operating cost and capital
investment. The sensitivity analyses are shown below in Figure 15-5 and Figure 15-6. For both
-$5,000,000,000.00
$0.00
$5,000,000,000.00
$10,000,000,000.00
$15,000,000,000.00
0 5 10 15 20 25Ru
nn
ing
NP
V (
$)
Year
Cumulative NPV
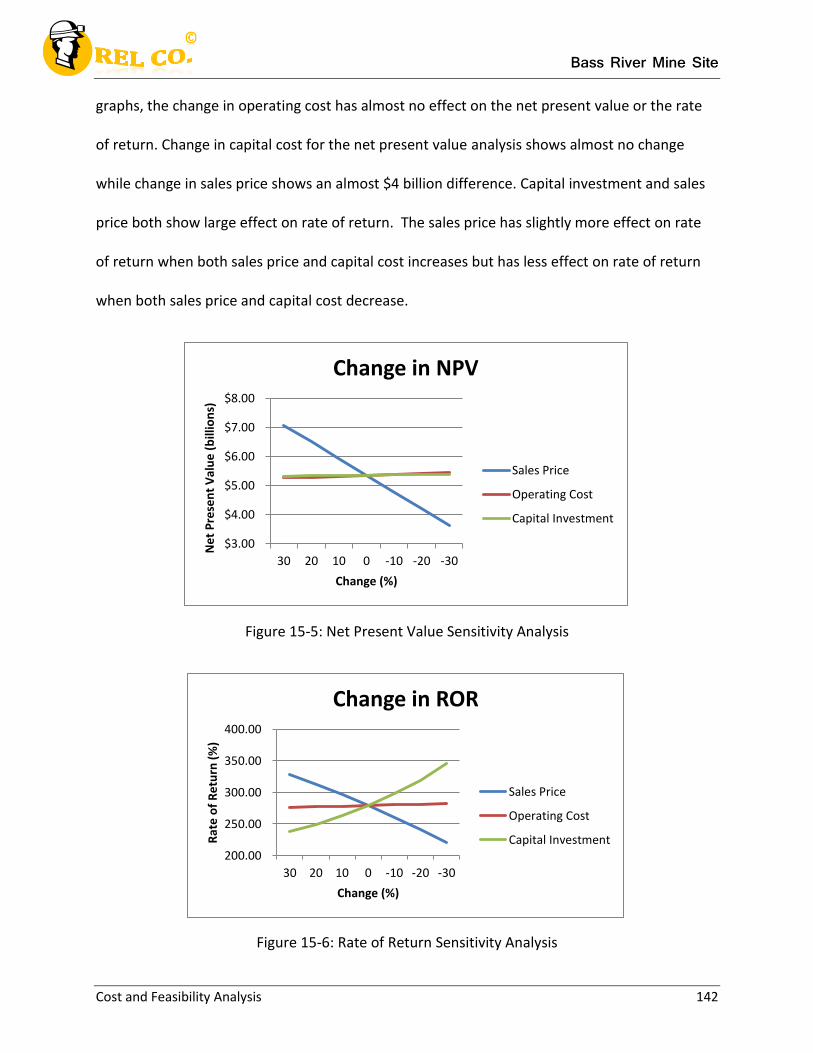
Bass River Mine Site
Cost and Feasibility Analysis 142
graphs, the change in operating cost has almost no effect on the net present value or the rate
of return. Change in capital cost for the net present value analysis shows almost no change
while change in sales price shows an almost $4 billion difference. Capital investment and sales
price both show large effect on rate of return. The sales price has slightly more effect on rate
of return when both sales price and capital cost increases but has less effect on rate of return
when both sales price and capital cost decrease.
Figure 15-5: Net Present Value Sensitivity Analysis
Figure 15-6: Rate of Return Sensitivity Analysis
$3.00
$4.00
$5.00
$6.00
$7.00
$8.00
30 20 10 0 -10 -20 -30
Ne
t P
rese
nt
Val
ue
(b
illio
ns)
Change (%)
Change in NPV
Sales Price
Operating Cost
Capital Investment
200.00
250.00
300.00
350.00
400.00
30 20 10 0 -10 -20 -30
Rat
e o
f R
etu
rn (
%)
Change (%)
Change in ROR
Sales Price
Operating Cost
Capital Investment
Bass River Mine Site
Cost and Feasibility Analysis 143
The economic feasibility of Bass River Mine is very favorable based on the indicators
calculated from the cash flow analysis. The expected rate of return of 280% is so large that even
with a 200% change in sales price the project would prove economic. The required capital is
large at $86.5 million, but with such great indicators, backing should be found easily. The
payback period of just two and a half years is short for such a large project, so most of the life is
large profit. The net present value of $5.3 billion is large especially since this analysis is done for
only 20 years. The economic indicators show that even with huge market fluctuations, Bass
River Mine will be very profitable.

Bass River Mine Site
Summary and Conclusions 144
REL Company
Chapter 16
Bass River Mine Project: Summary and Conclusions
Bass River Mine Site
Summary and Conclusions 145
16.1 Mine Description
Bass River Mine is a property owned by REL Co. in the Bass River area of eastern New
Jersey. The area contains large amounts of iron ore that will be mined using an open pit
technique and then processed into useable iron ore. The property covers around 2,500 acres of
land, and based on borehole data, the iron ore body at certain places is less than 20ft below the
surface. The seam then sinks to around 580 feet at some points, which means that the areas
can be mined with an extremely low stripping ratio. The low stripping ratio makes the proposed
open pit mine economical and efficient compared to other open pit iron ore mines.
Once the ore has been extracted from the pit it will be loaded onto haul truck that will
transport it to the primary crusher. The material will be crushed and transported through the
processing facility on conveyor belts, where it will go through secondary crushers until it
reaches correct specifications. The material will then be transported directly to rail cars, where
it will be hauled via railway off the site. The iron ore that leaves the site will be used in steel
production, afterwards the products will be used in the nearby cites of Philadelphia and New
York City. The total amount of production that the mine plans to achieve is seven million tons of
iron ore per year.
The company plans to have two years of pre-production and then the mine will stay in
production for over 50 years. The mine will last two years and begin when the mining is
complete. All materials that are still usable will be taken to other mine sites owned by REL Co.
and employees will be transferred to other sites if desired. The reclamation process will remain
under observation by the company indefinitely or until the land is sold.
Bass River Mine Site
Summary and Conclusions 146
16.2 Technical Issues and Concerns
One of the most important concerns at Bass River Mine is the health and safety of the
personnel, while the mine is being worked. Not addressing the safety and health of workers
effectively could lead to economic losses, injuries to personnel and even fatalities if not dealt
with in a timely manner. Bass River Mine will be in constant contact with the Mining Safety and
Health Administration (MSHA) to ensure the health and safety of all personnel at the mine.
There will be timely safety training conducted by MSHA inspectors and administrative certified
staff. An emergency response plan (ERP) will be written before development at the mine
commences, and all the workers will be provided access the ERP. A minimum of four
inspections will be conducted by MSHA throughout the course of a year to ensure all the health
and safety requirements at the mine site are met. Internal inspections will be conducted by REL
Co. to ensure Bass River Mine is going above and beyond MSHA regulations. Maintenance of
mobile and electrical equipment, regulating water quality, regulating air quality and regular
maintenance of haul roads are some of the issues that the risk management team at REL Co.
will address during the development phase of the mine.
Another issue that will be regularly addressed at Bass River Mine is the environmental
impact of surface mining. Mine administrative staff will remain in close contact with the
Environmental Protection Agency (EPA) from the permitting to the reclamation phase. The
Corporate Social Responsibility (CSR) team will ensure that compliance is met at all times with
any environmental issue. Sustainable development will be a huge part of reclamation after
operation at the mine ceases. All personnel will be trained to handle the CSR guidelines that are
Bass River Mine Site
Summary and Conclusions 147
devised for Bass River Mine. Just as for health and safety an ‘above and beyond’ approach will
be taken for all environmental impacts of mining.
16.3 Financial Feasibility
REL Co.’s Bass River operation has the potential to make strong profits throughout the
life of the mine. Cost assessments were completed and included expenses for equipment,
property, facilities, personnel, processing, handling, reclamation and permitting. Selling prices
will vary based on grade and contractual agreements, but on average, selling price for the iron
ore will be $158.30. Through a discounted cash flow-rate of return (DCF-ROR) analysis, the rate
of return was determined to be 280%. This rate of return surpasses the usual minimal attractive
rate of return (MARR) for industry by a large margin. At such a high rate, fluctuations in price
will have minimal effects on profit. Net present value for the operation is $5.35 billion with a
discount rate of 11%.
After initial development, annual production of approximately seven million tons will
yield sales revenues of $1.12 billion per year. Taxes, operating costs and other expenses will
reduce a significant amount of sales revenue. Cash flow, with all applicable deductions, will be
$694 million from year three until the closure process commences. Positive cash flow will begin
at the end of year three with enough profit to cover initial capital investment. Additional capital
investment will be necessary to replace equipment. An estimated equipment life of 30 years
indicates a single replacement cycle. The output of Bass River Mine will provide large profits for
REL Co. and shareholder for decades to come.
Bass River Mine Site
Summary and Conclusions 148
16.4 Conclusion and Recommendations
The feasibility study for Bass River Mine shows huge profit in rate of return and quick
return on investment. The financial analysis tools used indicate that Bass River Mine will be a
very attractive for investors. The capital investment is quite large so it will take some time to
acquire funds from investment bankers or other third parties. The local area may not be
equipped to handle such a large operation. During permitting, steps will be taken to advance
local industry and better ready Bass River and the surrounding areas. Permitting will take a long
time due to the extensive nature of the project so the permitting process should be started as
soon as possible. The Bass River Mine will prove to be one of the largest producers of iron ore
in the country once production begins in full.
Bass River Mine Site
References 149
References
2010 US Census Data. “Population Search, Bass River Township, NJ.” <http://2010.census.gov/2010census/popmap/ipmtext.php>
“401(k) Plans for Small Businesses.” United States Department of Labor. 19 Jan. 2013. <http://www.dol.gov/ebsa/publications/401kplans.html>
"About Us." Atlantic City New Jersey. Atlantic City Convention & Visitors Authority, n.d. Web. 19 Sept. 2012. <http://www.atlanticcitynj.com/about/weather.aspx>
“Benchmarking Your Maintenance Costs.” FMLink. Jan. 2010. <http://www.fmlink.com/article.cgi?type=Benchmarking&title=Benchmarking%20Your%20Maintenance%20Costs&pub=Facility%20Issues&id=40555&mode=source>
Blastland, Michael. "Go Figure: Why Does Every Person Need 200kg of Steel a Year?" BBC News. BBC, 24 Nov. 2011. Web. 13 Sept. 2012. <http://www.bbc.co.uk/news/magazine-15863049>
Bureau of Labor Statistics. “Labor force data by county, not seasonally adjusted, June 2011-July 2012.” <http://www.bls.gov/lau/laucntycur14.txt>
“Case 1150K.” Case Construction. November 2012. <http://www.casece.com/en_us/Equipment/Crawler-Dozers/Pages/1150K.aspx>
"Census Bureau Homepage." Census Bureau Homepage. N.p., n.d. Web. 21 Mar. 2013. <http://www.census.gov/#>
“Cohansey Formation.” Ocean Drilling Program. September 2002. <http://www-odp.tamu.edu/publications/174AXSIR/chap_05/c5_f2.htm>
"Corporation Business Tax Overview." State of New Jersey Department of the Treasury. State of New Jersey, 23 Sept 2010. Web. 27 Mar 2013. <http://nj.gov/treasury/taxation/corp_over.shtml>
“Costs of Chain Link Fencing.” HomeWyse Design Systems. 2 Nov. 2012. <http://www.homewyse.com/costs/cost_of_chain_link_fencing.html>
Demirmen, Ferruh. "JPT Online Headlines." JPT Online. Distinguished Author Series, May 2007. Web. 18 Oct. 2012. <http://www.spe.org/jpt/print/archives/2007/05/JPT2007_05_DA_series>
“Designing Blasting Patterns Using Empirical Formulas.” Twin Cities Mining Research Center (TCMRC). January 31 2013. <http://arblast.osmre.gov/downloads/USBM/IC%208550%20Blast%20Patterns%20Using%20Emperical%20Formula.pdf>
Bass River Mine Site
References 150
Drysdale, Estelle. (2009). “Chapter 2: Surface Mining Methods.” <http://blogs.up.ac.za/weblog/media/file/estelle/adobe%20files/ch2_before.pdf>
Encyclopedia Britannica. “Core Drilling and Rotary Drilling.” <http://www.britannica.com/EBchecked/topic/122975/coal-mining/81654/Core-drilling-and rotary-drilling>
"Federal Corporate Tax Rates." Marie Landel & Associates. United States IRS. Web. 27 Mar 2013. <http://www.marielandel.com/federal-corporate-taxe-rates.html>
Formation of Bog Iron. “How Bog Iron Forms.” < http://www.mcvsd.org/mccs/geo-hths/bogiron.htm>
“Fused Quartz Properties and Usage Guide.” Momentive Performance Materials Quartz. Feb 1996. <http://www.quartz.com/gedata.html>
Geology of National Parks. “Tertiary Stratigraphic Units of the Coastal Plain.” < http://3dparks.wr.usgs.gov/nyc/coastalplain/tertiary.htm>
Google Maps, 2012. “Bass River, NJ” [Terrain Map]. Online: <http://maps.google.com/maps?hl=en&tab=wl>
Google Maps, 2012. “Bass River, NJ” [Satellite Map]. Online: <http://maps.google.com/maps?hl=en&tab=wl>
“Gravel Pricing Guide Per Ton.” Gravel Tech. 14 Sept. 2012. <http://www.graveltech.com/priceguide.html>
“Group Health Insurance Plans.” State of Delaware. 17 Jan. 2013. <http://ben.omb.delaware.gov/medical/documents/fy13_published_rates_010113.pdf>
“Haul Road Inspection Handbook.” MSHA Handbook Series. June 1999. <http://www.msha.gov/READROOM/HANDBOOK/PH99-I-4.pdf>
“Hydraulic Rock Breaker.” Sanha Equipment. November 2012. <http://www.tjskl.org.cn/products-search/cz5099566/hydraulic_rock_breaker-pz53701e8.html>
"Iron Ore Monthly Price - US Dollars per Dry Metric Ton." Index Mundi. N.p., Feb. 2013. Web. 20 Mar. 2013. <http://www.indexmundi.com/commodities/?commodity=iron-ore>
Karmis, M., 2012a. “H-S Measurements” [PowerPoint slides]. MinE 4514 Health, Safety and Risk Management. <https://scholar.vt.edu/portal/site/b6b5801f-e26b-4866-bac0-3b40ab739d22/page/f2c48809-5975-4031-a94a-d02020d64497>
“Land Values-2012 Statistics.” National Agriculture Statistics Service-United States Department of Agriculture, USDA. Aug 2012. Web. 19 Mar. 2013. <http://www.nass.usda.gov/Publications/Todays_Reports/reports/land0812.pdf>
Bass River Mine Site
References 151
Luttrell, Prof. Gerald H. "Materials Handling: Conveyor Design." Virginia Tech, Blacksburg. Fall 2007.
"Magnesium and Magnesia from Brines." Epa. Environmental Protection Agency, 1992. Web. 7 Feb. 2013. <http://www.epa.gov/osw/nonhaz/industrial/special/mining/minedock/id/id4-msi.pdf>
Maps, Google. Bass River, NJ. N.d. Map. ww.google.com, Bass River, NJ. Web. 4 May 2013. <https://maps.google.com/maps?q=google maps bass river mine&aq=f&um=1&ie=UTF-8&hl=en&sa=N&tab=wl>
Maps, Google. 75 Academy Drive, Hammonton, NJ. N.d. Map. google.com, Hammonton, NJ.
Web. 4 May 2013. <https://maps.google.com/maps?hl=en&tab=wl>
"Matches Provides Conveyor Capital Cost - Apron, Belt, Pneumatic, Roller, Screw, vibrating." Conveyor Capital Cost. Matche, n.d. Web. 12 Feb. 2013.
Mass, Weight, Density and Specific Gravity of Bulk Materials. “Density of Materials.” <http://www.simetric.co.uk/si_materials.htm>
“May 2011 National Industry-Specific Occupational Employment and Wage Estimates.” Bureau of Labor Statitics. 19 Jan. 2013. <http://www.bls.gov/oes/current/naics4_212200.htm>
Mine & Mill Costs Estimator’s Guide, 2012. “Capital and Operating Costs.” <http://costs.infomine.com/>
“Mine Safety Act & Pits and Quarries Regulations.” New Jersey Department of Labor and Workforce Development (LWD). Web. 7 Nov. 2012. <http://lwd.dol.state.nj.us/labor/lsse/laws/Mine_Safety_Act.html>
"Mine Safety and Health Administration (MSHA) - Home Page." Mine Safety and Health Administration (MSHA) - Home Page. N.p., n.d. Web. 09 Nov. 2012. <http://www.msha.gov/>
“Mineral Resources.” Find the Data. September 2012. <http://mineral-resources.findthedata.org/d/d/United-States/New-Jersey>
Mineral Resources On-Line Spatial Data. “Cohansey Formation.” <http://tin.er.usgs.gov/geology/state/sgmc-unit.php?unit=NJTch%3B0>
Mineral Resources On-Line Spatial Data. “Lower Kirkwood Formation.” <http://mrdata.usgs.gov/geology/state/sgmc-unit.php?unit=NJTkl%3B0>
“Mining and Quarrying Activity.” New Jersey Department of Environmental Protection. January 23, 2013. < http://www.nj.gov/dep/dwq/r13.htm>
“Mining Glossary.” Great Mining. 11 Sept. 2012. <http://www.greatmining.com/glossary-o.html>
Bass River Mine Site
References 152
“Modular Office Designs.” Modular Technologies Inc. 6 Nov. 2012. <http://www.mtimodtech.com/office.html>
"Monthly Humidity Averages for New Jersey." - Current Results. Current Results Nexus, n.d. Web. 19 Sept. 2012. <http://www.currentresults.com/Weather/New-Jersey/humidity-by-month.php>
National Center for Educational Statistics, 2012. “Bass River, NJ” [School District Demographic Map]. Online: <http://nces.ed.gov/surveys/sdds/ed/index.asp>
“New Jersey Department of Environmental Protection (NJDEP) – Home Page.” New Jersey Department of Environmental Protection. Web. 5 March 2013. <http://www.state.nj.us/dep/>
“Pole Barn Pricing.” Hansen Pole Buildings. 8 Nov. 2012. <http://www.hansenpolebuildings.com/pole-barn-prices.php>
Robertson, A., Dr., and S. Shaw. "Mine Closure." Infomine. Infomine, n.d. Web. 1 Feb. 2013. <http://www.infomine.com/library/publications/docs/E-Book%2002%20Mine%20Closure.pdf>
Rock Ware. N.p.. Web. 31 Jan 2013. <http://www.rockware.com/assets/products/119/overview/lobby/rkpkdemo2b.jpg>
Science Direct. N.p.. Web. 31 Jan 2013. <http://www.sciencedirect.com/science?_ob=MiamiCaptionURL&_method=retrieve&_eid=1-s2.0-S0266352X07000663&_image=1-s2.0-S0266352X07000663-gr5.jpg&_ba=&_fmt=full&_orig=na&_issn=0266352X&_pii=S0266352X07000663&_acct=C000038698&_version=1&_urlVersion=0&_userid=691352&md5=3f415d9fabdefa4b977768328470ff8>
Sinclair, Alastair J., Dr. "Mineral Resource Estimation." EduMine. N.p., n.d. Web. 18 Oct. 2012. <http://www.edumine.com/courses/short-courses/mineral-resource-estimation-spok/>
“Smart Tank Two.” Fittzsimmons Technologies. 12 Nov. 2012. <http://www.fueltanks.com/Downloads/PDF/SmartTank2.pdf>
“State of New Jersey.” New Jersey Geological and Water Survey. September 2012. <http://www.state.nj.us/dep/njgs/pricelst/ofmap/ofm60.pdf>
“Steel Buildings FAQ.” Armstrong Steel Buildings. 11 Nov. 2012. <http://www.armstrongsteelbuildings.com/steel-buildings-faqs/steel-building-cost-per-square-foot.php>
“Surface Mining Equipment.” Caterpillar Mining. November 2012. <https://mining.cat.com/cda/layout?m=435115>
“Surplus Mining Equipment-Electrical-Substations.” Mining Surplus. 13 Nov. 2012. <http://www.miningsurplus.com/equipment/substations>
Bass River Mine Site
References 153
“Tandem Water Trucks.” Truck Works Incorporated. November 2012. <http://www.truckworksinc.com/skin1/images/equip-images/Tandem_Axle_Water_Trucks_18.jpg>
“The Blaster’s Guide.” Austin Explosives. January 2013. <http://www.austinpowder.com/blastersguide/>
"Virginia Requirements of New Permits."DMME.virginia.gov. N.p.. Web. 7 Mar 2013. <http://www.dmme.virginia.gov/dmm/pdf/permitting/newpermitbrochure.pdf>
Wang, Quinfie, Jun Deng, Huan Lui, Liquiang Yang, Li Wan, and Ruichang Zhang. "Ore Geology Reviews." ScienceDirect.com. N.p., Feb. 2010. Web. 18 Oct. 2012. <http://www.sciencedirect.com/science/article/pii/S0169136809000985>
Bass River Mine Site
Appendices 154
Appendices
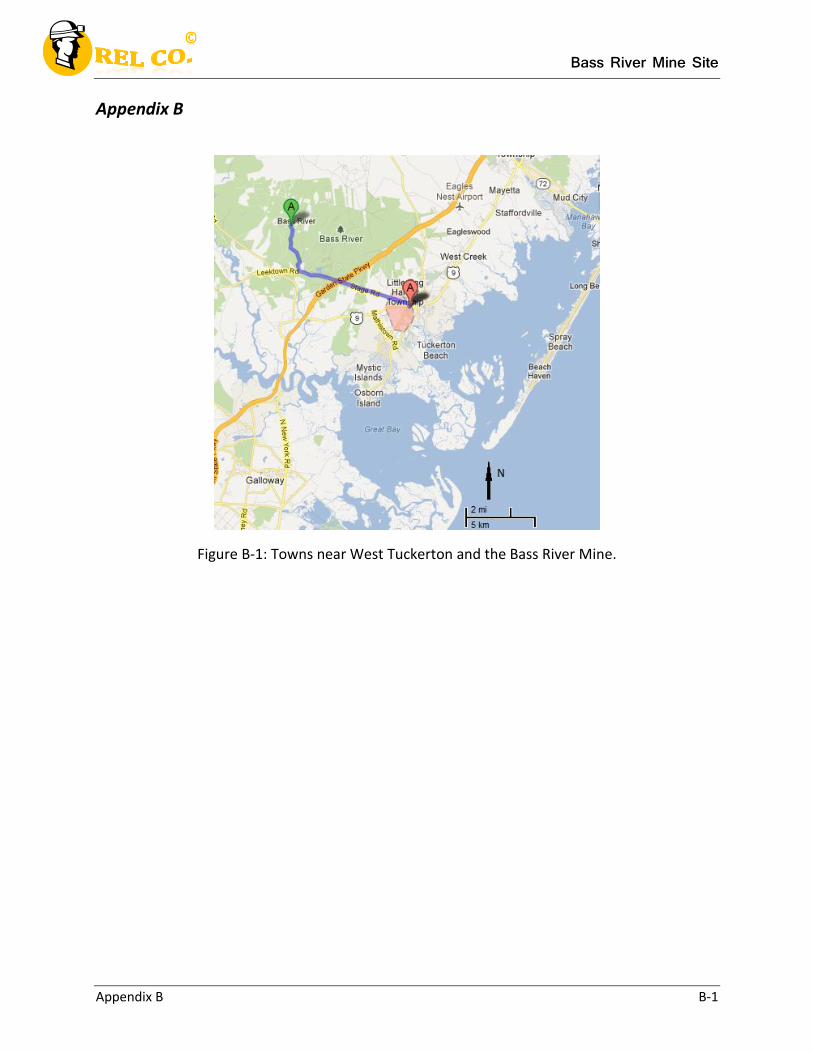
Bass River Mine Site
Appendix B B-1
Appendix B
Figure B-1: Towns near West Tuckerton and the Bass River Mine.
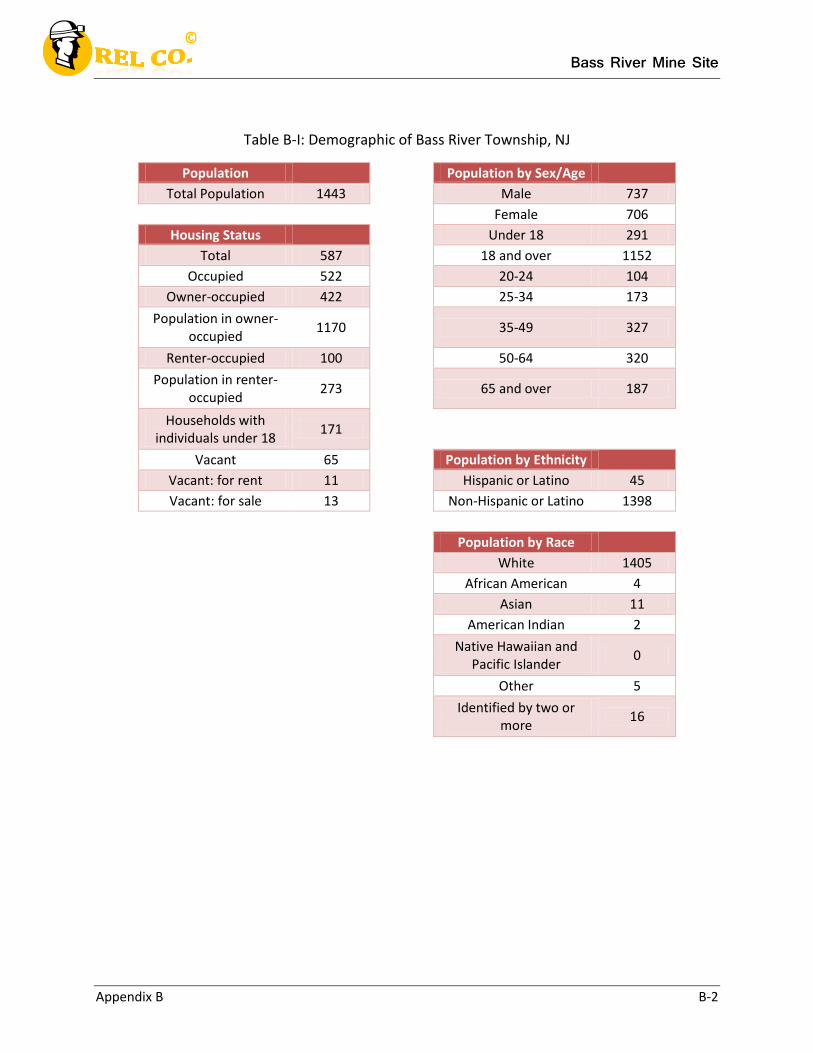
Bass River Mine Site
Appendix B B-2
Table B-I: Demographic of Bass River Township, NJ
Population
Population by Sex/Age
Total Population 1443
Male 737
Female 706
Housing Status
Under 18 291
Total 587
18 and over 1152
Occupied 522
20-24 104
Owner-occupied 422
25-34 173
Population in owner-occupied
1170
35-49 327
Renter-occupied 100
50-64 320
Population in renter-occupied
273
65 and over 187
Households with individuals under 18
171
Vacant 65
Population by Ethnicity
Vacant: for rent 11
Hispanic or Latino 45
Vacant: for sale 13
Non-Hispanic or Latino 1398
Population by Race
White 1405
African American 4
Asian 11
American Indian 2
Native Hawaiian and
Pacific Islander 0
Other 5
Identified by two or
more 16
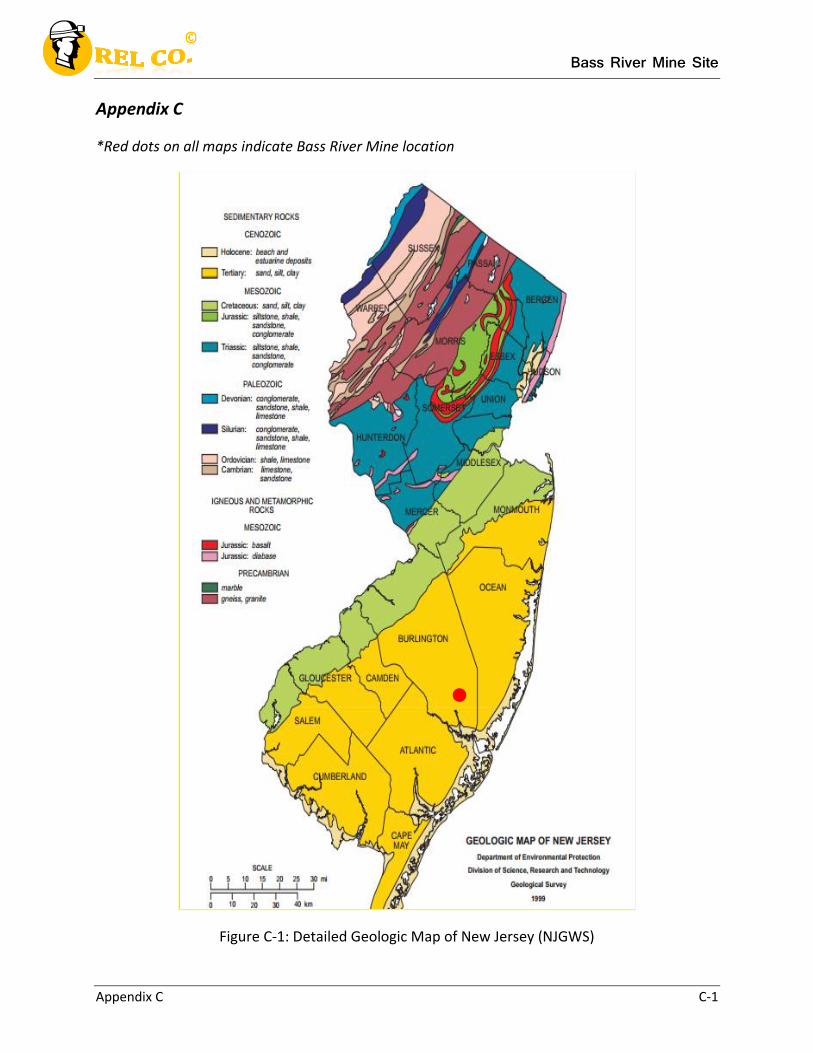
Bass River Mine Site
Appendix C C-1
Appendix C
*Red dots on all maps indicate Bass River Mine location
Figure C-1: Detailed Geologic Map of New Jersey (NJGWS)
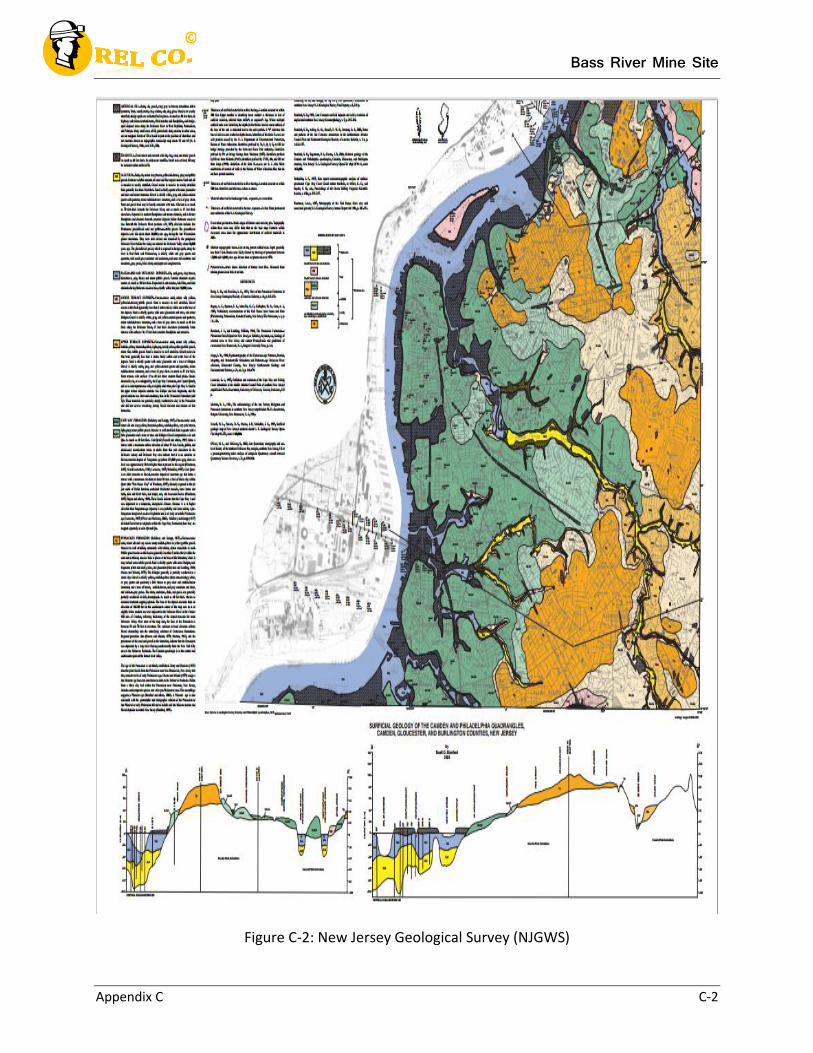
Bass River Mine Site
Appendix C C-2
Figure C-2: New Jersey Geological Survey (NJGWS)
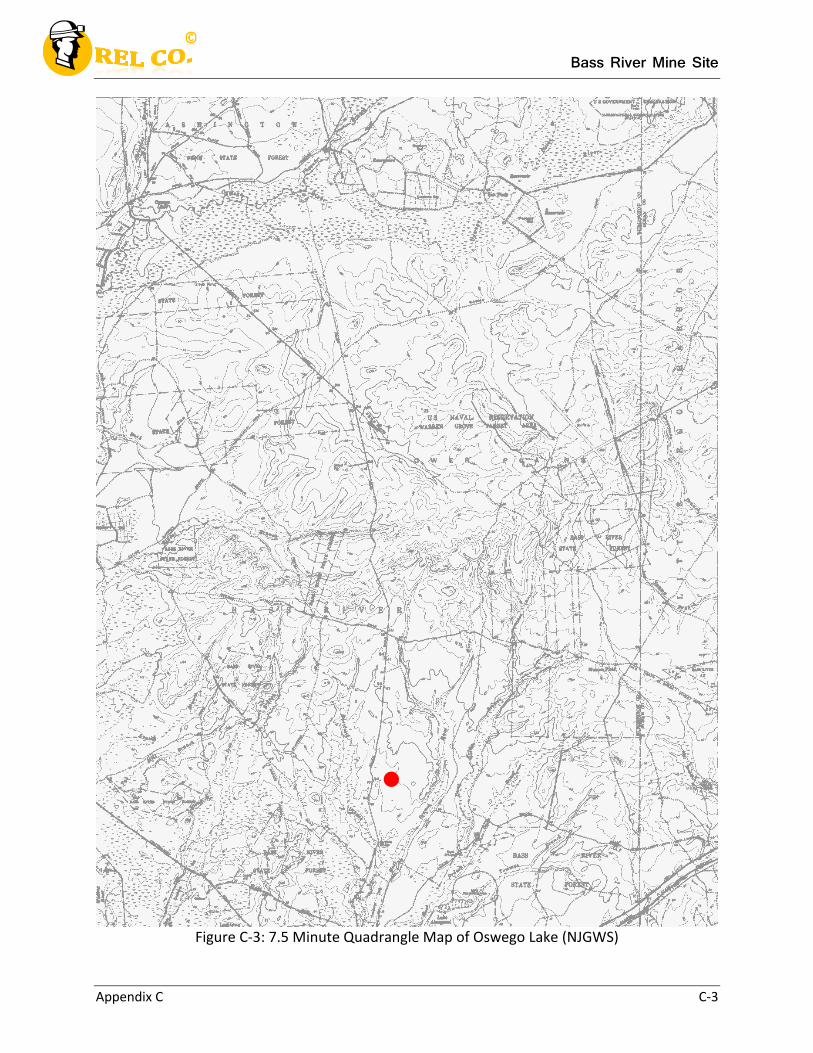
Bass River Mine Site
Appendix C C-3
Figure C-3: 7.5 Minute Quadrangle Map of Oswego Lake (NJGWS)
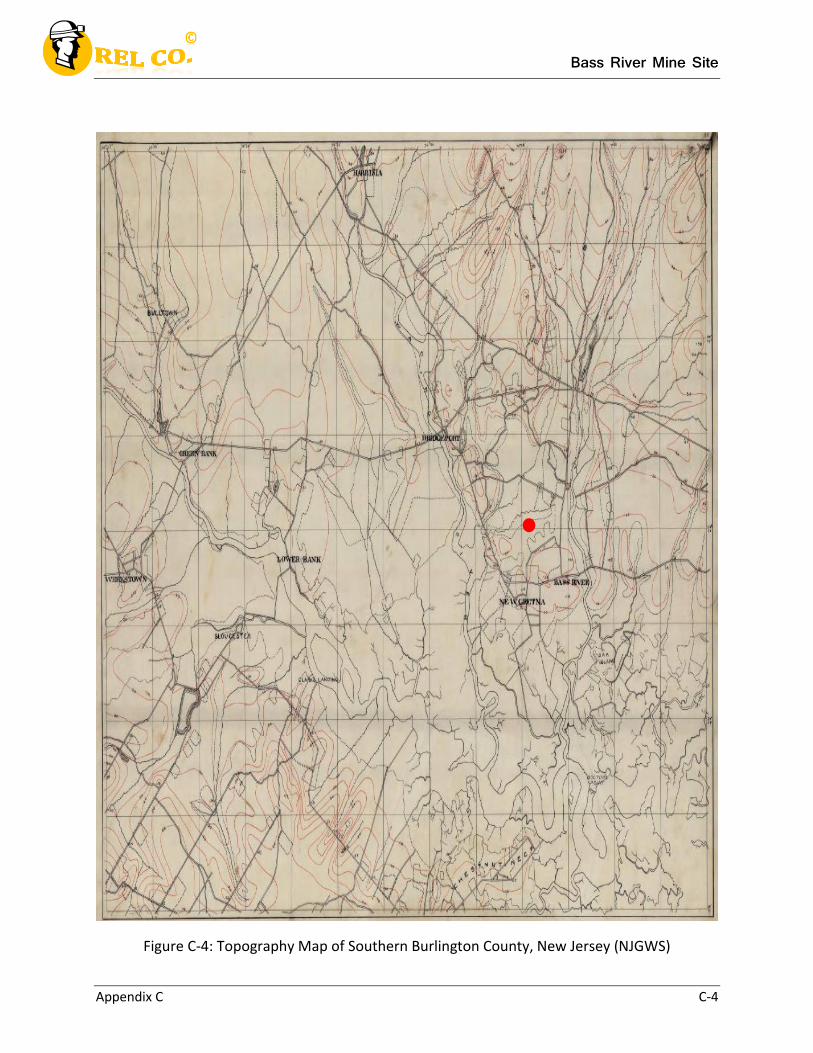
Bass River Mine Site
Appendix C C-4
Figure C-4: Topography Map of Southern Burlington County, New Jersey (NJGWS)
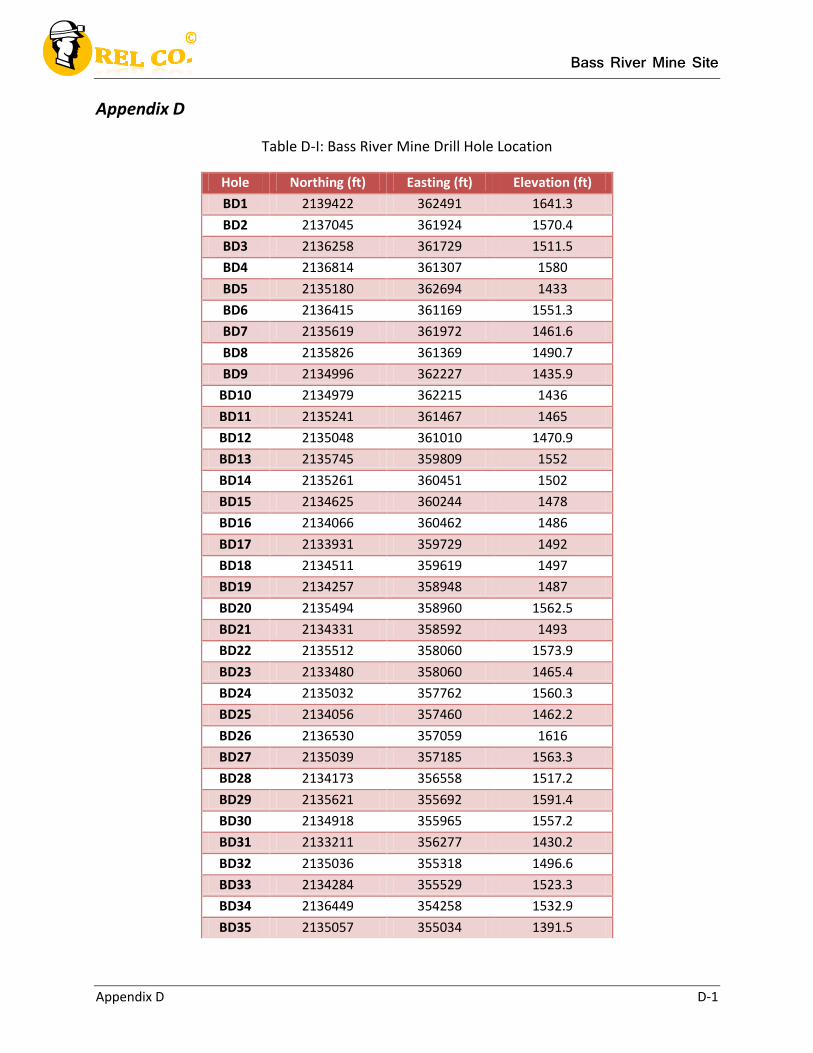
Bass River Mine Site
Appendix D D-1
Appendix D
Table D-I: Bass River Mine Drill Hole Location
Hole Northing (ft) Easting (ft) Elevation (ft)
BD1 2139422 362491 1641.3
BD2 2137045 361924 1570.4
BD3 2136258 361729 1511.5
BD4 2136814 361307 1580
BD5 2135180 362694 1433
BD6 2136415 361169 1551.3
BD7 2135619 361972 1461.6
BD8 2135826 361369 1490.7
BD9 2134996 362227 1435.9
BD10 2134979 362215 1436
BD11 2135241 361467 1465
BD12 2135048 361010 1470.9
BD13 2135745 359809 1552
BD14 2135261 360451 1502
BD15 2134625 360244 1478
BD16 2134066 360462 1486
BD17 2133931 359729 1492
BD18 2134511 359619 1497
BD19 2134257 358948 1487
BD20 2135494 358960 1562.5
BD21 2134331 358592 1493
BD22 2135512 358060 1573.9
BD23 2133480 358060 1465.4
BD24 2135032 357762 1560.3
BD25 2134056 357460 1462.2
BD26 2136530 357059 1616
BD27 2135039 357185 1563.3
BD28 2134173 356558 1517.2
BD29 2135621 355692 1591.4
BD30 2134918 355965 1557.2
BD31 2133211 356277 1430.2
BD32 2135036 355318 1496.6
BD33 2134284 355529 1523.3
BD34 2136449 354258 1532.9
BD35 2135057 355034 1391.5
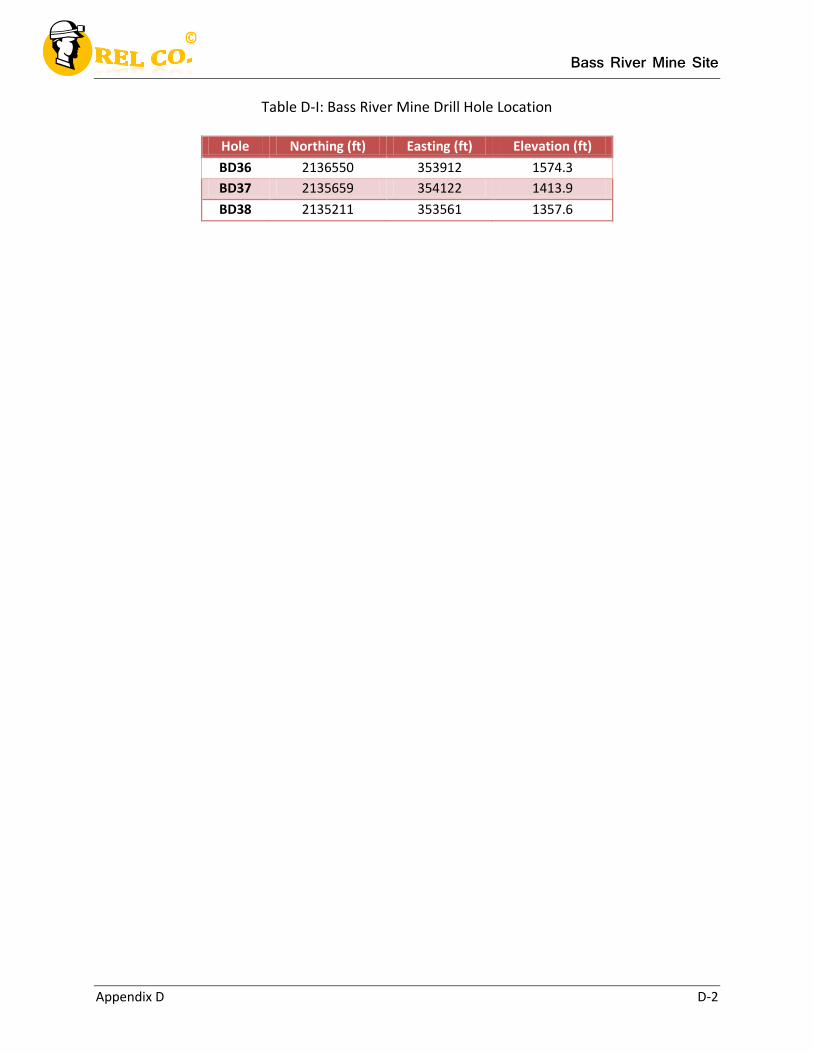
Bass River Mine Site
Appendix D D-2
Table D-I: Bass River Mine Drill Hole Location
Hole Northing (ft) Easting (ft) Elevation (ft)
BD36 2136550 353912 1574.3
BD37 2135659 354122 1413.9
BD38 2135211 353561 1357.6

Bass River Mine Site
Appendix D D-3
Table D-II: Bass River Mine Drill Hole Assays
Hole From (ft) To (ft) MgFe (%)
BD1 0 20 0
BD1 20 70 16.38
BD1 70 120 23.87
BD1 120 170 20.5
BD1 170 220 21.21
BD1 220 270 19.54
BD1 270 320 26.21
BD1 320 370 22.69
BD1 370 395 17.35
BD2 0 20 0
BD2 20 70 20.16
BD2 70 120 20.46
BD2 120 170 16.108
BD2 170 220 11.55
BD2 220 270 20.37
BD2 270 320 22.21
BD2 320 370 20.17
BD2 370 390 14.46
BD3 0 5 0
BD3 5 55 19.44
BD3 55 105 10.62
BD3 105 155 20.1
BD3 155 205 19.1
BD3 205 255 17.23
BD3 255 305 25.8
BD3 305 355 27.41
BD3 355 405 21.88
BD3 405 410 17.54
BD4 0 13 0
BD4 13 63 18.22
BD4 63 113 20.51
BD4 113 163 19.52
BD4 163 213 23.63
BD4 213 263 29.17
BD4 263 313 25.08
BD4 313 330 23.05
BD5 0 51 0
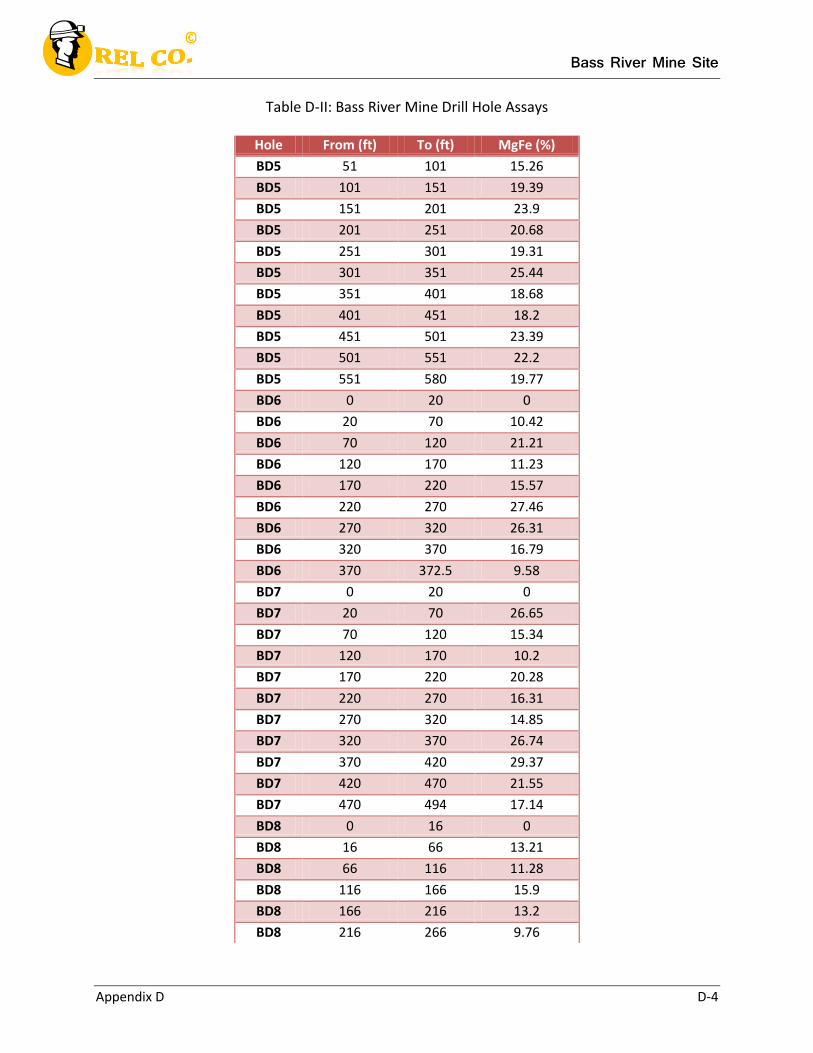
Bass River Mine Site
Appendix D D-4
Table D-II: Bass River Mine Drill Hole Assays
Hole From (ft) To (ft) MgFe (%)
BD5 51 101 15.26
BD5 101 151 19.39
BD5 151 201 23.9
BD5 201 251 20.68
BD5 251 301 19.31
BD5 301 351 25.44
BD5 351 401 18.68
BD5 401 451 18.2
BD5 451 501 23.39
BD5 501 551 22.2
BD5 551 580 19.77
BD6 0 20 0
BD6 20 70 10.42
BD6 70 120 21.21
BD6 120 170 11.23
BD6 170 220 15.57
BD6 220 270 27.46
BD6 270 320 26.31
BD6 320 370 16.79
BD6 370 372.5 9.58
BD7 0 20 0
BD7 20 70 26.65
BD7 70 120 15.34
BD7 120 170 10.2
BD7 170 220 20.28
BD7 220 270 16.31
BD7 270 320 14.85
BD7 320 370 26.74
BD7 370 420 29.37
BD7 420 470 21.55
BD7 470 494 17.14
BD8 0 16 0
BD8 16 66 13.21
BD8 66 116 11.28
BD8 116 166 15.9
BD8 166 216 13.2
BD8 216 266 9.76
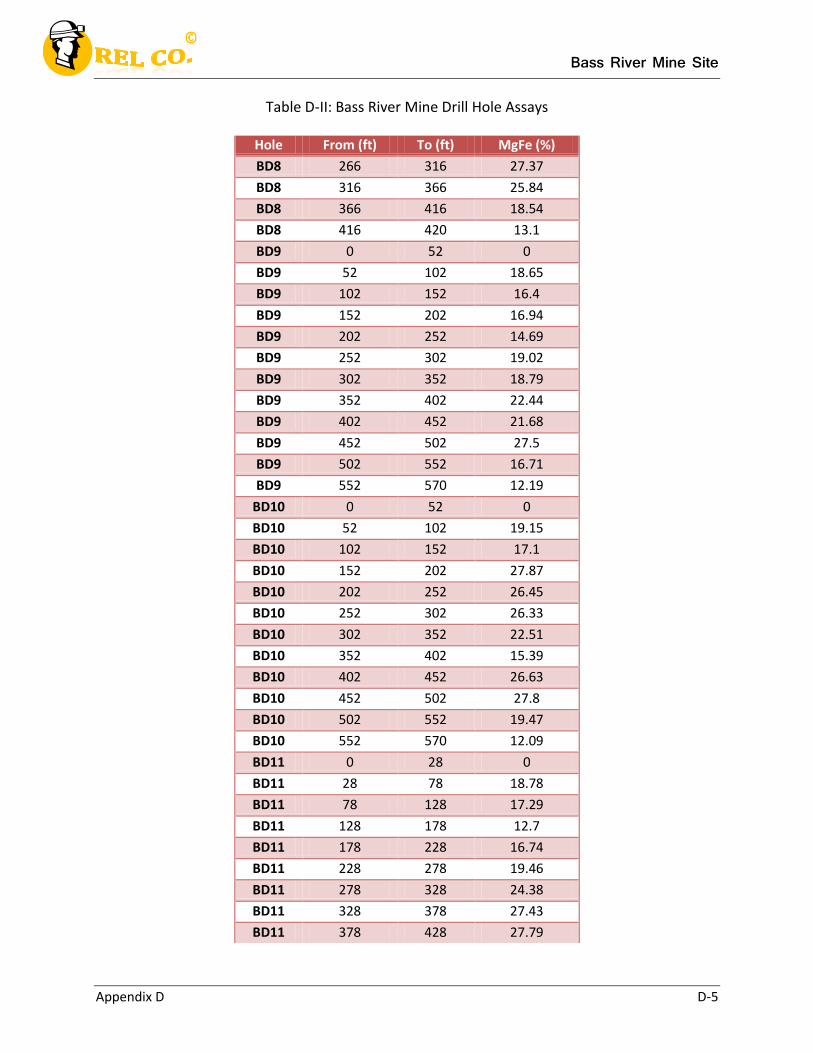
Bass River Mine Site
Appendix D D-5
Table D-II: Bass River Mine Drill Hole Assays
Hole From (ft) To (ft) MgFe (%)
BD8 266 316 27.37
BD8 316 366 25.84
BD8 366 416 18.54
BD8 416 420 13.1
BD9 0 52 0
BD9 52 102 18.65
BD9 102 152 16.4
BD9 152 202 16.94
BD9 202 252 14.69
BD9 252 302 19.02
BD9 302 352 18.79
BD9 352 402 22.44
BD9 402 452 21.68
BD9 452 502 27.5
BD9 502 552 16.71
BD9 552 570 12.19
BD10 0 52 0
BD10 52 102 19.15
BD10 102 152 17.1
BD10 152 202 27.87
BD10 202 252 26.45
BD10 252 302 26.33
BD10 302 352 22.51
BD10 352 402 15.39
BD10 402 452 26.63
BD10 452 502 27.8
BD10 502 552 19.47
BD10 552 570 12.09
BD11 0 28 0
BD11 28 78 18.78
BD11 78 128 17.29
BD11 128 178 12.7
BD11 178 228 16.74
BD11 228 278 19.46
BD11 278 328 24.38
BD11 328 378 27.43
BD11 378 428 27.79

Bass River Mine Site
Appendix D D-6
Table D-II: Bass River Mine Drill Hole Assays
Hole From (ft) To (ft) MgFe (%)
BD11 428 475 16.13
BD12 0 20 0
BD12 20 70 21.04
BD12 70 120 15.4
BD12 120 170 17.66
BD12 170 220 22.96
BD12 220 270 18.37
BD12 270 320 17.98
BD12 320 370 26.1
BD12 370 420 25.41
BD12 420 470 18.45
BD12 470 480 9.47
BD13 0 9 0
BD13 9 59 21.03
BD13 59 109 21.57
BD13 109 159 20.57
BD13 159 209 23.06
BD13 209 259 26.35
BD13 259 309 22.97
BD13 309 332 16.98
BD14 0 6 0
BD14 6 56 14.41
BD14 56 106 16.79
BD14 106 156 19.16
BD14 156 206 14.88
BD14 206 256 17,12
BD14 256 306 24.31
BD14 306 356 25.17
BD14 356 406 18.21
BD14 406 420 10.65
BD15 0 15 0
BD15 15 65 25.13
BD15 65 115 23.49
BD15 115 165 26.21
BD15 165 215 13.18
BD15 215 265 16.57
BD15 265 315 19.69

Bass River Mine Site
Appendix D D-7
Table D-II: Bass River Mine Drill Hole Assays
Hole From (ft) To (ft) MgFe (%)
BD15 315 365 21.62
BD15 365 415 24.4
BD15 415 435 14.91
BD16 0 44 0
BD16 44 94 12.64
BD16 94 144 17.01
BD16 144 194 21.36
BD16 194 244 15.95
BD16 244 294 20.2
BD16 294 344 21.26
BD16 344 394 12.78
BD16 394 444 26.47
BD16 444 494 21.6
BD16 494 544 20.61
BD16 544 550 12.28
BD17 0 50 12.71
BD17 50 100 16.19
BD17 100 150 19.7
BD17 150 200 13.66
BD17 200 250 23.23
BD17 250 300 21.15
BD17 300 350 15.57
BD17 350 400 17.8
BD17 400 450 22.65
BD17 450 500 22.31
BD17 500 515 10.94
BD18 0 23 0
BD18 23 73 26.11
BD18 73 123 26.02
BD18 123 173 12.09
BD18 173 223 20.41
BD18 223 273 19.48
BD18 273 323 16.51
BD18 323 373 22.3
BD18 373 423 24.35
BD18 423 450 15.86
BD19 0 20 0

Bass River Mine Site
Appendix D D-8
Table D-II: Bass River Mine Drill Hole Assays
Hole From (ft) To (ft) MgFe (%)
BD19 20 70 25.72
BD19 70 120 17.07
BD19 120 170 20.61
BD19 170 220 23.05
BD19 220 270 22.57
BD19 270 320 21.07
BD19 320 370 22.11
BD19 370 420 19.37
BD20 0 25 5.09
BD20 25 75 14.63
BD20 75 125 19.18
BD20 125 175 8.57
BD20 175 225 22.69
BD20 225 275 23.28
BD20 275 325 21.29
BD20 325 345 15.84
BD21 0 31 0
BD21 31 81 21.99
BD21 81 131 13.92
BD21 131 181 23.11
BD21 181 231 18.15
BD21 231 281 16.58
BD21 281 331 21.12
BD21 331 381 25.84
BD21 381 431 14.71
BD21 431 439 9.43
BD22 0 23 0
BD22 23 73 17.84
BD22 73 123 16.08
BD22 123 173 20.9
BD22 173 223 20.57
BD22 223 273 21.16
BD22 273 323 26.63
BD22 323 373 21.13
BD22 373 391 16.5
BD23 0 53 0
BD23 53 103 16.15
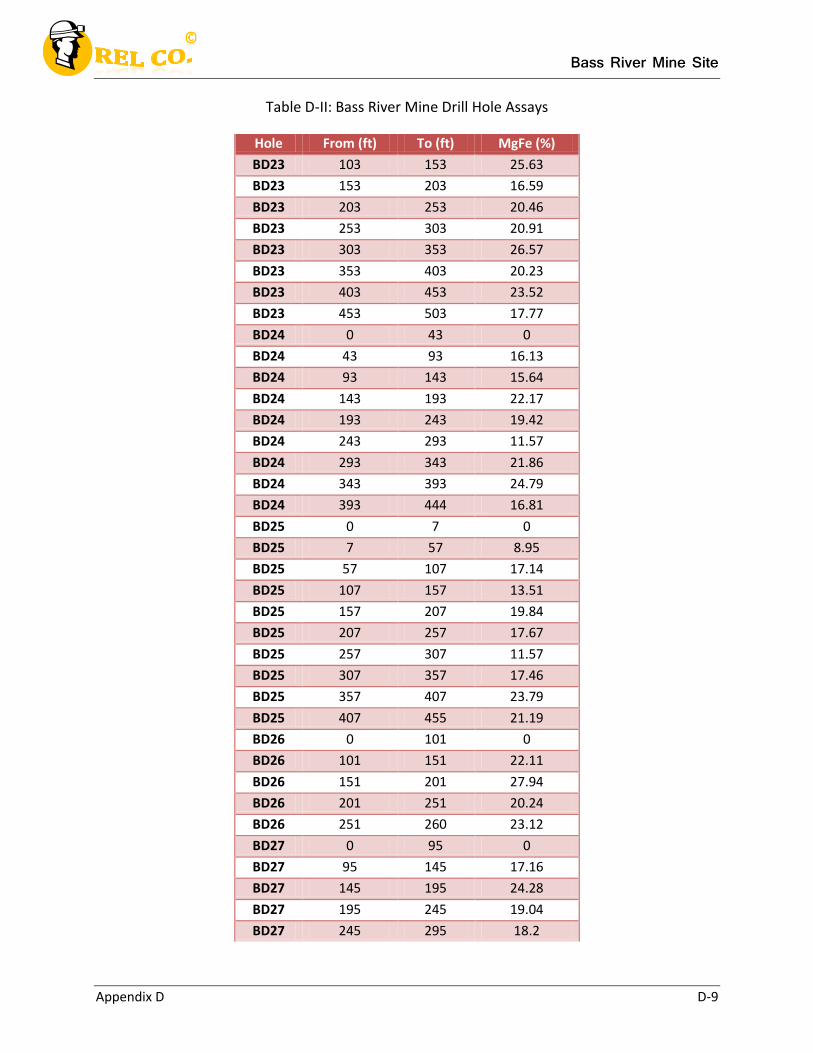
Bass River Mine Site
Appendix D D-9
Table D-II: Bass River Mine Drill Hole Assays
Hole From (ft) To (ft) MgFe (%)
BD23 103 153 25.63
BD23 153 203 16.59
BD23 203 253 20.46
BD23 253 303 20.91
BD23 303 353 26.57
BD23 353 403 20.23
BD23 403 453 23.52
BD23 453 503 17.77
BD24 0 43 0
BD24 43 93 16.13
BD24 93 143 15.64
BD24 143 193 22.17
BD24 193 243 19.42
BD24 243 293 11.57
BD24 293 343 21.86
BD24 343 393 24.79
BD24 393 444 16.81
BD25 0 7 0
BD25 7 57 8.95
BD25 57 107 17.14
BD25 107 157 13.51
BD25 157 207 19.84
BD25 207 257 17.67
BD25 257 307 11.57
BD25 307 357 17.46
BD25 357 407 23.79
BD25 407 455 21.19
BD26 0 101 0
BD26 101 151 22.11
BD26 151 201 27.94
BD26 201 251 20.24
BD26 251 260 23.12
BD27 0 95 0
BD27 95 145 17.16
BD27 145 195 24.28
BD27 195 245 19.04
BD27 245 295 18.2
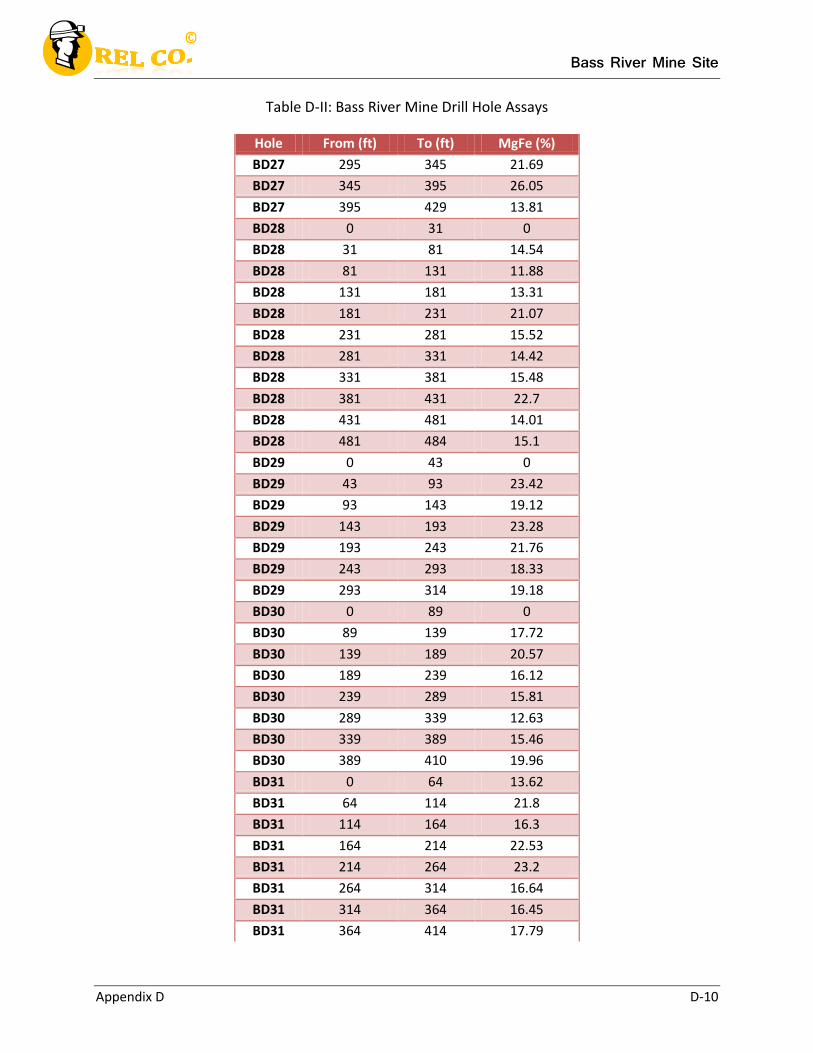
Bass River Mine Site
Appendix D D-10
Table D-II: Bass River Mine Drill Hole Assays
Hole From (ft) To (ft) MgFe (%)
BD27 295 345 21.69
BD27 345 395 26.05
BD27 395 429 13.81
BD28 0 31 0
BD28 31 81 14.54
BD28 81 131 11.88
BD28 131 181 13.31
BD28 181 231 21.07
BD28 231 281 15.52
BD28 281 331 14.42
BD28 331 381 15.48
BD28 381 431 22.7
BD28 431 481 14.01
BD28 481 484 15.1
BD29 0 43 0
BD29 43 93 23.42
BD29 93 143 19.12
BD29 143 193 23.28
BD29 193 243 21.76
BD29 243 293 18.33
BD29 293 314 19.18
BD30 0 89 0
BD30 89 139 17.72
BD30 139 189 20.57
BD30 189 239 16.12
BD30 239 289 15.81
BD30 289 339 12.63
BD30 339 389 15.46
BD30 389 410 19.96
BD31 0 64 13.62
BD31 64 114 21.8
BD31 114 164 16.3
BD31 164 214 22.53
BD31 214 264 23.2
BD31 264 314 16.64
BD31 314 364 16.45
BD31 364 414 17.79
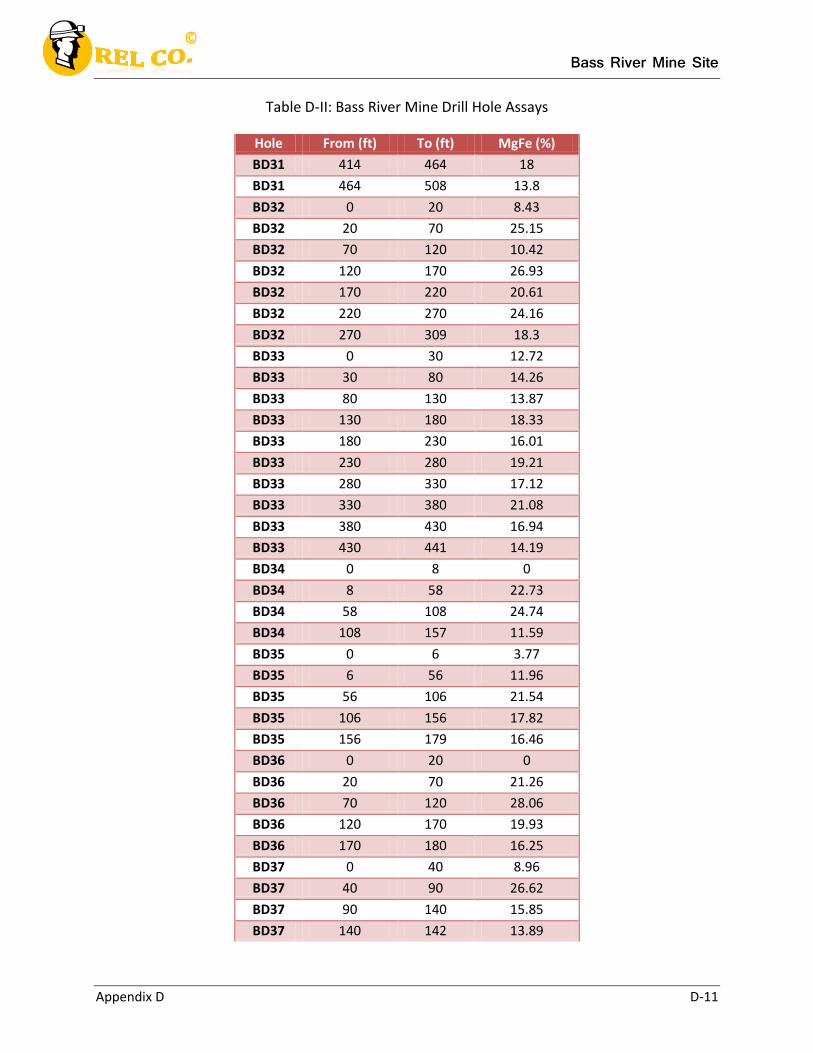
Bass River Mine Site
Appendix D D-11
Table D-II: Bass River Mine Drill Hole Assays
Hole From (ft) To (ft) MgFe (%)
BD31 414 464 18
BD31 464 508 13.8
BD32 0 20 8.43
BD32 20 70 25.15
BD32 70 120 10.42
BD32 120 170 26.93
BD32 170 220 20.61
BD32 220 270 24.16
BD32 270 309 18.3
BD33 0 30 12.72
BD33 30 80 14.26
BD33 80 130 13.87
BD33 130 180 18.33
BD33 180 230 16.01
BD33 230 280 19.21
BD33 280 330 17.12
BD33 330 380 21.08
BD33 380 430 16.94
BD33 430 441 14.19
BD34 0 8 0
BD34 8 58 22.73
BD34 58 108 24.74
BD34 108 157 11.59
BD35 0 6 3.77
BD35 6 56 11.96
BD35 56 106 21.54
BD35 106 156 17.82
BD35 156 179 16.46
BD36 0 20 0
BD36 20 70 21.26
BD36 70 120 28.06
BD36 120 170 19.93
BD36 170 180 16.25
BD37 0 40 8.96
BD37 40 90 26.62
BD37 90 140 15.85
BD37 140 142 13.89
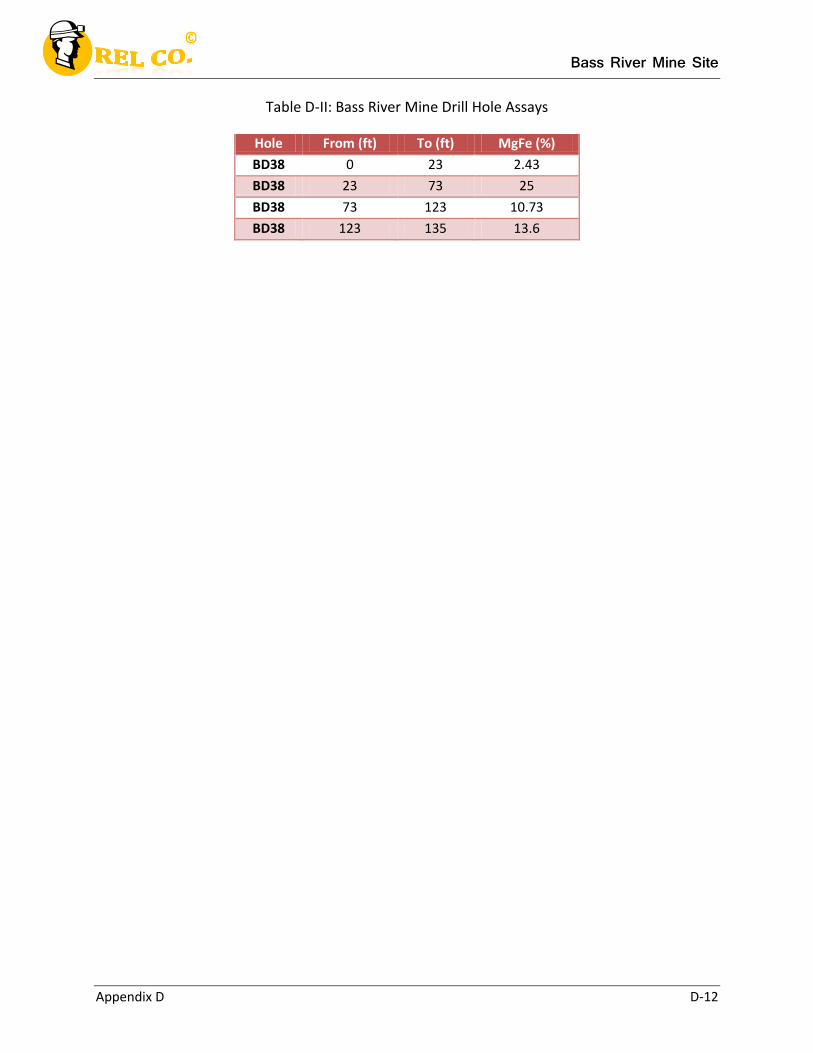
Bass River Mine Site
Appendix D D-12
Table D-II: Bass River Mine Drill Hole Assays
Hole From (ft) To (ft) MgFe (%)
BD38 0 23 2.43
BD38 23 73 25
BD38 73 123 10.73
BD38 123 135 13.6
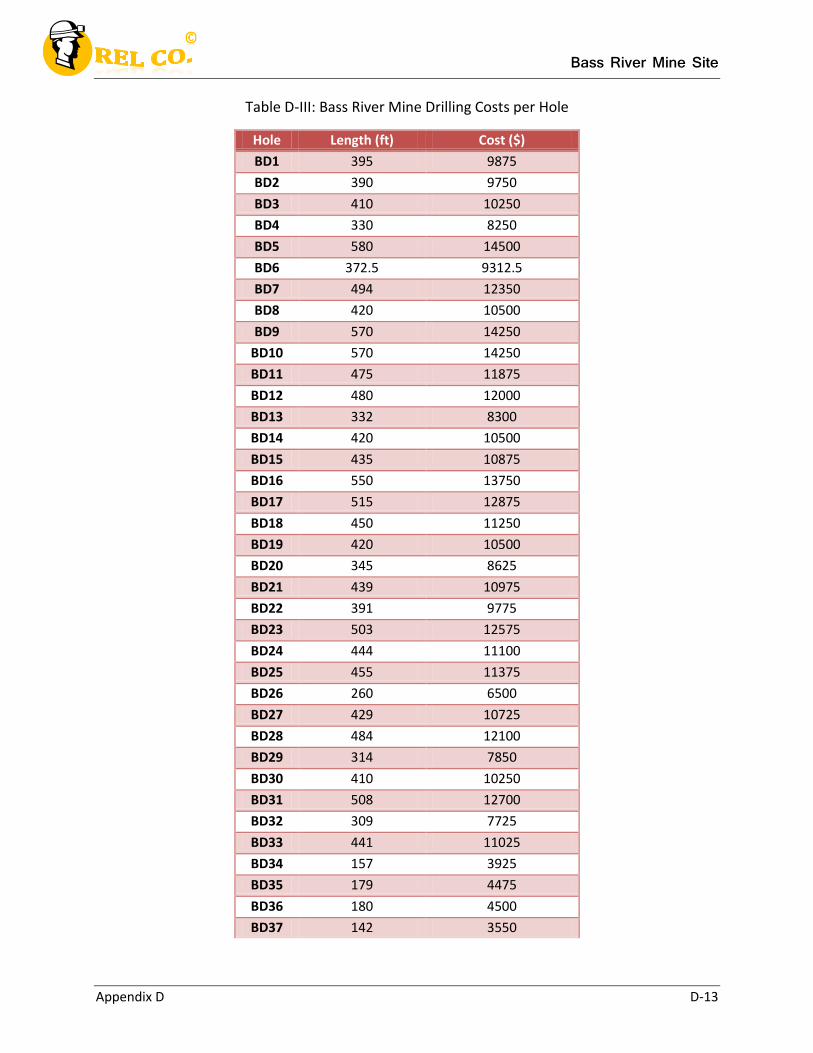
Bass River Mine Site
Appendix D D-13
Table D-III: Bass River Mine Drilling Costs per Hole
Hole Length (ft) Cost ($)
BD1 395 9875
BD2 390 9750
BD3 410 10250
BD4 330 8250
BD5 580 14500
BD6 372.5 9312.5
BD7 494 12350
BD8 420 10500
BD9 570 14250
BD10 570 14250
BD11 475 11875
BD12 480 12000
BD13 332 8300
BD14 420 10500
BD15 435 10875
BD16 550 13750
BD17 515 12875
BD18 450 11250
BD19 420 10500
BD20 345 8625
BD21 439 10975
BD22 391 9775
BD23 503 12575
BD24 444 11100
BD25 455 11375
BD26 260 6500
BD27 429 10725
BD28 484 12100
BD29 314 7850
BD30 410 10250
BD31 508 12700
BD32 309 7725
BD33 441 11025
BD34 157 3925
BD35 179 4475
BD36 180 4500
BD37 142 3550
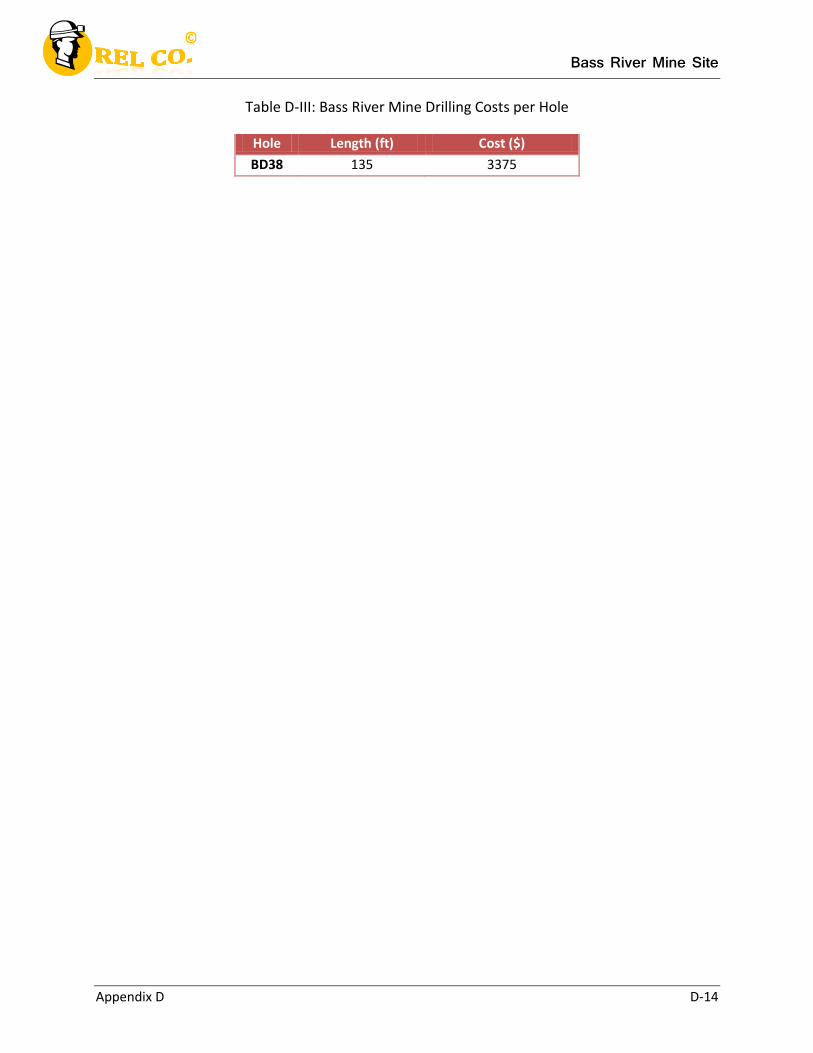
Bass River Mine Site
Appendix D D-14
Table D-III: Bass River Mine Drilling Costs per Hole
Hole Length (ft) Cost ($)
BD38 135 3375
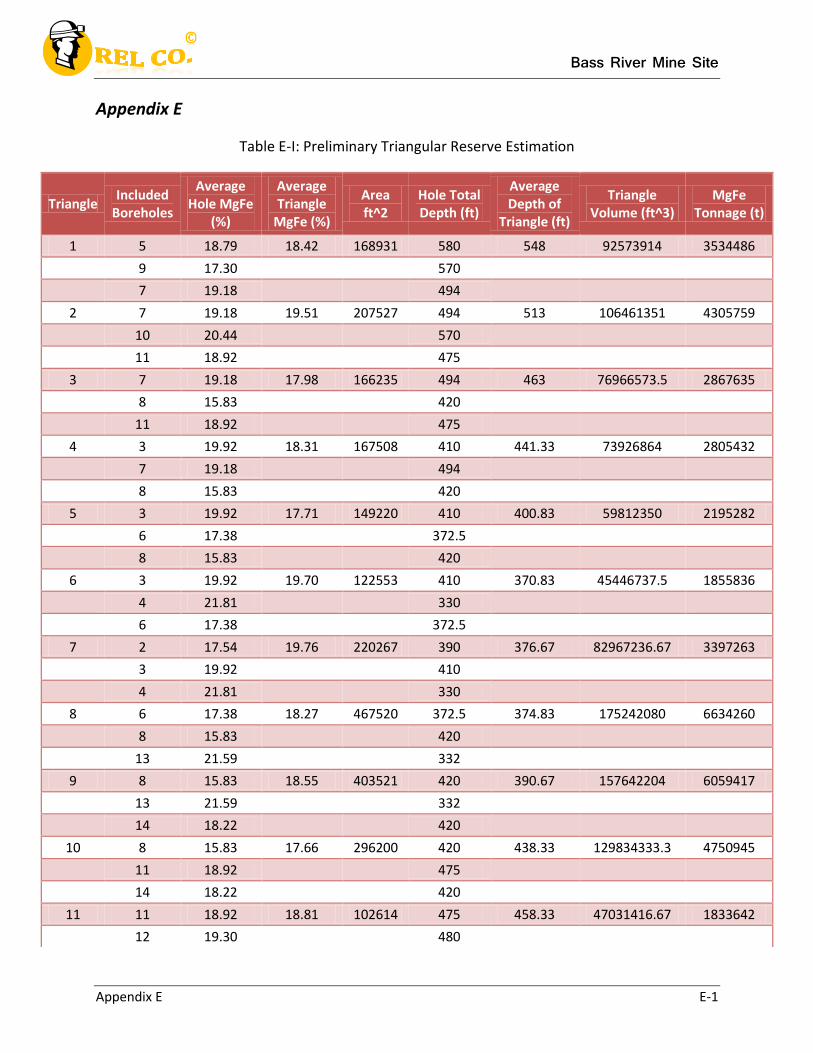
Bass River Mine Site
Appendix E E-1
Appendix E
Table E-I: Preliminary Triangular Reserve Estimation
Triangle Included
Boreholes
Average Hole MgFe
(%)
Average Triangle
MgFe (%)
Area ft^2
Hole Total Depth (ft)
Average Depth of
Triangle (ft)
Triangle Volume (ft^3)
MgFe Tonnage (t)
1 5 18.79 18.42 168931 580 548 92573914 3534486
9 17.30
570
7 19.18
494
2 7 19.18 19.51 207527 494 513 106461351 4305759
10 20.44
570
11 18.92
475
3 7 19.18 17.98 166235 494 463 76966573.5 2867635
8 15.83
420
11 18.92
475
4 3 19.92 18.31 167508 410 441.33 73926864 2805432
7 19.18
494
8 15.83
420
5 3 19.92 17.71 149220 410 400.83 59812350 2195282
6 17.38
372.5
8 15.83
420
6 3 19.92 19.70 122553 410 370.83 45446737.5 1855836
4 21.81
330
6 17.38
372.5
7 2 17.54 19.76 220267 390 376.67 82967236.67 3397263
3 19.92
410
4 21.81
330
8 6 17.38 18.27 467520 372.5 374.83 175242080 6634260
8 15.83
420
13 21.59
332
9 8 15.83 18.55 403521 420 390.67 157642204 6059417
13 21.59
332
14 18.22
420
10 8 15.83 17.66 296200 420 438.33 129834333.3 4750945
11 18.92
475
14 18.22
420
11 11 18.92 18.81 102614 475 458.33 47031416.67 1833642
12 19.30
480
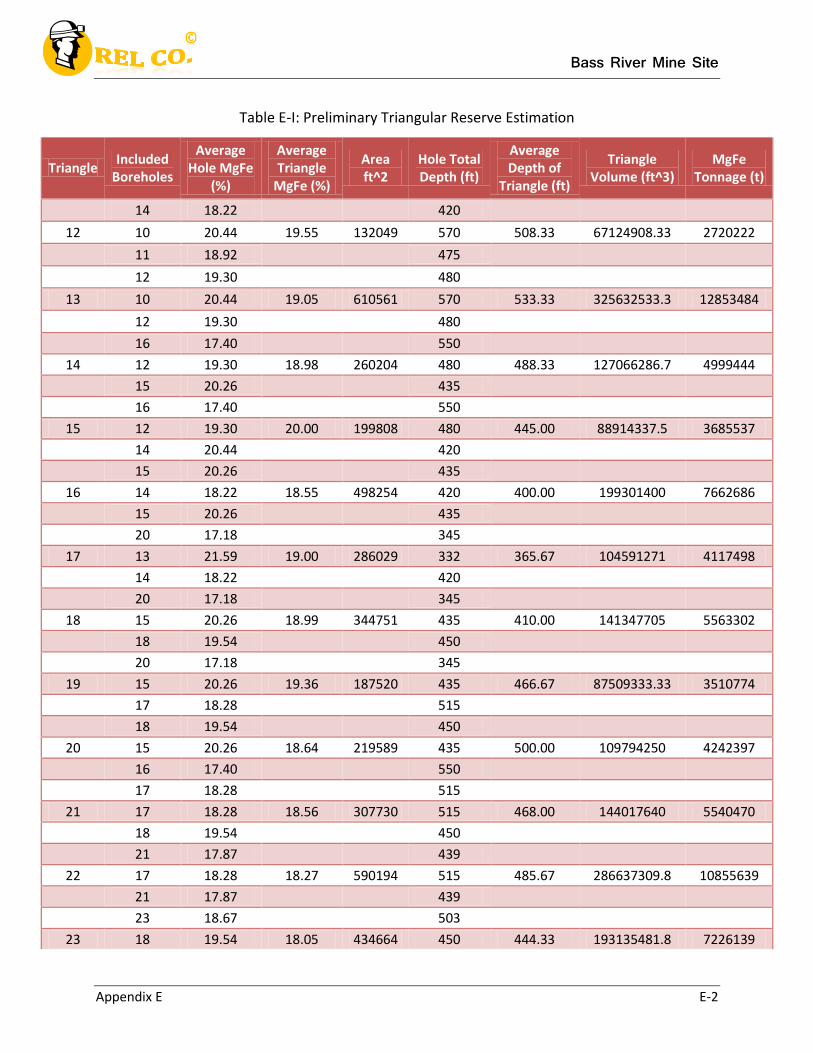
Bass River Mine Site
Appendix E E-2
Table E-I: Preliminary Triangular Reserve Estimation
Triangle Included
Boreholes
Average Hole MgFe
(%)
Average Triangle
MgFe (%)
Area ft^2
Hole Total Depth (ft)
Average Depth of
Triangle (ft)
Triangle Volume (ft^3)
MgFe Tonnage (t)
14 18.22
420
12 10 20.44 19.55 132049 570 508.33 67124908.33 2720222
11 18.92
475
12 19.30
480
13 10 20.44 19.05 610561 570 533.33 325632533.3 12853484
12 19.30
480
16 17.40
550
14 12 19.30 18.98 260204 480 488.33 127066286.7 4999444
15 20.26
435
16 17.40
550
15 12 19.30 20.00 199808 480 445.00 88914337.5 3685537
14 20.44
420
15 20.26
435
16 14 18.22 18.55 498254 420 400.00 199301400 7662686
15 20.26
435
20 17.18
345
17 13 21.59 19.00 286029 332 365.67 104591271 4117498
14 18.22
420
20 17.18
345
18 15 20.26 18.99 344751 435 410.00 141347705 5563302
18 19.54
450
20 17.18
345
19 15 20.26 19.36 187520 435 466.67 87509333.33 3510774
17 18.28
515
18 19.54
450
20 15 20.26 18.64 219589 435 500.00 109794250 4242397
16 17.40
550
17 18.28
515
21 17 18.28 18.56 307730 515 468.00 144017640 5540470
18 19.54
450
21 17.87
439
22 17 18.28 18.27 590194 515 485.67 286637309.8 10855639
21 17.87
439
23 18.67
503
23 18 19.54 18.05 434664 450 444.33 193135481.8 7226139
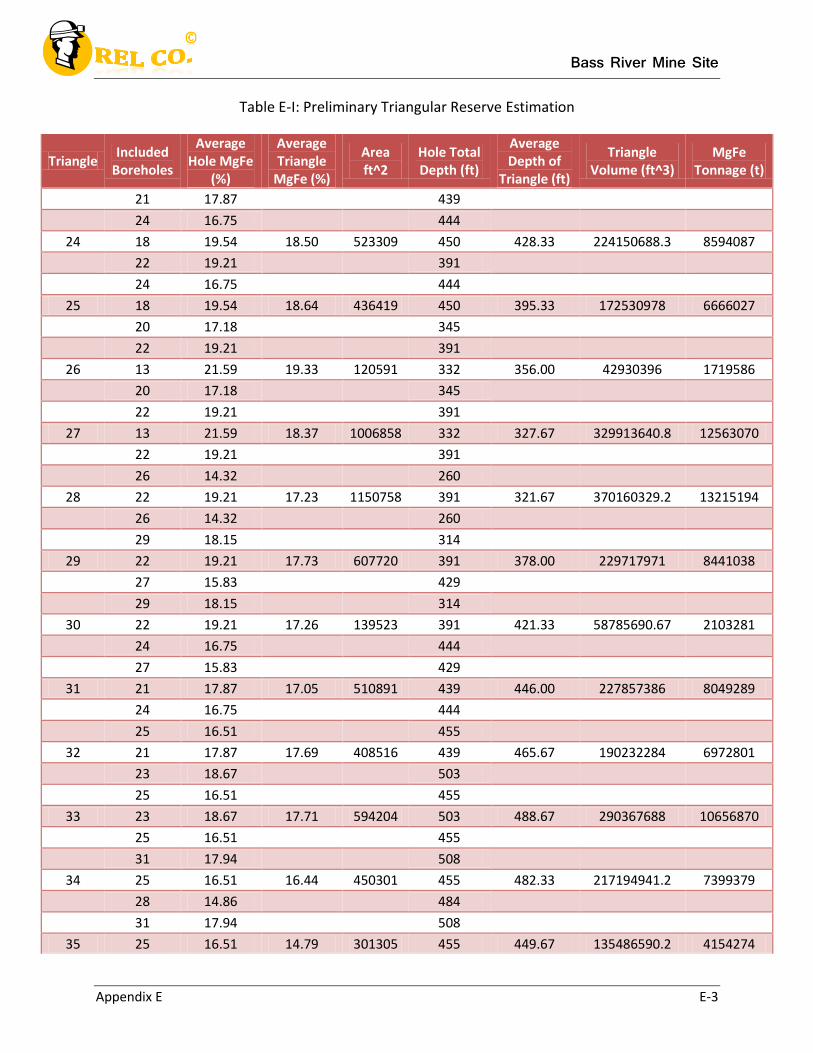
Bass River Mine Site
Appendix E E-3
Table E-I: Preliminary Triangular Reserve Estimation
Triangle Included
Boreholes
Average Hole MgFe
(%)
Average Triangle
MgFe (%)
Area ft^2
Hole Total Depth (ft)
Average Depth of
Triangle (ft)
Triangle Volume (ft^3)
MgFe Tonnage (t)
21 17.87
439
24 16.75
444
24 18 19.54 18.50 523309 450 428.33 224150688.3 8594087
22 19.21
391
24 16.75
444
25 18 19.54 18.64 436419 450 395.33 172530978 6666027
20 17.18
345
22 19.21
391
26 13 21.59 19.33 120591 332 356.00 42930396 1719586
20 17.18
345
22 19.21
391
27 13 21.59 18.37 1006858 332 327.67 329913640.8 12563070
22 19.21
391
26 14.32
260
28 22 19.21 17.23 1150758 391 321.67 370160329.2 13215194
26 14.32
260
29 18.15
314
29 22 19.21 17.73 607720 391 378.00 229717971 8441038
27 15.83
429
29 18.15
314
30 22 19.21 17.26 139523 391 421.33 58785690.67 2103281
24 16.75
444
27 15.83
429
31 21 17.87 17.05 510891 439 446.00 227857386 8049289
24 16.75
444
25 16.51
455
32 21 17.87 17.69 408516 439 465.67 190232284 6972801
23 18.67
503
25 16.51
455
33 23 18.67 17.71 594204 503 488.67 290367688 10656870
25 16.51
455
31 17.94
508
34 25 16.51 16.44 450301 455 482.33 217194941.2 7399379
28 14.86
484
31 17.94
508
35 25 16.51 14.79 301305 455 449.67 135486590.2 4154274
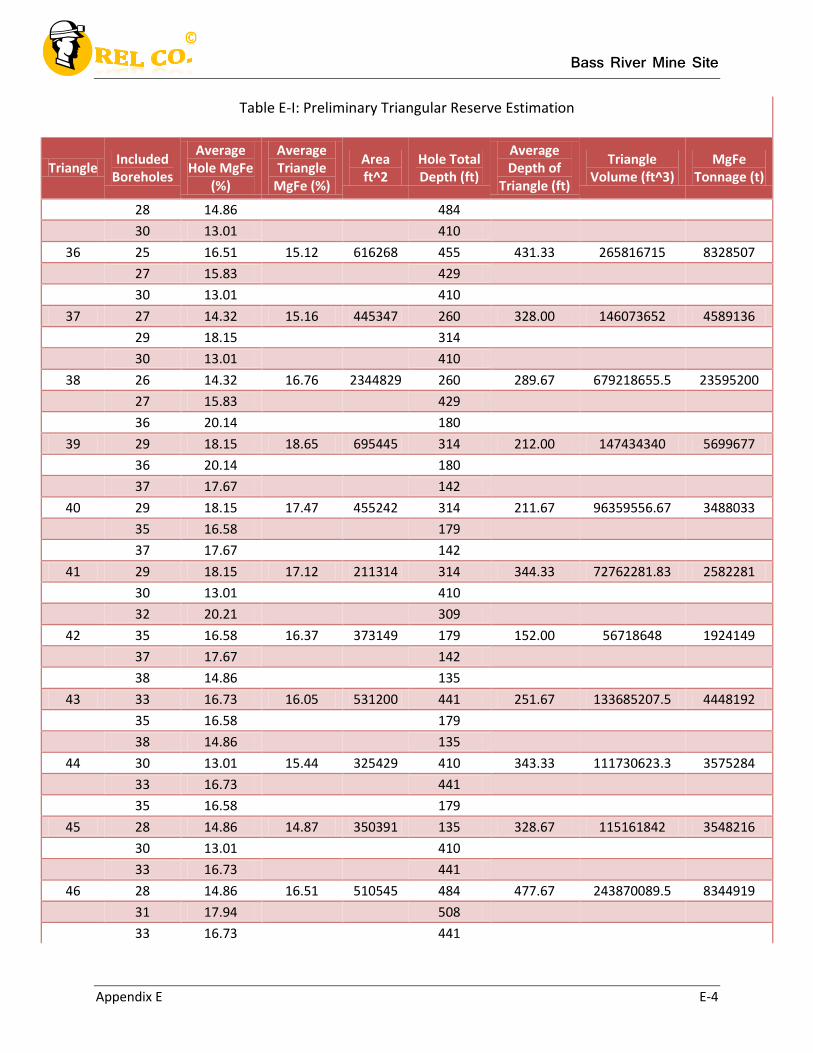
Bass River Mine Site
Appendix E E-4
Table E-I: Preliminary Triangular Reserve Estimation
Triangle Included
Boreholes
Average Hole MgFe
(%)
Average Triangle
MgFe (%)
Area ft^2
Hole Total Depth (ft)
Average Depth of
Triangle (ft)
Triangle Volume (ft^3)
MgFe Tonnage (t)
28 14.86
484
30 13.01
410
36 25 16.51 15.12 616268 455 431.33 265816715 8328507
27 15.83
429
30 13.01
410
37 27 14.32 15.16 445347 260 328.00 146073652 4589136
29 18.15
314
30 13.01
410
38 26 14.32 16.76 2344829 260 289.67 679218655.5 23595200
27 15.83
429
36 20.14
180
39 29 18.15 18.65 695445 314 212.00 147434340 5699677
36 20.14
180
37 17.67
142
40 29 18.15 17.47 455242 314 211.67 96359556.67 3488033
35 16.58
179
37 17.67
142
41 29 18.15 17.12 211314 314 344.33 72762281.83 2582281
30 13.01
410
32 20.21
309
42 35 16.58 16.37 373149 179 152.00 56718648 1924149
37 17.67
142
38 14.86
135
43 33 16.73 16.05 531200 441 251.67 133685207.5 4448192
35 16.58
179
38 14.86
135
44 30 13.01 15.44 325429 410 343.33 111730623.3 3575284
33 16.73
441
35 16.58
179
45 28 14.86 14.87 350391 135 328.67 115161842 3548216
30 13.01
410
33 16.73
441
46 28 14.86 16.51 510545 484 477.67 243870089.5 8344919
31 17.94
508
33 16.73
441
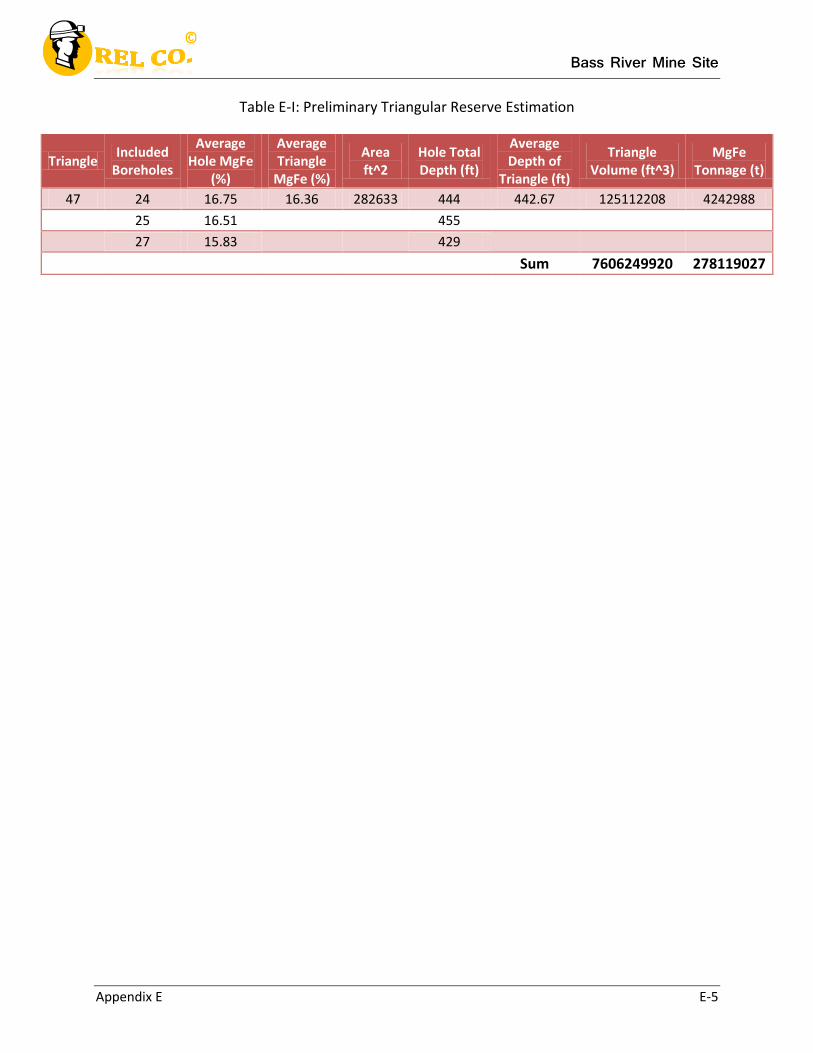
Bass River Mine Site
Appendix E E-5
Table E-I: Preliminary Triangular Reserve Estimation
Triangle Included
Boreholes
Average Hole MgFe
(%)
Average Triangle
MgFe (%)
Area ft^2
Hole Total Depth (ft)
Average Depth of
Triangle (ft)
Triangle Volume (ft^3)
MgFe Tonnage (t)
47 24 16.75 16.36 282633 444 442.67 125112208 4242988
25 16.51
455
27 15.83
429
Sum 7606249920 278119027
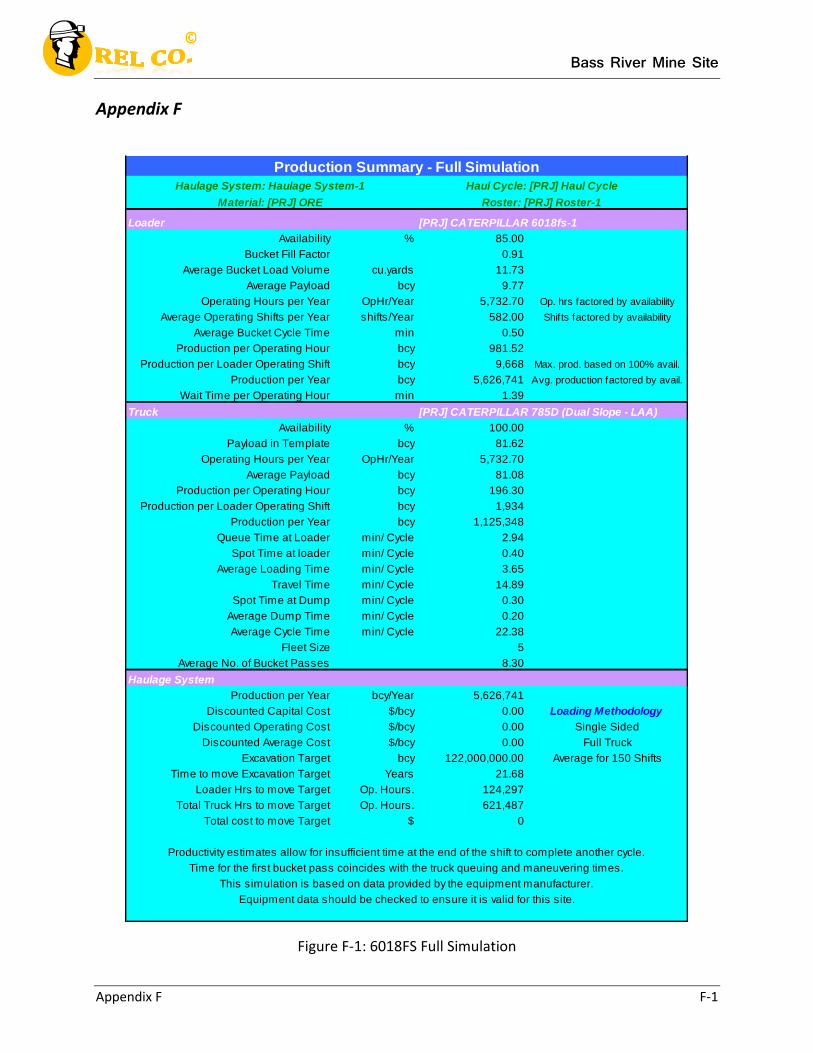
Bass River Mine Site
Appendix F F-1
Appendix F
Figure F-1: 6018FS Full Simulation
Production Summary - Full Simulation
Haulage System: Haulage System-1 Haul Cycle: [PRJ] Haul Cycle
Material: [PRJ] ORE Roster: [PRJ] Roster-1
Loader [PRJ] CATERPILLAR 6018fs-1
Availability % 85.00
Bucket Fill Factor 0.91
Average Bucket Load Volume cu.yards 11.73
Average Payload bcy 9.77
Operating Hours per Year OpHr/Year 5,732.70 Op. hrs factored by availability
Average Operating Shifts per Year shifts/Year 582.00 Shifts factored by availability
Average Bucket Cycle Time min 0.50
Production per Operating Hour bcy 981.52
Production per Loader Operating Shift bcy 9,668 Max. prod. based on 100% avail.
Production per Year bcy 5,626,741 Avg. production factored by avail.
Wait Time per Operating Hour min 1.39
Truck [PRJ] CATERPILLAR 785D (Dual Slope - LAA)
Availability % 100.00
Payload in Template bcy 81.62
Operating Hours per Year OpHr/Year 5,732.70
Average Payload bcy 81.08
Production per Operating Hour bcy 196.30
Production per Loader Operating Shift bcy 1,934
Production per Year bcy 1,125,348
Queue Time at Loader min/ Cycle 2.94
Spot Time at loader min/ Cycle 0.40
Average Loading Time min/ Cycle 3.65
Travel Time min/ Cycle 14.89
Spot Time at Dump min/ Cycle 0.30
Average Dump Time min/ Cycle 0.20
Average Cycle Time min/ Cycle 22.38
Fleet Size 5
Average No. of Bucket Passes 8.30
Haulage System
Production per Year bcy/Year 5,626,741
Discounted Capital Cost $/bcy 0.00 Loading Methodology
Discounted Operating Cost $/bcy 0.00 Single Sided
Discounted Average Cost $/bcy 0.00 Full Truck
Excavation Target bcy 122,000,000.00 Average for 150 Shifts
Time to move Excavation Target Years 21.68
Loader Hrs to move Target Op. Hours. 124,297
Total Truck Hrs to move Target Op. Hours. 621,487
Total cost to move Target $ 0
Productivity estimates allow for insufficient time at the end of the shift to complete another cycle.
Time for the first bucket pass coincides with the truck queuing and maneuvering times.
This simulation is based on data provided by the equipment manufacturer.
Equipment data should be checked to ensure it is valid for this site.
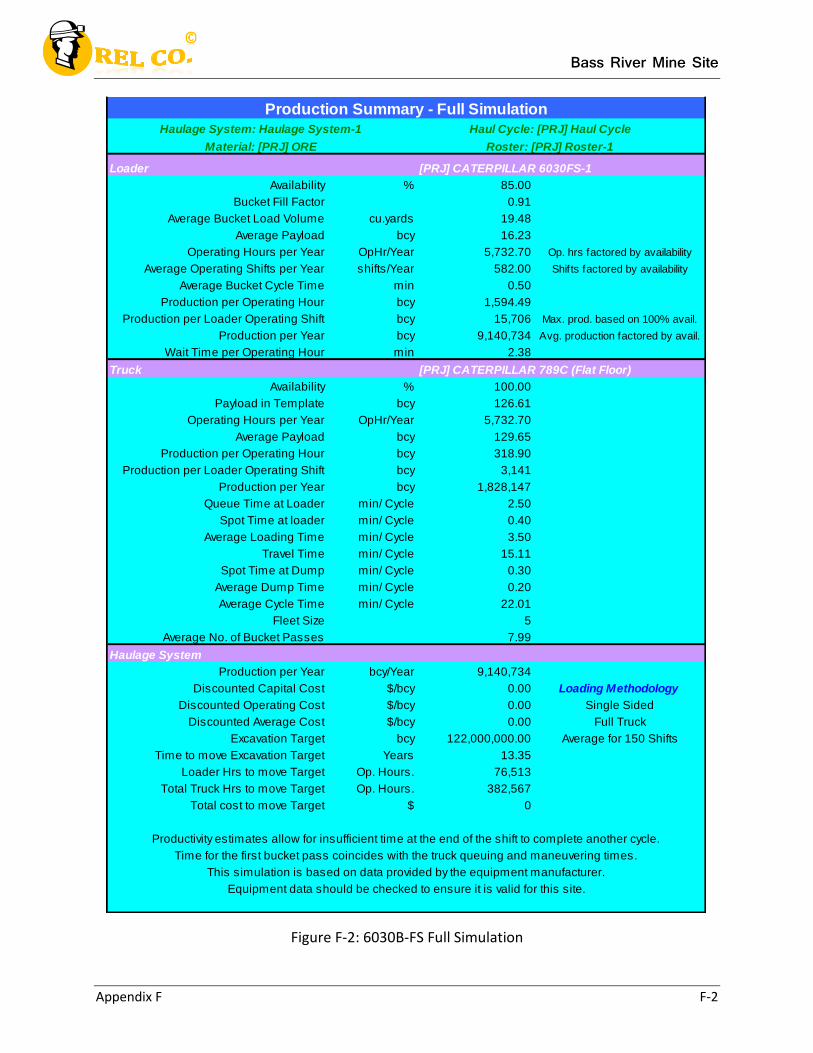
Bass River Mine Site
Appendix F F-2
Figure F-2: 6030B-FS Full Simulation
Production Summary - Full Simulation
Haulage System: Haulage System-1 Haul Cycle: [PRJ] Haul Cycle
Material: [PRJ] ORE Roster: [PRJ] Roster-1
Loader [PRJ] CATERPILLAR 6030FS-1
Availability % 85.00
Bucket Fill Factor 0.91
Average Bucket Load Volume cu.yards 19.48
Average Payload bcy 16.23
Operating Hours per Year OpHr/Year 5,732.70 Op. hrs factored by availability
Average Operating Shifts per Year shifts/Year 582.00 Shifts factored by availability
Average Bucket Cycle Time min 0.50
Production per Operating Hour bcy 1,594.49
Production per Loader Operating Shift bcy 15,706 Max. prod. based on 100% avail.
Production per Year bcy 9,140,734 Avg. production factored by avail.
Wait Time per Operating Hour min 2.38
Truck [PRJ] CATERPILLAR 789C (Flat Floor)
Availability % 100.00
Payload in Template bcy 126.61
Operating Hours per Year OpHr/Year 5,732.70
Average Payload bcy 129.65
Production per Operating Hour bcy 318.90
Production per Loader Operating Shift bcy 3,141
Production per Year bcy 1,828,147
Queue Time at Loader min/ Cycle 2.50
Spot Time at loader min/ Cycle 0.40
Average Loading Time min/ Cycle 3.50
Travel Time min/ Cycle 15.11
Spot Time at Dump min/ Cycle 0.30
Average Dump Time min/ Cycle 0.20
Average Cycle Time min/ Cycle 22.01
Fleet Size 5
Average No. of Bucket Passes 7.99
Haulage System
Production per Year bcy/Year 9,140,734
Discounted Capital Cost $/bcy 0.00 Loading Methodology
Discounted Operating Cost $/bcy 0.00 Single Sided
Discounted Average Cost $/bcy 0.00 Full Truck
Excavation Target bcy 122,000,000.00 Average for 150 Shifts
Time to move Excavation Target Years 13.35
Loader Hrs to move Target Op. Hours. 76,513
Total Truck Hrs to move Target Op. Hours. 382,567
Total cost to move Target $ 0
Productivity estimates allow for insufficient time at the end of the shift to complete another cycle.
Time for the first bucket pass coincides with the truck queuing and maneuvering times.
This simulation is based on data provided by the equipment manufacturer.
Equipment data should be checked to ensure it is valid for this site.
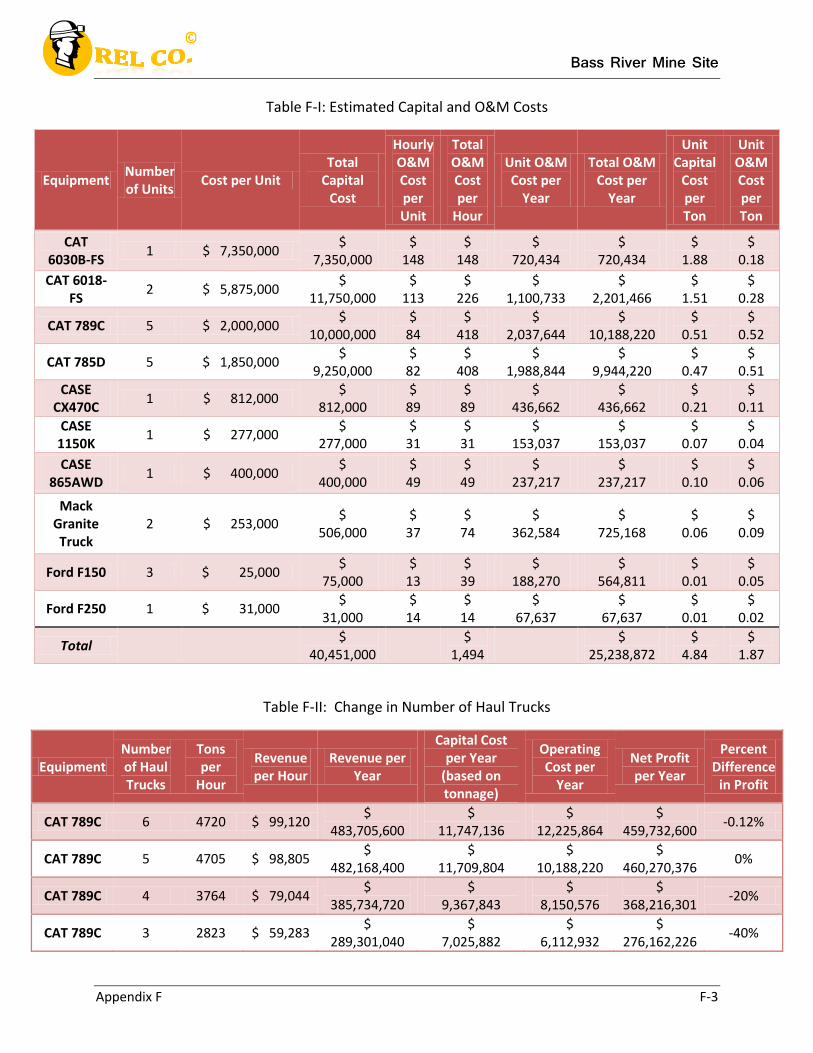
Bass River Mine Site
Appendix F F-3
Table F-I: Estimated Capital and O&M Costs
Equipment Number of Units
Cost per Unit Total
Capital Cost
Hourly O&M Cost per Unit
Total O&M Cost per
Hour
Unit O&M Cost per
Year
Total O&M Cost per
Year
Unit Capital
Cost per Ton
Unit O&M Cost per Ton
CAT 6030B-FS
1 $ 7,350,000 $
7,350,000 $
148 $
148 $
720,434 $
720,434 $
1.88 $
0.18
CAT 6018-FS
2 $ 5,875,000 $
11,750,000 $
113 $
226 $
1,100,733 $
2,201,466 $
1.51 $
0.28
CAT 789C 5 $ 2,000,000 $
10,000,000 $
84 $
418 $
2,037,644 $
10,188,220 $
0.51 $
0.52
CAT 785D 5 $ 1,850,000 $
9,250,000 $
82 $
408 $
1,988,844 $
9,944,220 $
0.47 $
0.51
CASE CX470C
1 $ 812,000 $
812,000 $
89 $
89 $
436,662 $
436,662 $
0.21 $
0.11
CASE 1150K
1 $ 277,000 $
277,000 $
31 $
31 $
153,037 $
153,037 $
0.07 $
0.04
CASE 865AWD
1 $ 400,000 $
400,000 $
49 $
49 $
237,217 $
237,217 $
0.10 $
0.06
Mack Granite Truck
2 $ 253,000 $
506,000 $
37 $
74 $
362,584 $
725,168 $
0.06 $
0.09
Ford F150 3 $ 25,000 $
75,000 $
13 $
39 $
188,270 $
564,811 $
0.01 $
0.05
Ford F250 1 $ 31,000 $
31,000 $
14 $
14 $
67,637 $
67,637 $
0.01 $
0.02
Total
$ 40,451,000
$ 1,494
$ 25,238,872
$ 4.84
$ 1.87
Table F-II: Change in Number of Haul Trucks
Equipment Number of Haul Trucks
Tons per
Hour
Revenue per Hour
Revenue per Year
Capital Cost per Year
(based on tonnage)
Operating Cost per
Year
Net Profit per Year
Percent Difference
in Profit
CAT 789C 6 4720 $ 99,120 $
483,705,600 $
11,747,136 $
12,225,864 $
459,732,600 -0.12%
CAT 789C 5 4705 $ 98,805 $
482,168,400 $
11,709,804 $
10,188,220 $
460,270,376 0%
CAT 789C 4 3764 $ 79,044 $
385,734,720 $
9,367,843 $
8,150,576 $
368,216,301 -20%
CAT 789C 3 2823 $ 59,283 $
289,301,040 $
7,025,882 $
6,112,932 $
276,162,226 -40%
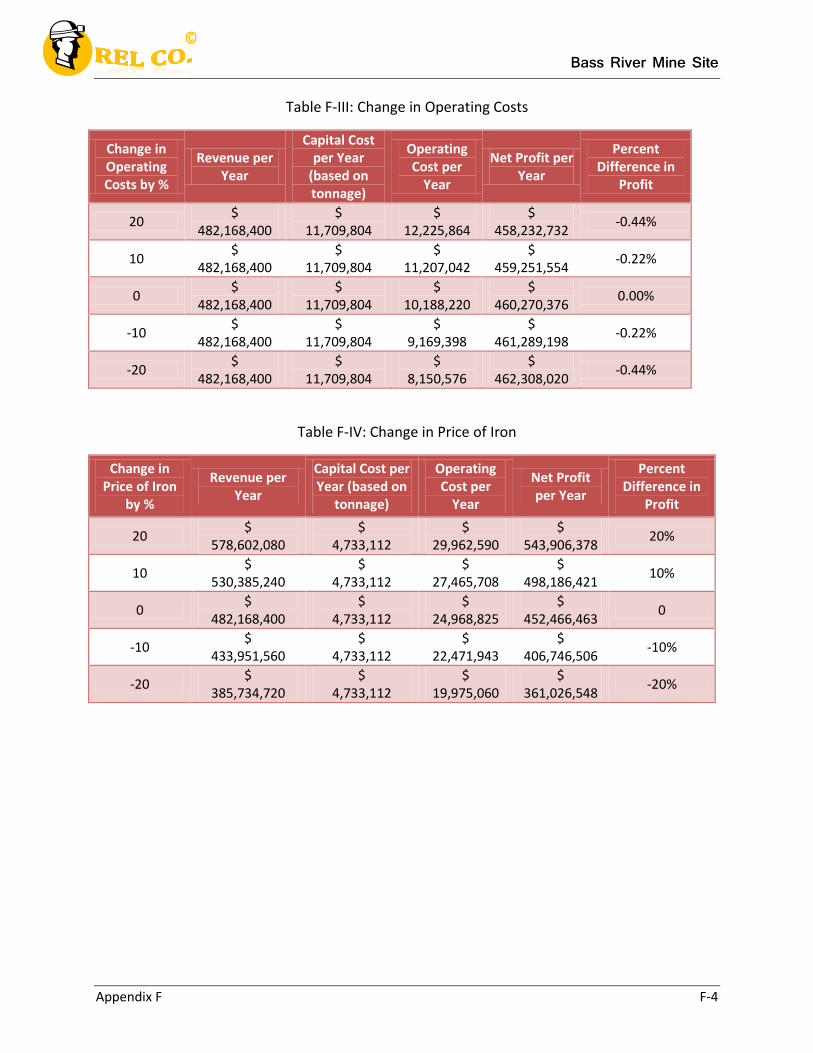
Bass River Mine Site
Appendix F F-4
Table F-III: Change in Operating Costs
Change in Operating Costs by %
Revenue per Year
Capital Cost per Year
(based on tonnage)
Operating Cost per
Year
Net Profit per Year
Percent Difference in
Profit
20 $
482,168,400 $
11,709,804 $
12,225,864 $
458,232,732 -0.44%
10 $
482,168,400 $
11,709,804 $
11,207,042 $
459,251,554 -0.22%
0 $
482,168,400 $
11,709,804 $
10,188,220 $
460,270,376 0.00%
-10 $
482,168,400 $
11,709,804 $
9,169,398 $
461,289,198 -0.22%
-20 $
482,168,400 $
11,709,804 $
8,150,576 $
462,308,020 -0.44%
Table F-IV: Change in Price of Iron
Change in Price of Iron
by %
Revenue per Year
Capital Cost per Year (based on
tonnage)
Operating Cost per
Year
Net Profit per Year
Percent Difference in
Profit
20 $
578,602,080 $
4,733,112 $
29,962,590 $
543,906,378 20%
10 $
530,385,240 $
4,733,112 $
27,465,708 $
498,186,421 10%
0 $
482,168,400 $
4,733,112 $
24,968,825 $
452,466,463 0
-10 $
433,951,560 $
4,733,112 $
22,471,943 $
406,746,506 -10%
-20 $
385,734,720 $
4,733,112 $
19,975,060 $
361,026,548 -20%
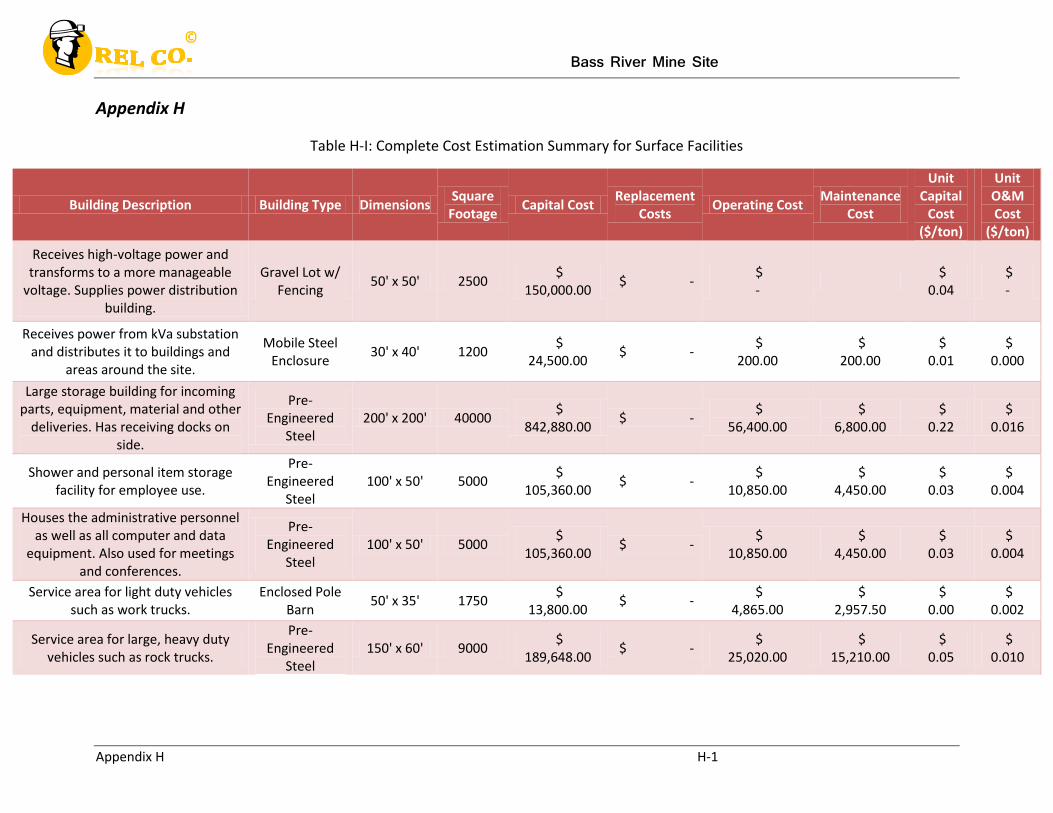
Bass River Mine Site
Appendix H H-1
Appendix H
Table H-I: Complete Cost Estimation Summary for Surface Facilities
Building Description Building Type Dimensions Square
Footage Capital Cost
Replacement Costs
Operating Cost Maintenance
Cost
Unit Capital
Cost ($/ton)
Unit O&M Cost
($/ton)
Receives high-voltage power and transforms to a more manageable
voltage. Supplies power distribution building.
Gravel Lot w/ Fencing
50' x 50' 2500 $
150,000.00 $ -
$ -
$
0.04 $ -
Receives power from kVa substation and distributes it to buildings and
areas around the site.
Mobile Steel Enclosure
30' x 40' 1200 $
24,500.00 $ -
$ 200.00
$ 200.00
$ 0.01
$ 0.000
Large storage building for incoming parts, equipment, material and other
deliveries. Has receiving docks on side.
Pre-Engineered
Steel 200' x 200' 40000
$ 842,880.00
$ - $
56,400.00 $
6,800.00 $
0.22 $
0.016
Shower and personal item storage facility for employee use.
Pre-Engineered
Steel 100' x 50' 5000
$ 105,360.00
$ - $
10,850.00 $
4,450.00 $
0.03 $
0.004
Houses the administrative personnel as well as all computer and data
equipment. Also used for meetings and conferences.
Pre-Engineered
Steel 100' x 50' 5000
$ 105,360.00
$ - $
10,850.00 $
4,450.00 $
0.03 $
0.004
Service area for light duty vehicles such as work trucks.
Enclosed Pole Barn
50' x 35' 1750 $
13,800.00 $ -
$ 4,865.00
$ 2,957.50
$ 0.00
$ 0.002
Service area for large, heavy duty vehicles such as rock trucks.
Pre-Engineered
Steel 150' x 60' 9000
$ 189,648.00
$ - $
25,020.00 $
15,210.00 $
0.05 $
0.010
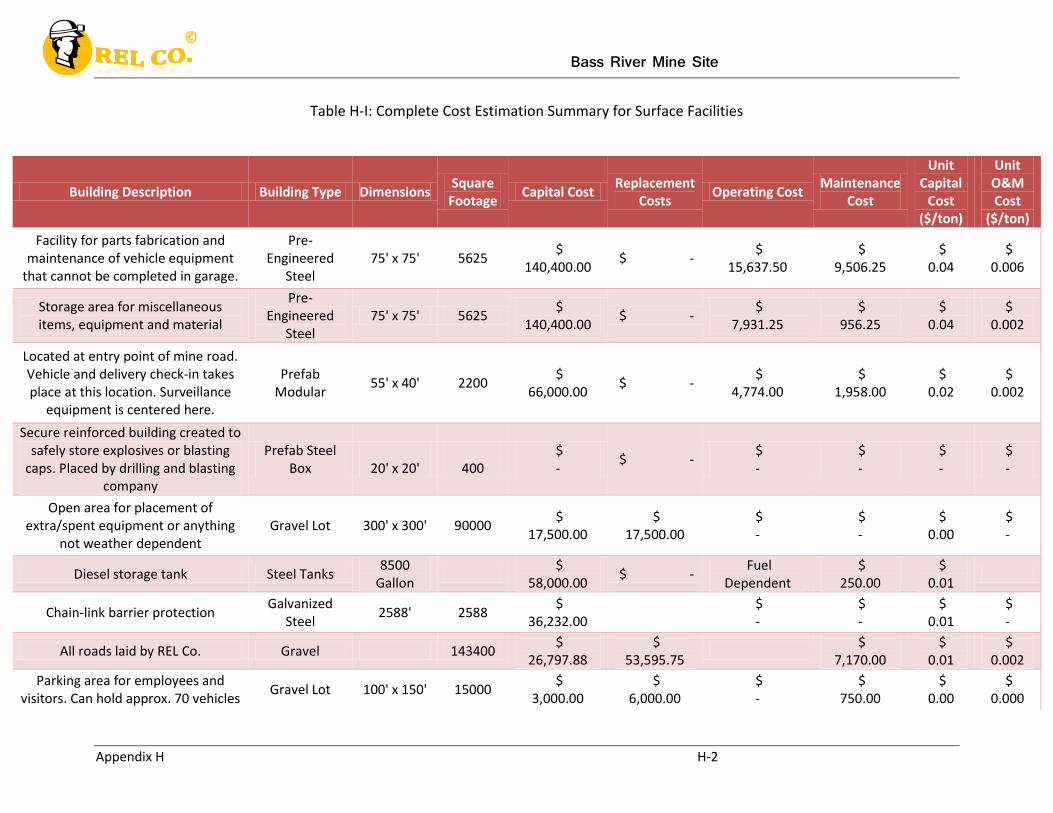
Bass River Mine Site
Appendix H H-2
Table H-I: Complete Cost Estimation Summary for Surface Facilities
Building Description Building Type Dimensions Square
Footage Capital Cost
Replacement Costs
Operating Cost Maintenance
Cost
Unit Capital
Cost ($/ton)
Unit O&M Cost
($/ton)
Facility for parts fabrication and maintenance of vehicle equipment
that cannot be completed in garage.
Pre-Engineered
Steel 75' x 75' 5625
$ 140,400.00
$ - $
15,637.50 $
9,506.25 $
0.04 $
0.006
Storage area for miscellaneous items, equipment and material
Pre-Engineered
Steel 75' x 75' 5625
$ 140,400.00
$ - $
7,931.25 $
956.25 $
0.04 $
0.002
Located at entry point of mine road. Vehicle and delivery check-in takes place at this location. Surveillance
equipment is centered here.
Prefab Modular
55' x 40' 2200 $
66,000.00 $ -
$ 4,774.00
$ 1,958.00
$ 0.02
$ 0.002
Secure reinforced building created to safely store explosives or blasting
caps. Placed by drilling and blasting company
Prefab Steel Box
20' x 20'
400
$ -
$ - $ -
$ -
$ -
$ -
Open area for placement of extra/spent equipment or anything
not weather dependent Gravel Lot 300' x 300' 90000
$ 17,500.00
$ 17,500.00
$ -
$ -
$ 0.00
$ -
Diesel storage tank Steel Tanks 8500
Gallon
$ 58,000.00
$ - Fuel
Dependent $
250.00 $
0.01
Chain-link barrier protection Galvanized
Steel 2588' 2588
$ 36,232.00
$ -
$ -
$ 0.01
$ -
All roads laid by REL Co. Gravel 143400 $
26,797.88 $
53,595.75
$ 7,170.00
$ 0.01
$ 0.002
Parking area for employees and visitors. Can hold approx. 70 vehicles
Gravel Lot 100' x 150' 15000 $
3,000.00 $
6,000.00 $ -
$ 750.00
$ 0.00
$ 0.000
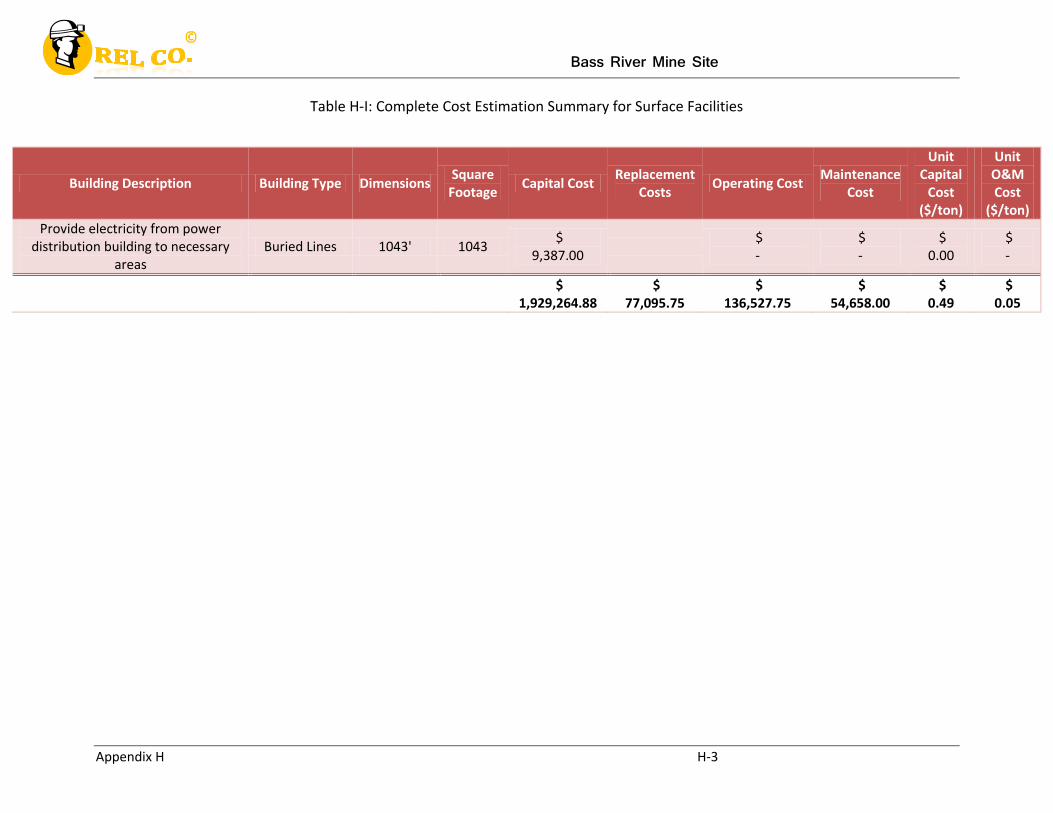
Bass River Mine Site
Appendix H H-3
Table H-I: Complete Cost Estimation Summary for Surface Facilities
Building Description Building Type Dimensions Square
Footage Capital Cost
Replacement Costs
Operating Cost Maintenance
Cost
Unit Capital
Cost ($/ton)
Unit O&M Cost
($/ton)
Provide electricity from power distribution building to necessary
areas Buried Lines 1043' 1043
$ 9,387.00
$ -
$ -
$ 0.00
$ -
$
1,929,264.88 $
77,095.75 $
136,527.75 $
54,658.00 $
0.49 $
0.05
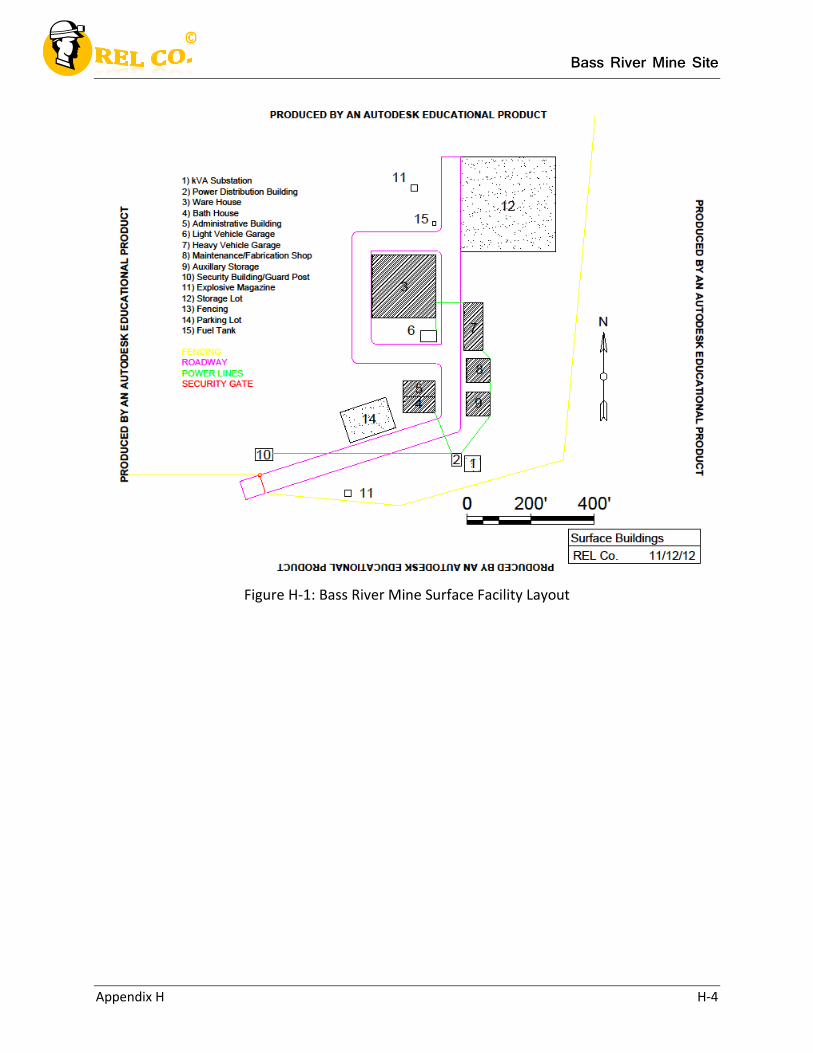
Bass River Mine Site
Appendix H H-4
Figure H-1: Bass River Mine Surface Facility Layout
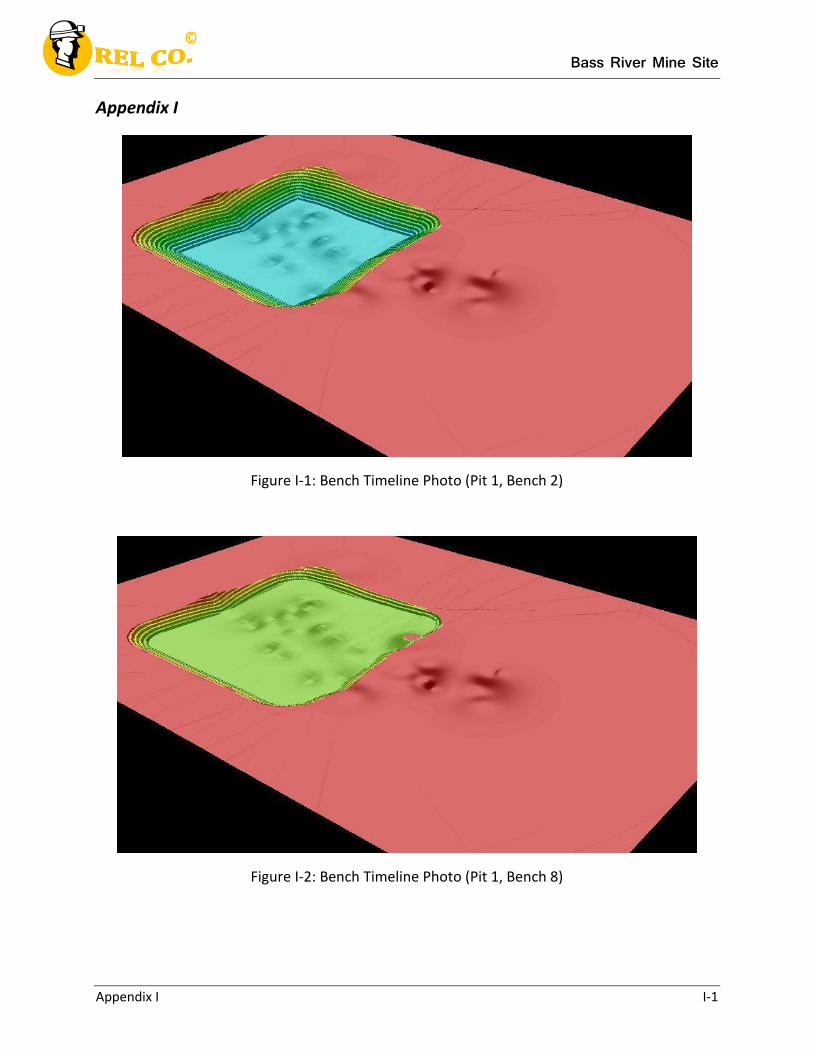
Bass River Mine Site
Appendix I I-1
Appendix I
Figure I-1: Bench Timeline Photo (Pit 1, Bench 2)
Figure I-2: Bench Timeline Photo (Pit 1, Bench 8)
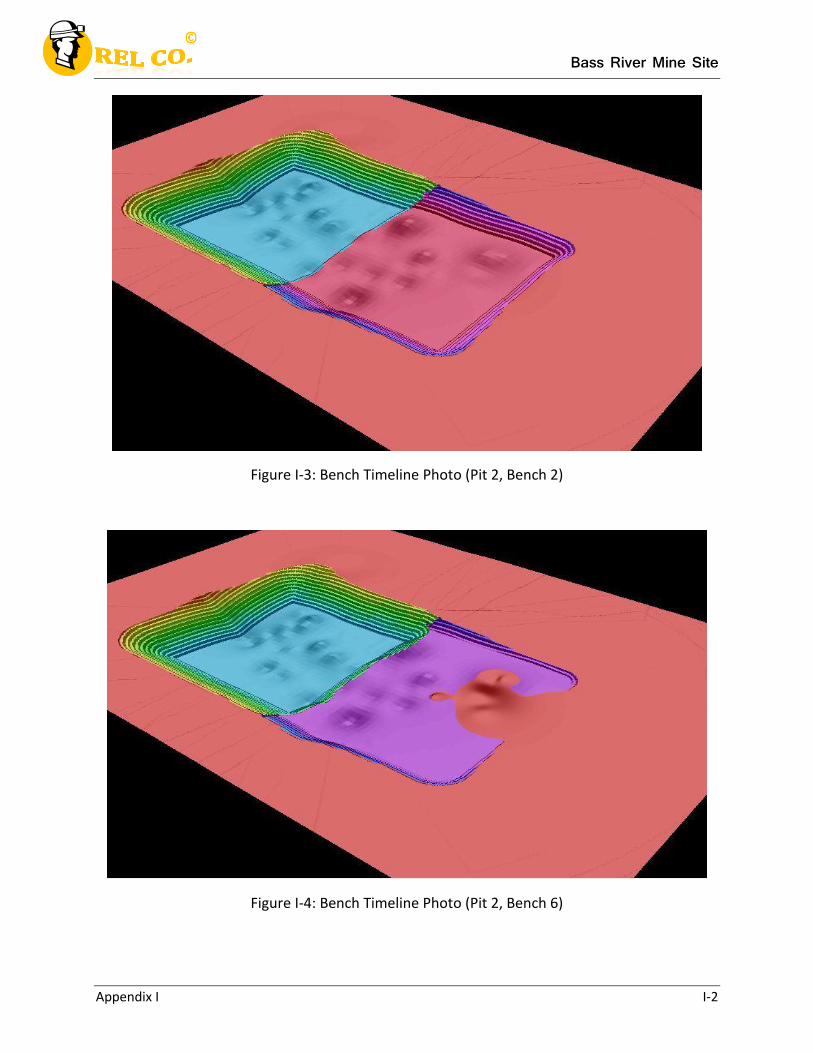
Bass River Mine Site
Appendix I I-2
Figure I-3: Bench Timeline Photo (Pit 2, Bench 2)
Figure I-4: Bench Timeline Photo (Pit 2, Bench 6)
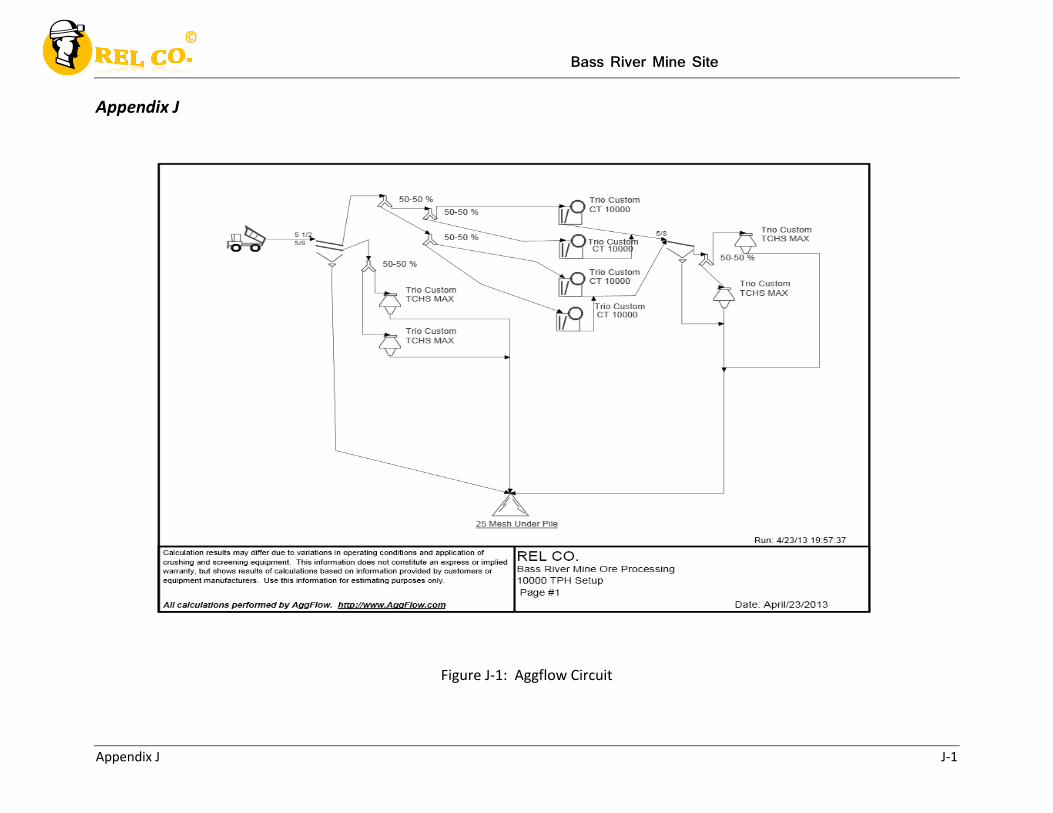
Bass River Mine Site
Appendix J J-1
Appendix J
Figure J-1: Aggflow Circuit
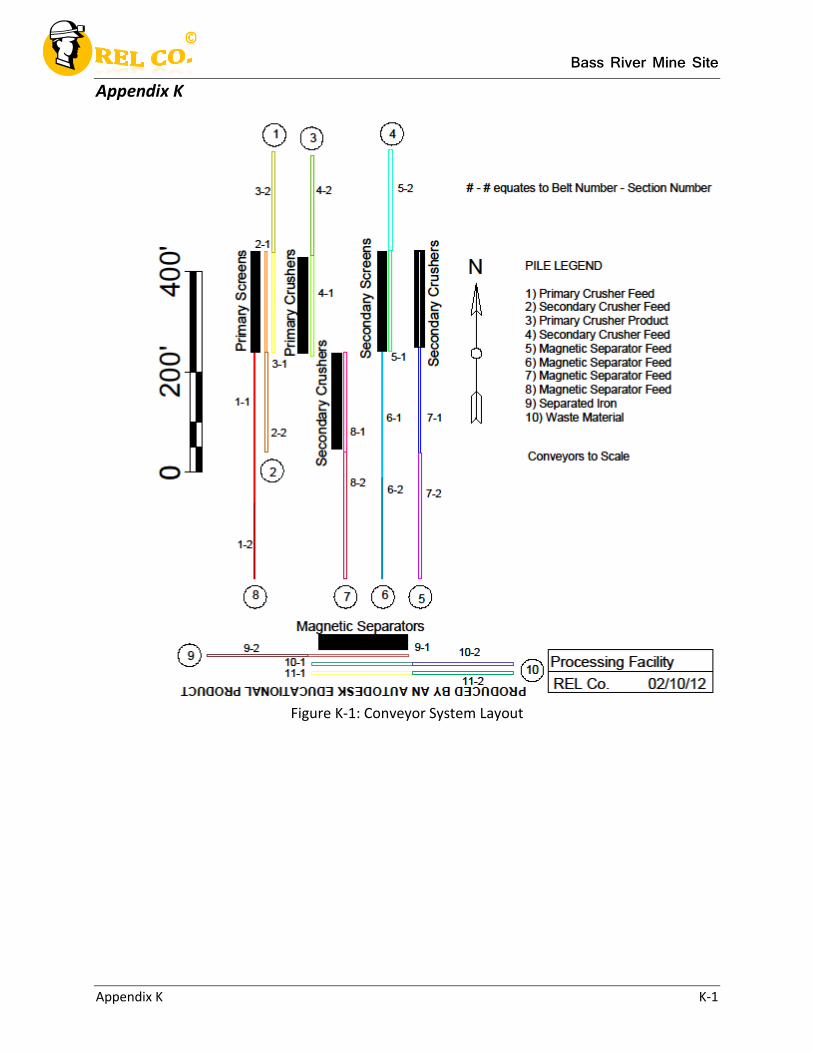
Bass River Mine Site
Appendix K K-1
Appendix K
Figure K-1: Conveyor System Layout
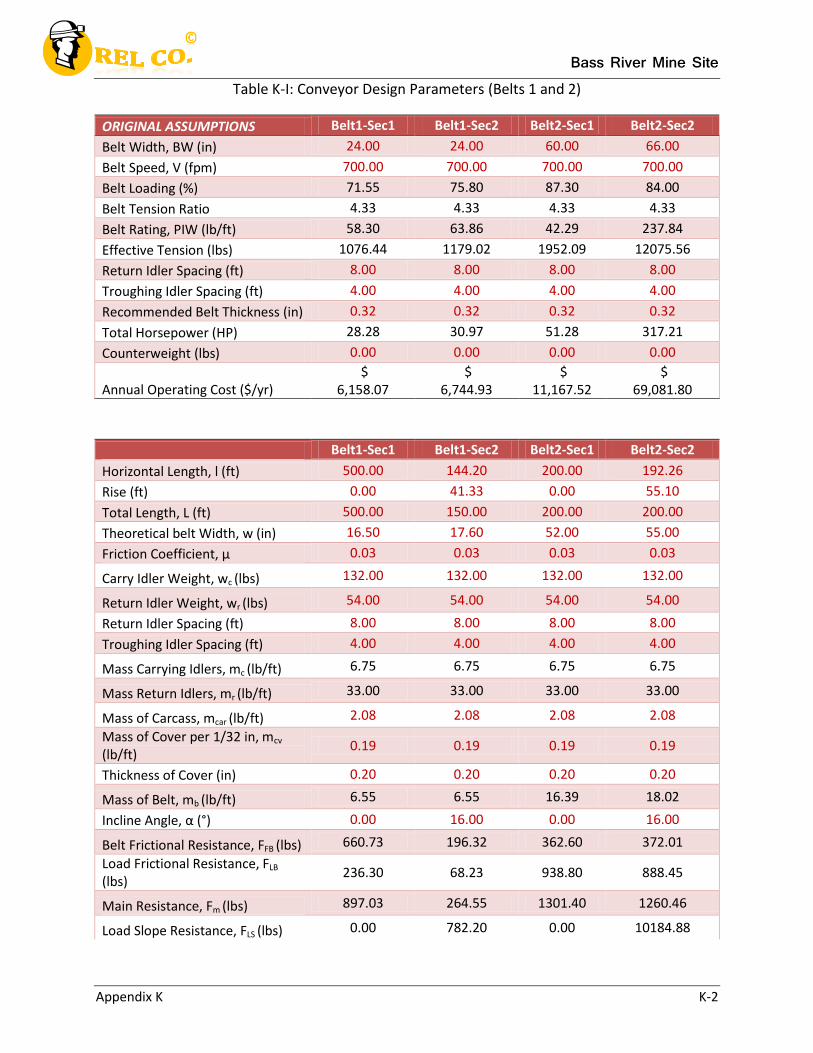
Bass River Mine Site
Appendix K K-2
Table K-I: Conveyor Design Parameters (Belts 1 and 2)
ORIGINAL ASSUMPTIONS Belt1-Sec1 Belt1-Sec2 Belt2-Sec1 Belt2-Sec2
Belt Width, BW (in) 24.00 24.00 60.00 66.00
Belt Speed, V (fpm) 700.00 700.00 700.00 700.00
Belt Loading (%) 71.55 75.80 87.30 84.00
Belt Tension Ratio 4.33 4.33 4.33 4.33
Belt Rating, PIW (lb/ft) 58.30 63.86 42.29 237.84
Effective Tension (lbs) 1076.44 1179.02 1952.09 12075.56
Return Idler Spacing (ft) 8.00 8.00 8.00 8.00
Troughing Idler Spacing (ft) 4.00 4.00 4.00 4.00
Recommended Belt Thickness (in) 0.32 0.32 0.32 0.32
Total Horsepower (HP) 28.28 30.97 51.28 317.21
Counterweight (lbs) 0.00 0.00 0.00 0.00
Annual Operating Cost ($/yr) $
6,158.07 $
6,744.93 $
11,167.52 $
69,081.80
Belt1-Sec1 Belt1-Sec2 Belt2-Sec1 Belt2-Sec2
Horizontal Length, l (ft) 500.00 144.20 200.00 192.26
Rise (ft) 0.00 41.33 0.00 55.10
Total Length, L (ft) 500.00 150.00 200.00 200.00
Theoretical belt Width, w (in) 16.50 17.60 52.00 55.00
Friction Coefficient, µ 0.03 0.03 0.03 0.03
Carry Idler Weight, wc (lbs) 132.00 132.00 132.00 132.00
Return Idler Weight, wr (lbs) 54.00 54.00 54.00 54.00
Return Idler Spacing (ft) 8.00 8.00 8.00 8.00
Troughing Idler Spacing (ft) 4.00 4.00 4.00 4.00
Mass Carrying Idlers, mc (lb/ft) 6.75 6.75 6.75 6.75
Mass Return Idlers, mr (lb/ft) 33.00 33.00 33.00 33.00
Mass of Carcass, mcar (lb/ft) 2.08 2.08 2.08 2.08
Mass of Cover per 1/32 in, mcv
(lb/ft) 0.19 0.19 0.19 0.19
Thickness of Cover (in) 0.20 0.20 0.20 0.20
Mass of Belt, mb (lb/ft) 6.55 6.55 16.39 18.02
Incline Angle, α (°) 0.00 16.00 0.00 16.00
Belt Frictional Resistance, FFB (lbs) 660.73 196.32 362.60 372.01
Load Frictional Resistance, FLB
(lbs) 236.30 68.23 938.80 888.45
Main Resistance, Fm (lbs) 897.03 264.55 1301.40 1260.46
Load Slope Resistance, FLS (lbs) 0.00 782.20 0.00 10184.88
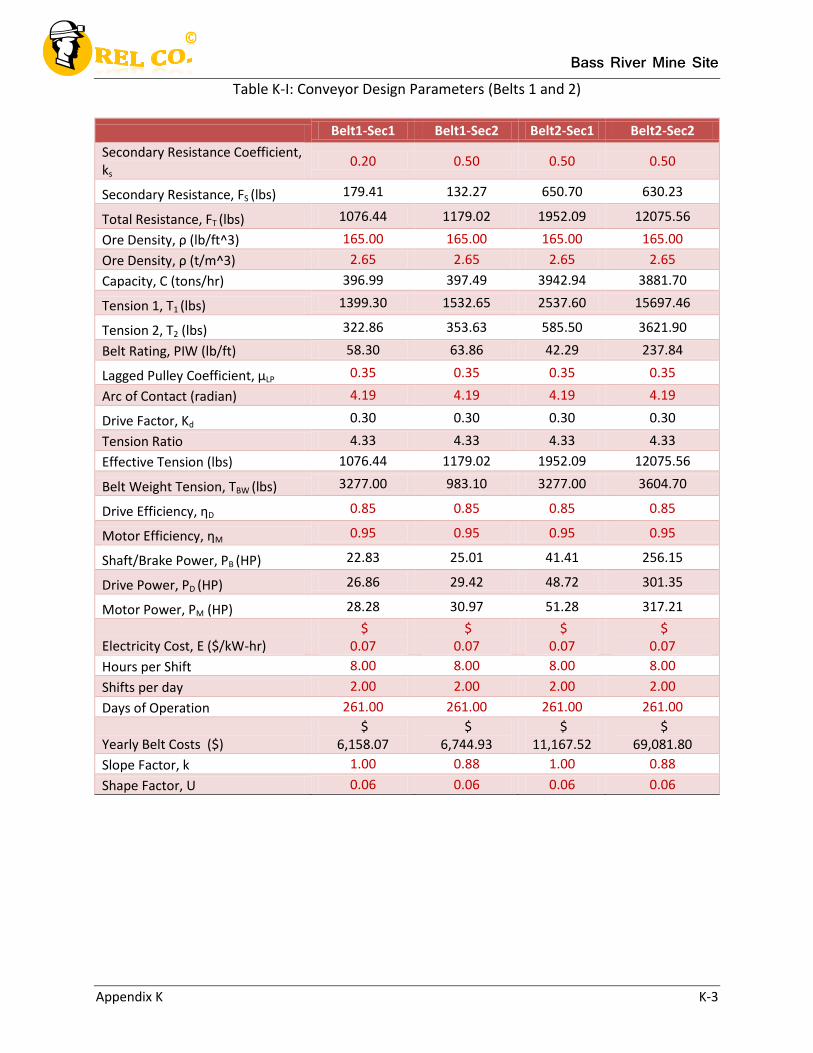
Bass River Mine Site
Appendix K K-3
Table K-I: Conveyor Design Parameters (Belts 1 and 2)
Belt1-Sec1 Belt1-Sec2 Belt2-Sec1 Belt2-Sec2
Secondary Resistance Coefficient, ks
0.20 0.50 0.50 0.50
Secondary Resistance, FS (lbs) 179.41 132.27 650.70 630.23
Total Resistance, FT (lbs) 1076.44 1179.02 1952.09 12075.56
Ore Density, ρ (lb/ft^3) 165.00 165.00 165.00 165.00
Ore Density, ρ (t/m^3) 2.65 2.65 2.65 2.65
Capacity, C (tons/hr) 396.99 397.49 3942.94 3881.70
Tension 1, T1 (lbs) 1399.30 1532.65 2537.60 15697.46
Tension 2, T2 (lbs) 322.86 353.63 585.50 3621.90
Belt Rating, PIW (lb/ft) 58.30 63.86 42.29 237.84
Lagged Pulley Coefficient, µLP 0.35 0.35 0.35 0.35
Arc of Contact (radian) 4.19 4.19 4.19 4.19
Drive Factor, Kd 0.30 0.30 0.30 0.30
Tension Ratio 4.33 4.33 4.33 4.33
Effective Tension (lbs) 1076.44 1179.02 1952.09 12075.56
Belt Weight Tension, TBW (lbs) 3277.00 983.10 3277.00 3604.70
Drive Efficiency, ƞD 0.85 0.85 0.85 0.85
Motor Efficiency, ƞM 0.95 0.95 0.95 0.95
Shaft/Brake Power, PB (HP) 22.83 25.01 41.41 256.15
Drive Power, PD (HP) 26.86 29.42 48.72 301.35
Motor Power, PM (HP) 28.28 30.97 51.28 317.21
Electricity Cost, E ($/kW-hr) $
0.07 $
0.07 $
0.07 $
0.07
Hours per Shift 8.00 8.00 8.00 8.00
Shifts per day 2.00 2.00 2.00 2.00
Days of Operation 261.00 261.00 261.00 261.00
Yearly Belt Costs ($) $
6,158.07 $
6,744.93 $
11,167.52 $
69,081.80
Slope Factor, k 1.00 0.88 1.00 0.88
Shape Factor, U 0.06 0.06 0.06 0.06
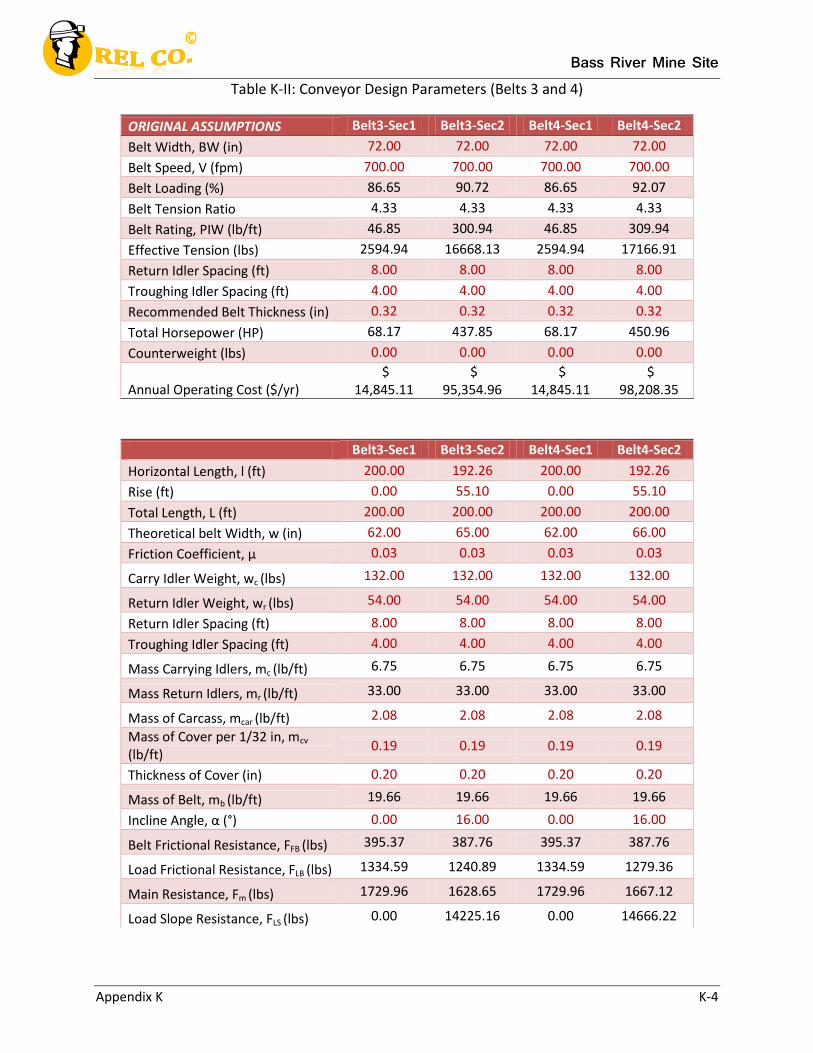
Bass River Mine Site
Appendix K K-4
Table K-II: Conveyor Design Parameters (Belts 3 and 4)
ORIGINAL ASSUMPTIONS Belt3-Sec1 Belt3-Sec2 Belt4-Sec1 Belt4-Sec2
Belt Width, BW (in) 72.00 72.00 72.00 72.00
Belt Speed, V (fpm) 700.00 700.00 700.00 700.00
Belt Loading (%) 86.65 90.72 86.65 92.07
Belt Tension Ratio 4.33 4.33 4.33 4.33
Belt Rating, PIW (lb/ft) 46.85 300.94 46.85 309.94
Effective Tension (lbs) 2594.94 16668.13 2594.94 17166.91
Return Idler Spacing (ft) 8.00 8.00 8.00 8.00
Troughing Idler Spacing (ft) 4.00 4.00 4.00 4.00
Recommended Belt Thickness (in) 0.32 0.32 0.32 0.32
Total Horsepower (HP) 68.17 437.85 68.17 450.96
Counterweight (lbs) 0.00 0.00 0.00 0.00
Annual Operating Cost ($/yr) $
14,845.11 $
95,354.96 $
14,845.11 $
98,208.35
Belt3-Sec1 Belt3-Sec2 Belt4-Sec1 Belt4-Sec2
Horizontal Length, l (ft) 200.00 192.26 200.00 192.26
Rise (ft) 0.00 55.10 0.00 55.10
Total Length, L (ft) 200.00 200.00 200.00 200.00
Theoretical belt Width, w (in) 62.00 65.00 62.00 66.00
Friction Coefficient, µ 0.03 0.03 0.03 0.03
Carry Idler Weight, wc (lbs) 132.00 132.00 132.00 132.00
Return Idler Weight, wr (lbs) 54.00 54.00 54.00 54.00
Return Idler Spacing (ft) 8.00 8.00 8.00 8.00
Troughing Idler Spacing (ft) 4.00 4.00 4.00 4.00
Mass Carrying Idlers, mc (lb/ft) 6.75 6.75 6.75 6.75
Mass Return Idlers, mr (lb/ft) 33.00 33.00 33.00 33.00
Mass of Carcass, mcar (lb/ft) 2.08 2.08 2.08 2.08
Mass of Cover per 1/32 in, mcv
(lb/ft) 0.19 0.19 0.19 0.19
Thickness of Cover (in) 0.20 0.20 0.20 0.20
Mass of Belt, mb (lb/ft) 19.66 19.66 19.66 19.66
Incline Angle, α (°) 0.00 16.00 0.00 16.00
Belt Frictional Resistance, FFB (lbs) 395.37 387.76 395.37 387.76
Load Frictional Resistance, FLB (lbs) 1334.59 1240.89 1334.59 1279.36
Main Resistance, Fm (lbs) 1729.96 1628.65 1729.96 1667.12
Load Slope Resistance, FLS (lbs) 0.00 14225.16 0.00 14666.22
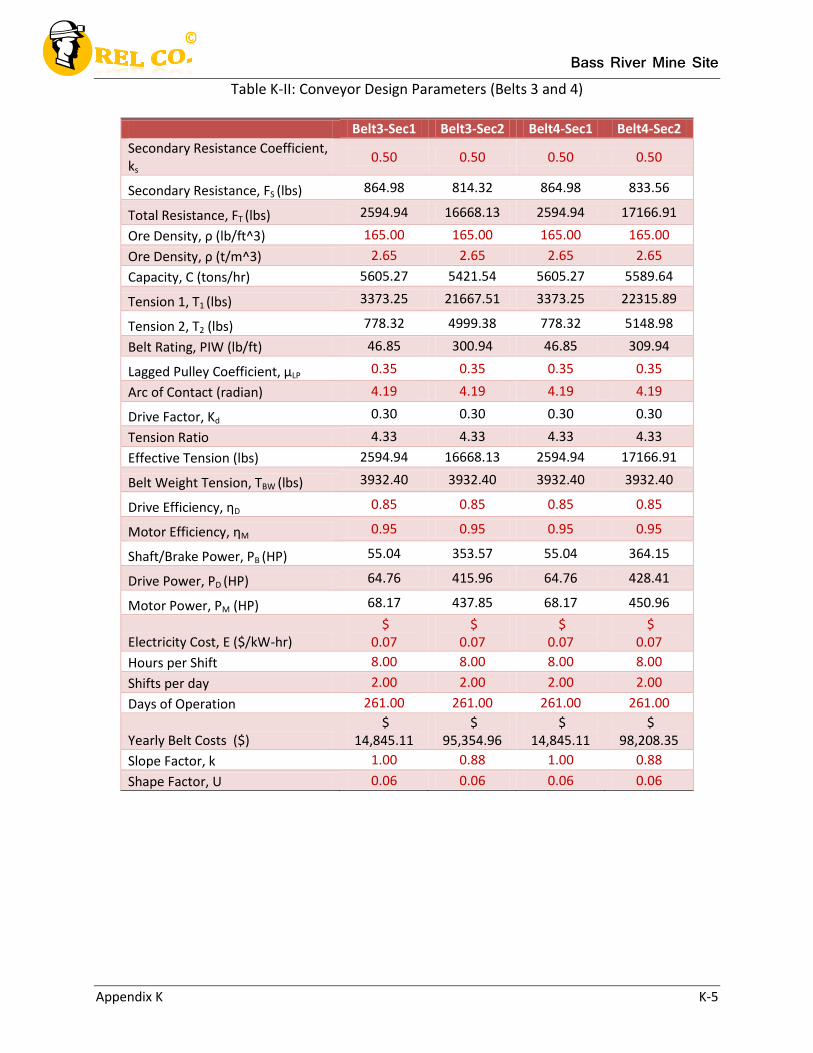
Bass River Mine Site
Appendix K K-5
Table K-II: Conveyor Design Parameters (Belts 3 and 4)
Belt3-Sec1 Belt3-Sec2 Belt4-Sec1 Belt4-Sec2
Secondary Resistance Coefficient, ks
0.50 0.50 0.50 0.50
Secondary Resistance, FS (lbs) 864.98 814.32 864.98 833.56
Total Resistance, FT (lbs) 2594.94 16668.13 2594.94 17166.91
Ore Density, ρ (lb/ft^3) 165.00 165.00 165.00 165.00
Ore Density, ρ (t/m^3) 2.65 2.65 2.65 2.65
Capacity, C (tons/hr) 5605.27 5421.54 5605.27 5589.64
Tension 1, T1 (lbs) 3373.25 21667.51 3373.25 22315.89
Tension 2, T2 (lbs) 778.32 4999.38 778.32 5148.98
Belt Rating, PIW (lb/ft) 46.85 300.94 46.85 309.94
Lagged Pulley Coefficient, µLP 0.35 0.35 0.35 0.35
Arc of Contact (radian) 4.19 4.19 4.19 4.19
Drive Factor, Kd 0.30 0.30 0.30 0.30
Tension Ratio 4.33 4.33 4.33 4.33
Effective Tension (lbs) 2594.94 16668.13 2594.94 17166.91
Belt Weight Tension, TBW (lbs) 3932.40 3932.40 3932.40 3932.40
Drive Efficiency, ƞD 0.85 0.85 0.85 0.85
Motor Efficiency, ƞM 0.95 0.95 0.95 0.95
Shaft/Brake Power, PB (HP) 55.04 353.57 55.04 364.15
Drive Power, PD (HP) 64.76 415.96 64.76 428.41
Motor Power, PM (HP) 68.17 437.85 68.17 450.96
Electricity Cost, E ($/kW-hr) $
0.07 $
0.07 $
0.07 $
0.07
Hours per Shift 8.00 8.00 8.00 8.00
Shifts per day 2.00 2.00 2.00 2.00
Days of Operation 261.00 261.00 261.00 261.00
Yearly Belt Costs ($) $
14,845.11 $
95,354.96 $
14,845.11 $
98,208.35
Slope Factor, k 1.00 0.88 1.00 0.88
Shape Factor, U 0.06 0.06 0.06 0.06
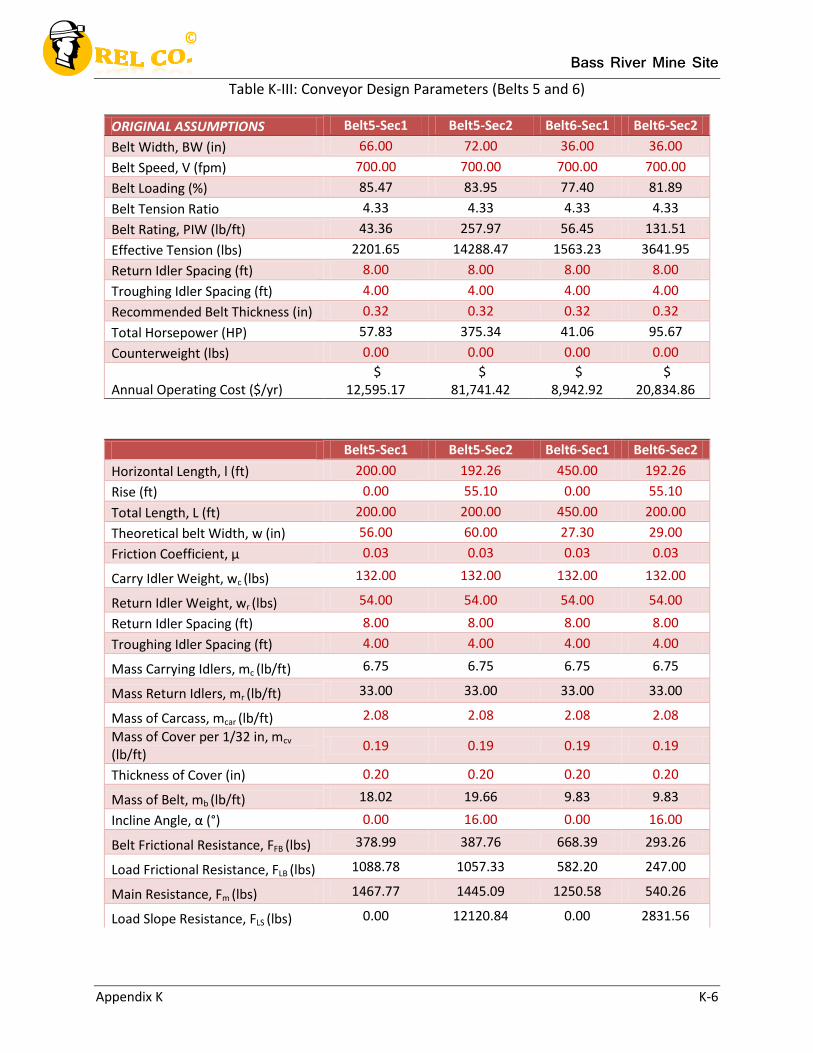
Bass River Mine Site
Appendix K K-6
Table K-III: Conveyor Design Parameters (Belts 5 and 6)
ORIGINAL ASSUMPTIONS Belt5-Sec1 Belt5-Sec2 Belt6-Sec1 Belt6-Sec2
Belt Width, BW (in) 66.00 72.00 36.00 36.00
Belt Speed, V (fpm) 700.00 700.00 700.00 700.00
Belt Loading (%) 85.47 83.95 77.40 81.89
Belt Tension Ratio 4.33 4.33 4.33 4.33
Belt Rating, PIW (lb/ft) 43.36 257.97 56.45 131.51
Effective Tension (lbs) 2201.65 14288.47 1563.23 3641.95
Return Idler Spacing (ft) 8.00 8.00 8.00 8.00
Troughing Idler Spacing (ft) 4.00 4.00 4.00 4.00
Recommended Belt Thickness (in) 0.32 0.32 0.32 0.32
Total Horsepower (HP) 57.83 375.34 41.06 95.67
Counterweight (lbs) 0.00 0.00 0.00 0.00
Annual Operating Cost ($/yr) $
12,595.17 $
81,741.42 $
8,942.92 $
20,834.86
Belt5-Sec1 Belt5-Sec2 Belt6-Sec1 Belt6-Sec2
Horizontal Length, l (ft) 200.00 192.26 450.00 192.26
Rise (ft) 0.00 55.10 0.00 55.10
Total Length, L (ft) 200.00 200.00 450.00 200.00
Theoretical belt Width, w (in) 56.00 60.00 27.30 29.00
Friction Coefficient, µ 0.03 0.03 0.03 0.03
Carry Idler Weight, wc (lbs) 132.00 132.00 132.00 132.00
Return Idler Weight, wr (lbs) 54.00 54.00 54.00 54.00
Return Idler Spacing (ft) 8.00 8.00 8.00 8.00
Troughing Idler Spacing (ft) 4.00 4.00 4.00 4.00
Mass Carrying Idlers, mc (lb/ft) 6.75 6.75 6.75 6.75
Mass Return Idlers, mr (lb/ft) 33.00 33.00 33.00 33.00
Mass of Carcass, mcar (lb/ft) 2.08 2.08 2.08 2.08
Mass of Cover per 1/32 in, mcv
(lb/ft) 0.19 0.19 0.19 0.19
Thickness of Cover (in) 0.20 0.20 0.20 0.20
Mass of Belt, mb (lb/ft) 18.02 19.66 9.83 9.83
Incline Angle, α (°) 0.00 16.00 0.00 16.00
Belt Frictional Resistance, FFB (lbs) 378.99 387.76 668.39 293.26
Load Frictional Resistance, FLB (lbs) 1088.78 1057.33 582.20 247.00
Main Resistance, Fm (lbs) 1467.77 1445.09 1250.58 540.26
Load Slope Resistance, FLS (lbs) 0.00 12120.84 0.00 2831.56
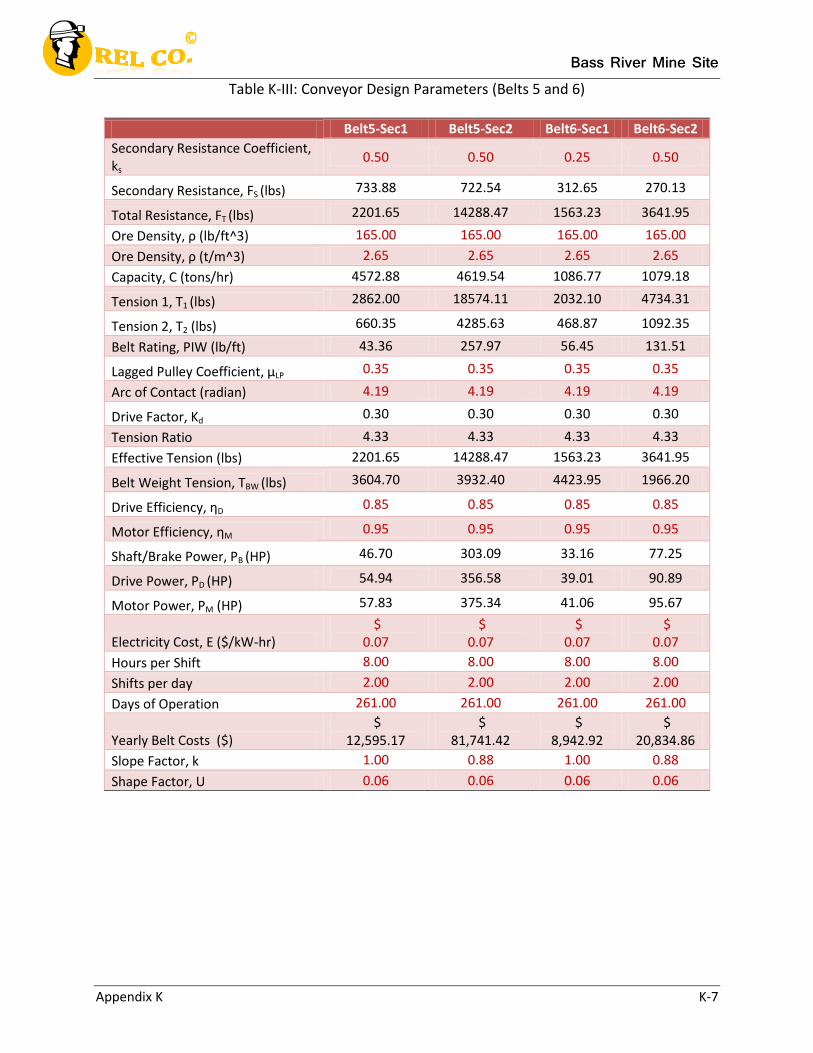
Bass River Mine Site
Appendix K K-7
Table K-III: Conveyor Design Parameters (Belts 5 and 6)
Belt5-Sec1 Belt5-Sec2 Belt6-Sec1 Belt6-Sec2
Secondary Resistance Coefficient, ks
0.50 0.50 0.25 0.50
Secondary Resistance, FS (lbs) 733.88 722.54 312.65 270.13
Total Resistance, FT (lbs) 2201.65 14288.47 1563.23 3641.95
Ore Density, ρ (lb/ft^3) 165.00 165.00 165.00 165.00
Ore Density, ρ (t/m^3) 2.65 2.65 2.65 2.65
Capacity, C (tons/hr) 4572.88 4619.54 1086.77 1079.18
Tension 1, T1 (lbs) 2862.00 18574.11 2032.10 4734.31
Tension 2, T2 (lbs) 660.35 4285.63 468.87 1092.35
Belt Rating, PIW (lb/ft) 43.36 257.97 56.45 131.51
Lagged Pulley Coefficient, µLP 0.35 0.35 0.35 0.35
Arc of Contact (radian) 4.19 4.19 4.19 4.19
Drive Factor, Kd 0.30 0.30 0.30 0.30
Tension Ratio 4.33 4.33 4.33 4.33
Effective Tension (lbs) 2201.65 14288.47 1563.23 3641.95
Belt Weight Tension, TBW (lbs) 3604.70 3932.40 4423.95 1966.20
Drive Efficiency, ƞD 0.85 0.85 0.85 0.85
Motor Efficiency, ƞM 0.95 0.95 0.95 0.95
Shaft/Brake Power, PB (HP) 46.70 303.09 33.16 77.25
Drive Power, PD (HP) 54.94 356.58 39.01 90.89
Motor Power, PM (HP) 57.83 375.34 41.06 95.67
Electricity Cost, E ($/kW-hr) $
0.07 $
0.07 $
0.07 $
0.07
Hours per Shift 8.00 8.00 8.00 8.00
Shifts per day 2.00 2.00 2.00 2.00
Days of Operation 261.00 261.00 261.00 261.00
Yearly Belt Costs ($) $
12,595.17 $
81,741.42 $
8,942.92 $
20,834.86
Slope Factor, k 1.00 0.88 1.00 0.88
Shape Factor, U 0.06 0.06 0.06 0.06
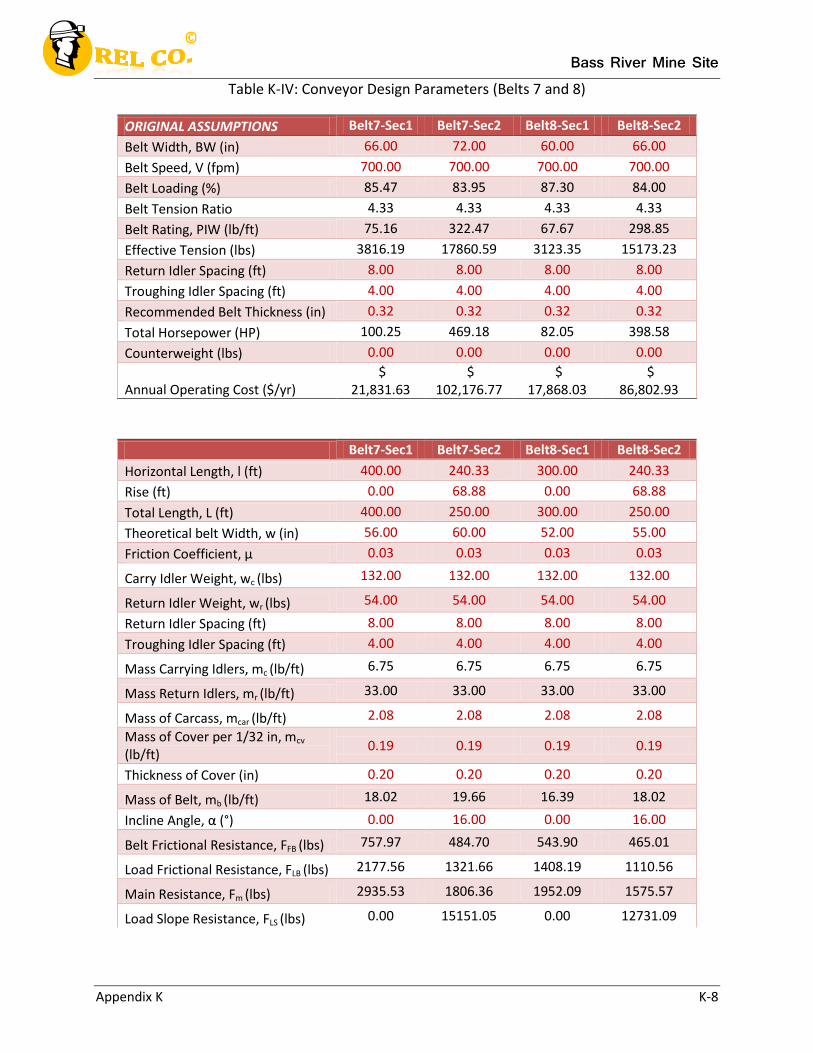
Bass River Mine Site
Appendix K K-8
Table K-IV: Conveyor Design Parameters (Belts 7 and 8)
ORIGINAL ASSUMPTIONS Belt7-Sec1 Belt7-Sec2 Belt8-Sec1 Belt8-Sec2
Belt Width, BW (in) 66.00 72.00 60.00 66.00
Belt Speed, V (fpm) 700.00 700.00 700.00 700.00
Belt Loading (%) 85.47 83.95 87.30 84.00
Belt Tension Ratio 4.33 4.33 4.33 4.33
Belt Rating, PIW (lb/ft) 75.16 322.47 67.67 298.85
Effective Tension (lbs) 3816.19 17860.59 3123.35 15173.23
Return Idler Spacing (ft) 8.00 8.00 8.00 8.00
Troughing Idler Spacing (ft) 4.00 4.00 4.00 4.00
Recommended Belt Thickness (in) 0.32 0.32 0.32 0.32
Total Horsepower (HP) 100.25 469.18 82.05 398.58
Counterweight (lbs) 0.00 0.00 0.00 0.00
Annual Operating Cost ($/yr) $
21,831.63 $
102,176.77 $
17,868.03 $
86,802.93
Belt7-Sec1 Belt7-Sec2 Belt8-Sec1 Belt8-Sec2
Horizontal Length, l (ft) 400.00 240.33 300.00 240.33
Rise (ft) 0.00 68.88 0.00 68.88
Total Length, L (ft) 400.00 250.00 300.00 250.00
Theoretical belt Width, w (in) 56.00 60.00 52.00 55.00
Friction Coefficient, µ 0.03 0.03 0.03 0.03
Carry Idler Weight, wc (lbs) 132.00 132.00 132.00 132.00
Return Idler Weight, wr (lbs) 54.00 54.00 54.00 54.00
Return Idler Spacing (ft) 8.00 8.00 8.00 8.00
Troughing Idler Spacing (ft) 4.00 4.00 4.00 4.00
Mass Carrying Idlers, mc (lb/ft) 6.75 6.75 6.75 6.75
Mass Return Idlers, mr (lb/ft) 33.00 33.00 33.00 33.00
Mass of Carcass, mcar (lb/ft) 2.08 2.08 2.08 2.08
Mass of Cover per 1/32 in, mcv
(lb/ft) 0.19 0.19 0.19 0.19
Thickness of Cover (in) 0.20 0.20 0.20 0.20
Mass of Belt, mb (lb/ft) 18.02 19.66 16.39 18.02
Incline Angle, α (°) 0.00 16.00 0.00 16.00
Belt Frictional Resistance, FFB (lbs) 757.97 484.70 543.90 465.01
Load Frictional Resistance, FLB (lbs) 2177.56 1321.66 1408.19 1110.56
Main Resistance, Fm (lbs) 2935.53 1806.36 1952.09 1575.57
Load Slope Resistance, FLS (lbs) 0.00 15151.05 0.00 12731.09
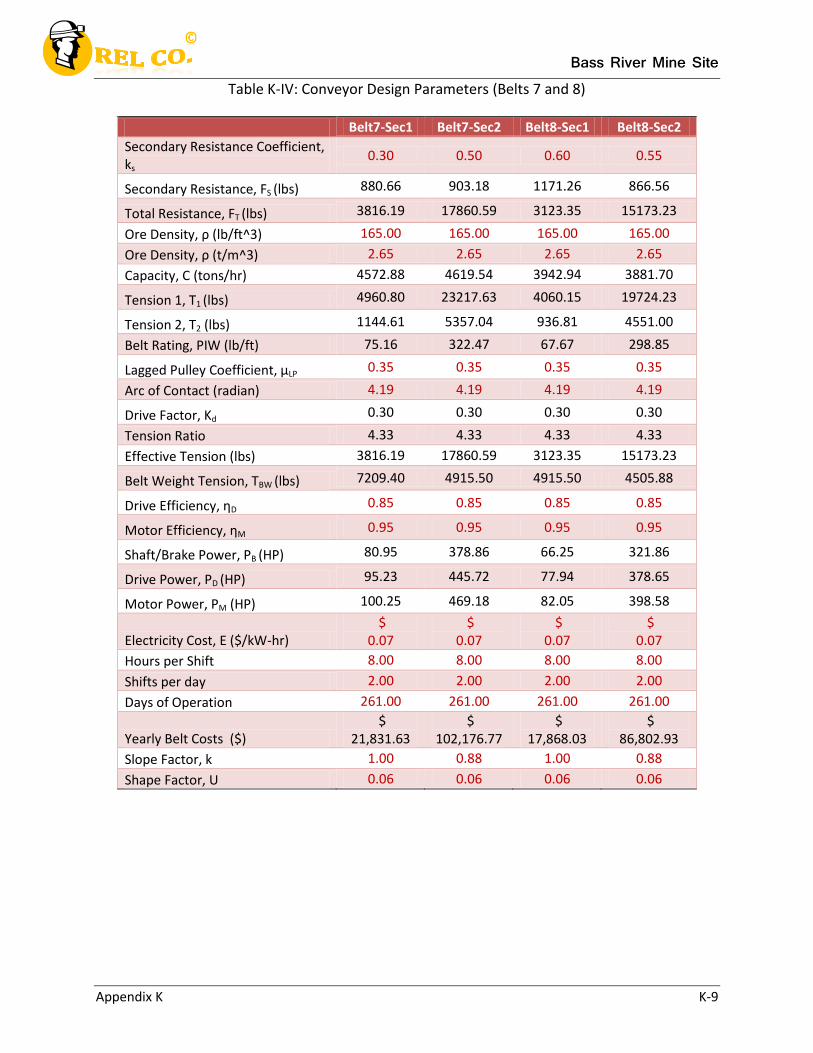
Bass River Mine Site
Appendix K K-9
Table K-IV: Conveyor Design Parameters (Belts 7 and 8)
Belt7-Sec1 Belt7-Sec2 Belt8-Sec1 Belt8-Sec2
Secondary Resistance Coefficient, ks
0.30 0.50 0.60 0.55
Secondary Resistance, FS (lbs) 880.66 903.18 1171.26 866.56
Total Resistance, FT (lbs) 3816.19 17860.59 3123.35 15173.23
Ore Density, ρ (lb/ft^3) 165.00 165.00 165.00 165.00
Ore Density, ρ (t/m^3) 2.65 2.65 2.65 2.65
Capacity, C (tons/hr) 4572.88 4619.54 3942.94 3881.70
Tension 1, T1 (lbs) 4960.80 23217.63 4060.15 19724.23
Tension 2, T2 (lbs) 1144.61 5357.04 936.81 4551.00
Belt Rating, PIW (lb/ft) 75.16 322.47 67.67 298.85
Lagged Pulley Coefficient, µLP 0.35 0.35 0.35 0.35
Arc of Contact (radian) 4.19 4.19 4.19 4.19
Drive Factor, Kd 0.30 0.30 0.30 0.30
Tension Ratio 4.33 4.33 4.33 4.33
Effective Tension (lbs) 3816.19 17860.59 3123.35 15173.23
Belt Weight Tension, TBW (lbs) 7209.40 4915.50 4915.50 4505.88
Drive Efficiency, ƞD 0.85 0.85 0.85 0.85
Motor Efficiency, ƞM 0.95 0.95 0.95 0.95
Shaft/Brake Power, PB (HP) 80.95 378.86 66.25 321.86
Drive Power, PD (HP) 95.23 445.72 77.94 378.65
Motor Power, PM (HP) 100.25 469.18 82.05 398.58
Electricity Cost, E ($/kW-hr) $
0.07 $
0.07 $
0.07 $
0.07
Hours per Shift 8.00 8.00 8.00 8.00
Shifts per day 2.00 2.00 2.00 2.00
Days of Operation 261.00 261.00 261.00 261.00
Yearly Belt Costs ($) $
21,831.63 $
102,176.77 $
17,868.03 $
86,802.93
Slope Factor, k 1.00 0.88 1.00 0.88
Shape Factor, U 0.06 0.06 0.06 0.06
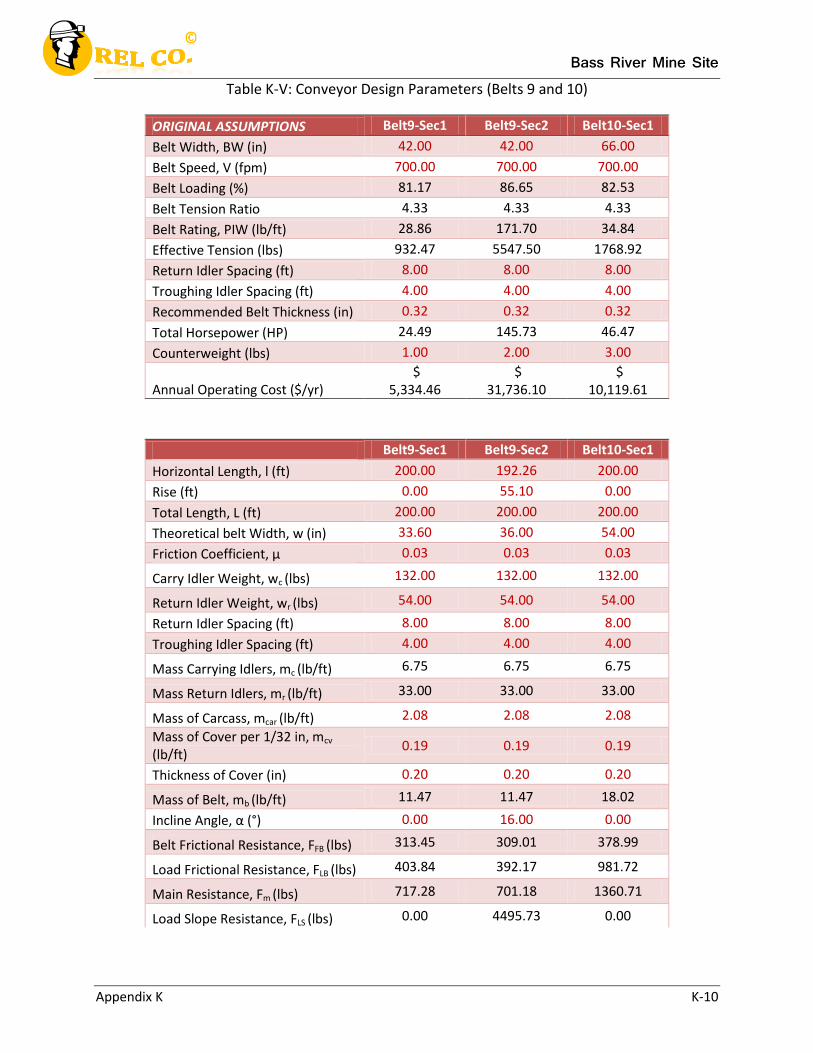
Bass River Mine Site
Appendix K K-10
Table K-V: Conveyor Design Parameters (Belts 9 and 10)
ORIGINAL ASSUMPTIONS Belt9-Sec1 Belt9-Sec2 Belt10-Sec1
Belt Width, BW (in) 42.00 42.00 66.00
Belt Speed, V (fpm) 700.00 700.00 700.00
Belt Loading (%) 81.17 86.65 82.53
Belt Tension Ratio 4.33 4.33 4.33
Belt Rating, PIW (lb/ft) 28.86 171.70 34.84
Effective Tension (lbs) 932.47 5547.50 1768.92
Return Idler Spacing (ft) 8.00 8.00 8.00
Troughing Idler Spacing (ft) 4.00 4.00 4.00
Recommended Belt Thickness (in) 0.32 0.32 0.32
Total Horsepower (HP) 24.49 145.73 46.47
Counterweight (lbs) 1.00 2.00 3.00
Annual Operating Cost ($/yr) $
5,334.46 $
31,736.10 $
10,119.61
Belt9-Sec1 Belt9-Sec2 Belt10-Sec1
Horizontal Length, l (ft) 200.00 192.26 200.00
Rise (ft) 0.00 55.10 0.00
Total Length, L (ft) 200.00 200.00 200.00
Theoretical belt Width, w (in) 33.60 36.00 54.00
Friction Coefficient, µ 0.03 0.03 0.03
Carry Idler Weight, wc (lbs) 132.00 132.00 132.00
Return Idler Weight, wr (lbs) 54.00 54.00 54.00
Return Idler Spacing (ft) 8.00 8.00 8.00
Troughing Idler Spacing (ft) 4.00 4.00 4.00
Mass Carrying Idlers, mc (lb/ft) 6.75 6.75 6.75
Mass Return Idlers, mr (lb/ft) 33.00 33.00 33.00
Mass of Carcass, mcar (lb/ft) 2.08 2.08 2.08
Mass of Cover per 1/32 in, mcv
(lb/ft) 0.19 0.19 0.19
Thickness of Cover (in) 0.20 0.20 0.20
Mass of Belt, mb (lb/ft) 11.47 11.47 18.02
Incline Angle, α (°) 0.00 16.00 0.00
Belt Frictional Resistance, FFB (lbs) 313.45 309.01 378.99
Load Frictional Resistance, FLB (lbs) 403.84 392.17 981.72
Main Resistance, Fm (lbs) 717.28 701.18 1360.71
Load Slope Resistance, FLS (lbs) 0.00 4495.73 0.00
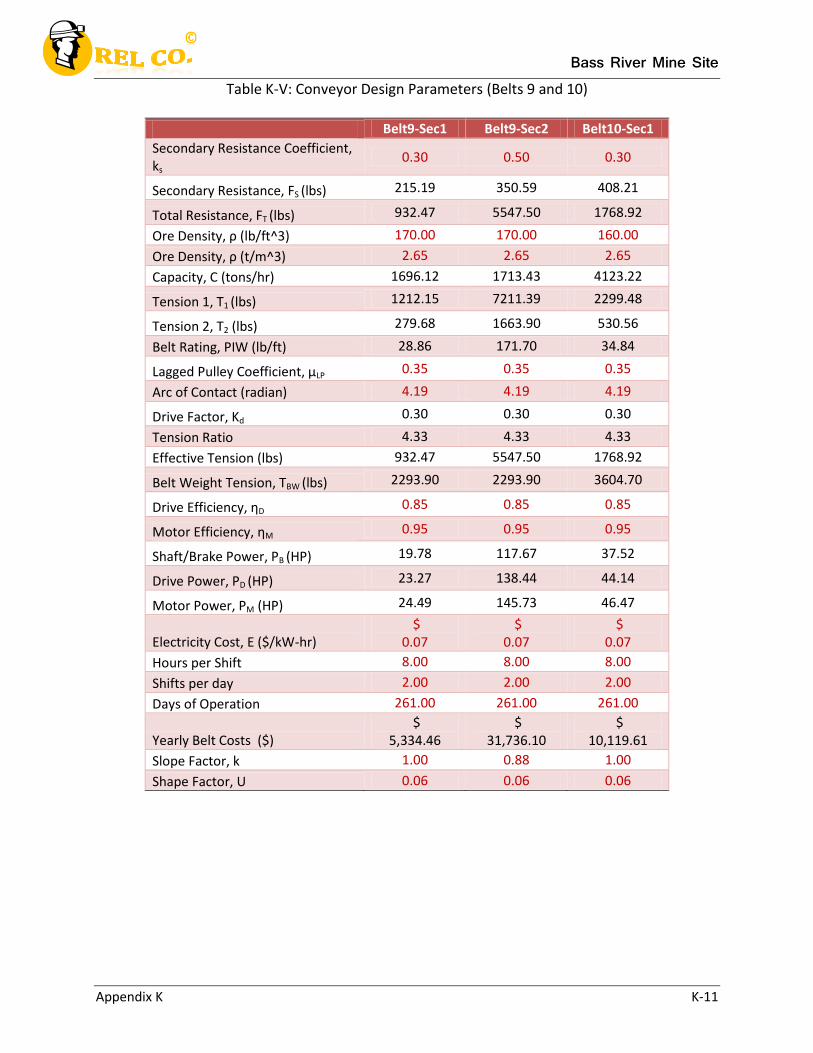
Bass River Mine Site
Appendix K K-11
Table K-V: Conveyor Design Parameters (Belts 9 and 10)
Belt9-Sec1 Belt9-Sec2 Belt10-Sec1
Secondary Resistance Coefficient, ks
0.30 0.50 0.30
Secondary Resistance, FS (lbs) 215.19 350.59 408.21
Total Resistance, FT (lbs) 932.47 5547.50 1768.92
Ore Density, ρ (lb/ft^3) 170.00 170.00 160.00
Ore Density, ρ (t/m^3) 2.65 2.65 2.65
Capacity, C (tons/hr) 1696.12 1713.43 4123.22
Tension 1, T1 (lbs) 1212.15 7211.39 2299.48
Tension 2, T2 (lbs) 279.68 1663.90 530.56
Belt Rating, PIW (lb/ft) 28.86 171.70 34.84
Lagged Pulley Coefficient, µLP 0.35 0.35 0.35
Arc of Contact (radian) 4.19 4.19 4.19
Drive Factor, Kd 0.30 0.30 0.30
Tension Ratio 4.33 4.33 4.33
Effective Tension (lbs) 932.47 5547.50 1768.92
Belt Weight Tension, TBW (lbs) 2293.90 2293.90 3604.70
Drive Efficiency, ƞD 0.85 0.85 0.85
Motor Efficiency, ƞM 0.95 0.95 0.95
Shaft/Brake Power, PB (HP) 19.78 117.67 37.52
Drive Power, PD (HP) 23.27 138.44 44.14
Motor Power, PM (HP) 24.49 145.73 46.47
Electricity Cost, E ($/kW-hr) $
0.07 $
0.07 $
0.07
Hours per Shift 8.00 8.00 8.00
Shifts per day 2.00 2.00 2.00
Days of Operation 261.00 261.00 261.00
Yearly Belt Costs ($) $
5,334.46 $
31,736.10 $
10,119.61
Slope Factor, k 1.00 0.88 1.00
Shape Factor, U 0.06 0.06 0.06
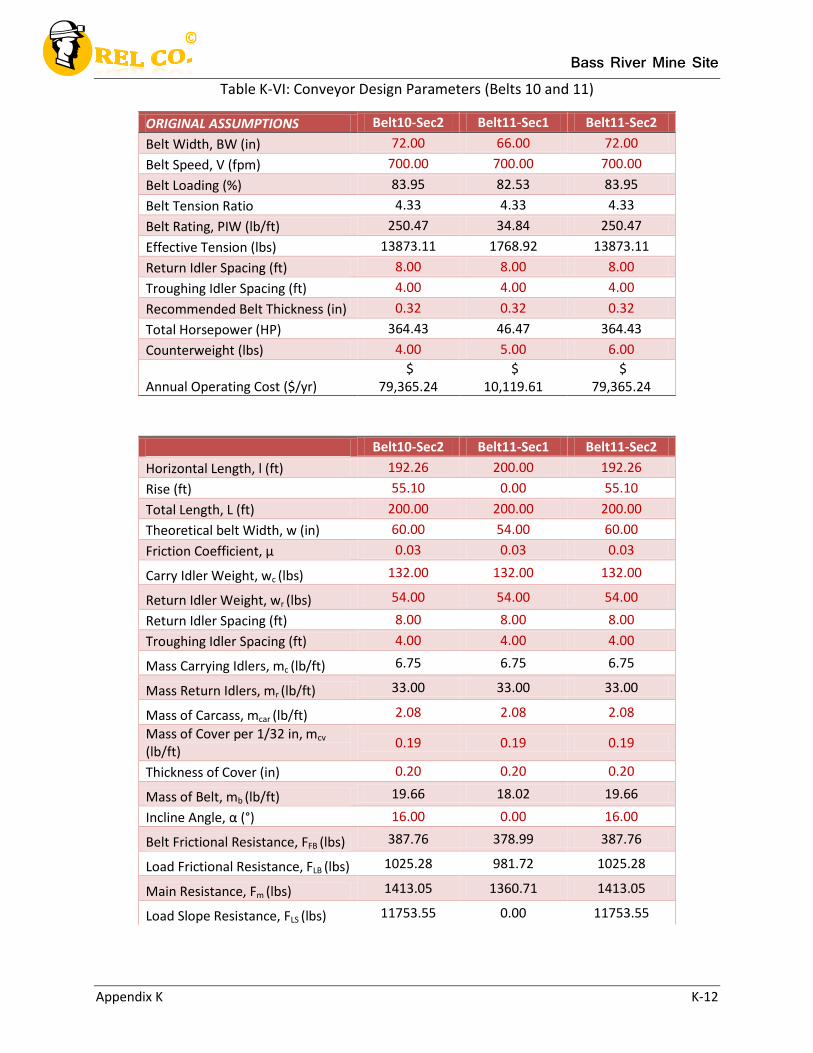
Bass River Mine Site
Appendix K K-12
Table K-VI: Conveyor Design Parameters (Belts 10 and 11)
ORIGINAL ASSUMPTIONS Belt10-Sec2 Belt11-Sec1 Belt11-Sec2
Belt Width, BW (in) 72.00 66.00 72.00
Belt Speed, V (fpm) 700.00 700.00 700.00
Belt Loading (%) 83.95 82.53 83.95
Belt Tension Ratio 4.33 4.33 4.33
Belt Rating, PIW (lb/ft) 250.47 34.84 250.47
Effective Tension (lbs) 13873.11 1768.92 13873.11
Return Idler Spacing (ft) 8.00 8.00 8.00
Troughing Idler Spacing (ft) 4.00 4.00 4.00
Recommended Belt Thickness (in) 0.32 0.32 0.32
Total Horsepower (HP) 364.43 46.47 364.43
Counterweight (lbs) 4.00 5.00 6.00
Annual Operating Cost ($/yr) $
79,365.24 $
10,119.61 $
79,365.24
Belt10-Sec2 Belt11-Sec1 Belt11-Sec2
Horizontal Length, l (ft) 192.26 200.00 192.26
Rise (ft) 55.10 0.00 55.10
Total Length, L (ft) 200.00 200.00 200.00
Theoretical belt Width, w (in) 60.00 54.00 60.00
Friction Coefficient, µ 0.03 0.03 0.03
Carry Idler Weight, wc (lbs) 132.00 132.00 132.00
Return Idler Weight, wr (lbs) 54.00 54.00 54.00
Return Idler Spacing (ft) 8.00 8.00 8.00
Troughing Idler Spacing (ft) 4.00 4.00 4.00
Mass Carrying Idlers, mc (lb/ft) 6.75 6.75 6.75
Mass Return Idlers, mr (lb/ft) 33.00 33.00 33.00
Mass of Carcass, mcar (lb/ft) 2.08 2.08 2.08
Mass of Cover per 1/32 in, mcv
(lb/ft) 0.19 0.19 0.19
Thickness of Cover (in) 0.20 0.20 0.20
Mass of Belt, mb (lb/ft) 19.66 18.02 19.66
Incline Angle, α (°) 16.00 0.00 16.00
Belt Frictional Resistance, FFB (lbs) 387.76 378.99 387.76
Load Frictional Resistance, FLB (lbs) 1025.28 981.72 1025.28
Main Resistance, Fm (lbs) 1413.05 1360.71 1413.05
Load Slope Resistance, FLS (lbs) 11753.55 0.00 11753.55
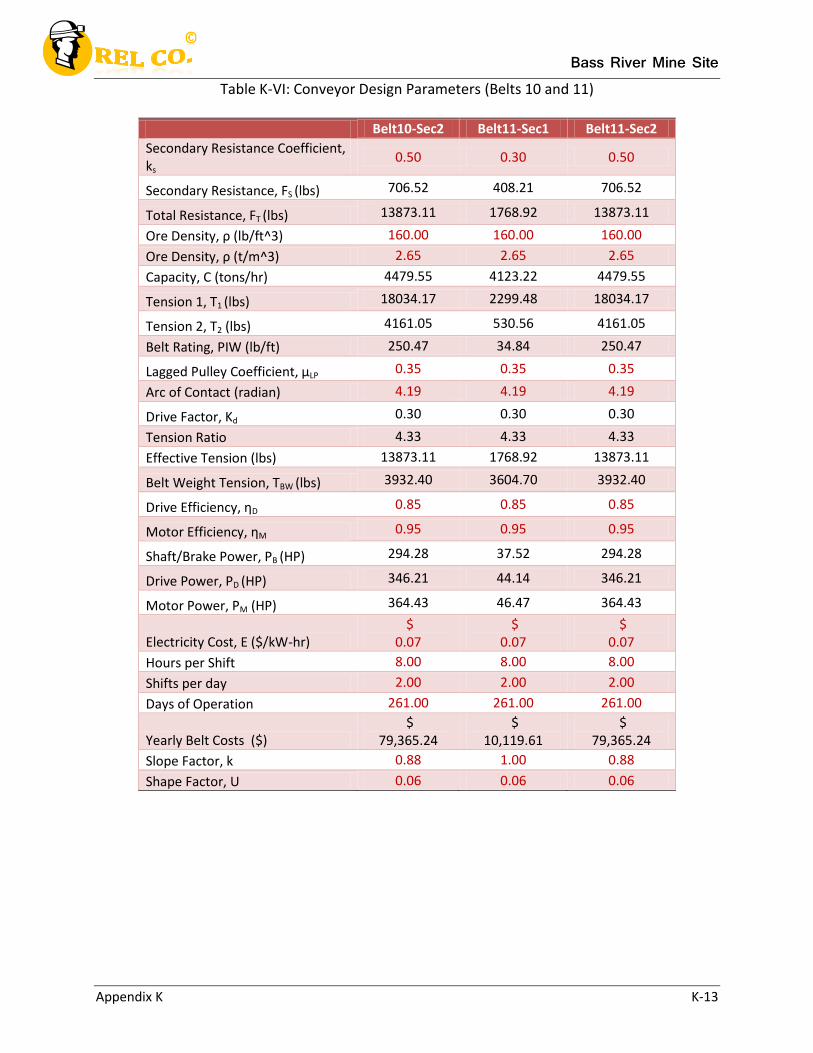
Bass River Mine Site
Appendix K K-13
Table K-VI: Conveyor Design Parameters (Belts 10 and 11)
Belt10-Sec2 Belt11-Sec1 Belt11-Sec2
Secondary Resistance Coefficient, ks
0.50 0.30 0.50
Secondary Resistance, FS (lbs) 706.52 408.21 706.52
Total Resistance, FT (lbs) 13873.11 1768.92 13873.11
Ore Density, ρ (lb/ft^3) 160.00 160.00 160.00
Ore Density, ρ (t/m^3) 2.65 2.65 2.65
Capacity, C (tons/hr) 4479.55 4123.22 4479.55
Tension 1, T1 (lbs) 18034.17 2299.48 18034.17
Tension 2, T2 (lbs) 4161.05 530.56 4161.05
Belt Rating, PIW (lb/ft) 250.47 34.84 250.47
Lagged Pulley Coefficient, µLP 0.35 0.35 0.35
Arc of Contact (radian) 4.19 4.19 4.19
Drive Factor, Kd 0.30 0.30 0.30
Tension Ratio 4.33 4.33 4.33
Effective Tension (lbs) 13873.11 1768.92 13873.11
Belt Weight Tension, TBW (lbs) 3932.40 3604.70 3932.40
Drive Efficiency, ƞD 0.85 0.85 0.85
Motor Efficiency, ƞM 0.95 0.95 0.95
Shaft/Brake Power, PB (HP) 294.28 37.52 294.28
Drive Power, PD (HP) 346.21 44.14 346.21
Motor Power, PM (HP) 364.43 46.47 364.43
Electricity Cost, E ($/kW-hr) $
0.07 $
0.07 $
0.07
Hours per Shift 8.00 8.00 8.00
Shifts per day 2.00 2.00 2.00
Days of Operation 261.00 261.00 261.00
Yearly Belt Costs ($) $
79,365.24 $
10,119.61 $
79,365.24
Slope Factor, k 0.88 1.00 0.88
Shape Factor, U 0.06 0.06 0.06
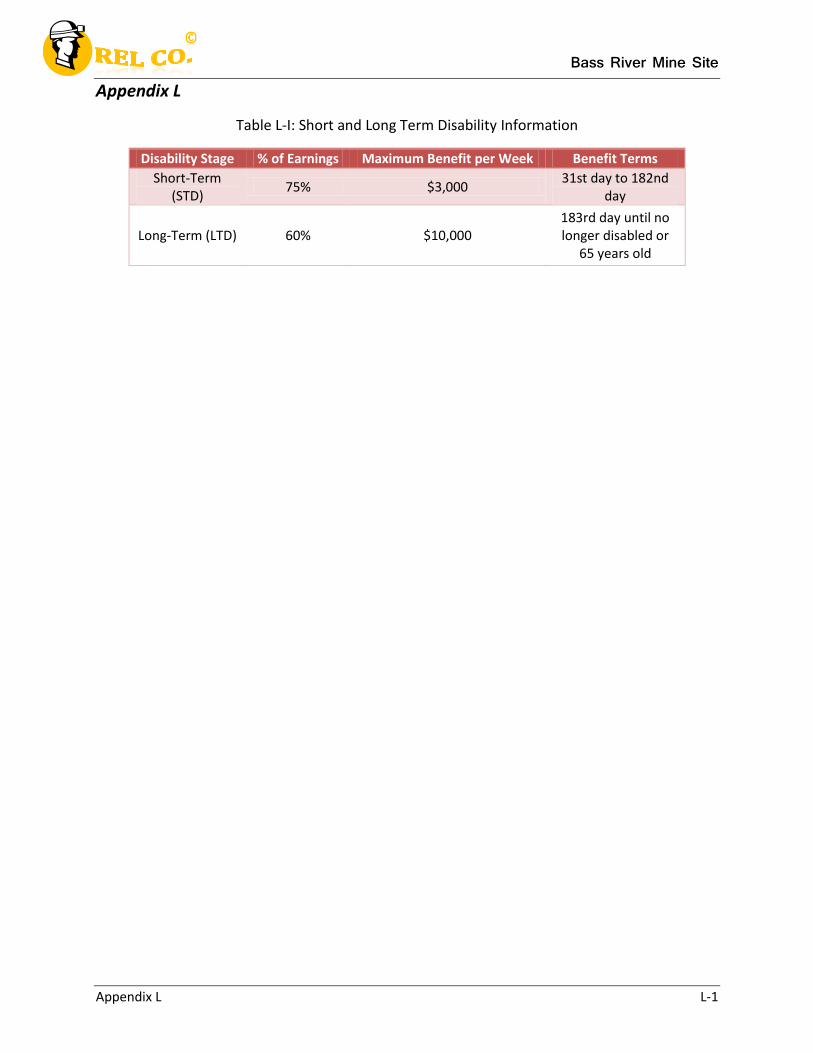
Bass River Mine Site
Appendix L L-1
Appendix L
Table L-I: Short and Long Term Disability Information
Disability Stage % of Earnings Maximum Benefit per Week Benefit Terms
Short-Term (STD)
75% $3,000 31st day to 182nd
day
Long-Term (LTD) 60% $10,000 183rd day until no longer disabled or
65 years old
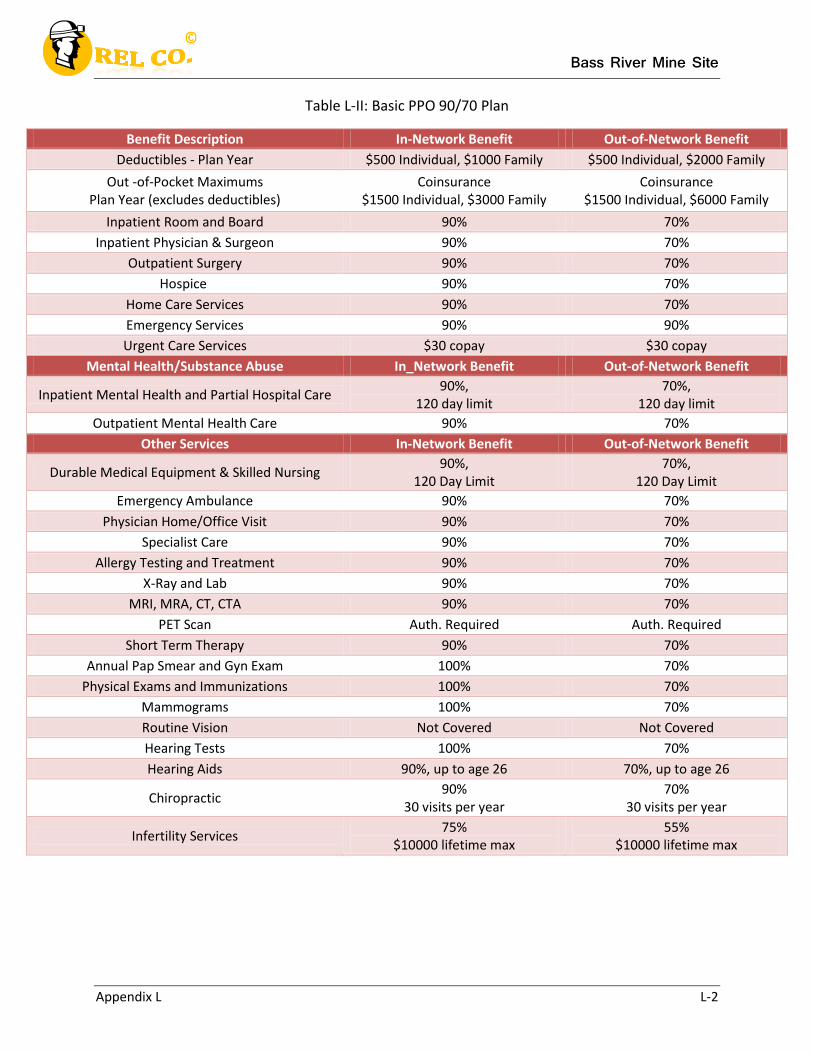
Bass River Mine Site
Appendix L L-2
Table L-II: Basic PPO 90/70 Plan
Benefit Description In-Network Benefit Out-of-Network Benefit
Deductibles - Plan Year $500 Individual, $1000 Family $500 Individual, $2000 Family
Out -of-Pocket Maximums Plan Year (excludes deductibles)
Coinsurance $1500 Individual, $3000 Family
Coinsurance $1500 Individual, $6000 Family
Inpatient Room and Board 90% 70%
Inpatient Physician & Surgeon 90% 70%
Outpatient Surgery 90% 70%
Hospice 90% 70%
Home Care Services 90% 70%
Emergency Services 90% 90%
Urgent Care Services $30 copay $30 copay
Mental Health/Substance Abuse In_Network Benefit Out-of-Network Benefit
Inpatient Mental Health and Partial Hospital Care 90%,
120 day limit 70%,
120 day limit
Outpatient Mental Health Care 90% 70%
Other Services In-Network Benefit Out-of-Network Benefit
Durable Medical Equipment & Skilled Nursing 90%,
120 Day Limit 70%,
120 Day Limit
Emergency Ambulance 90% 70%
Physician Home/Office Visit 90% 70%
Specialist Care 90% 70%
Allergy Testing and Treatment 90% 70%
X-Ray and Lab 90% 70%
MRI, MRA, CT, CTA 90% 70%
PET Scan Auth. Required Auth. Required
Short Term Therapy 90% 70%
Annual Pap Smear and Gyn Exam 100% 70%
Physical Exams and Immunizations 100% 70%
Mammograms 100% 70%
Routine Vision Not Covered Not Covered
Hearing Tests 100% 70%
Hearing Aids 90%, up to age 26 70%, up to age 26
Chiropractic 90%
30 visits per year 70%
30 visits per year
Infertility Services 75%
$10000 lifetime max 55%
$10000 lifetime max
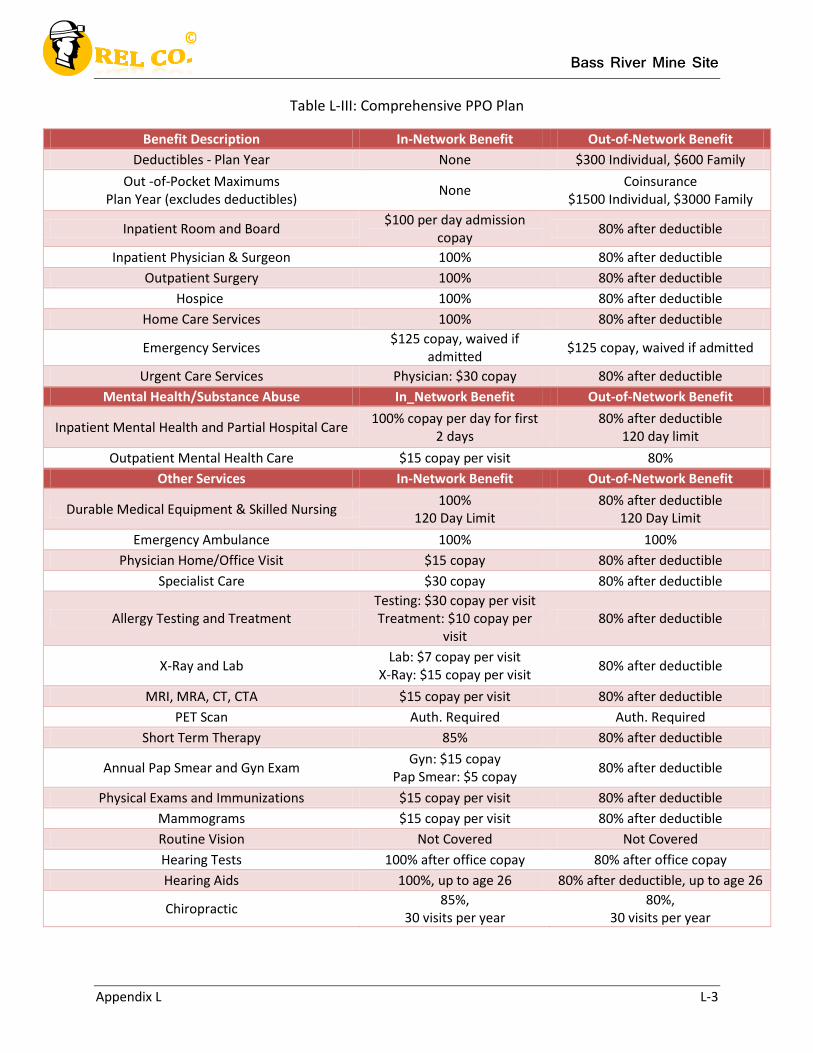
Bass River Mine Site
Appendix L L-3
Table L-III: Comprehensive PPO Plan
Benefit Description In-Network Benefit Out-of-Network Benefit
Deductibles - Plan Year None $300 Individual, $600 Family
Out -of-Pocket Maximums Plan Year (excludes deductibles)
None Coinsurance
$1500 Individual, $3000 Family
Inpatient Room and Board $100 per day admission
copay 80% after deductible
Inpatient Physician & Surgeon 100% 80% after deductible
Outpatient Surgery 100% 80% after deductible
Hospice 100% 80% after deductible
Home Care Services 100% 80% after deductible
Emergency Services $125 copay, waived if
admitted $125 copay, waived if admitted
Urgent Care Services Physician: $30 copay 80% after deductible
Mental Health/Substance Abuse In_Network Benefit Out-of-Network Benefit
Inpatient Mental Health and Partial Hospital Care 100% copay per day for first
2 days 80% after deductible
120 day limit
Outpatient Mental Health Care $15 copay per visit 80%
Other Services In-Network Benefit Out-of-Network Benefit
Durable Medical Equipment & Skilled Nursing 100%
120 Day Limit 80% after deductible
120 Day Limit
Emergency Ambulance 100% 100%
Physician Home/Office Visit $15 copay 80% after deductible
Specialist Care $30 copay 80% after deductible
Allergy Testing and Treatment Testing: $30 copay per visit Treatment: $10 copay per
visit 80% after deductible
X-Ray and Lab Lab: $7 copay per visit
X-Ray: $15 copay per visit 80% after deductible
MRI, MRA, CT, CTA $15 copay per visit 80% after deductible
PET Scan Auth. Required Auth. Required
Short Term Therapy 85% 80% after deductible
Annual Pap Smear and Gyn Exam Gyn: $15 copay
Pap Smear: $5 copay 80% after deductible
Physical Exams and Immunizations $15 copay per visit 80% after deductible
Mammograms $15 copay per visit 80% after deductible
Routine Vision Not Covered Not Covered
Hearing Tests 100% after office copay 80% after office copay
Hearing Aids 100%, up to age 26 80% after deductible, up to age 26
Chiropractic 85%,
30 visits per year 80%,
30 visits per year
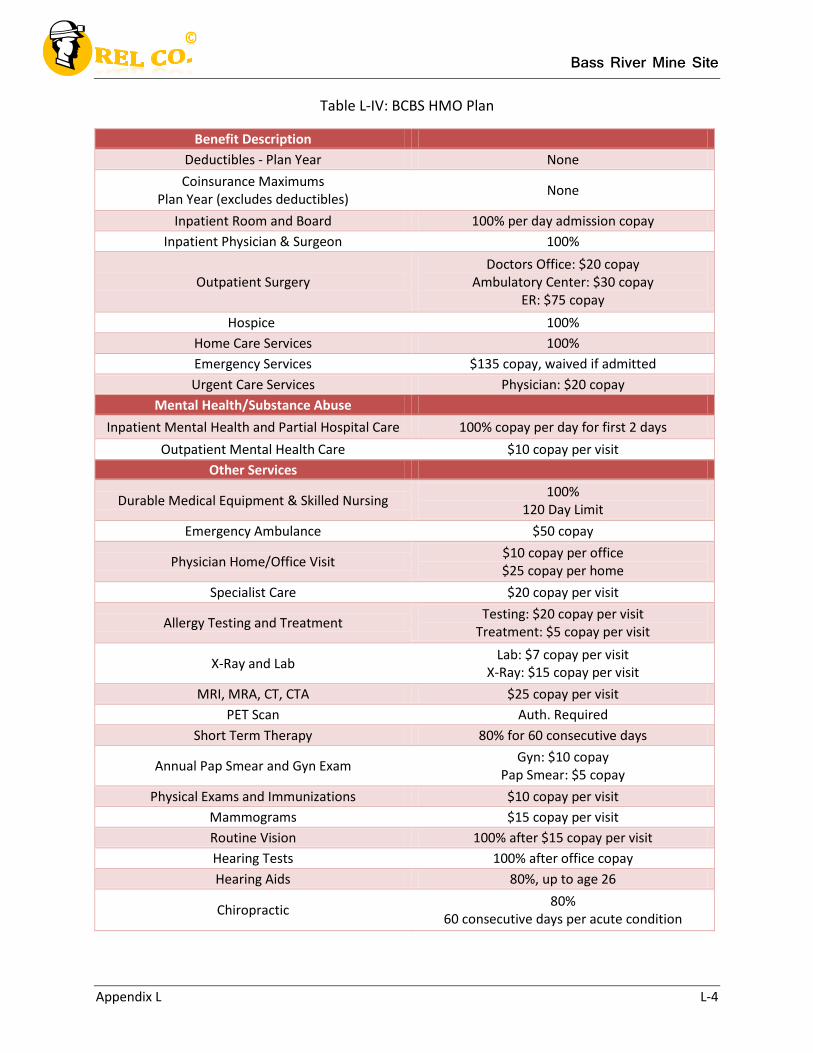
Bass River Mine Site
Appendix L L-4
Table L-IV: BCBS HMO Plan
Benefit Description
Deductibles - Plan Year None
Coinsurance Maximums Plan Year (excludes deductibles)
None
Inpatient Room and Board 100% per day admission copay
Inpatient Physician & Surgeon 100%
Outpatient Surgery Doctors Office: $20 copay
Ambulatory Center: $30 copay ER: $75 copay
Hospice 100%
Home Care Services 100%
Emergency Services $135 copay, waived if admitted
Urgent Care Services Physician: $20 copay
Mental Health/Substance Abuse
Inpatient Mental Health and Partial Hospital Care 100% copay per day for first 2 days
Outpatient Mental Health Care $10 copay per visit
Other Services
Durable Medical Equipment & Skilled Nursing 100%
120 Day Limit
Emergency Ambulance $50 copay
Physician Home/Office Visit $10 copay per office $25 copay per home
Specialist Care $20 copay per visit
Allergy Testing and Treatment Testing: $20 copay per visit
Treatment: $5 copay per visit
X-Ray and Lab Lab: $7 copay per visit
X-Ray: $15 copay per visit
MRI, MRA, CT, CTA $25 copay per visit
PET Scan Auth. Required
Short Term Therapy 80% for 60 consecutive days
Annual Pap Smear and Gyn Exam Gyn: $10 copay
Pap Smear: $5 copay
Physical Exams and Immunizations $10 copay per visit
Mammograms $15 copay per visit
Routine Vision 100% after $15 copay per visit
Hearing Tests 100% after office copay
Hearing Aids 80%, up to age 26
Chiropractic 80%
60 consecutive days per acute condition
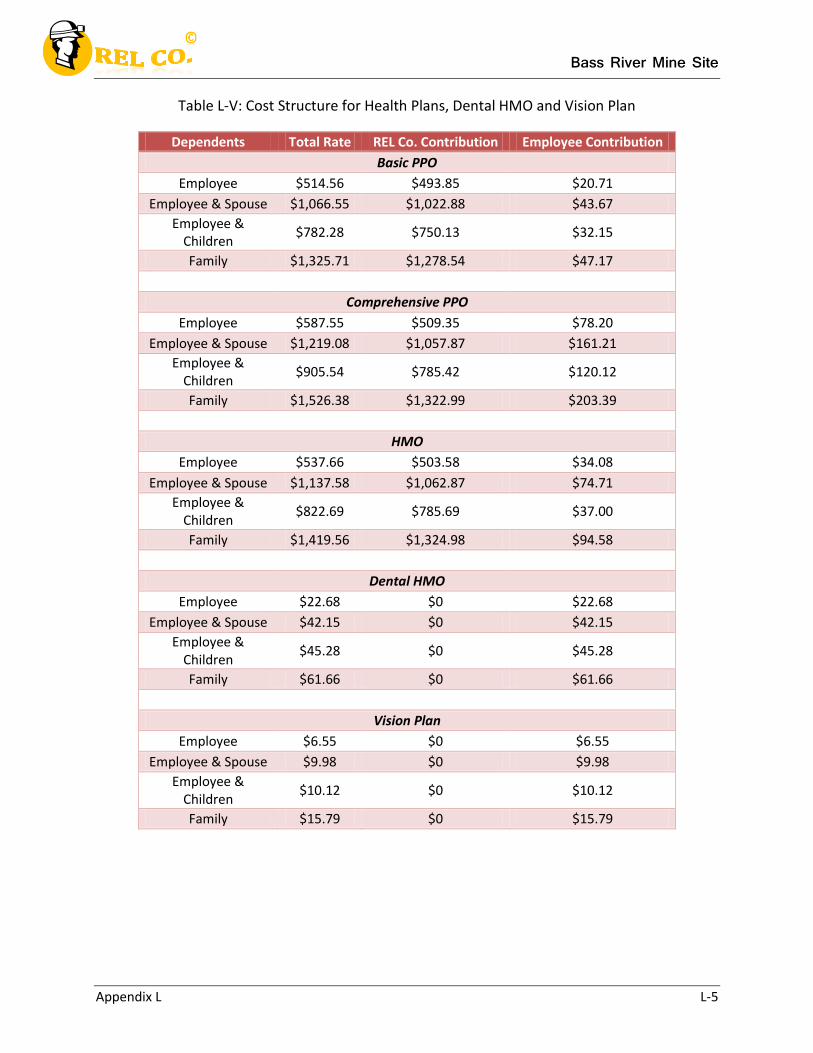
Bass River Mine Site
Appendix L L-5
Table L-V: Cost Structure for Health Plans, Dental HMO and Vision Plan
Dependents Total Rate REL Co. Contribution Employee Contribution
Basic PPO
Employee $514.56 $493.85 $20.71
Employee & Spouse $1,066.55 $1,022.88 $43.67
Employee & Children
$782.28 $750.13 $32.15
Family $1,325.71 $1,278.54 $47.17
Comprehensive PPO
Employee $587.55 $509.35 $78.20
Employee & Spouse $1,219.08 $1,057.87 $161.21
Employee & Children
$905.54 $785.42 $120.12
Family $1,526.38 $1,322.99 $203.39
HMO
Employee $537.66 $503.58 $34.08
Employee & Spouse $1,137.58 $1,062.87 $74.71
Employee & Children
$822.69 $785.69 $37.00
Family $1,419.56 $1,324.98 $94.58
Dental HMO
Employee $22.68 $0 $22.68
Employee & Spouse $42.15 $0 $42.15
Employee & Children
$45.28 $0 $45.28
Family $61.66 $0 $61.66
Vision Plan
Employee $6.55 $0 $6.55
Employee & Spouse $9.98 $0 $9.98
Employee & Children
$10.12 $0 $10.12
Family $15.79 $0 $15.79
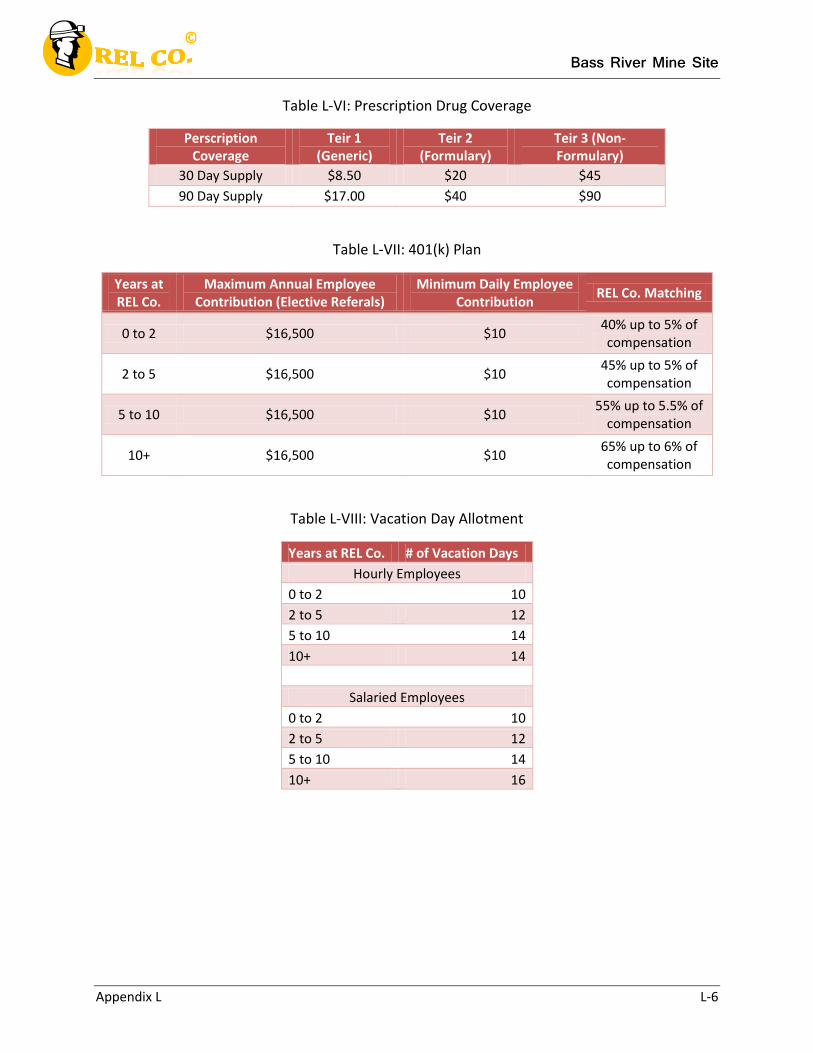
Bass River Mine Site
Appendix L L-6
Table L-VI: Prescription Drug Coverage
Perscription Coverage
Teir 1 (Generic)
Teir 2 (Formulary)
Teir 3 (Non-Formulary)
30 Day Supply $8.50 $20 $45
90 Day Supply $17.00 $40 $90
Table L-VII: 401(k) Plan
Years at REL Co.
Maximum Annual Employee Contribution (Elective Referals)
Minimum Daily Employee Contribution
REL Co. Matching
0 to 2 $16,500 $10 40% up to 5% of compensation
2 to 5 $16,500 $10 45% up to 5% of compensation
5 to 10 $16,500 $10 55% up to 5.5% of
compensation
10+ $16,500 $10 65% up to 6% of compensation
Table L-VIII: Vacation Day Allotment
Years at REL Co. # of Vacation Days
Hourly Employees
0 to 2 10
2 to 5 12
5 to 10 14
10+ 14
Salaried Employees
0 to 2 10
2 to 5 12
5 to 10 14
10+ 16
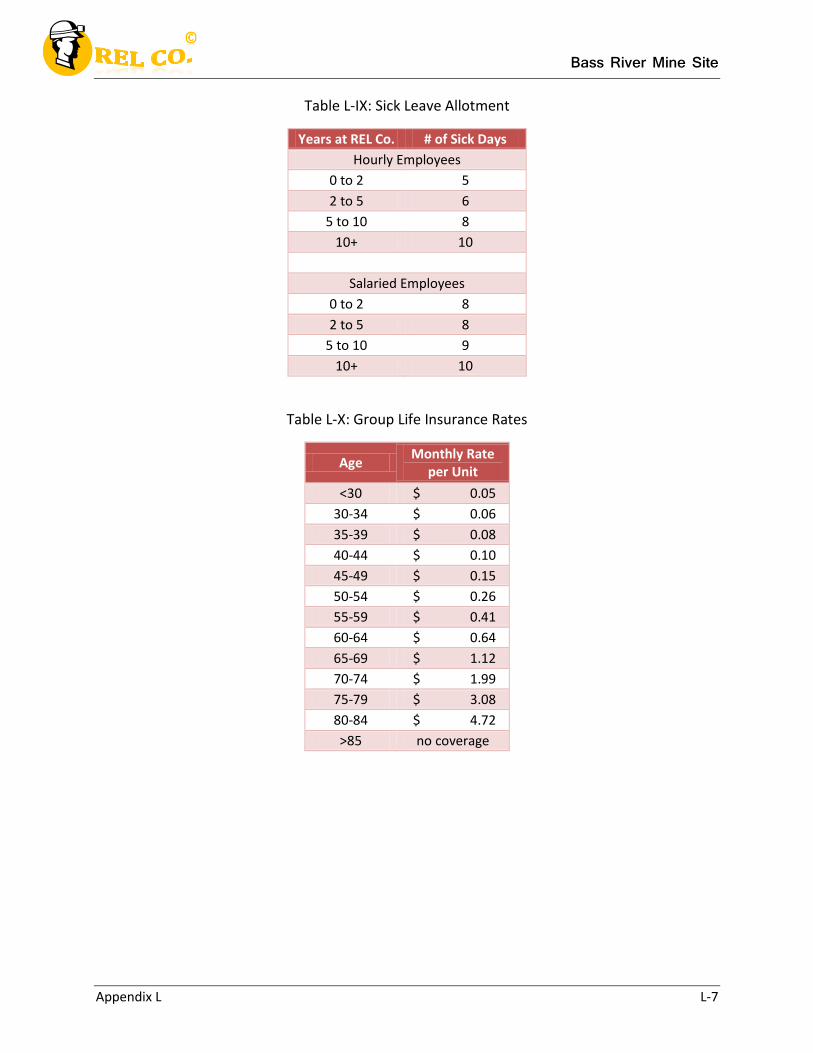
Bass River Mine Site
Appendix L L-7
Table L-IX: Sick Leave Allotment
Years at REL Co. # of Sick Days
Hourly Employees
0 to 2 5
2 to 5 6
5 to 10 8
10+ 10
Salaried Employees
0 to 2 8
2 to 5 8
5 to 10 9
10+ 10
Table L-X: Group Life Insurance Rates
Age Monthly Rate
per Unit
<30 $ 0.05
30-34 $ 0.06
35-39 $ 0.08
40-44 $ 0.10
45-49 $ 0.15
50-54 $ 0.26
55-59 $ 0.41
60-64 $ 0.64
65-69 $ 1.12
70-74 $ 1.99
75-79 $ 3.08
80-84 $ 4.72
>85 no coverage
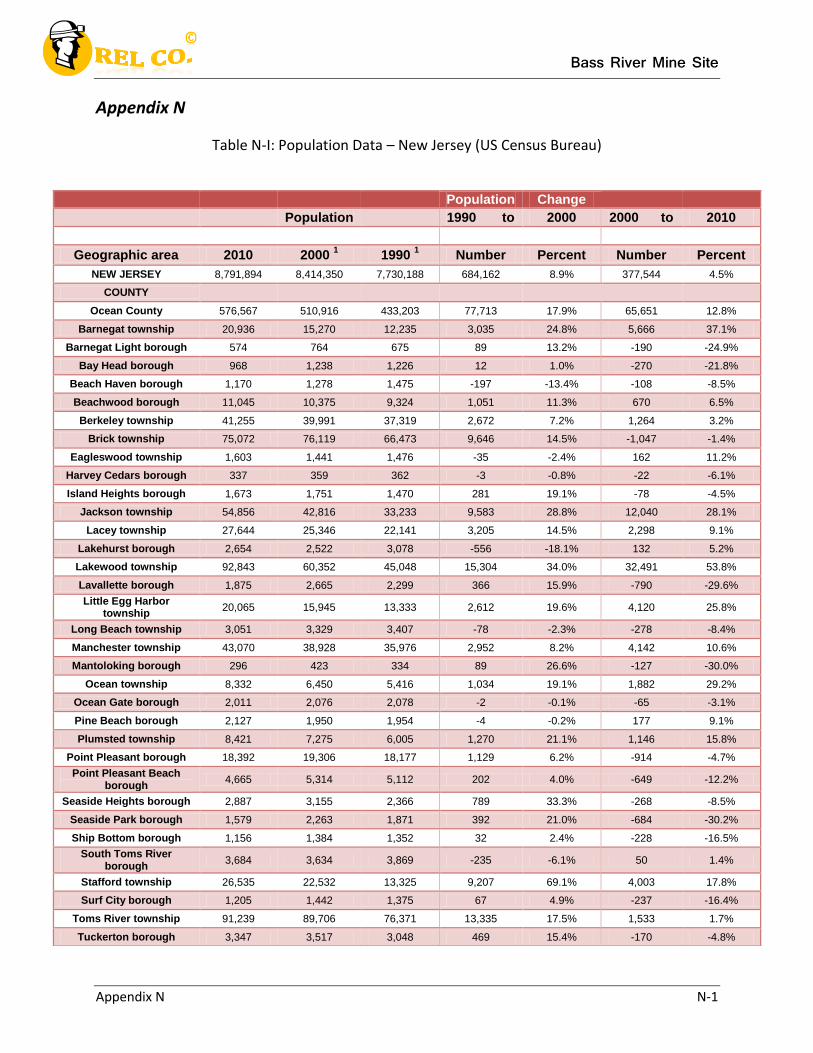
Bass River Mine Site
Appendix N N-1
Appendix N
Table N-I: Population Data – New Jersey (US Census Bureau)
Population Change
Population
1990 to 2000 2000 to 2010
Geographic area 2010 2000
1 1990
1 Number Percent Number Percent
NEW JERSEY 8,791,894 8,414,350 7,730,188 684,162 8.9% 377,544 4.5%
COUNTY
Ocean County 576,567 510,916 433,203 77,713 17.9% 65,651 12.8%
Barnegat township 20,936 15,270 12,235 3,035 24.8% 5,666 37.1%
Barnegat Light borough 574 764 675 89 13.2% -190 -24.9%
Bay Head borough 968 1,238 1,226 12 1.0% -270 -21.8%
Beach Haven borough 1,170 1,278 1,475 -197 -13.4% -108 -8.5%
Beachwood borough 11,045 10,375 9,324 1,051 11.3% 670 6.5%
Berkeley township 41,255 39,991 37,319 2,672 7.2% 1,264 3.2%
Brick township 75,072 76,119 66,473 9,646 14.5% -1,047 -1.4%
Eagleswood township 1,603 1,441 1,476 -35 -2.4% 162 11.2%
Harvey Cedars borough 337 359 362 -3 -0.8% -22 -6.1%
Island Heights borough 1,673 1,751 1,470 281 19.1% -78 -4.5%
Jackson township 54,856 42,816 33,233 9,583 28.8% 12,040 28.1%
Lacey township 27,644 25,346 22,141 3,205 14.5% 2,298 9.1%
Lakehurst borough 2,654 2,522 3,078 -556 -18.1% 132 5.2%
Lakewood township 92,843 60,352 45,048 15,304 34.0% 32,491 53.8%
Lavallette borough 1,875 2,665 2,299 366 15.9% -790 -29.6%
Little Egg Harbor township
20,065 15,945 13,333 2,612 19.6% 4,120 25.8%
Long Beach township 3,051 3,329 3,407 -78 -2.3% -278 -8.4%
Manchester township 43,070 38,928 35,976 2,952 8.2% 4,142 10.6%
Mantoloking borough 296 423 334 89 26.6% -127 -30.0%
Ocean township 8,332 6,450 5,416 1,034 19.1% 1,882 29.2%
Ocean Gate borough 2,011 2,076 2,078 -2 -0.1% -65 -3.1%
Pine Beach borough 2,127 1,950 1,954 -4 -0.2% 177 9.1%
Plumsted township 8,421 7,275 6,005 1,270 21.1% 1,146 15.8%
Point Pleasant borough 18,392 19,306 18,177 1,129 6.2% -914 -4.7%
Point Pleasant Beach borough
4,665 5,314 5,112 202 4.0% -649 -12.2%
Seaside Heights borough 2,887 3,155 2,366 789 33.3% -268 -8.5%
Seaside Park borough 1,579 2,263 1,871 392 21.0% -684 -30.2%
Ship Bottom borough 1,156 1,384 1,352 32 2.4% -228 -16.5%
South Toms River borough
3,684 3,634 3,869 -235 -6.1% 50 1.4%
Stafford township 26,535 22,532 13,325 9,207 69.1% 4,003 17.8%
Surf City borough 1,205 1,442 1,375 67 4.9% -237 -16.4%
Toms River township 91,239 89,706 76,371 13,335 17.5% 1,533 1.7%
Tuckerton borough 3,347 3,517 3,048 469 15.4% -170 -4.8%
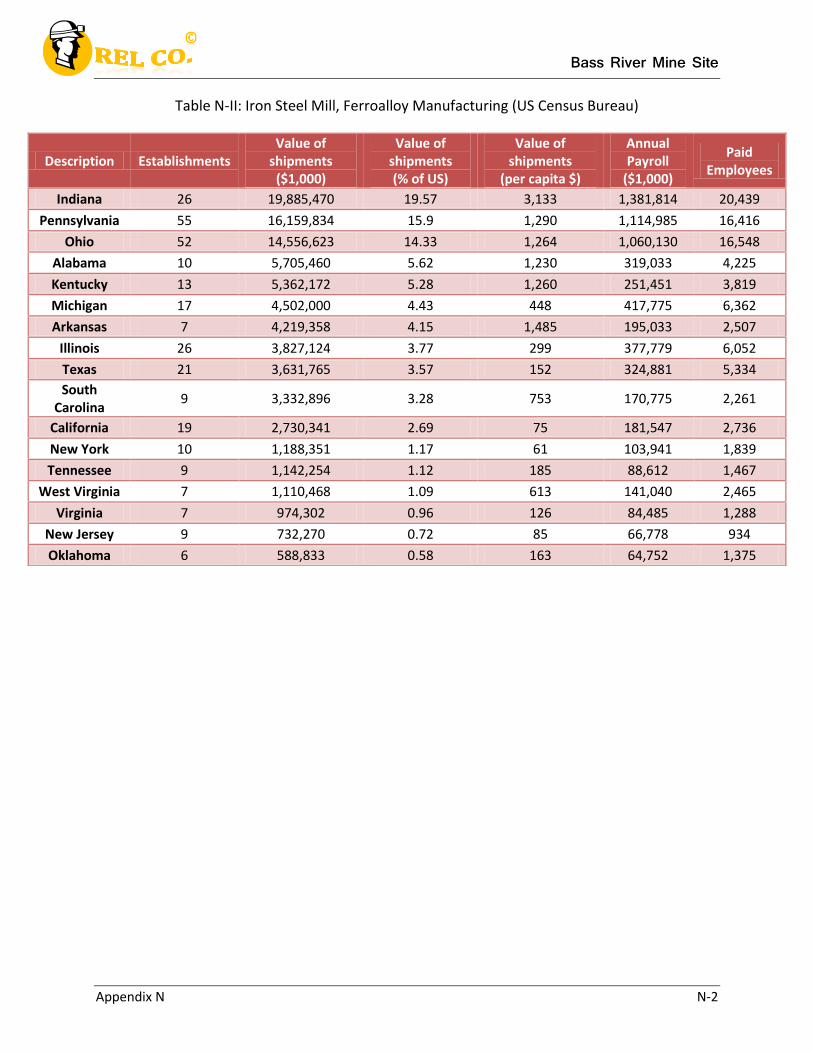
Bass River Mine Site
Appendix N N-2
Table N-II: Iron Steel Mill, Ferroalloy Manufacturing (US Census Bureau)
Description Establishments Value of
shipments ($1,000)
Value of shipments (% of US)
Value of shipments
(per capita $)
Annual Payroll
($1,000)
Paid Employees
Indiana 26 19,885,470 19.57 3,133 1,381,814 20,439
Pennsylvania 55 16,159,834 15.9 1,290 1,114,985 16,416
Ohio 52 14,556,623 14.33 1,264 1,060,130 16,548
Alabama 10 5,705,460 5.62 1,230 319,033 4,225
Kentucky 13 5,362,172 5.28 1,260 251,451 3,819
Michigan 17 4,502,000 4.43 448 417,775 6,362
Arkansas 7 4,219,358 4.15 1,485 195,033 2,507
Illinois 26 3,827,124 3.77 299 377,779 6,052
Texas 21 3,631,765 3.57 152 324,881 5,334
South Carolina
9 3,332,896 3.28 753 170,775 2,261
California 19 2,730,341 2.69 75 181,547 2,736
New York 10 1,188,351 1.17 61 103,941 1,839
Tennessee 9 1,142,254 1.12 185 88,612 1,467
West Virginia 7 1,110,468 1.09 613 141,040 2,465
Virginia 7 974,302 0.96 126 84,485 1,288
New Jersey 9 732,270 0.72 85 66,778 934
Oklahoma 6 588,833 0.58 163 64,752 1,375
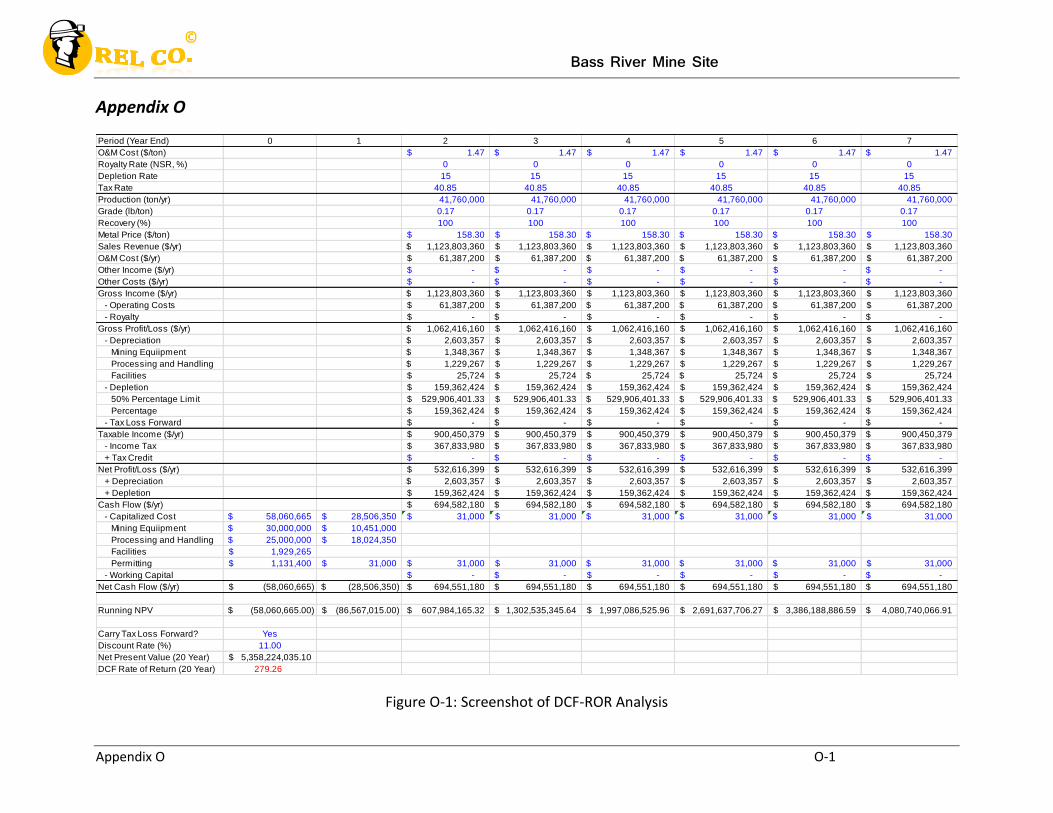
Bass River Mine Site
Appendix O O-1
Appendix O
Figure O-1: Screenshot of DCF-ROR Analysis
Period (Year End) 0 1 2 3 4 5 6 7
O&M Cost ($/ton) 1.47$ 1.47$ 1.47$ 1.47$ 1.47$ 1.47$
Royalty Rate (NSR, %) 0 0 0 0 0 0
Depletion Rate 15 15 15 15 15 15
Tax Rate 40.85 40.85 40.85 40.85 40.85 40.85
Production (ton/yr) 41,760,000 41,760,000 41,760,000 41,760,000 41,760,000 41,760,000
Grade (lb/ton) 0.17 0.17 0.17 0.17 0.17 0.17
Recovery (%) 100 100 100 100 100 100
Metal Price ($/ton) 158.30$ 158.30$ 158.30$ 158.30$ 158.30$ 158.30$
Sales Revenue ($/yr) 1,123,803,360$ 1,123,803,360$ 1,123,803,360$ 1,123,803,360$ 1,123,803,360$ 1,123,803,360$
O&M Cost ($/yr) 61,387,200$ 61,387,200$ 61,387,200$ 61,387,200$ 61,387,200$ 61,387,200$
Other Income ($/yr) -$ -$ -$ -$ -$ -$
Other Costs ($/yr) -$ -$ -$ -$ -$ -$
Gross Income ($/yr) 1,123,803,360$ 1,123,803,360$ 1,123,803,360$ 1,123,803,360$ 1,123,803,360$ 1,123,803,360$
- Operating Costs 61,387,200$ 61,387,200$ 61,387,200$ 61,387,200$ 61,387,200$ 61,387,200$
- Royalty -$ -$ -$ -$ -$ -$
Gross Profit/Loss ($/yr) 1,062,416,160$ 1,062,416,160$ 1,062,416,160$ 1,062,416,160$ 1,062,416,160$ 1,062,416,160$
- Depreciation 2,603,357$ 2,603,357$ 2,603,357$ 2,603,357$ 2,603,357$ 2,603,357$
Mining Equiipment 1,348,367$ 1,348,367$ 1,348,367$ 1,348,367$ 1,348,367$ 1,348,367$
Processing and Handling 1,229,267$ 1,229,267$ 1,229,267$ 1,229,267$ 1,229,267$ 1,229,267$
Facilities 25,724$ 25,724$ 25,724$ 25,724$ 25,724$ 25,724$
- Depletion 159,362,424$ 159,362,424$ 159,362,424$ 159,362,424$ 159,362,424$ 159,362,424$
50% Percentage Limit 529,906,401.33$ 529,906,401.33$ 529,906,401.33$ 529,906,401.33$ 529,906,401.33$ 529,906,401.33$
Percentage 159,362,424$ 159,362,424$ 159,362,424$ 159,362,424$ 159,362,424$ 159,362,424$
- Tax Loss Forward -$ -$ -$ -$ -$ -$
Taxable Income ($/yr) 900,450,379$ 900,450,379$ 900,450,379$ 900,450,379$ 900,450,379$ 900,450,379$
- Income Tax 367,833,980$ 367,833,980$ 367,833,980$ 367,833,980$ 367,833,980$ 367,833,980$
+ Tax Credit -$ -$ -$ -$ -$ -$
Net Profit/Loss ($/yr) 532,616,399$ 532,616,399$ 532,616,399$ 532,616,399$ 532,616,399$ 532,616,399$
+ Depreciation 2,603,357$ 2,603,357$ 2,603,357$ 2,603,357$ 2,603,357$ 2,603,357$
+ Depletion 159,362,424$ 159,362,424$ 159,362,424$ 159,362,424$ 159,362,424$ 159,362,424$
Cash Flow ($/yr) 694,582,180$ 694,582,180$ 694,582,180$ 694,582,180$ 694,582,180$ 694,582,180$
- Capitalized Cost 58,060,665$ 28,506,350$ 31,000$ 31,000$ 31,000$ 31,000$ 31,000$ 31,000$
Mining Equiipment 30,000,000$ 10,451,000$
Processing and Handling 25,000,000$ 18,024,350$
Facilities 1,929,265$
Permitting 1,131,400$ 31,000$ 31,000$ 31,000$ 31,000$ 31,000$ 31,000$ 31,000$
- Working Capital -$ -$ -$ -$ -$ -$
Net Cash Flow ($/yr) (58,060,665)$ (28,506,350)$ 694,551,180$ 694,551,180$ 694,551,180$ 694,551,180$ 694,551,180$ 694,551,180$
Running NPV (58,060,665.00)$ (86,567,015.00)$ 607,984,165.32$ 1,302,535,345.64$ 1,997,086,525.96$ 2,691,637,706.27$ 3,386,188,886.59$ 4,080,740,066.91$
Carry Tax Loss Forward? Yes
Discount Rate (%) 11.00
Net Present Value (20 Year) 5,358,224,035.10$
DCF Rate of Return (20 Year) 279.26
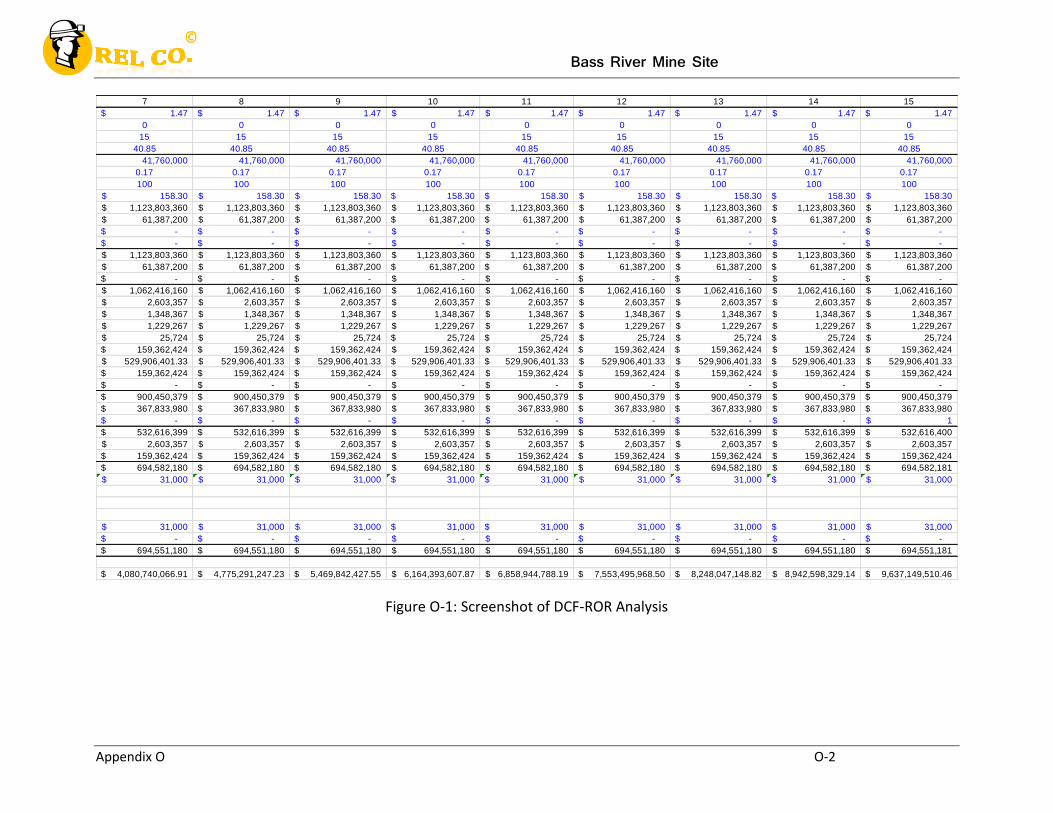
Bass River Mine Site
Appendix O O-2
Figure O-1: Screenshot of DCF-ROR Analysis
7 8 9 10 11 12 13 14 15
1.47$ 1.47$ 1.47$ 1.47$ 1.47$ 1.47$ 1.47$ 1.47$ 1.47$
0 0 0 0 0 0 0 0 0
15 15 15 15 15 15 15 15 15
40.85 40.85 40.85 40.85 40.85 40.85 40.85 40.85 40.85
41,760,000 41,760,000 41,760,000 41,760,000 41,760,000 41,760,000 41,760,000 41,760,000 41,760,000
0.17 0.17 0.17 0.17 0.17 0.17 0.17 0.17 0.17
100 100 100 100 100 100 100 100 100
158.30$ 158.30$ 158.30$ 158.30$ 158.30$ 158.30$ 158.30$ 158.30$ 158.30$
1,123,803,360$ 1,123,803,360$ 1,123,803,360$ 1,123,803,360$ 1,123,803,360$ 1,123,803,360$ 1,123,803,360$ 1,123,803,360$ 1,123,803,360$
61,387,200$ 61,387,200$ 61,387,200$ 61,387,200$ 61,387,200$ 61,387,200$ 61,387,200$ 61,387,200$ 61,387,200$
-$ -$ -$ -$ -$ -$ -$ -$ -$
-$ -$ -$ -$ -$ -$ -$ -$ -$
1,123,803,360$ 1,123,803,360$ 1,123,803,360$ 1,123,803,360$ 1,123,803,360$ 1,123,803,360$ 1,123,803,360$ 1,123,803,360$ 1,123,803,360$
61,387,200$ 61,387,200$ 61,387,200$ 61,387,200$ 61,387,200$ 61,387,200$ 61,387,200$ 61,387,200$ 61,387,200$
-$ -$ -$ -$ -$ -$ -$ -$ -$
1,062,416,160$ 1,062,416,160$ 1,062,416,160$ 1,062,416,160$ 1,062,416,160$ 1,062,416,160$ 1,062,416,160$ 1,062,416,160$ 1,062,416,160$
2,603,357$ 2,603,357$ 2,603,357$ 2,603,357$ 2,603,357$ 2,603,357$ 2,603,357$ 2,603,357$ 2,603,357$
1,348,367$ 1,348,367$ 1,348,367$ 1,348,367$ 1,348,367$ 1,348,367$ 1,348,367$ 1,348,367$ 1,348,367$
1,229,267$ 1,229,267$ 1,229,267$ 1,229,267$ 1,229,267$ 1,229,267$ 1,229,267$ 1,229,267$ 1,229,267$
25,724$ 25,724$ 25,724$ 25,724$ 25,724$ 25,724$ 25,724$ 25,724$ 25,724$
159,362,424$ 159,362,424$ 159,362,424$ 159,362,424$ 159,362,424$ 159,362,424$ 159,362,424$ 159,362,424$ 159,362,424$
529,906,401.33$ 529,906,401.33$ 529,906,401.33$ 529,906,401.33$ 529,906,401.33$ 529,906,401.33$ 529,906,401.33$ 529,906,401.33$ 529,906,401.33$
159,362,424$ 159,362,424$ 159,362,424$ 159,362,424$ 159,362,424$ 159,362,424$ 159,362,424$ 159,362,424$ 159,362,424$
-$ -$ -$ -$ -$ -$ -$ -$ -$
900,450,379$ 900,450,379$ 900,450,379$ 900,450,379$ 900,450,379$ 900,450,379$ 900,450,379$ 900,450,379$ 900,450,379$
367,833,980$ 367,833,980$ 367,833,980$ 367,833,980$ 367,833,980$ 367,833,980$ 367,833,980$ 367,833,980$ 367,833,980$
-$ -$ -$ -$ -$ -$ -$ -$ 1$
532,616,399$ 532,616,399$ 532,616,399$ 532,616,399$ 532,616,399$ 532,616,399$ 532,616,399$ 532,616,399$ 532,616,400$
2,603,357$ 2,603,357$ 2,603,357$ 2,603,357$ 2,603,357$ 2,603,357$ 2,603,357$ 2,603,357$ 2,603,357$
159,362,424$ 159,362,424$ 159,362,424$ 159,362,424$ 159,362,424$ 159,362,424$ 159,362,424$ 159,362,424$ 159,362,424$
694,582,180$ 694,582,180$ 694,582,180$ 694,582,180$ 694,582,180$ 694,582,180$ 694,582,180$ 694,582,180$ 694,582,181$
31,000$ 31,000$ 31,000$ 31,000$ 31,000$ 31,000$ 31,000$ 31,000$ 31,000$
31,000$ 31,000$ 31,000$ 31,000$ 31,000$ 31,000$ 31,000$ 31,000$ 31,000$
-$ -$ -$ -$ -$ -$ -$ -$ -$
694,551,180$ 694,551,180$ 694,551,180$ 694,551,180$ 694,551,180$ 694,551,180$ 694,551,180$ 694,551,180$ 694,551,181$
4,080,740,066.91$ 4,775,291,247.23$ 5,469,842,427.55$ 6,164,393,607.87$ 6,858,944,788.19$ 7,553,495,968.50$ 8,248,047,148.82$ 8,942,598,329.14$ 9,637,149,510.46$
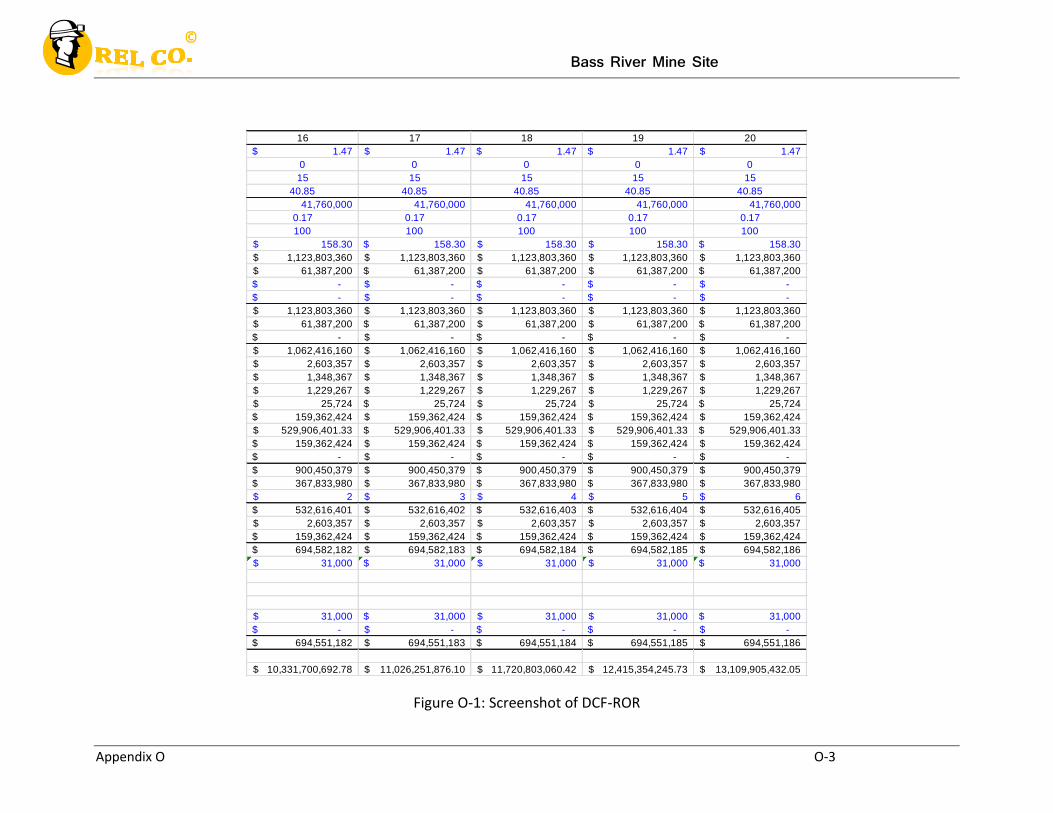
Bass River Mine Site
Appendix O O-3
Figure O-1: Screenshot of DCF-ROR
16 17 18 19 20
1.47$ 1.47$ 1.47$ 1.47$ 1.47$
0 0 0 0 0
15 15 15 15 15
40.85 40.85 40.85 40.85 40.85
41,760,000 41,760,000 41,760,000 41,760,000 41,760,000
0.17 0.17 0.17 0.17 0.17
100 100 100 100 100
158.30$ 158.30$ 158.30$ 158.30$ 158.30$
1,123,803,360$ 1,123,803,360$ 1,123,803,360$ 1,123,803,360$ 1,123,803,360$
61,387,200$ 61,387,200$ 61,387,200$ 61,387,200$ 61,387,200$
-$ -$ -$ -$ -$
-$ -$ -$ -$ -$
1,123,803,360$ 1,123,803,360$ 1,123,803,360$ 1,123,803,360$ 1,123,803,360$
61,387,200$ 61,387,200$ 61,387,200$ 61,387,200$ 61,387,200$
-$ -$ -$ -$ -$
1,062,416,160$ 1,062,416,160$ 1,062,416,160$ 1,062,416,160$ 1,062,416,160$
2,603,357$ 2,603,357$ 2,603,357$ 2,603,357$ 2,603,357$
1,348,367$ 1,348,367$ 1,348,367$ 1,348,367$ 1,348,367$
1,229,267$ 1,229,267$ 1,229,267$ 1,229,267$ 1,229,267$
25,724$ 25,724$ 25,724$ 25,724$ 25,724$
159,362,424$ 159,362,424$ 159,362,424$ 159,362,424$ 159,362,424$
529,906,401.33$ 529,906,401.33$ 529,906,401.33$ 529,906,401.33$ 529,906,401.33$
159,362,424$ 159,362,424$ 159,362,424$ 159,362,424$ 159,362,424$
-$ -$ -$ -$ -$
900,450,379$ 900,450,379$ 900,450,379$ 900,450,379$ 900,450,379$
367,833,980$ 367,833,980$ 367,833,980$ 367,833,980$ 367,833,980$
2$ 3$ 4$ 5$ 6$
532,616,401$ 532,616,402$ 532,616,403$ 532,616,404$ 532,616,405$
2,603,357$ 2,603,357$ 2,603,357$ 2,603,357$ 2,603,357$
159,362,424$ 159,362,424$ 159,362,424$ 159,362,424$ 159,362,424$
694,582,182$ 694,582,183$ 694,582,184$ 694,582,185$ 694,582,186$
31,000$ 31,000$ 31,000$ 31,000$ 31,000$
31,000$ 31,000$ 31,000$ 31,000$ 31,000$
-$ -$ -$ -$ -$
694,551,182$ 694,551,183$ 694,551,184$ 694,551,185$ 694,551,186$
10,331,700,692.78$ 11,026,251,876.10$ 11,720,803,060.42$ 12,415,354,245.73$ 13,109,905,432.05$