Embed Size (px)
Citation preview

INTERNATIONAL DEVELOPMENT ASSOCIATION
INTERNATIONAL MONETARY FUND
SENEGAL
Joint Bank-Fund Debt Sustainability Analysis 2014 Update
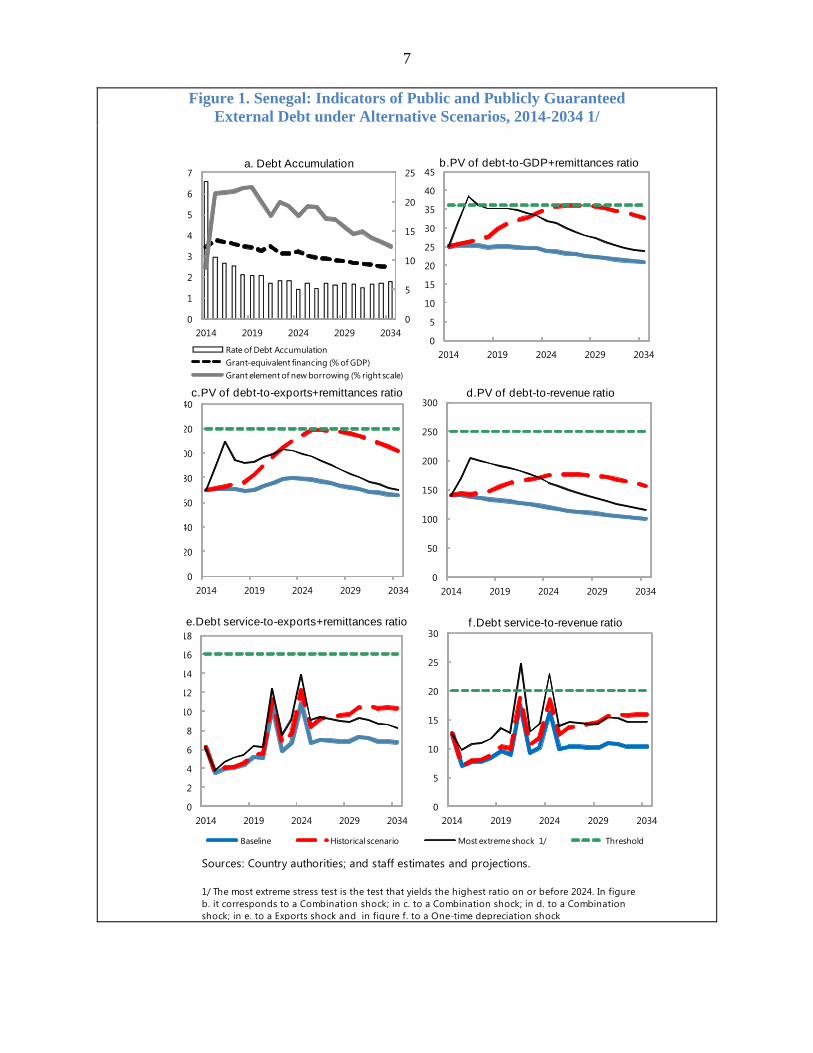
Prepared by the staffs of the International Development Association and the International Monetary Fund
Approved by Jeffrey D. Lewis and Marcelo Giugale (IDA)
And by Roger Nord and Peter Allum (IMF)
June 23, 2014 Senegal remains at a low risk of debt distress. Under the baseline scenario, which is consistent with higher program ceilings for nonconcessional and semi-concessional borrowing, all the debt burden indicators remain way below their policy-dependent indicative thresholds, and debt ratios in present value terms are lower than in the previous debt sustainability analysis (DSA) reflecting the use of a higher discount rate. There are in stress tests small and temporary breaches of the threshold on the debt to GDP ratio and on the debt service to revenue ratio, the latter corresponding to the repayment of two Eurobonds. In addition, the probability approach shows a favorable outlook, reflecting Senegal’s high CPIA score.1 The DSA, however, suggests that there is not much space for higher fiscal deficits if the low risk rating is to be preserved. It also indicates a need for caution in the recourse to nonconcessional borrowing.2
1 Senegal’s CPIA score was 3.82 in 2012, and on average 3.76 over 2010-12. Under the debt sustainability framework rules, this corresponds to a “moderate” performance. Maintenance of an average CPIA score above 3.75 would ultimately lead to a reclassification to “high” performance. 2 The DSA presented in this document is based on the LIC DSF Guidance note (2013).
Pub
lic D
iscl
osur
e A
utho
rized
Pub
lic D
iscl
osur
e A
utho
rized
Pub
lic D
iscl
osur
e A
utho
rized
Pub
lic D
iscl
osur
e A
utho
rized

2
I. BACKGROUND
1. Senegal’s total public debt and external debt ratios have both increased substantially over the past five years. The ratio of total public debt to GDP amounted to about 47 percent in 2013, up from around 25 percent in 2008. At the same time, the stock of total external public and publicly guaranteed debt has increased from around 20 percent of GDP in 2008 to around 32 percent at end-2013. These levels are close to those that prevailed before Senegal benefited from debt relief under the Multilateral Debt Relief Initiative (MDRI) in 2006. Debt-servicing costs have also increased, reflecting higher recourse to market financing. External public debt service has increased from 4.3 percent of exports in 2008 to about 9 percent in 2013.
2. In terms of composition, the bulk of Senegal’s debt remains largely external, and provided on concessional terms, but the use of financial market instruments is increasing.3 Most of the public debt is external (i.e., owed to non-residents of the West African Economic and Monetary Union, WAEMU), although the share of domestic debt to GDP has increased from 5.3 percent in 2008 to around 16 percent in 2013.4 Almost two thirds of Senegal’s external debt is owed to multilateral creditors—primarily the World Bank and the African Development Bank. The largest groups of bilateral creditors are the OECD and the Arab countries. The share of market debt is still relatively
3 Public debt refers to the debt of the central government. 4 Domestic debt includes debt issued in the WAEMU financial market.
% of total
2008 2009 2010 2011 2012 2013 2013
Total 19.6 26.8 27.3 27.4 31.0 32.4 100.0
Multilateral creditors 12.0 17.5 18.1 16.5 19.0 20.7 63.7
IDA/IBRD 7.0 8.0 8.0 8.8 9.2 9.6 29.6AfDB/AfDF 1.5 2.2 2.5 2.9 3.0 3.6 11.0IMF 0.5 1.8 2.9 0.0 1.9 2.4 7.4OFID/BADEA/IsDB 1.7 3.2 2.7 2.8 2.6 2.6 8.0EIB 0.2 0.3 0.3 0.3 0.2 0.3 0.8Others 1.2 2.0 1.8 1.7 2.1 2.2 6.8
Bilateral creditors 7.6 7.9 7.6 7.2 8.1 0.1 26.2
OECD countries 2.2 2.7 2.6 2.1 3.2 3.3 10.1Arab countries 4.1 3.8 2.8 2.2 2.1 2.0 6.1Others 1.2 1.3 2.1 2.3 2.8 2.8 8.8
Commercial creditors 0.0 1.5 1.6 3.7 3.5 3.3 10.1
Memorandum ItemNominal GDP (CFAF billions) 5994 6050 6395 6775 7165 7308
Sources: Senegalese authorities and IMF staff estimates
Total External Debt, Central Government
(Percent of GDP, as of end of year)

3 small, although it has grown rapidly over the past few years, with the issuance of two Eurobonds in 2009 and 2011, and the contracting of a syndicated loan in 2013, which includes a tranche in euro targeting nonresidents. This is expected to be followed by a US$500 million Eurobond in mid-2014. Private external debt has averaged about 20 percent of GDP over the last decade and was estimated at about 36 percent of GDP at end-2013.5 About half of this debt was in the form of trade credits and bank deposits; the rest consisted of debt securities, loans, and other liabilities. This exposure was partly offset by private external assets amounting to 8 percent of GDP.
II. BORROWING PLAN AND UNDERLYING ASSUMPTIONS
3. The authorities have continued to strengthen their capacity to manage debt and assess project loans. Senegal has continued to record improvement in its sub-CPIA score, showing marked progress in debt management. A new public debt directorate has been created, combining units that previously managed domestic debt and external debt separately. In addition, Senegal’s first medium-term debt strategy was completed in the fall of 2012 and a second one is being finalized. Progress is underway to improve project appraisal and selection, in particular by developing capacity to conduct cost-benefit analysis. In light of these favorable developments, Senegal was upgraded to the “higher capacity” category during the 2013 assessment of macroeconomic and public financial management capacity (see Classification of Low-Income Countries for the Purpose of Debt Limits in Fund-Supported Programs).
4. This DSA is consistent with the macroeconomic framework outlined in the staff report. As in the June 2013 DSA, the baseline scenario assumes the implementation of sound macroeconomic and structural policies, leading to an increase in economic growth and a narrowing of fiscal deficits over the long term. Other notable features include:
Real GDP growth is expected to increase to slightly above 5 percent, as in the previous DSA. This assumes efficiency gains from reform implementation, which would allow total factor productivity (TFP) to resume growing. TFP declined in recent years, which affected growth performance.
Fiscal deficit. The overall fiscal deficit projections are broadly unchanged beyond 2014 and in line with the authorities’ commitment to meet the key WAEMU convergence criterion on the fiscal deficit.6
Current account deficit: The current account deficit is projected to narrow gradually from 10.8 percent in 2013 to 8 percent of GDP in 2018 and slightly further down in the long term. This would be driven by projected fiscal consolidation and by the strong dynamism of
5 Estimates of private sector external debt are based on BCEAO data on the international investment position. 6 The convergence criterion calls for the basic fiscal balance, in percent of GDP, to be greater than or equal to zero. The basic fiscal balance is defined as total revenue, plus budget support grants, plus the counterpart of HIPC/MDRI-related spending, minus current expenditures and domestically-financed capital expenditure.

4
exports (mining in particular). Remittances are projected to remain significant as a share of GDP.
Inflation: it is expected to remain moderate, on average close to 2.0 percent.
Financing: The authorities are increasingly relying on external nonconcessional or semi-concessional borrowing to finance infrastructure projects, and this trend is expected to continue. They postponed a planned Eurobond issuance to 2014, following a sharp tightening of financial conditions on international markets in the course of 2013. The authorities now intend to issue a US$500 million Eurobond in mid-2014. Conditions have been relatively favorable in international markets in the past few months, and the authorities expect to get a much lower interest rate than on their 2011 Eurobond (whose yield is currently about 6 percent). Part of the proceeds would be used to repay the euro tranche of the syndicated loan contracted in 2013, which has a short maturity. The projections assume a rollover of the 2011 and 2014 bonds at maturity, as well as a moderate annual amount nonconcessional borrowing in the medium and long term. The authorities intend to continue relying on semi-concessional project financing (i.e. with a grant element above 15 percent) for infrastructure. As a result, the average grant element of new external borrowing is projected to decrease from about 20 percent to below 10 percent over the projection period, as Senegal gradually moves away from concessional borrowing toward nonconcessional borrowing.
Discount rate: A discount rate of 5 percent has been used for this DSA.7
III. EXTERNAL DSA
5. In Senegal, remittances are both high as a percentage of GDP and stable. Since 2000, they have grown every year with the exception of 2009, when they fell 6 percent. Over the period 2010-2012, remittances in Senegal averaged 52 percent of exports of goods and services and 13
7 In line with the IMF Executive Board decision to reform the system of discount rates used in the analysis of debt in low-income countries, a single uniform discount rate of 5 percent is used to calculate the present value (PV) of external debt and in calculating the grant element of loans under the program. The discount rate used in the 2013 DSA was 3 percent.
Long2012 2013 2014 2015 term 1/
Real GDP growthCurrent DSA 3.4 3.5 4.9 5.0 5.4Previous DSA 3.5 4.0 4.6 4.7 5.3
Overall fiscal deficit (percent of GDP)Current DSA 5.9 5.5 5.1 3.9 2.6Previous DSA 5.9 5.3 4.6 3.9 2.8
Current account deficit (percent of GDP)Current DSA 10.8 10.4 10.0 8.9 7.6Previous DSA 10.3 9.3 8.7 8.3 7.6
Evolution of Selected Macroeconomic Indicators
1/ Defined as the last 15 years of the projection period. For the current DSA, the long term covers the years 2020-2034; for the previous DSA, it covers 2019-2033.

5 percent of GDP. They have become an important and reliable source of foreign exchange in Senegal, a pattern that is expected to continue.8
6. Taking remittances into account, debt burden indicators remain well below their thresholds in the baseline scenario. The external PPG debt ratios remain below their respective thresholds even under the most extreme stress tests, with two exceptions. Two spikes in debt service reflect the assumption of the repayment of the Eurobonds at maturity, and lead to one-year breaches under the most extreme stress test (a 30 percent depreciation of the currency). There is also a small temporary breach of the threshold on the debt to GDP ratio under the most extreme stress test. These breaches disappear using the probability approach, which incorporates more country specific features for Senegal.9
IV. PUBLIC DSA
7. Under the PSI baseline scenario, indicators of overall public debt (external plus domestic) do not show significant vulnerabilities. The PV of total public debt to GDP and the PV of total public debt to revenue remain gradually decrease over the projection period. The PV of public debt to GDP remains well below the benchmark level of 56 percent associated with heightened public debt vulnerabilities for medium performers. The authorities’ effort to increase maturities (from slightly over one year at the time of the previous DSA) should reduce exposure to rollover and interest rate risks in the context of financing from the regional market.
8. The public debt outlook would be much less favorable in the absence of fiscal consolidation (Table 2b). In a scenario that assumes an unchanged primary deficit (as a percent of GDP) over the entire projection period, the PV of public debt to GDP grows rapidly, quickly breaching the 56 percent benchmark level. The benchmark level is also breached in the “historical” scenario (holding real GDP growth and the primary deficit constant at their historical levels). While overall the risks remain low, these stress tests highlight the importance of continuing the fiscal effort and raising output growth.
V. OTHER ISSUES
9. Views of the authorities and assessment of Plan Sénégal Emergent (PSE). The authorities broadly agreed with the staff’s assessment of debt sustainability using the PSI baseline scenario. They highlighted their recent fiscal consolidation efforts, pointing to actions taken to reduce the fiscal deficit in 2012-13 and further in 2014. Most of the discussion focused on the implications of the PSE for debt dynamics. Under the macroeconomic framework developed by the authorities for the PSE, the expected growth dividend from implementing the PSE is assumed to eventually offset the impact on debt ratios of higher fiscal deficits in the next few years (Figure 3). The authorities nevertheless
8 Both ratios are measured on a backward-looking, three-year average basis. 9 According to the debt sustainability framework policy, the probability approach can be used in borderline cases, when breaches are short-lived and within plus-or-minus 10 percent of the indicative threshold.

6 acknowledged that fiscal consolidation and a cautious approach to nonconcessional borrowing were critical for safeguarding debt sustainability. Staff stressed that preserving debt sustainability under the PSE would depend on achieving a high growth dividend and implementing a comprehensive and ambitious reform of the state (to make room for investment and improve the efficiency of spending). In the absence of balance of payments projections consistent with the authorities’ PSE framework, the external debt impact of the PSE is not considered in this DSA.
10. Revised debt limits. The authorities and staff discussed the options for debt limits made available by Senegal’s recent reclassification as a “higher capacity” country under the debt limits policy. In light of the limited time remaining until the end of the current Fund-supported program, it was agreed to keep the current design for debt limits, while raising the existing ceilings as needed, in particular the one on semi-concessional borrowing to facilitate the financing of four high-return infrastructure projects (electricity and sanitation). These higher ceilings are taken into account in the present DSA.
VI. CONCLUSION
11. In staff’s view, Senegal continues to face a low risk of debt distress. This assessment, however, hinges critically on a continued reduction of the fiscal deficit and a prudent shift towards less concessional financing.
7
Sources: Country authorities; and staff estimates and projections.
1/ The most extreme stress test is the test that yields the highest ratio on or before 2024. In figure b. it corresponds to a Combination shock; in c. to a Combination shock; in d. to a Combination shock; in e. to a Exports shock and in figure f. to a One-time depreciation shock
0
5
10
15
20
25
30
2014 2019 2024 2029 2034
Baseline Historical scenario Most extreme shock 1/ Threshold
f .Debt service-to-revenue ratio
0
5
10
15
20
25
0
1
2
3
4
5
6
7
2014 2019 2024 2029 2034
Rate of Debt AccumulationGrant-equivalent financing (% of GDP)Grant element of new borrowing (% right scale)
a. Debt Accumulation
0
5
10
15
20
25
30
35
40
45
2014 2019 2024 2029 2034
b.PV of debt-to-GDP+remittances ratio
0
20
40
60
80
00
20
40
2014 2019 2024 2029 2034
c.PV of debt-to-exports+remittances ratio
0
50
100
150
200
250
300
2014 2019 2024 2029 2034
d.PV of debt-to-revenue ratio
0
2
4
6
8
10
12
14
16
18
2014 2019 2024 2029 2034
e.Debt service-to-exports+remittances ratio
Figure 1. Senegal: Indicators of Public and Publicly Guaranteed External Debt under Alternative Scenarios, 2014-2034 1/

8
Sources: Country authorities; and staff estimates and projections.
1/ The most extreme stress test is the test that yields the highest ratio on or before 2024. In figure b. it corresponds to a Combination shock; in c. to a Combination shock; in d. to a Combination shock; in e. to a Exports shock and in figure f. to a One-time depreciation shock
0
2
4
6
8
10
12
14
16
18
20
Baseline Historical scenario Most extreme shock 1/ Threshold
f.Debt service-to-revenue ratio
0
5
10
15
20
25
0
1
2
3
4
5
6
7
2014 2019 2024 2029 2034
Rate of Debt AccumulationGrant-equivalent financing (% of GDP)Grant element of new borrowing (% right scale)
a. Debt Accumulation
0
2
4
6
8
10
12
14
16b.PV of debt-to-GDP+remittances ratio
0
2
4
6
8
10
12
14c.PV of debt-to-exports+remittances ratio
0
2
4
6
8
10
12
14
16d.PV of debt-to-revenue ratio
0
2
4
6
8
10
12
14
16e.Debt service-to-exports+remittances ratio
Figure 2. Senegal: Probability of Debt Distress of Public and Publicly Guarantees External Debt under Alternative Scenarios, 2014-2034 1/

9
Sources: Country authorities; and staff estimates and projections.1/ The most extreme stress test is the test that yields the highest ratio on or before 2024.
Baseline
Public debt benchmark
Most extreme shock 1/
Historical scenario
Fix Primary Balance
Authorities' PSE framework
0
50
100
150
200
250
300
350
2014 2016 2018 2020 2022 2024 2026 2028 2030 2032 2034
PV of Debt-to-Revenue Ratio 2/
0
10
20
30
40
50
60
70
80
90
2014 2016 2018 2020 2022 2024 2026 2028 2030 2032 2034
PV of Debt-to-GDP Ratio
0
5
10
15
20
25
30
35
40
45
2014 2016 2018 2020 2022 2024 2026 2028 2030 2032 2034
Debt Service-to-Revenue Ratio
Figure 3. Senegal: Indicators of Public Debt under Alternative Scenarios, 2014-2034

10
Table 1. Senegal: External Debt Sustainability Framework, Baseline Scenario, 2011-2034 1/ (In percent of GDP, unless otherwise indicated
Historical 6/ Standard 6/
Average Deviation 2014-2019 2020-20342011 2012 2013 2014 2015 2016 2017 2018 2019 Average 2024 2034 Average
External debt (nominal) 1/ 54.5 62.7 68.3 73.0 75.5 77.3 78.3 77.9 76.8 69.7 73.2of which: public and publicly guaranteed (PPG) 29.4 31.0 32.4 35.6 36.1 36.3 36.3 35.8 35.6 32.6 27.4
Change in external debt 3.8 8.1 5.7 4.7 2.5 1.9 0.9 -0.3 -1.1 -2.7 0.8Identified net debt-creating flows 0.8 10.1 5.5 5.2 3.7 3.3 2.8 2.2 0.9 1.3 2.8
Non-interest current account deficit 6.9 9.9 9.6 8.2 2.9 9.0 7.9 7.7 7.4 7.0 5.8 6.0 7.6 6.9Deficit in balance of goods and services 18.3 21.3 21.8 21.3 20.6 20.5 20.2 19.6 17.8 14.7 15.9
Exports 26.4 28.3 27.5 27.3 26.8 26.7 26.6 26.9 27.3 23.8 25.8Imports 44.7 49.5 49.3 48.6 47.3 47.1 46.8 46.6 45.0 38.5 41.8
Net current transfers (negative = inflow) -12.3 -12.5 -12.6 -10.9 2.1 -12.4 -12.8 -12.8 -12.7 -12.6 -11.9 -8.7 -8.3 -8.7of which: official -0.9 -1.0 -0.3 -0.5 -0.6 -0.6 -0.5 -0.5 -0.5 -0.5 -0.5
Other current account flows (negative = net inflow) 0.9 1.2 0.3 0.1 0.1 0.0 0.0 0.0 -0.1 -0.1 0.0Net FDI (negative = inflow) -2.0 -2.0 -1.7 -1.8 0.6 -1.7 -1.8 -1.9 -2.0 -2.0 -2.1 -2.1 -2.1 -2.1Endogenous debt dynamics 2/ -4.1 2.2 -2.4 -2.1 -2.3 -2.5 -2.6 -2.7 -2.8 -2.7 -2.7
Contribution from nominal interest rate 1.0 0.9 0.8 1.0 1.0 1.0 1.0 1.0 1.0 0.9 0.9Contribution from real GDP growth -0.8 -1.9 -2.1 -3.1 -3.3 -3.5 -3.6 -3.7 -3.8 -3.6 -3.7Contribution from price and exchange rate changes -4.3 3.2 -1.1 … … … … … … … …
Residual (3-4) 3/ 3.0 -2.0 0.2 -0.5 -1.3 -1.4 -1.9 -2.6 -2.0 -3.9 -2.0 -2.4of which: exceptional financing -0.9 -1.4 -0.1 0.0 0.0 0.0 0.0 0.0 0.0 0.0 0.0
PV of external debt 4/ ... ... 60.2 66.1 68.2 69.9 70.7 70.4 69.5 63.4 68.7In percent of exports ... ... 219.0 242.4 255.0 262.3 265.4 261.3 255.1 266.3 265.8
PV of PPG external debt ... ... 24.3 28.6 28.9 28.9 28.8 28.3 28.3 26.2 22.8In percent of exports ... ... 88.3 104.9 107.9 108.5 107.9 105.1 103.9 110.2 88.3In percent of government revenues ... ... 120.6 140.2 140.2 137.2 135.7 132.9 131.4 119.3 100.4
Debt service-to-exports ratio (in percent) 17.8 9.7 8.9 11.6 7.1 7.3 7.1 7.4 8.4 15.7 8.0PPG debt service-to-exports ratio (in percent) 13.2 7.0 6.7 9.4 5.4 6.1 6.2 6.6 7.6 15.1 9.1PPG debt service-to-revenue ratio (in percent) 17.2 9.6 9.2 12.6 7.0 7.7 7.8 8.3 9.7 16.3 10.4Total gross financing need (Billions of U.S. dollars) 1.4 1.5 1.5 1.7 1.4 1.5 1.5 1.6 1.5 2.8 6.1Non-interest current account deficit that stabilizes debt ratio 3.1 1.8 3.9 4.3 5.5 5.9 6.5 7.3 6.9 8.7 6.8
Key macroeconomic assumptions
Real GDP growth (in percent) 1.7 3.4 3.5 3.8 1.4 4.9 5.0 5.1 5.1 5.1 5.3 5.1 5.4 5.5 5.4GDP deflator in US dollar terms (change in percent) 9.3 -5.5 1.8 4.3 8.0 4.6 4.1 3.5 3.9 3.8 2.3 3.7 2.6 2.7 2.6Effective interest rate (percent) 5/ 2.2 1.6 1.4 1.8 0.4 1.5 1.5 1.4 1.4 1.4 1.4 1.4 1.3 1.4 1.4Growth of exports of G&S (US dollar terms, in percent) 17.7 4.7 2.5 8.8 10.7 8.8 7.3 8.4 9.2 10.3 9.1 8.8 8.9 9.5 7.8Growth of imports of G&S (US dollar terms, in percent) 23.2 8.2 4.9 11.9 17.2 8.1 6.5 8.4 8.5 8.6 4.2 7.4 6.2 9.3 7.6Grant element of new public sector borrowing (in percent) ... ... ... ... ... 8.8 21.5 21.6 21.7 22.3 22.5 19.7 17.6 12.3 16.7Government revenues (excluding grants, in percent of GDP) 20.3 20.4 20.1 20.4 20.6 21.1 21.2 21.3 21.6 22.0 22.7 22.2Aid flows (in Billions of US dollars) 7/ 0.7 1.0 0.8 0.9 1.1 1.1 1.2 1.3 1.4 1.8 3.1
of which: Grants 0.3 0.4 0.4 0.5 0.5 0.5 0.6 0.6 0.7 0.9 1.7of which: Concessional loans 0.4 0.6 0.4 0.5 0.6 0.6 0.6 0.7 0.7 0.9 1.5
Grant-equivalent financing (in percent of GDP) 8/ ... ... ... 3.4 3.7 3.7 3.6 3.5 3.4 3.2 2.5 2.9Grant-equivalent financing (in percent of external financing) 8/ ... ... ... 34.8 53.8 54.5 54.9 56.7 57.2 46.9 45.8 50.7
Memorandum items:Nominal GDP (Billions of US dollars) 14.4 14.0 14.8 16.2 17.7 19.3 21.1 23.0 24.8 36.5 80.4Nominal dollar GDP growth 11.1 -2.3 5.4 9.8 9.3 8.8 9.3 9.1 7.8 9.0 8.1 8.3 8.1PV of PPG external debt (in Billions of US dollars) 3.7 4.7 5.2 5.6 6.1 6.6 7.0 9.6 18.3(PVt-PVt-1)/GDPt-1 (in percent) 6.6 2.9 2.7 2.5 2.1 2.0 3.1 1.4 1.8 1.7Gross workers' remittances (Billions of US dollars) 1.9 1.9 2.1 2.2 2.5 2.7 3.0 3.2 3.3 3.4 7.2PV of PPG external debt (in percent of GDP + remittances) ... ... 21.3 25.1 25.3 25.3 25.2 24.8 25.0 24.0 20.9PV of PPG external debt (in percent of exports + remittances) ... ... 58.2 69.7 70.6 70.9 70.6 69.1 70.1 79.0 65.4Debt service of PPG external debt (in percent of exports + remittance ... ... 4.4 6.2 3.5 4.0 4.1 4.3 5.2 10.8 6.8
Sources: Country authorities; and staff estimates and projections. 01/ Includes both public and private sector external debt.2/ Derived as [r - g - ρ(1+g)]/(1+g+ρ+gρ) times previous period debt ratio, with r = nominal interest rate; g = real GDP growth rate, and ρ = growth rate of GDP deflator in U.S. dollar terms. 3/ Includes exceptional financing (i.e., changes in arrears and debt relief); changes in gross foreign assets; and valuation adjustments. For projections also includes contribution from price and exchange rate4/ Assumes that PV of private sector debt is equivalent to its face value.5/ Current-year interest payments divided by previous period debt stock. 6/ Historical averages and standard deviations are generally derived over the past 10 years, subject to data availability. 7/ Defined as grants, concessional loans, and debt relief.8/ Grant-equivalent financing includes grants provided directly to the government and through new borrowing (difference between the face value and the PV of new debt).
Actual Projections

11
Table 2. Senegal: Public Sector Sustainability Framework, Baseline Scenario, 2011-2034 (In percent of GDP, unless otherwise indicated)
Estimate
2011 2012 2013 Average5/ Standard
Deviation
5/
2014 2015 2016 2017 2018 20192014-19 Average 2024 2034
2020-34 Average
Public sector debt 1/ 40.7 43.4 46.8 50.0 50.3 50.4 50.4 50.4 50.3 45.4 36.1of which: foreign-currency denominated 29.4 31.0 32.4 35.6 36.1 36.3 36.3 35.8 35.6 32.6 27.4
Change in public sector debt 5.2 2.7 3.4 3.2 0.3 0.1 0.0 0.0 0.0 -1.1 -0.7Identified debt-creating flows 4.9 3.2 3.3 2.0 -0.1 -0.3 -0.7 -0.8 -0.5 -1.2 -0.7
Primary deficit 5.2 4.4 3.9 3.9 1.1 3.3 2.3 1.9 1.7 1.5 1.1 2.0 0.8 0.7 0.8Revenue and grants 22.5 23.3 22.7 23.2 23.4 23.9 24.0 24.0 24.2 24.4 24.8
of which: grants 2.2 2.9 2.6 2.8 2.9 2.8 2.8 2.7 2.7 2.4 2.1Primary (noninterest) expenditure 27.7 27.7 26.6 26.5 25.7 25.8 25.6 25.5 25.4 25.2 25.5
Automatic debt dynamics -0.3 -0.6 -0.6 -1.3 -2.4 -2.3 -2.4 -2.3 -1.7 -1.9 -1.5Contribution from interest rate/growth differential -0.4 -0.7 0.7 -1.1 -1.8 -1.8 -1.9 -1.9 -1.9 -1.9 -1.5
of which: contribution from average real interest rate 0.2 0.6 2.2 1.1 0.5 0.6 0.6 0.6 0.6 0.4 0.5of which: contribution from real GDP growth -0.6 -1.3 -1.5 -2.2 -2.4 -2.4 -2.5 -2.5 -2.5 -2.4 -1.9
Contribution from real exchange rate depreciation 0.1 0.1 -1.3 -0.2 -0.5 -0.5 -0.5 -0.5 0.2 ... ...Other identified debt-creating flows 0.0 -0.6 0.0 0.0 0.0 0.0 0.0 0.0 0.0 0.0 0.0
Privatization receipts (negative) 0.0 -0.6 0.0 0.0 0.0 0.0 0.0 0.0 0.0 0.0 0.0Recognition of implicit or contingent liabilities 0.0 0.0 0.0 0.0 0.0 0.0 0.0 0.0 0.0 0.0 0.0Debt relief (HIPC and other) 0.0 0.0 0.0 0.0 0.0 0.0 0.0 0.0 0.0 0.0 0.0Other (specify, e.g. bank recapitalization) 0.0 0.0 0.0 0.0 0.0 0.0 0.0 0.0 0.0 0.0 0.0
Residual, including asset changes 0.3 -0.5 0.1 1.2 0.4 0.5 0.7 0.8 0.5 0.1 0.0Of which : asset changes 1.9 1.6 0.1 0.3 0.3 0.3 0.3 0.3 0.2 0.0 0.0
Other Sustainability IndicatorsPV of public sector debt ... ... 38.7 43.0 43.0 43.0 42.9 42.8 43.0 39.0 31.5
of which: foreign-currency denominated ... ... 24.3 28.6 28.9 28.9 28.8 28.3 28.3 26.2 22.8of which: external ... ... 24.3 28.6 28.9 28.9 28.8 28.3 28.3 26.2 22.8
PV of contingent liabilities (not included in public sector debt) ... ... ... ... ... ... ... ... ... ... ...Gross financing need 2/ 12.3 12.2 12.2 14.6 13.0 11.0 10.3 10.9 9.2 9.3 5.6PV of public sector debt-to-revenue and grants ratio (in percent) … … 170.5 185.5 183.5 179.9 179.1 178.4 177.6 159.6 127.2PV of public sector debt-to-revenue ratio (in percent) … … 192.2 211.1 209.0 203.8 202.4 201.2 199.6 177.3 138.7
of which: external 3/ … … 120.6 140.2 140.2 137.2 135.7 132.9 131.4 119.3 100.4Debt service-to-revenue and grants ratio (in percent) 4/ 19.9 16.4 17.0 21.6 31.7 28.7 27.1 30.9 25.9 30.1 17.4Debt service-to-revenue ratio (in percent) 4/ 22.1 18.7 19.2 24.6 36.1 32.5 30.7 34.8 29.2 33.4 19.0Primary deficit that stabilizes the debt-to-GDP ratio 0.0 1.7 0.5 0.1 2.0 1.8 1.7 1.6 1.2 1.8 1.4
Key macroeconomic and fiscal assumptionsReal GDP growth (in percent) 1.7 3.4 3.5 3.8 1.4 4.9 5.0 5.1 5.1 5.1 5.3 5.1 5.4 5.5 5.4Average nominal interest rate on forex debt (in percent) 3.7 2.5 2.5 2.4 0.6 2.9 2.8 2.8 2.8 2.8 2.8 2.8 2.8 3.6 3.0Average real interest rate on domestic debt (in percent) 3.7 4.8 8.1 3.2 3.7 4.9 2.7 3.3 3.3 3.2 3.4 3.5 3.1 2.7 3.0Real exchange rate depreciation (in percent, + indicates depreciation 0.3 0.5 -4.3 -0.8 8.5 -0.7 ... ... ... ... ... ... ... ... ...Inflation rate (GDP deflator, in percent) 4.2 2.3 -1.4 2.4 2.8 1.5 2.3 2.3 2.3 2.3 2.3 2.2 2.6 2.7 2.6Growth of real primary spending (deflated by GDP deflator, in percen 7.9 3.2 -0.4 1.1 2.6 4.4 1.9 5.5 4.3 4.8 4.6 4.3 5.0 5.6 5.4Grant element of new external borrowing (in percent) ... ... ... … … 8.8 21.5 21.6 21.7 22.3 22.5 19.7 17.6 12.3 ...
Sources: Country authorities; and staff estimates and projections.1/ [Indicate coverage of public sector, e.g., general government or nonfinancial public sector. Also whether net or gross debt is used.]2/ Gross financing need is defined as the primary deficit plus debt service plus the stock of short-term debt at the end of the last period. 3/ Revenues excluding grants.4/ Debt service is defined as the sum of interest and amortization of medium and long-term debt.5/ Historical averages and standard deviations are generally derived over the past 10 years, subject to data availability.
Actual Projections

12
Table 3A. Senegal: Sensitivity Analysis for Key Indicators of Public and Publicly Guaranteed External Debt, 2014-2034 (In Percent)
2014 2015 2016 2017 2018 2019 2024 2034
Baseline 25 25 25 25 25 25 24 21
A. Alternative Scenarios
A1. Key variables at their historical averages in 2014-2034 1/ 25 26 26 27 28 30 35 33A2. New public sector loans on less favorable terms in 2014-2034 2 25 27 27 28 28 28 30 31
B. Bound Tests
B1. Real GDP growth at historical average minus one standard deviation in 2015-2016 25 26 27 27 26 26 25 22B2. Export value growth at historical average minus one standard deviation in 2015-2016 3/ 25 27 31 30 30 30 27 21B3. US dollar GDP deflator at historical average minus one standard deviation in 2015-2016 25 27 29 29 28 29 27 24B4. Net non-debt creating flows at historical average minus one standard deviation in 2015-2016 4/ 25 30 34 32 31 31 28 22B5. Combination of B1-B4 using one-half standard deviation shocks 25 31 38 36 35 35 32 24B6. One-time 30 percent nominal depreciation relative to the baseline in 2015 5/ 25 34 34 34 33 34 33 28
Baseline 70 71 71 71 69 70 79 65
A. Alternative Scenarios
A1. Key variables at their historical averages in 2014-2034 1/ 70 72 73 75 76 82 115 102A2. New public sector loans on less favorable terms in 2014-2034 2 70 74 76 77 77 79 99 96
B. Bound Tests
B1. Real GDP growth at historical average minus one standard deviation in 2015-2016 70 71 71 71 70 70 79 65B2. Export value growth at historical average minus one standard deviation in 2015-2016 3/ 70 80 96 95 93 94 102 77B3. US dollar GDP deflator at historical average minus one standard deviation in 2015-2016 70 71 71 71 70 70 79 65B4. Net non-debt creating flows at historical average minus one standard deviation in 2015-2016 4/ 70 90 101 89 87 87 93 67B5. Combination of B1-B4 using one-half standard deviation shocks 70 90 109 95 92 93 99 70B6. One-time 30 percent nominal depreciation relative to the baseline in 2015 5/ 70 71 71 71 70 70 79 65
Baseline 140 140 137 136 133 131 119 100
A. Alternative Scenarios
A1. Key variables at their historical averages in 2014-2034 1/ 140 143 142 145 148 156 174 157A2. New public sector loans on less favorable terms in 2014-2034 2 140 147 147 149 149 149 149 147
B. Bound Tests
B1. Real GDP growth at historical average minus one standard deviation in 2015-2016 140 145 145 144 141 138 126 106B2. Export value growth at historical average minus one standard deviation in 2015-2016 3/ 140 150 165 162 158 155 136 103B3. US dollar GDP deflator at historical average minus one standard deviation in 2015-2016 140 152 160 159 155 153 138 117B4. Net non-debt creating flows at historical average minus one standard deviation in 2015-2016 4/ 140 160 175 172 167 163 141 104B5. Combination of B1-B4 using one-half standard deviation shocks 140 170 204 200 194 190 162 116B6. One-time 30 percent nominal depreciation relative to the baseline in 2015 5/ 140 198 194 192 188 185 168 141
PV of debt-to-exports+remittances ratio
PV of debt-to-revenue ratio
Projections
PV of debt-to-GDP+remittances ratio
13
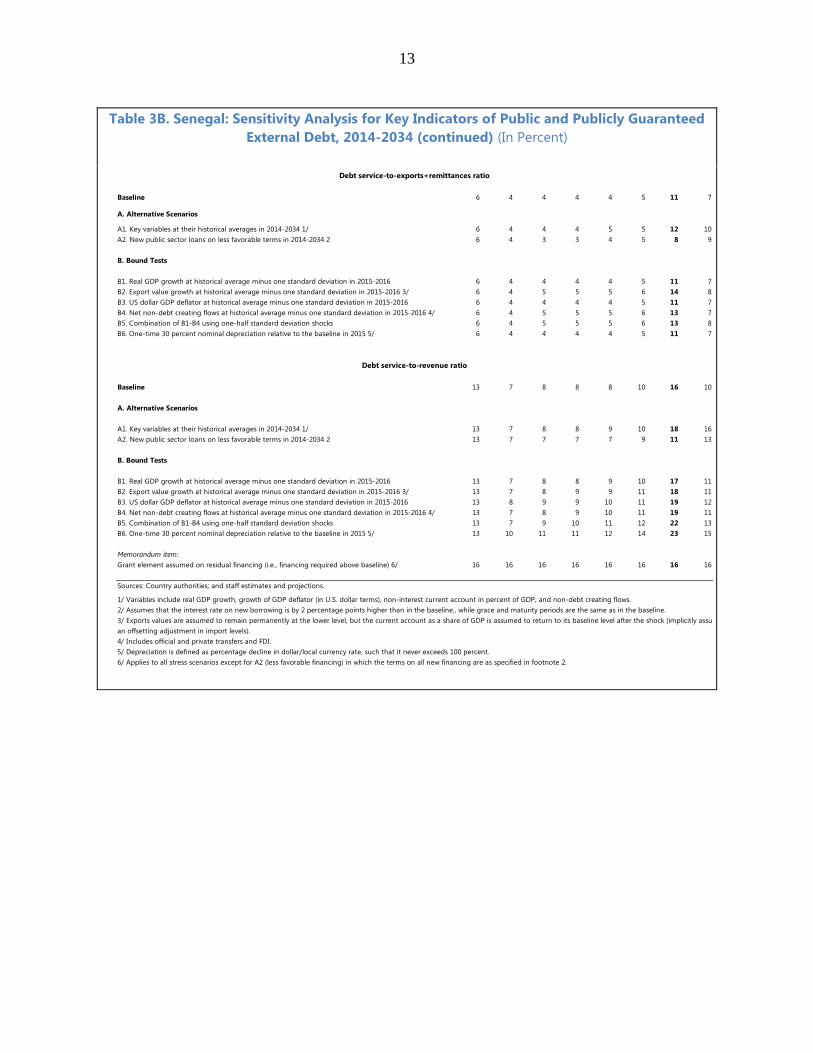
Table 3B. Senegal: Sensitivity Analysis for Key Indicators of Public and Publicly Guaranteed External Debt, 2014-2034 (continued) (In Percent)
Baseline 6 4 4 4 4 5 11 7
A. Alternative Scenarios
A1. Key variables at their historical averages in 2014-2034 1/ 6 4 4 4 5 5 12 10A2. New public sector loans on less favorable terms in 2014-2034 2 6 4 3 3 4 5 8 9
B. Bound Tests
B1. Real GDP growth at historical average minus one standard deviation in 2015-2016 6 4 4 4 4 5 11 7B2. Export value growth at historical average minus one standard deviation in 2015-2016 3/ 6 4 5 5 5 6 14 8B3. US dollar GDP deflator at historical average minus one standard deviation in 2015-2016 6 4 4 4 4 5 11 7B4. Net non-debt creating flows at historical average minus one standard deviation in 2015-2016 4/ 6 4 5 5 5 6 13 7B5. Combination of B1-B4 using one-half standard deviation shocks 6 4 5 5 5 6 13 8B6. One-time 30 percent nominal depreciation relative to the baseline in 2015 5/ 6 4 4 4 4 5 11 7
Baseline 13 7 8 8 8 10 16 10
A. Alternative Scenarios
A1. Key variables at their historical averages in 2014-2034 1/ 13 7 8 8 9 10 18 16A2. New public sector loans on less favorable terms in 2014-2034 2 13 7 7 7 7 9 11 13
B. Bound Tests
B1. Real GDP growth at historical average minus one standard deviation in 2015-2016 13 7 8 8 9 10 17 11B2. Export value growth at historical average minus one standard deviation in 2015-2016 3/ 13 7 8 9 9 11 18 11B3. US dollar GDP deflator at historical average minus one standard deviation in 2015-2016 13 8 9 9 10 11 19 12B4. Net non-debt creating flows at historical average minus one standard deviation in 2015-2016 4/ 13 7 8 9 10 11 19 11B5. Combination of B1-B4 using one-half standard deviation shocks 13 7 9 10 11 12 22 13B6. One-time 30 percent nominal depreciation relative to the baseline in 2015 5/ 13 10 11 11 12 14 23 15
Memorandum item:Grant element assumed on residual financing (i.e., financing required above baseline) 6/ 16 16 16 16 16 16 16 16
Sources: Country authorities; and staff estimates and projections.
1/ Variables include real GDP growth, growth of GDP deflator (in U.S. dollar terms), non-interest current account in percent of GDP, and non-debt creating flows. 2/ Assumes that the interest rate on new borrowing is by 2 percentage points higher than in the baseline., while grace and maturity periods are the same as in the baseline.3/ Exports values are assumed to remain permanently at the lower level, but the current account as a share of GDP is assumed to return to its baseline level after the shock (implicitly assuman offsetting adjustment in import levels). 4/ Includes official and private transfers and FDI.5/ Depreciation is defined as percentage decline in dollar/local currency rate, such that it never exceeds 100 percent.6/ Applies to all stress scenarios except for A2 (less favorable financing) in which the terms on all new financing are as specified in footnote 2.
Debt service-to-revenue ratio
pDebt service-to-exports+remittances ratio

14
2014 2015 2016 2017 2018 2019 2024 2034
Baseline 43 43 43 43 43 43 39 31
A. Alternative scenarios
A1. Real GDP growth and primary balance are at historical averages 43 45 47 49 52 55 65 81A2. Primary balance is unchanged from 2014 43 44 45 46 48 50 54 60A3. Permanently lower GDP growth 1/ 43 43 43 44 44 44 43 43Authorities’ PSE framework 3/ 40 42 46 49 53 50 41 34
B. Bound tests
B1. Real GDP growth is at historical average minus one standard deviations in 2015-20 43 45 47 48 48 49 49 47B2. Primary balance is at historical average minus one standard deviations in 2015-201 43 45 48 48 47 47 43 34B3. Combination of B1-B2 using one half standard deviation shocks 43 46 49 49 50 50 49 44B4. One-time 30 percent real depreciation in 2015 43 54 53 52 52 51 46 38B5. 10 percent of GDP increase in other debt-creating flows in 2015 43 52 52 51 51 50 45 35
Baseline 186 183 180 179 178 178 160 127
A. Alternative scenarios
A1. Real GDP growth and primary balance are at historical averages 186 191 196 205 214 225 262 318A2. Primary balance is unchanged from 2014 186 187 189 194 199 205 223 244A3. Permanently lower GDP growth 1/ 186 184 181 182 182 183 175 174Authorities’ PSE framework 3/ 180 187 199 214 231 216 180 150
B. Bound tests
B1. Real GDP growth is at historical average minus one standard deviations in 2015-20 186 190 194 197 200 203 200 190B2. Primary balance is at historical average minus one standard deviations in 2015-201 186 194 201 199 197 196 174 136B3. Combination of B1-B2 using one half standard deviation shocks 186 194 203 204 205 207 198 179B4. One-time 30 percent real depreciation in 2015 186 231 223 218 215 212 188 154B5. 10 percent of GDP increase in other debt-creating flows in 2015 186 222 216 213 210 208 185 143
Baseline 22 32 29 27 31 26 30 17
A. Alternative scenarios
A1. Real GDP growth and primary balance are at historical averages 22 32 30 30 35 31 42 40A2. Primary balance is unchanged from 2014 22 32 29 28 33 29 36 31A3. Permanently lower GDP growth 1/ 22 32 29 27 31 27 32 22Authorities’ PSE framework 3/ 23 32 29 28 32 29 28 16
B. Bound tests
B1. Real GDP growth is at historical average minus one standard deviations in 2015-20 22 32 30 29 34 29 35 25B2. Primary balance is at historical average minus one standard deviations in 2015-201 22 32 29 30 35 27 32 19B3. Combination of B1-B2 using one half standard deviation shocks 22 32 30 31 35 29 34 24B4. One-time 30 percent real depreciation in 2015 22 33 32 30 35 31 39 27B5. 10 percent of GDP increase in other debt-creating flows in 2015 22 32 30 38 33 29 33 20
Sources: Country authorities; and staff estimates and projections.1/ Assumes that real GDP growth is at baseline minus one standard deviation divided by the square root of the length of the projection period.2/ Revenues are defined inclusive of grants.3/ Authorities' estimates before revisions to 2014 fiscal indicators based on PSI discussions.
PV of Debt-to-GDP Ratio
Projections
PV of Debt-to-Revenue Ratio 2/
Debt Service-to-Revenue Ratio 2/
Table 4. Senegal: Sensitivity Analysis for Key Indicators of Public Debt, 2014-2034