Embed Size (px)
Citation preview


Send questions to:[email protected]

Industrial Purification with Convective Industrial Purification with Convective Interaction Media Interaction Media ™ Monoliths Monoliths
• Enhancing overall productivity and reducing COGS
• Tony Brazzale, BIA Separations• Tony Brazzale, BIA Separations
Outline
• Brief discussion of the technology• Case study, influenza• Case study, pDNA• Discussion of IgG purification on monoliths• PAT application• PAT application• Conclusions

Important Considerations for Manufacturing
• High recovery of desired compound• Low impurity profile (HCP, DNA, etc.)• Lower COGS
– Higher DBC• Smaller column• Reduced buffer consumption• Smaller manufacturing footprint• Smaller manufacturing footprint
– Shorter processing time• Other considerations
– Regulatory– Validation– Aseptic process
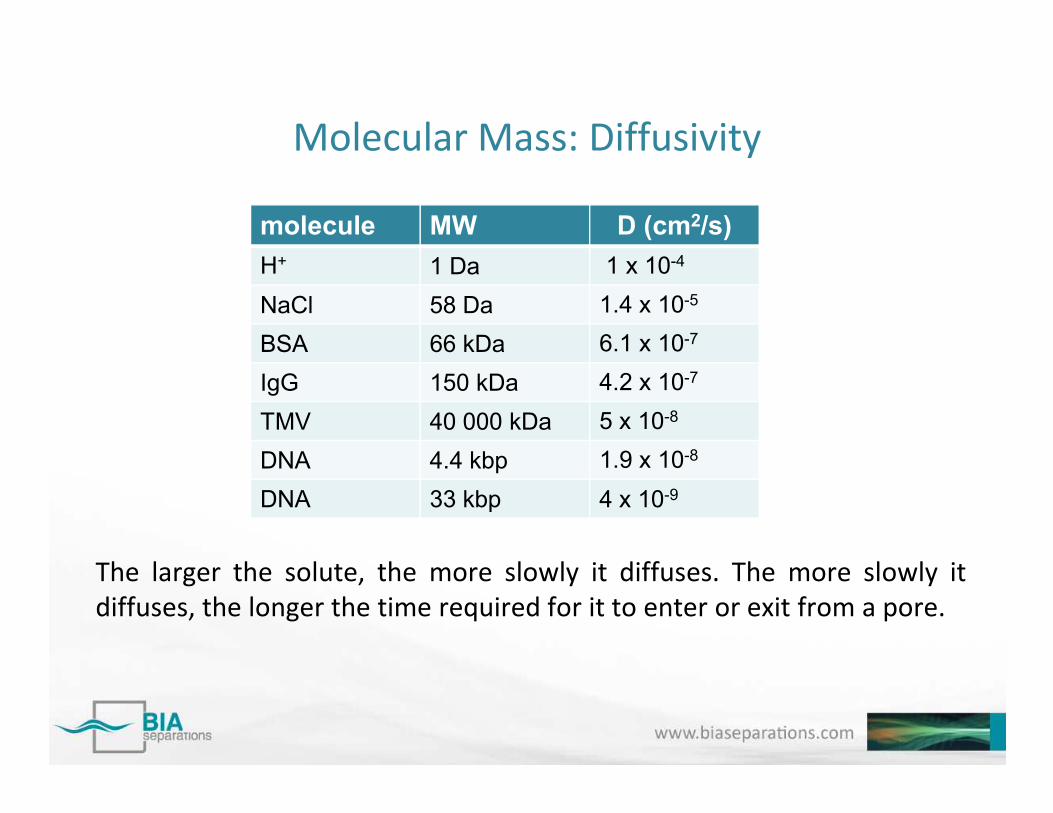
Molecular Mass: Diffusivity
molecule MW D (cm2/s)H+ 1 Da 1 x 10⁻⁴
NaCl 58 Da 1.4 x 10⁻⁵
BSA 66 kDa 6.1 x 10⁻⁷
IgG 150 kDa 4.2 x 10⁻⁷
The larger the solute, the more slowly it diffuses. The more slowly itdiffuses, the longer the time required for it to enter or exit from a pore.
TMV 40 000 kDa 5 x 10⁻⁸
DNA 4.4 kbp 1.9 x 10⁻⁸
DNA 33 kbp 4 x 10⁻⁹

Mass Transport by Diffusion
Mass transport in packed porous particle columns is a combination ofconvective transport through the void volume, and diffusive transportfrom particle surfaces into the pores.

Convective Mass Transport
Laminar flow prevents the eddy formation that causes dispersion and shear in packed particle columns. In further contrast, the axis of flow in a monolith is determined by local channel orientation. This prevents formation of “flow-shadows” that occur below the abaxial particle surfaces in packed columns
Courtesy P. Gagnon www.validated.com
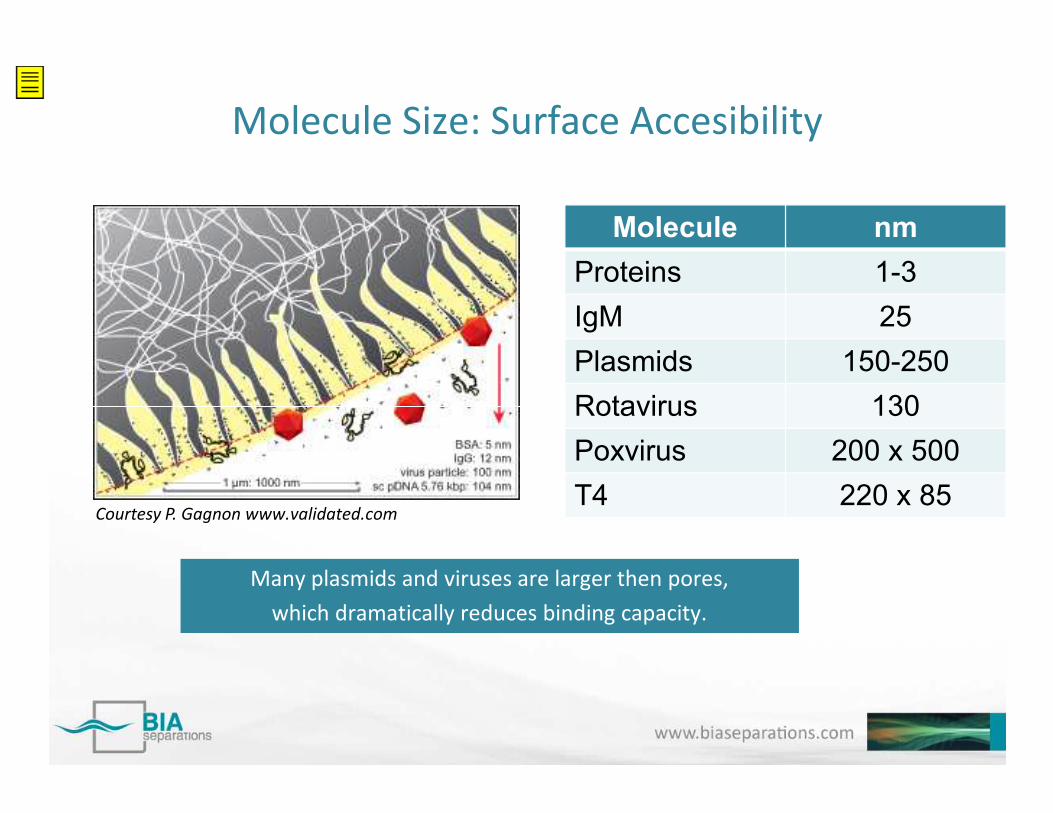
Molecule Size: Surface Accesibility
Molecule nm
Proteins 1-3
IgM 25
Plasmids 150-250
Rotavirus 130
Many plasmids and viruses are larger then pores, which dramatically reduces binding capacity.
Rotavirus 130
Poxvirus 200 x 500
T4 220 x 85Courtesy P. Gagnon www.validated.com

CIM Monoliths Properties
• Channel diameter is 1-2 µm• Channels are interconnected• Channel volume is 60%
• Convective transport• High surface accessibility• Low pressure drop
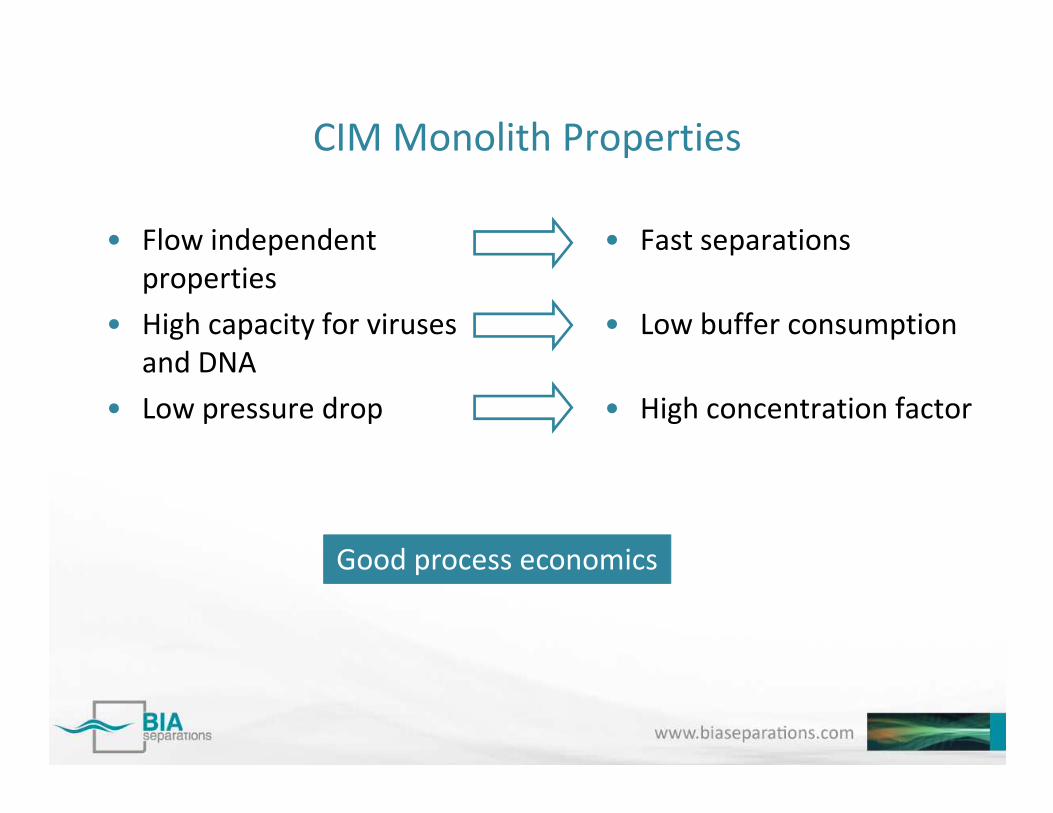
• Flow independent properties
• High capacity for viruses and DNA
• Low pressure drop
• Fast separations
• Low buffer consumption
• High concentration factor
CIM Monolith Properties
• Low pressure drop • High concentration factor
Good process economics

Convective Transport: Consequences
• Flow independent properties
50
60
Ab
sorb
ance
at
280
nm
[m
AU
]
80
100
40 ml/min
12
3
250
300
Abs
orba
nce
at 2
80 n
m (
mA
U)
35.9 ml/min
Flow rate
Podgornik et al., Anal. Chem. 72 (2000) 5693
0
10
20
30
40
0 50 100 150 200 250 300
Volume [ml]
Ab
sorb
ance
at
280
nm
[m
AU
]
0
20
40
60
80
Bu
ffer
A [
%]
40 ml/min80 ml/min120 ml/min160 ml/min200 ml/min240 ml/min
0
50
100
150
200
0 100 200 300 400 500 600 700 800 900 1000
Elution volume (ml)
Abs
orba
nce
at 2
80 n
m (
mA
U)
35.9 ml/min
76.2 ml/min
152.7 ml/min
224.6 ml/min
681 ml/min
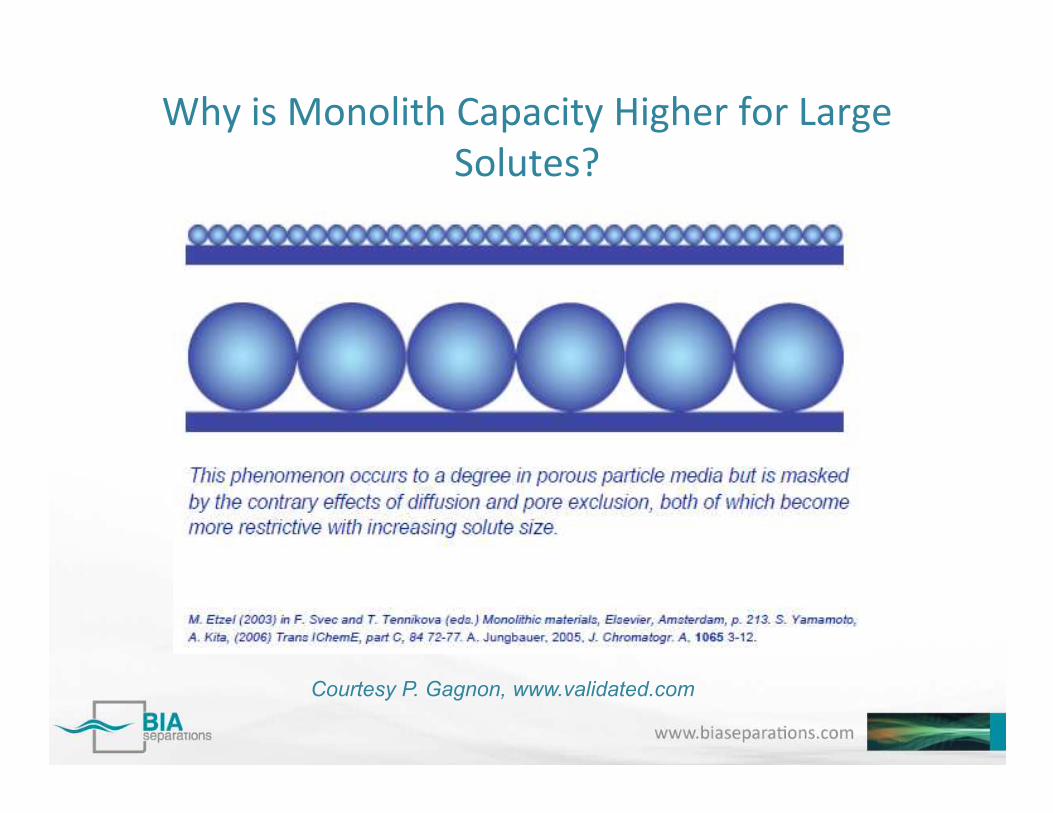
Why is Monolith Capacity Higher for Large Solutes?
Courtesy P. Gagnon, www.validated.com
Manufacturing of VirusesCase study: Influenza virus3
EU FP6 Cooperation: Fluvacc
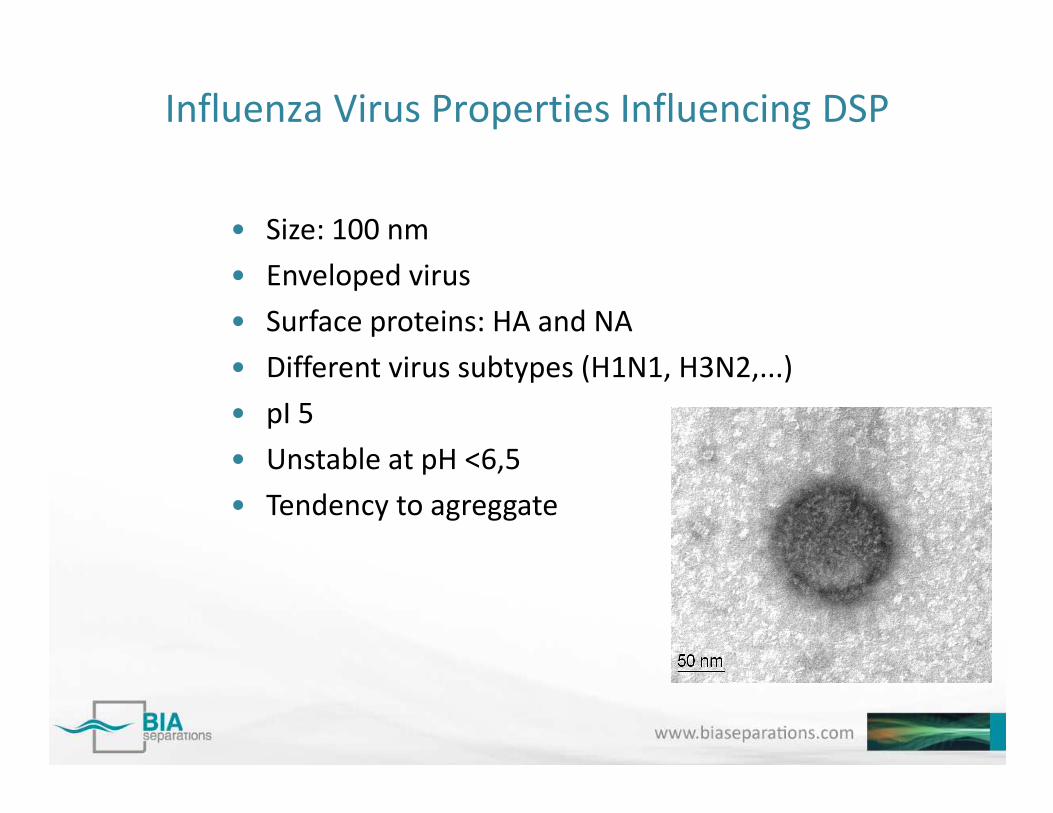
Influenza Virus Properties Influencing DSP
• Size: 100 nm• Enveloped virus• Surface proteins: HA and NA• Different virus subtypes (H1N1, H3N2,...)• pI 5• pI 5• Unstable at pH <6,5• Tendency to agreggate

Safety• Production in Vero cells• Reverse genetics• Replication-deficient• Pathogenicity factor NS1 deleted
Efficacy• Self-adjuvant effect• Cross-protective• Local immunity (nasal delivery)
Relication-Deficient Attenuated Influenza Vaccine
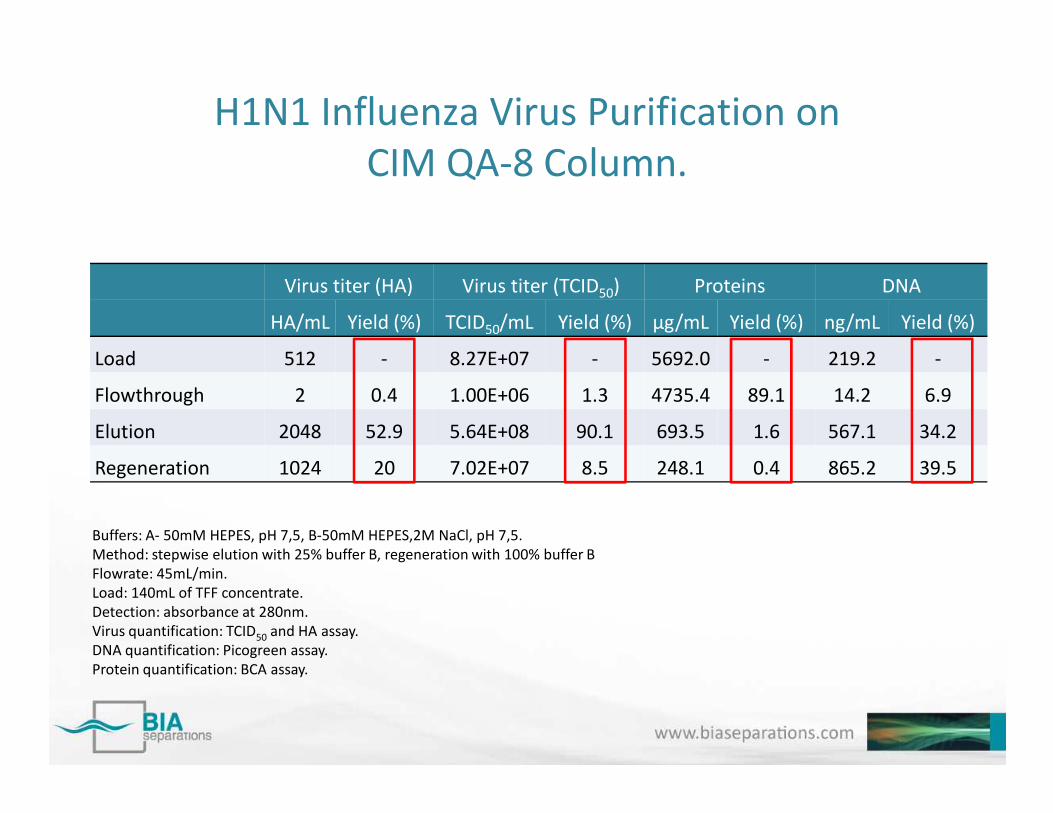
H1N1 Influenza Virus Purification on CIM QA-8 Column.
Virus titer (HA) Virus titer (TCID50) Proteins DNA
HA/mL Yield (%) TCID50/mL Yield (%) µg/mL Yield (%) ng/mL Yield (%)
Load 512 - 8.27E+07 - 5692.0 - 219.2 -
Flowthrough 2 0.4 1.00E+06 1.3 4735.4 89.1 14.2 6.9
Elution 2048 52.9 5.64E+08 90.1 693.5 1.6 567.1 34.2
Regeneration 1024 20 7.02E+07 8.5 248.1 0.4 865.2 39.5
Buffers: A- 50mM HEPES, pH 7,5, B-50mM HEPES,2M NaCl, pH 7,5.Method: stepwise elution with 25% buffer B, regeneration with 100% buffer BFlowrate: 45mL/min.Load: 140mL of TFF concentrate.Detection: absorbance at 280nm.Virus quantification: TCID50 and HA assay.DNA quantification: Picogreen assay.Protein quantification: BCA assay.
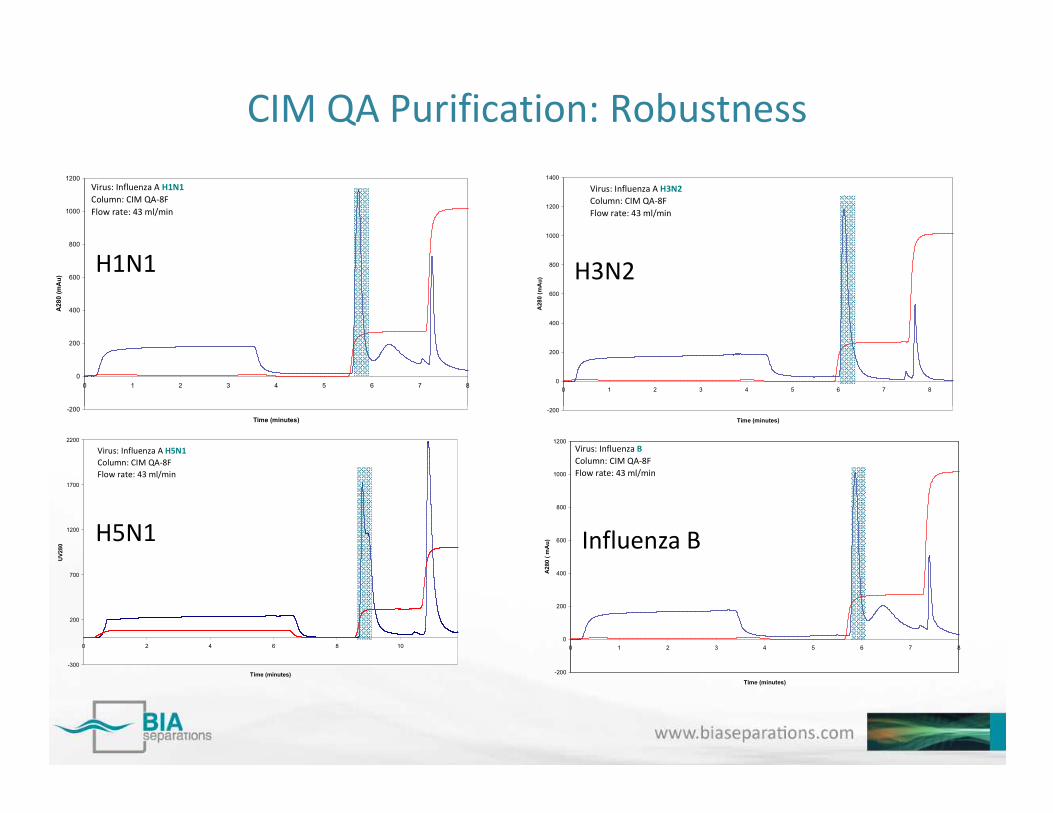
CIM QA Purification: Robustness
-200
0
200
400
600
800
1000
1200
0 1 2 3 4 5 6 7 8
A28
0 (m
Au
)
Virus: Influenza A H1N1Column: CIM QA-8FFlow rate: 43 ml/min
0
200
400
600
800
1000
1200
1400
0 1 2 3 4 5 6 7 8
A28
0 (m
Au
)
Virus: Influenza A H3N2Column: CIM QA-8FFlow rate: 43 ml/min
H1N1 H3N2
-200
Time (minutes)
-300
200
700
1200
1700
2200
0 2 4 6 8 10
Time (minutes)
UV
280
Virus: Influenza A H5N1Column: CIM QA-8FFlow rate: 43 ml/min
-200
0
200
400
600
800
1000
1200
0 1 2 3 4 5 6 7 8
Time (minutes)
A28
0 (
mA
u)
Virus: Influenza BColumn: CIM QA-8FFlow rate: 43 ml/min
-200
Time (minutes)
H5N1 Influenza B
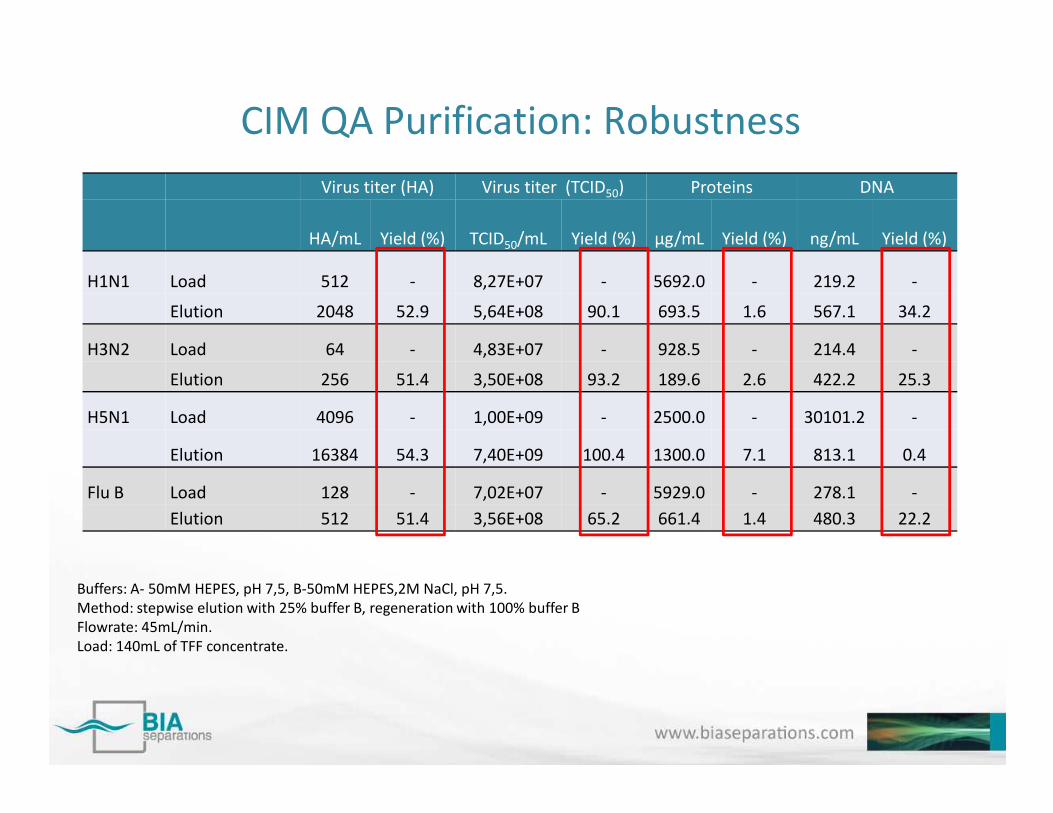
CIM QA Purification: RobustnessVirus titer (HA) Virus titer (TCID50) Proteins DNA
HA/mL Yield (%) TCID50/mL Yield (%) µg/mL Yield (%) ng/mL Yield (%)
H1N1 Load 512 - 8,27E+07 - 5692.0 - 219.2 -
Elution 2048 52.9 5,64E+08 90.1 693.5 1.6 567.1 34.2
H3N2 Load 64 - 4,83E+07 - 928.5 - 214.4 -
Elution 256 51.4 3,50E+08 93.2 189.6 2.6 422.2 25.3
H5N1 Load 4096 - 1,00E+09 - 2500.0 - 30101.2 -H5N1 Load 4096 - 1,00E+09 - 2500.0 - 30101.2 -
Elution 16384 54.3 7,40E+09 100.4 1300.0 7.1 813.1 0.4
Flu B Load 128 - 7,02E+07 - 5929.0 - 278.1 -Elution 512 51.4 3,56E+08 65.2 661.4 1.4 480.3 22.2
Buffers: A- 50mM HEPES, pH 7,5, B-50mM HEPES,2M NaCl, pH 7,5.Method: stepwise elution with 25% buffer B, regeneration with 100% buffer BFlowrate: 45mL/min.Load: 140mL of TFF concentrate.
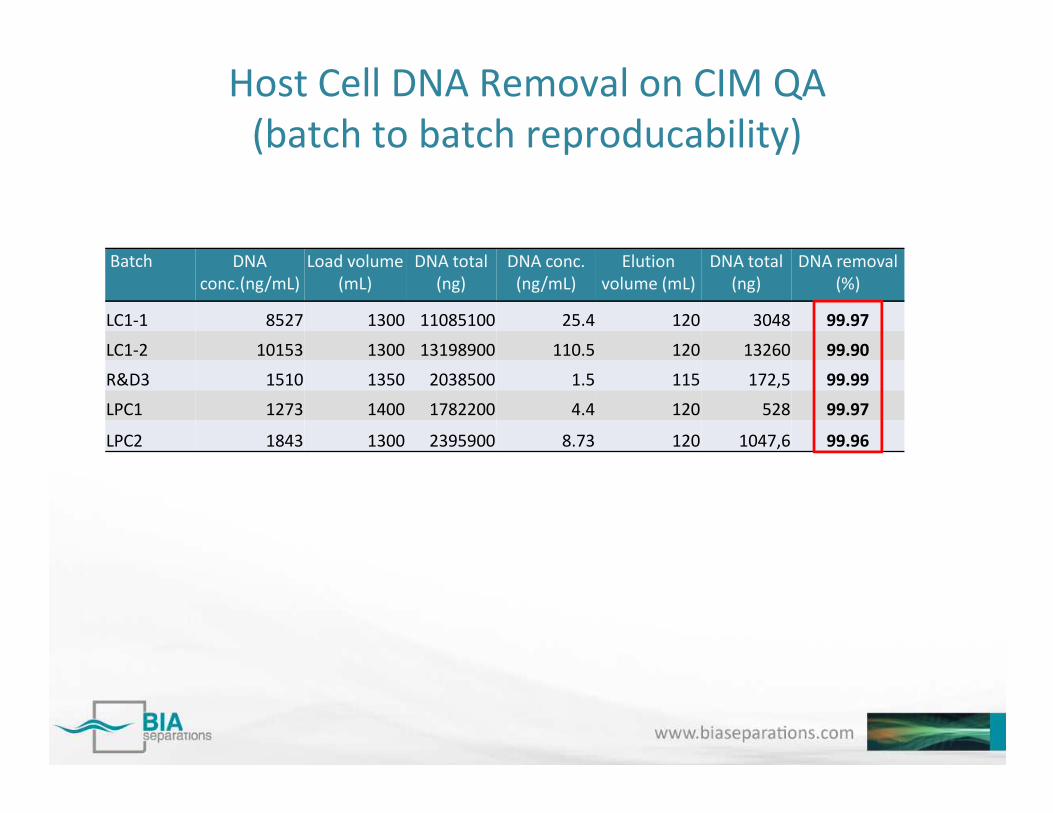
Host Cell DNA Removal on CIM QA(batch to batch reproducability)
Batch DNA conc.(ng/mL)
Load volume (mL)
DNA total (ng)
DNA conc. (ng/mL)
Elution volume (mL)
DNA total (ng)
DNA removal (%)
LC1-1 8527 1300 11085100 25.4 120 3048 99.97
LC1-2 10153 1300 13198900 110.5 120 13260 99.90
R&D3 1510 1350 2038500 1.5 115 172,5 99.99
LPC1 1273 1400 1782200 4.4 120 528 99.97LPC1 1273 1400 1782200 4.4 120 528 99.97
LPC2 1843 1300 2395900 8.73 120 1047,6 99.96
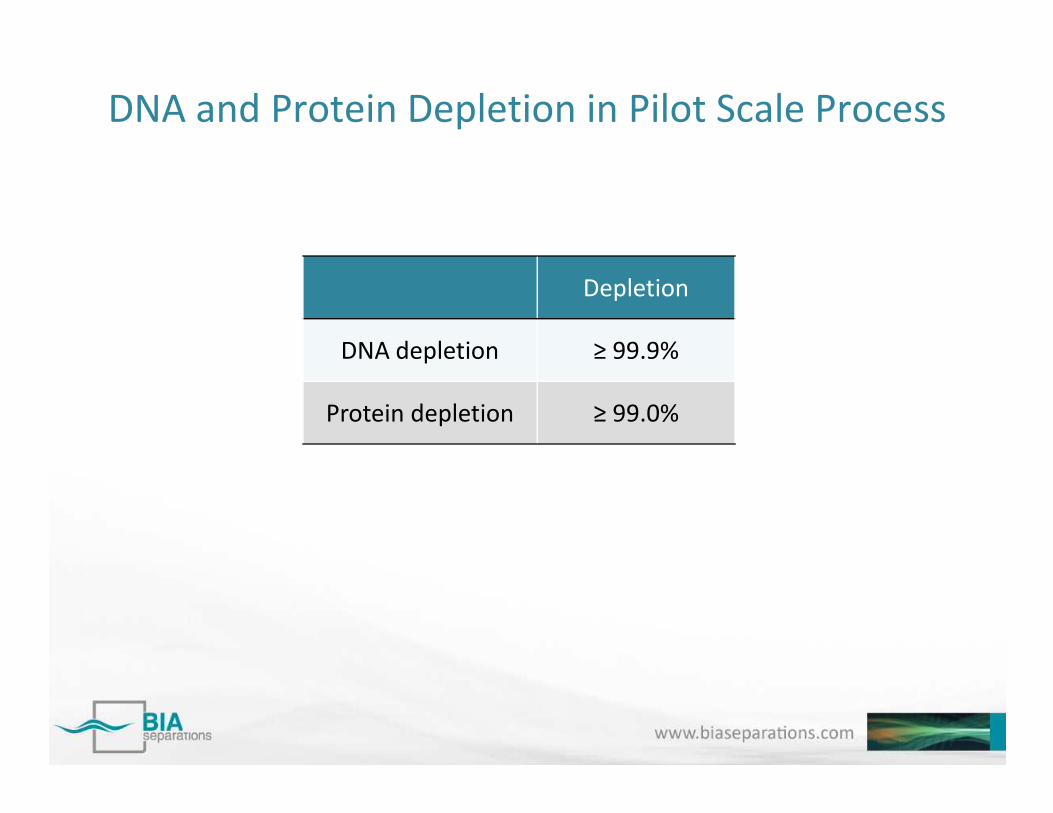
DNA and Protein Depletion in Pilot Scale Process
Depletion
DNA depletion ≥ 99.9%
Protein depletion ≥ 99.0%Protein depletion ≥ 99.0%
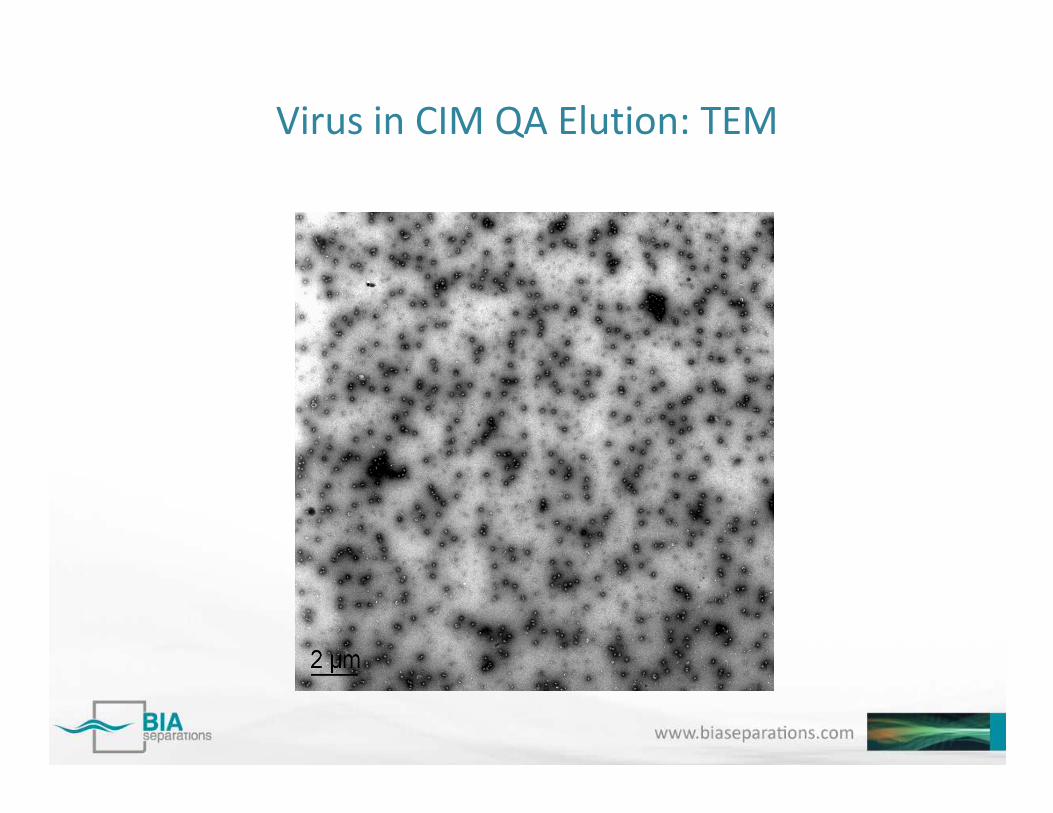
Virus in CIM QA Elution: TEM
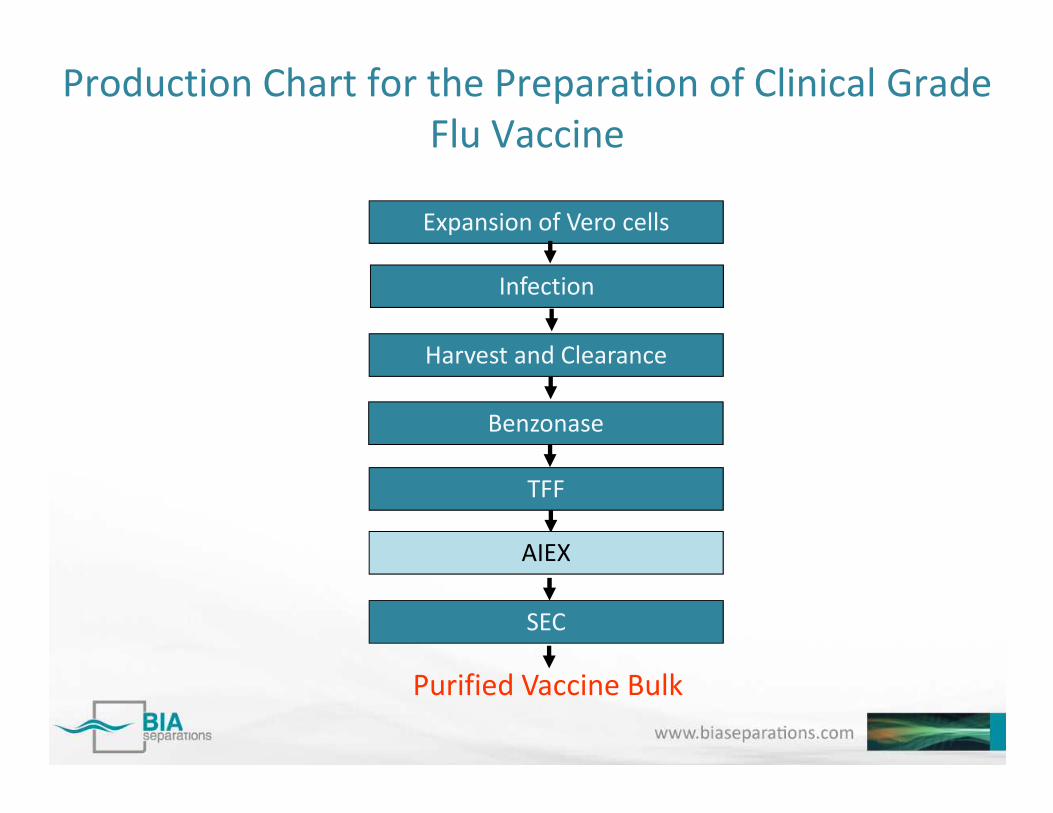
Production Chart for the Preparation of Clinical Grade Flu Vaccine
Expansion of Vero cells
Harvest and Clearance
Infection
Benzonase
TFF
AIEX
SEC
Purified Vaccine Bulk
Benzonase
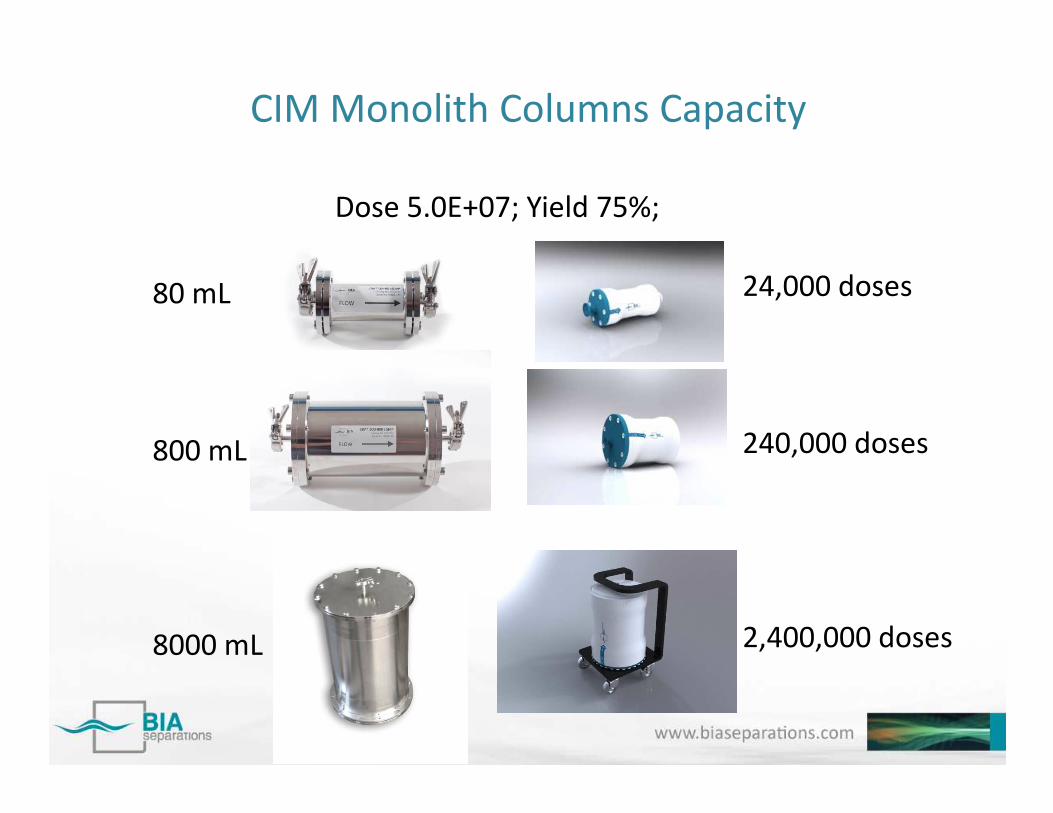
CIM Monolith Columns Capacity
80 mL 24,000 doses
Dose 5.0E+07; Yield 75%;
800 mL
8000 mL
240,000 doses
2,400,000 doses
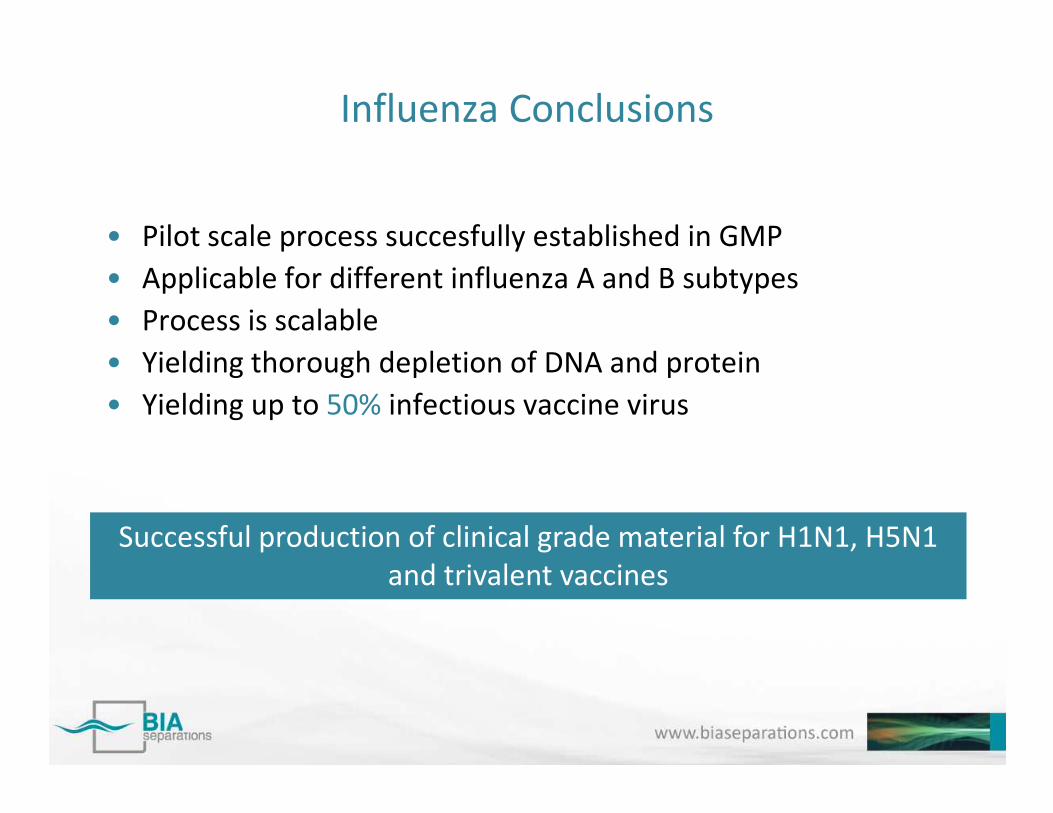
Influenza Conclusions
• Pilot scale process succesfully established in GMP• Applicable for different influenza A and B subtypes• Process is scalable• Yielding thorough depletion of DNA and protein• Yielding up to 50% infectious vaccine virus• Yielding up to 50% infectious vaccine virus
Successful production of clinical grade material for H1N1, H5N1and trivalent vaccines
Manufacturing of DNACase study: Pharmaceutical grade pure pDNA
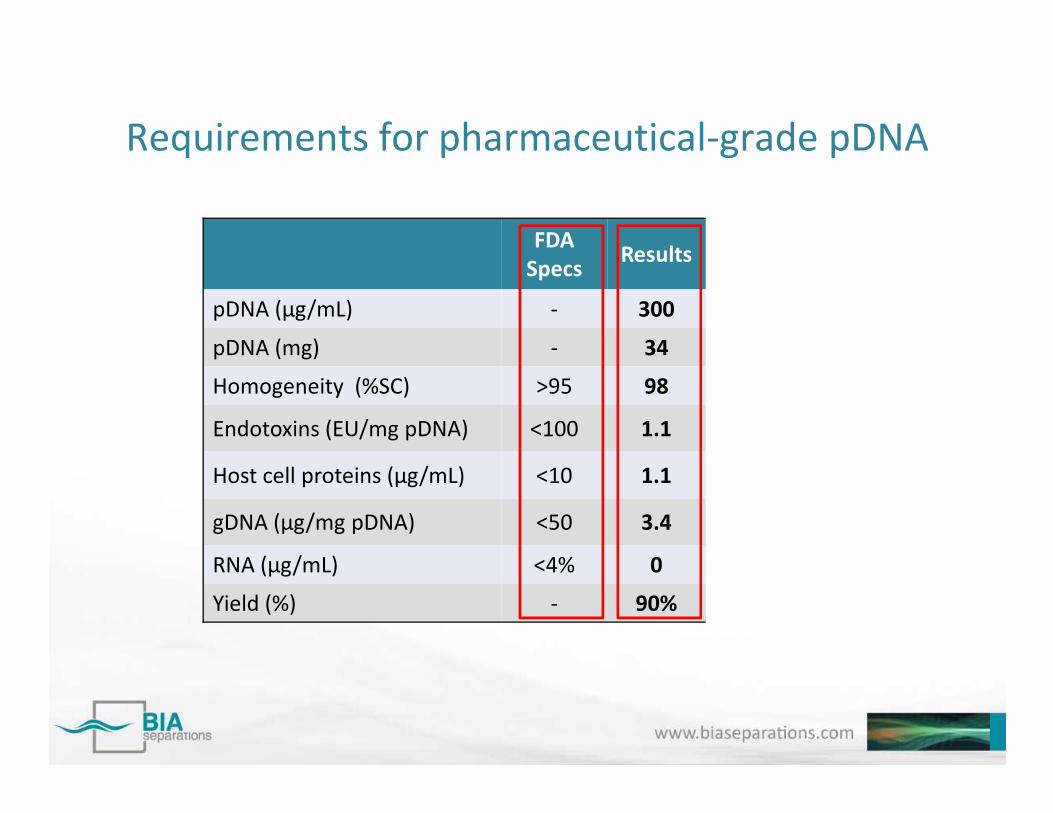
Requirements for pharmaceutical-grade pDNA
FDA Specs
Results
pDNA (μg/mL) - 300
pDNA (mg) - 34
Homogeneity (%SC) >95 98
Endotoxins (EU/mg pDNA) <100 1.1
Host cell proteins (μg/mL) <10 1.1
gDNA (μg/mg pDNA) <50 3.4
RNA (μg/mL) <4% 0
Yield (%) - 90%

CIM Process Based on AIX and HIC Column
• CIM DEAE Step– RNA and proteins are
separated from pDNA• RNA free• Host cell proteins free• Host cell proteins free
• CIM C4 HLD Step– sc DNA separated from
• oc DNA• genomic DNA free• Endotoxins free
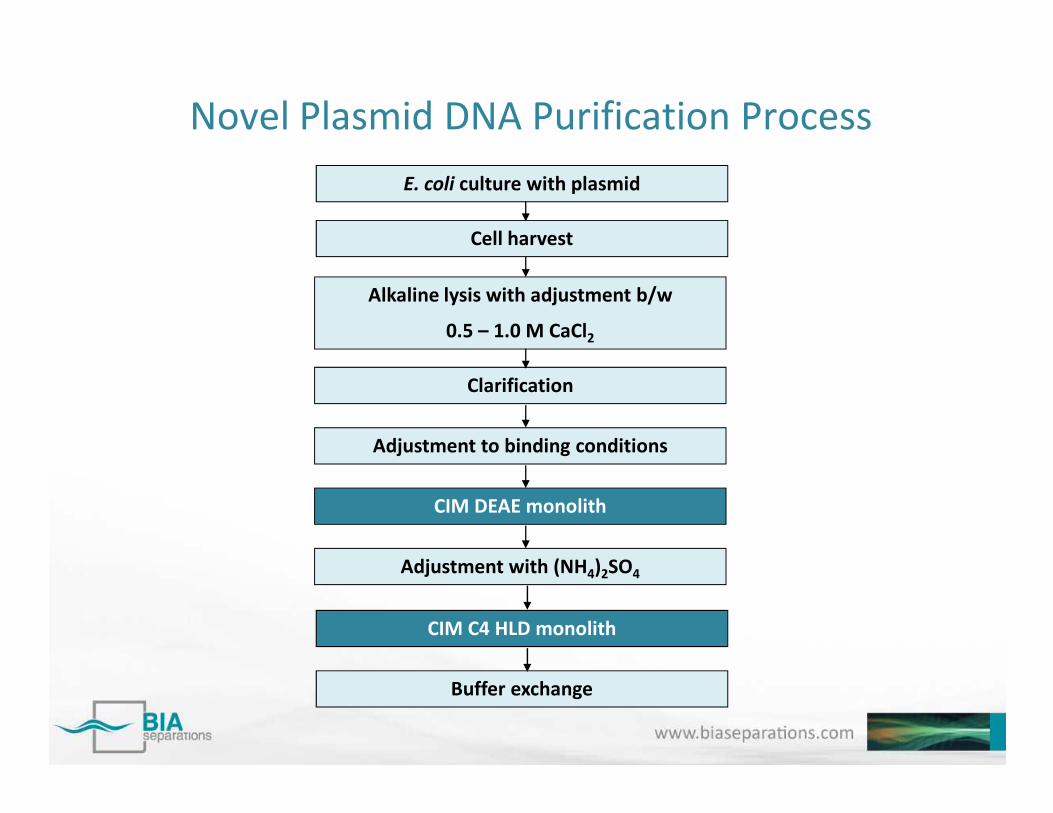
Novel Plasmid DNA Purification ProcessE. coli culture with plasmid
Cell harvest
Alkaline lysis with adjustment b/w
0.5 – 1.0 M CaCl2
Clarification
CIM DEAE monolith
CIM C4 HLD monolith
Buffer exchange
Adjustment to binding conditions
Adjustment with (NH4)2SO4
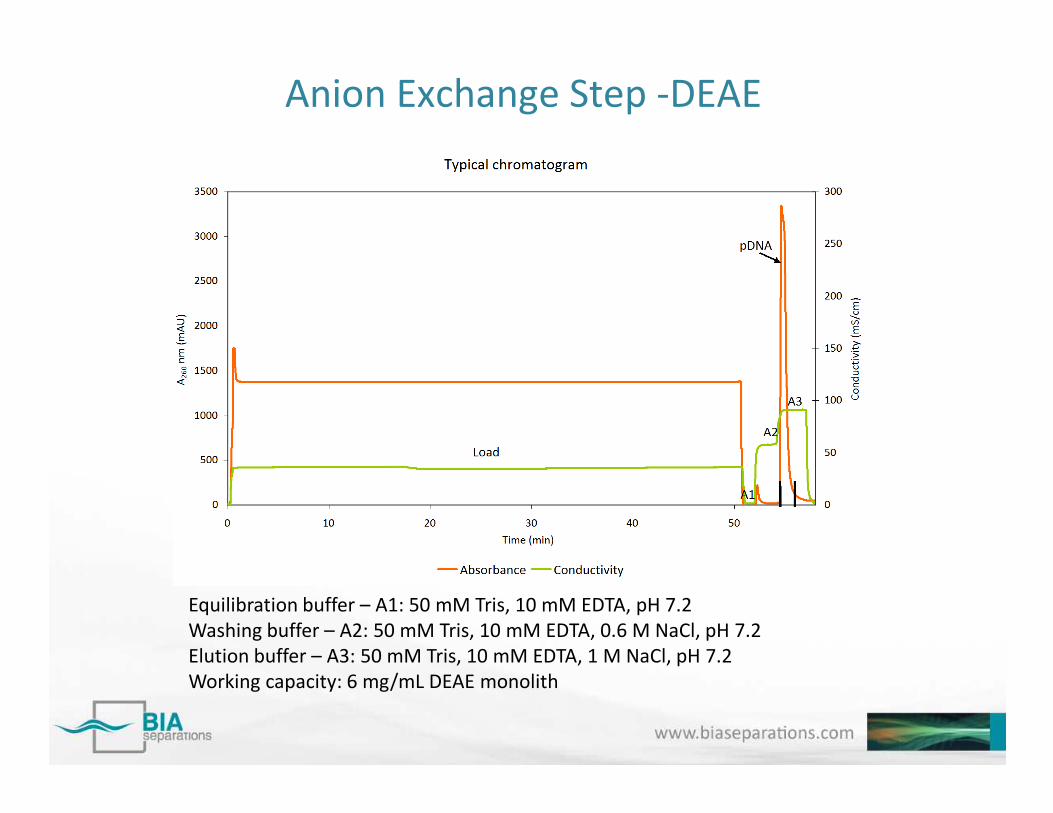
Anion Exchange Step -DEAE
Equilibration buffer – A1: 50 mM Tris, 10 mM EDTA, pH 7.2Washing buffer – A2: 50 mM Tris, 10 mM EDTA, 0.6 M NaCl, pH 7.2Elution buffer – A3: 50 mM Tris, 10 mM EDTA, 1 M NaCl, pH 7.2Working capacity: 6 mg/mL DEAE monolith
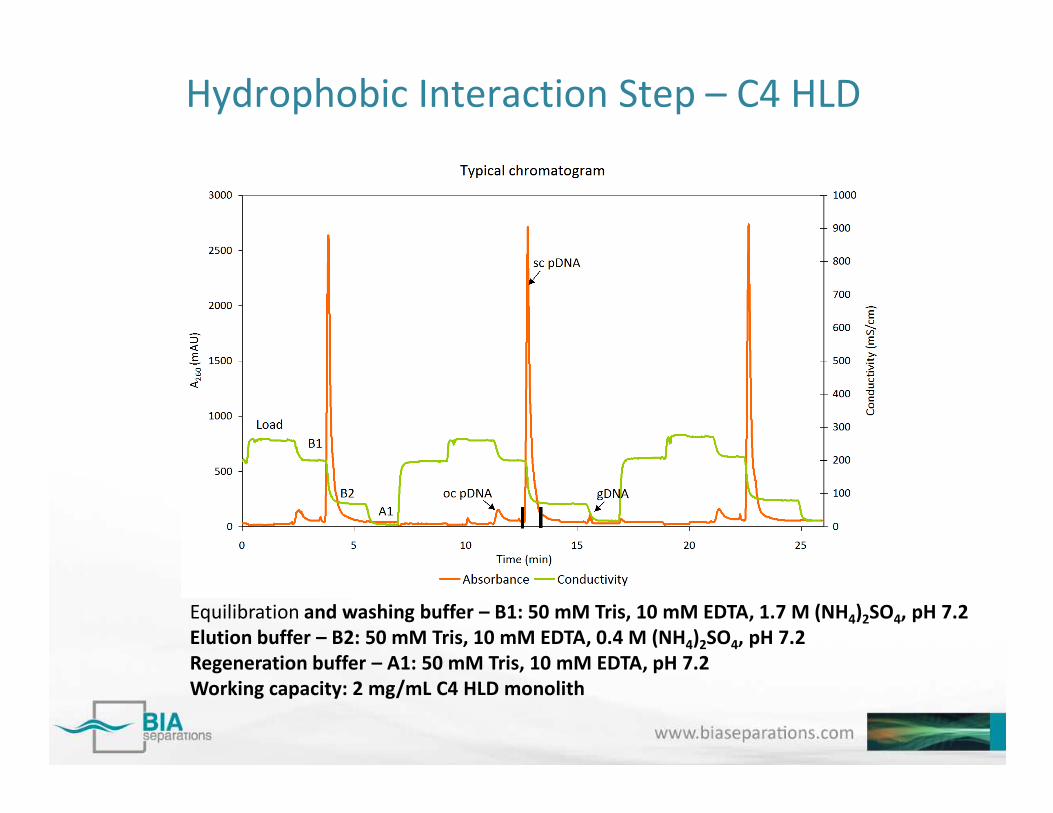
Hydrophobic Interaction Step – C4 HLD
Equilibration and washing buffer – B1: 50 mM Tris, 10 mM EDTA, 1.7 M (NH4)2SO4, pH 7.2Elution buffer – B2: 50 mM Tris, 10 mM EDTA, 0.4 M (NH4)2SO4, pH 7.2Regeneration buffer – A1: 50 mM Tris, 10 mM EDTA, pH 7.2Working capacity: 2 mg/mL C4 HLD monolith
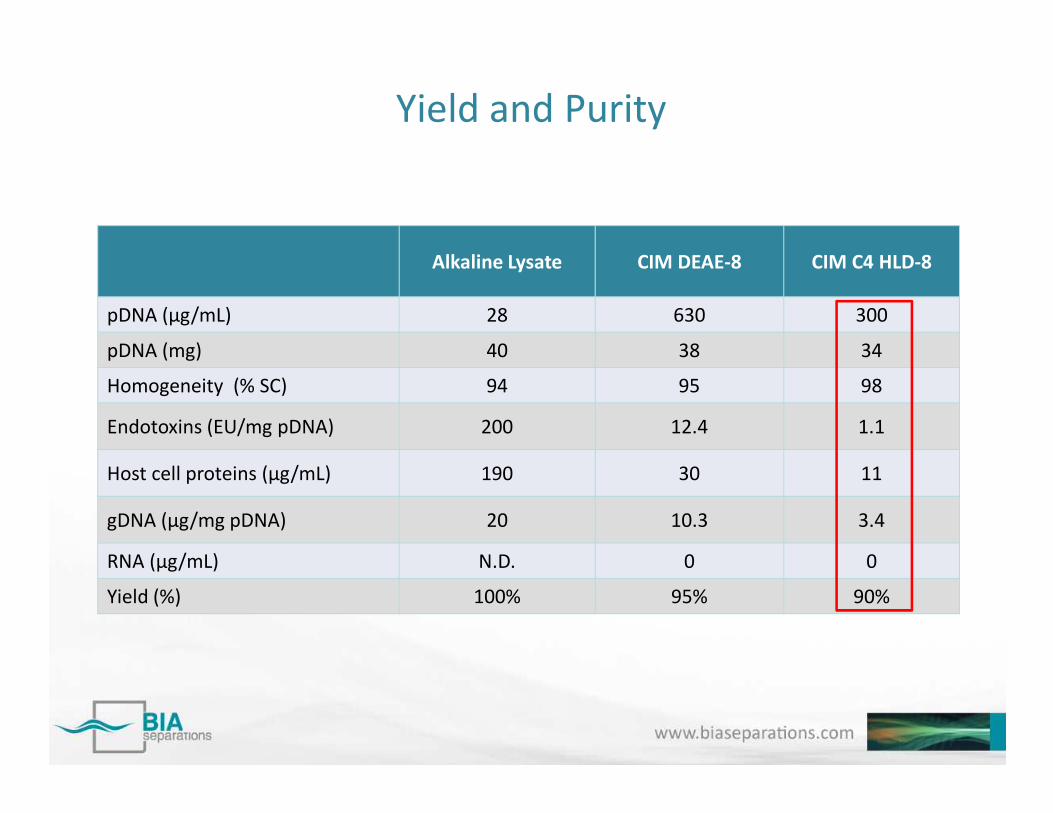
Yield and Purity
Alkaline Lysate CIM DEAE-8 CIM C4 HLD-8
pDNA (μg/mL) 28 630 300
pDNA (mg) 40 38 34
Homogeneity (% SC) 94 95 98
Endotoxins (EU/mg pDNA) 200 12.4 1.1
Host cell proteins (μg/mL) 190 30 11
gDNA (μg/mg pDNA) 20 10.3 3.4
RNA (μg/mL) N.D. 0 0
Yield (%) 100% 95% 90%
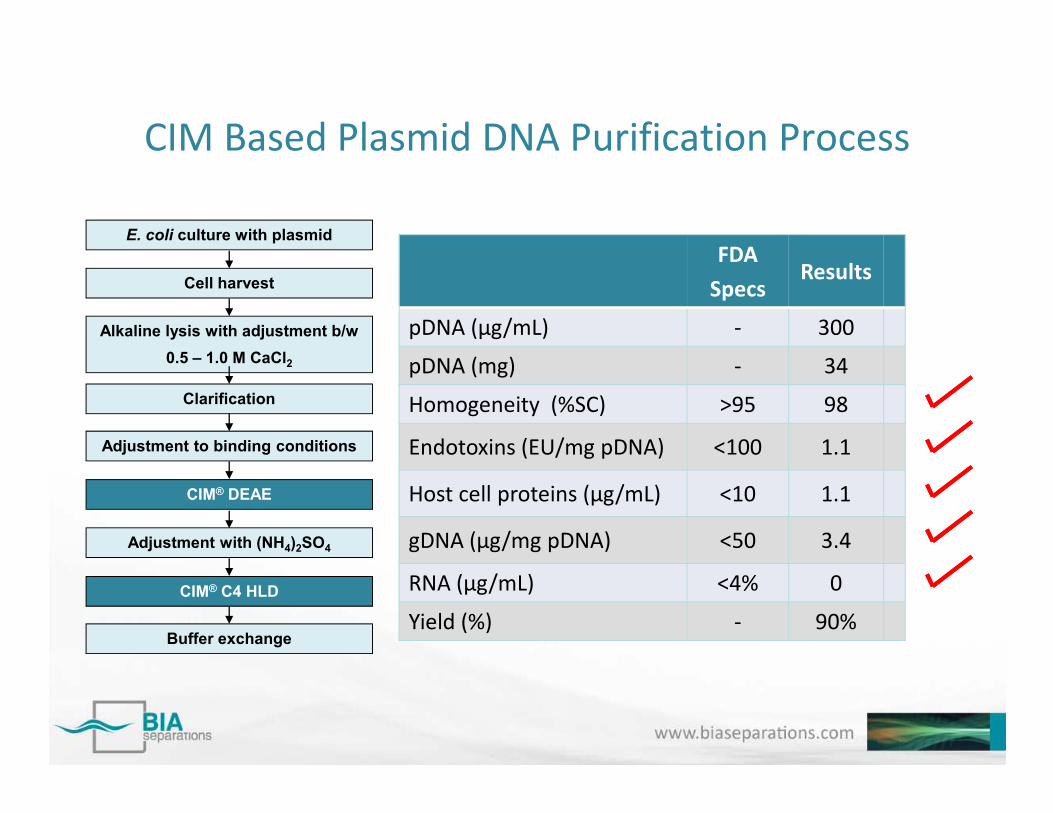
CIM Based Plasmid DNA Purification Process
FDASpecs
Results
pDNA (μg/mL) - 300
pDNA (mg) - 34
Homogeneity (%SC) >95 98
E. coli culture with plasmid
Cell harvest
Alkaline lysis with adjustment b/w
0.5 – 1.0 M CaCl2
Clarification Homogeneity (%SC) >95 98
Endotoxins (EU/mg pDNA) <100 1.1
Host cell proteins (μg/mL) <10 1.1
gDNA (μg/mg pDNA) <50 3.4
RNA (μg/mL) <4% 0
Yield (%) - 90%
Clarification
CIM® DEAE
CIM® C4 HLD
Buffer exchange
Adjustment to binding conditions
Adjustment with (NH4)2SO4
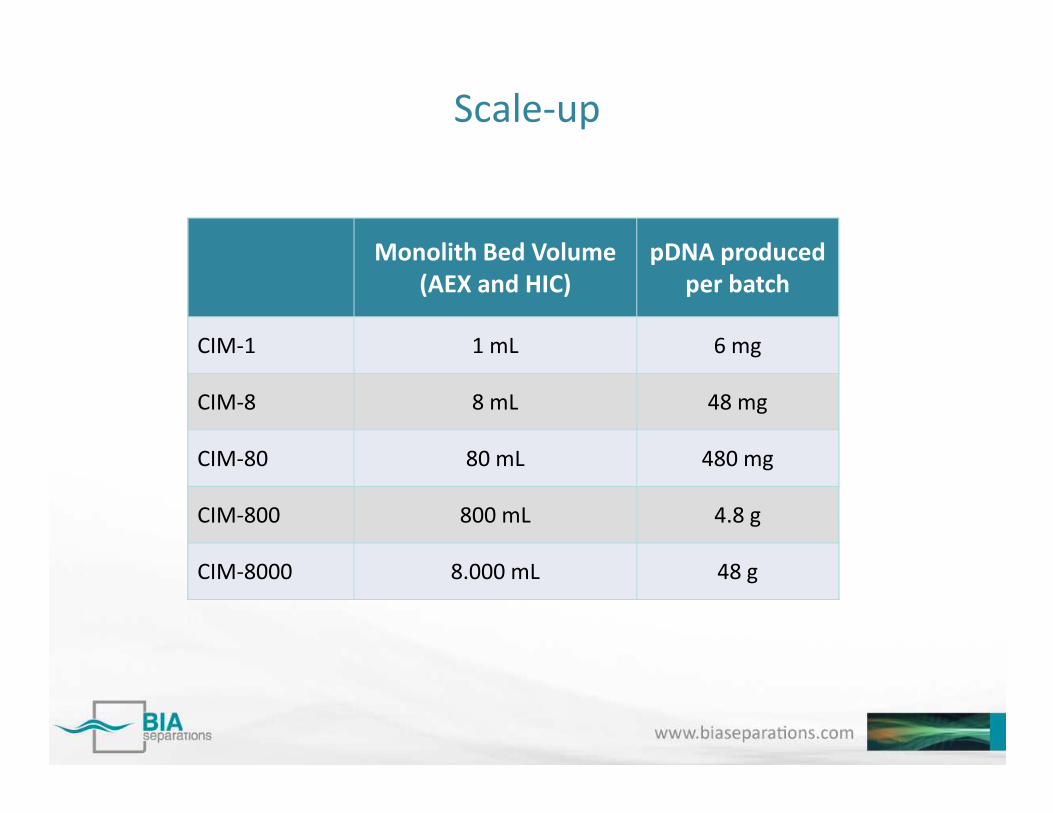
Scale-up
Monolith Bed Volume (AEX and HIC)
pDNA produced per batch
CIM-1 1 mL 6 mg
CIM-8 8 mL 48 mgCIM-8 8 mL 48 mg
CIM-80 80 mL 480 mg
CIM-800 800 mL 4.8 g
CIM-8000 8.000 mL 48 g
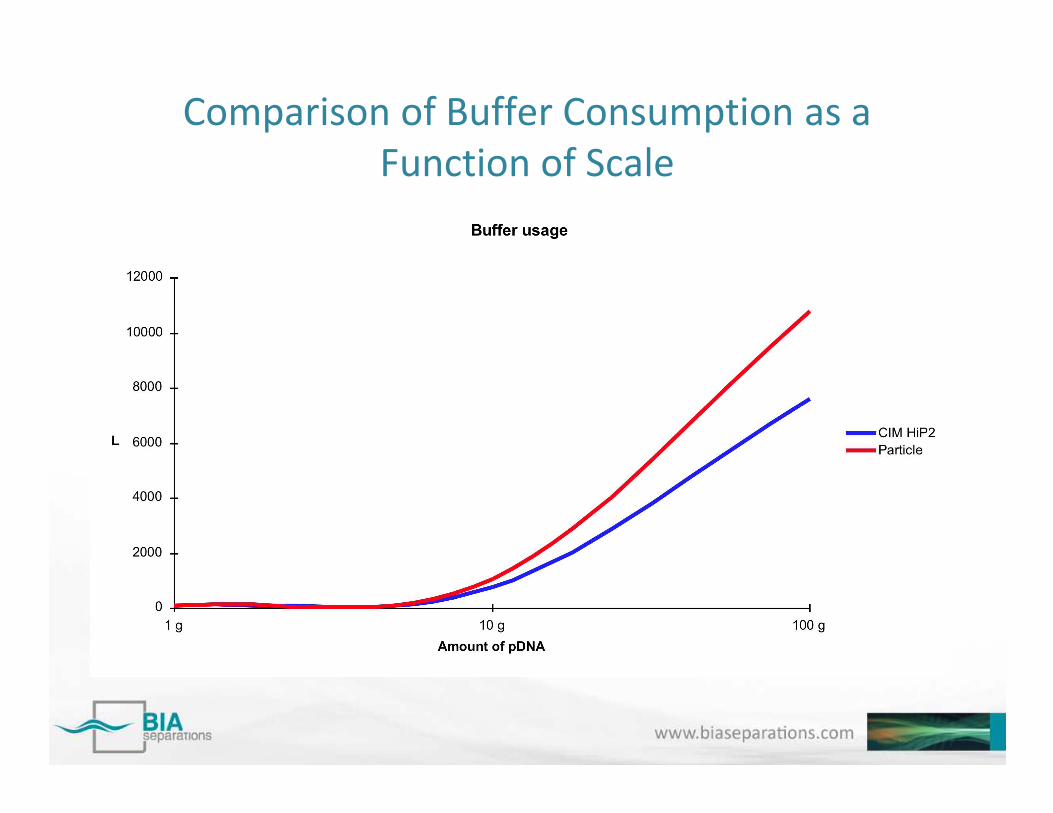
Comparison of Buffer Consumption as a Function of Scale
Excellent Economics
• Cost reduction
– Lowest per gram cost (pDNA)– Reduction in equipment cost– Reduced time– Reduced time– Lower buffer consumption
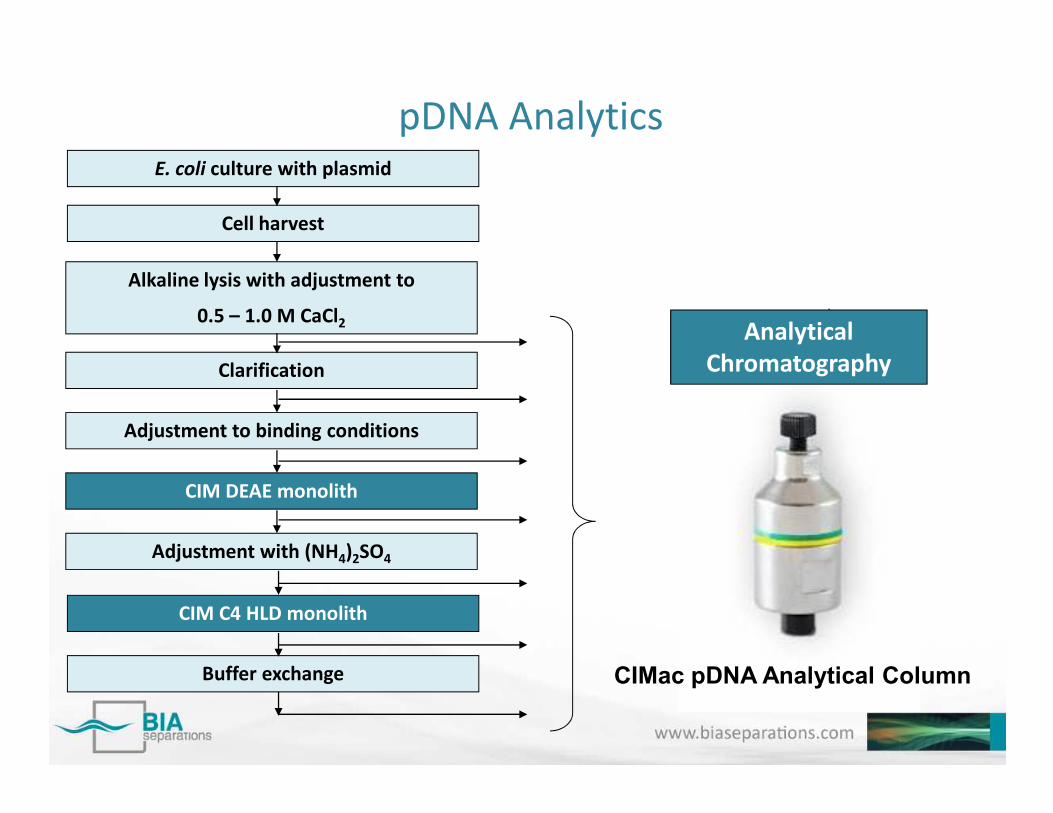
pDNA AnalyticsE. coli culture with plasmid
Cell harvest
Alkaline lysis with adjustment to
0.5 – 1.0 M CaCl2
Clarification
Analytical Chromatography
CIM DEAE monolith
CIM C4 HLD monolith
Buffer exchange
Adjustment to binding conditions
Adjustment with (NH4)2SO4
CIMac pDNA Analytical Column
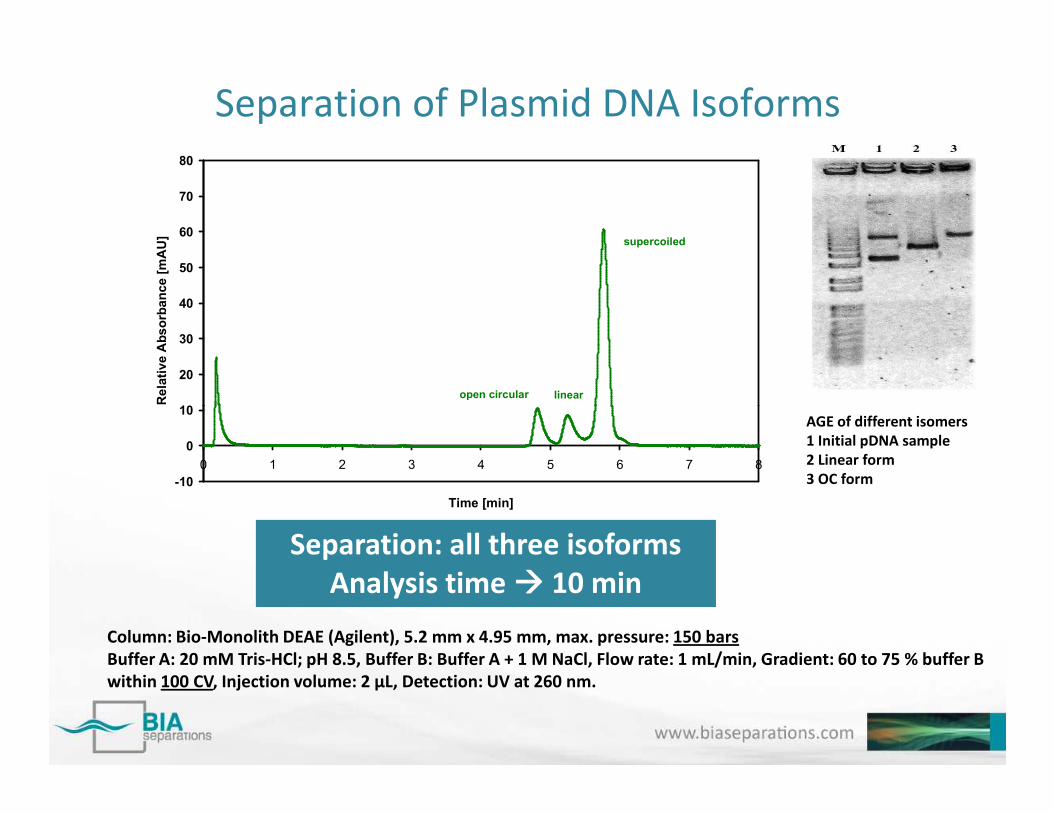
Separation of Plasmid DNA Isoforms
10
20
30
40
50
60
70
80R
elat
ive
Ab
sorb
ance
[m
AU
]
open circular
supercoiled
linear
-10
0
10
0 1 2 3 4 5 6 7 8
Time [min]
AGE of different isomers1 Initial pDNA sample2 Linear form3 OC form
Column: Bio-Monolith DEAE (Agilent), 5.2 mm x 4.95 mm, max. pressure: 150 barsBuffer A: 20 mM Tris-HCl; pH 8.5, Buffer B: Buffer A + 1 M NaCl, Flow rate: 1 mL/min, Gradient: 60 to 75 % buffer B within 100 CV, Injection volume: 2 μL, Detection: UV at 260 nm.
Separation: all three isoformsAnalysis time àààà 10 min

-2
8
18
28
38
48
58
68
78
0 2 4 6 8 10 12 14 16 18Time [min]
Rela
tive
Abs
orba
nce
A26
0nm
[mA
U]
0
20
40
60
80
100
120
Buff
er B
[%]
E. coli culture with plasmid
Cell harvest
Alkaline lysis with adjustment b/w
0.5 to 1.0 M CaCl2
Clarification
Adjustment to binding conditions
pDNA On-line Monitoring
Time [min]
alkaline lysate alkaline lysate with 0.5 M CaCl2 Buffer B [%]CIM® DEAE
CIM® C4 HLD
Buffer exchange
Adjustment with (NH4)2SO4Conditions:; Flow rate – 1 ml/min; Buffer A – 200 mM Tris pH 8.0 and buffer B – 200 mM TRIS +1 M NaCl pH 8.0; Injection volume – 20 µl; Samples were diluted 1:3 with water; UV detection –260 nm; Peak 1 – Flow through, Peak 2 – other impurities, Peak 3 – RNA, Peak 4 – OC pDNA,Peak 5 – SC pDNA.
M A 1 2 3 4 5 6
Figure 1: Agarose gel electrophoresis -Molecular weight marker (lane M), samplealkaline lysate plasmid pEGFP-N1 (lane A),peak 1 (lane 1), peak 2 (lane 2), peak 3(lane 3), peak 4 (lane 4), peak 5 (lane 5),pDNA open circular form standard (lane 6),
Manufacturing of Monoclonal AntibodiesCase study:IgG
Affinity Capture on Protein A
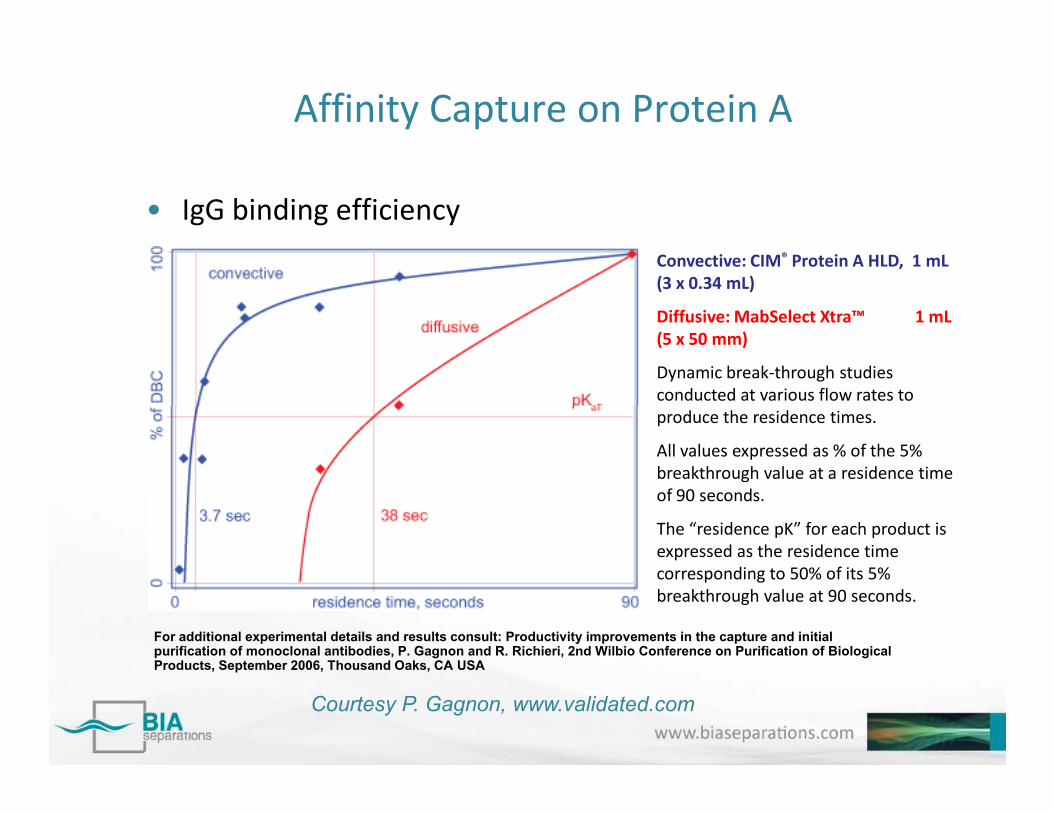
• IgG binding efficiency
Convective: CIM® Protein A HLD, 1 mL(3 x 0.34 mL)
Diffusive: MabSelect Xtra™ 1 mL(5 x 50 mm)
Dynamic break-through studies conducted at various flow rates to produce the residence times.
For additional experimental details and results consult: Productivity improvements in the capture and initial purification of monoclonal antibodies, P. Gagnon and R. Richieri, 2nd Wilbio Conference on Purification of Biological Products, September 2006, Thousand Oaks, CA USA
produce the residence times.
All values expressed as % of the 5% breakthrough value at a residence time of 90 seconds.
The “residence pK” for each product is expressed as the residence time corresponding to 50% of its 5% breakthrough value at 90 seconds.
Courtesy P. Gagnon, www.validated.com
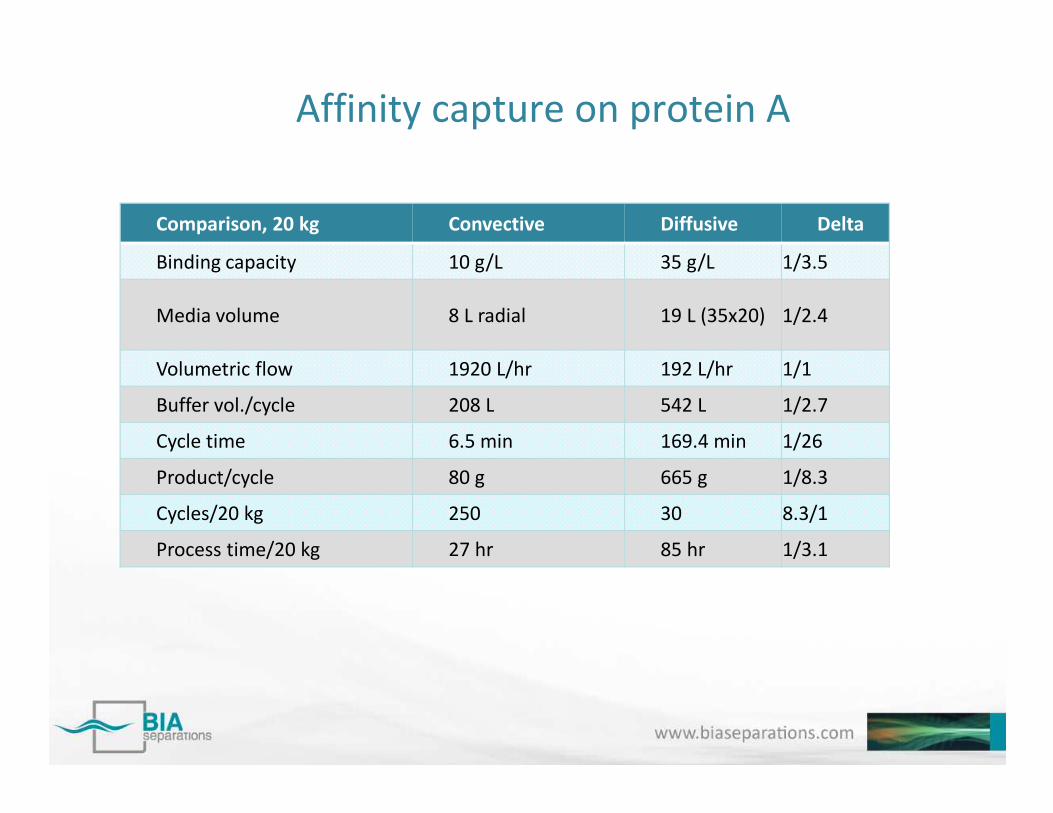
Affinity capture on protein A
Comparison, 20 kg Convective Diffusive Delta
Binding capacity 10 g/L 35 g/L 1/3.5
Media volume 8 L radial 19 L (35x20) 1/2.4
Volumetric flow 1920 L/hr 192 L/hr 1/1
Buffer vol./cycle 208 L 542 L 1/2.7Buffer vol./cycle 208 L 542 L 1/2.7
Cycle time 6.5 min 169.4 min 1/26
Product/cycle 80 g 665 g 1/8.3
Cycles/20 kg 250 30 8.3/1
Process time/20 kg 27 hr 85 hr 1/3.1
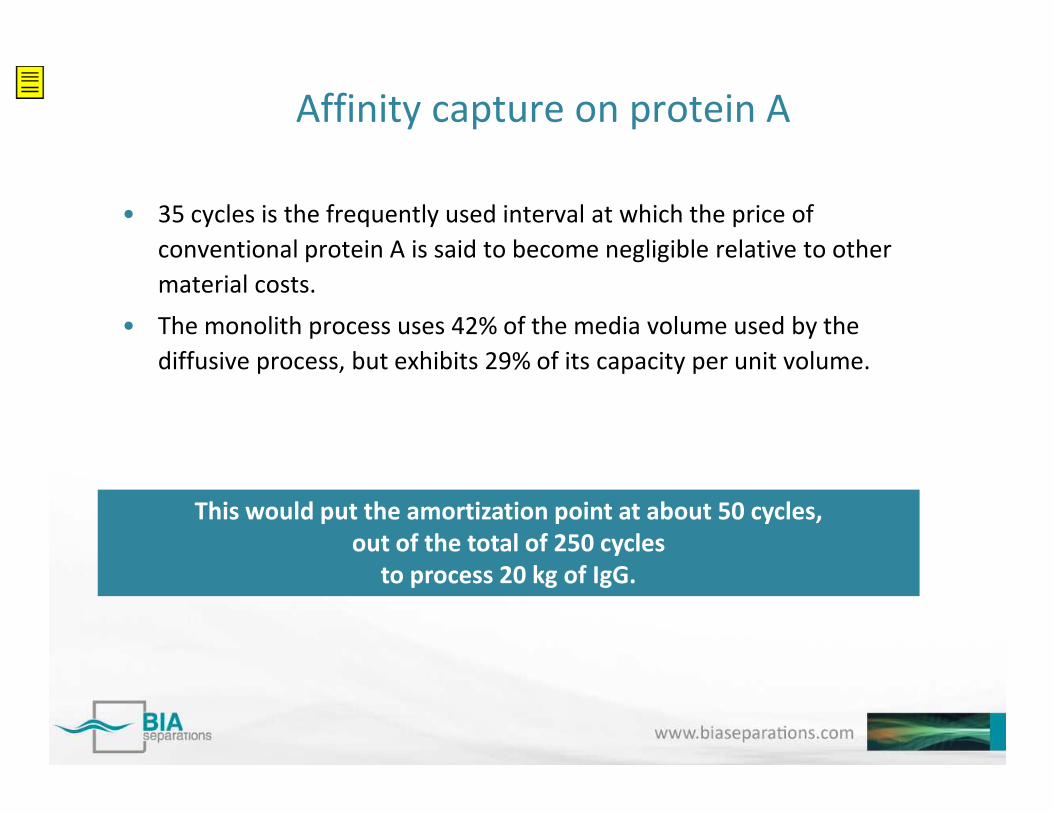
Affinity capture on protein A
• 35 cycles is the frequently used interval at which the price of conventional protein A is said to become negligible relative to other material costs.
• The monolith process uses 42% of the media volume used by the diffusive process, but exhibits 29% of its capacity per unit volume.
This would put the amortization point at about 50 cycles,out of the total of 250 cycles
to process 20 kg of IgG.
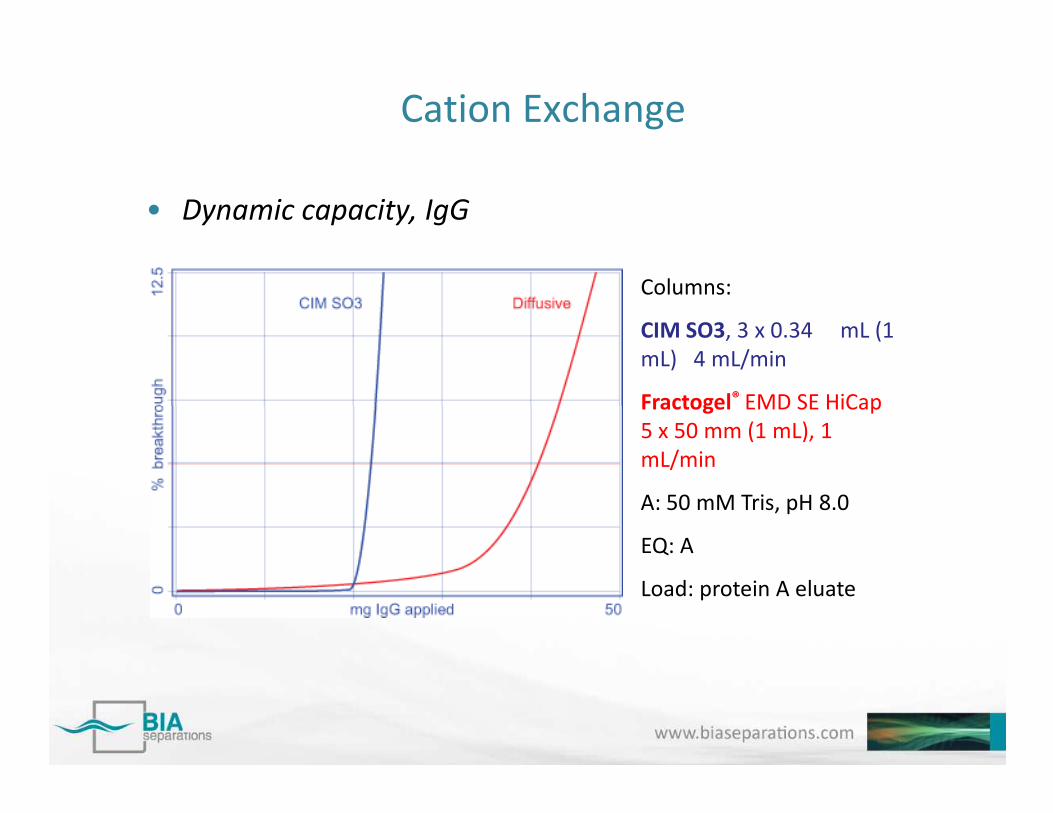
Cation Exchange
• Dynamic capacity, IgG
Columns:
CIM SO3, 3 x 0.34 mL (1 mL) 4 mL/min
Fractogel® EMD SE HiCapFractogel EMD SE HiCap5 x 50 mm (1 mL), 1 mL/min
A: 50 mM Tris, pH 8.0
EQ: A
Load: protein A eluate
Cation exchange
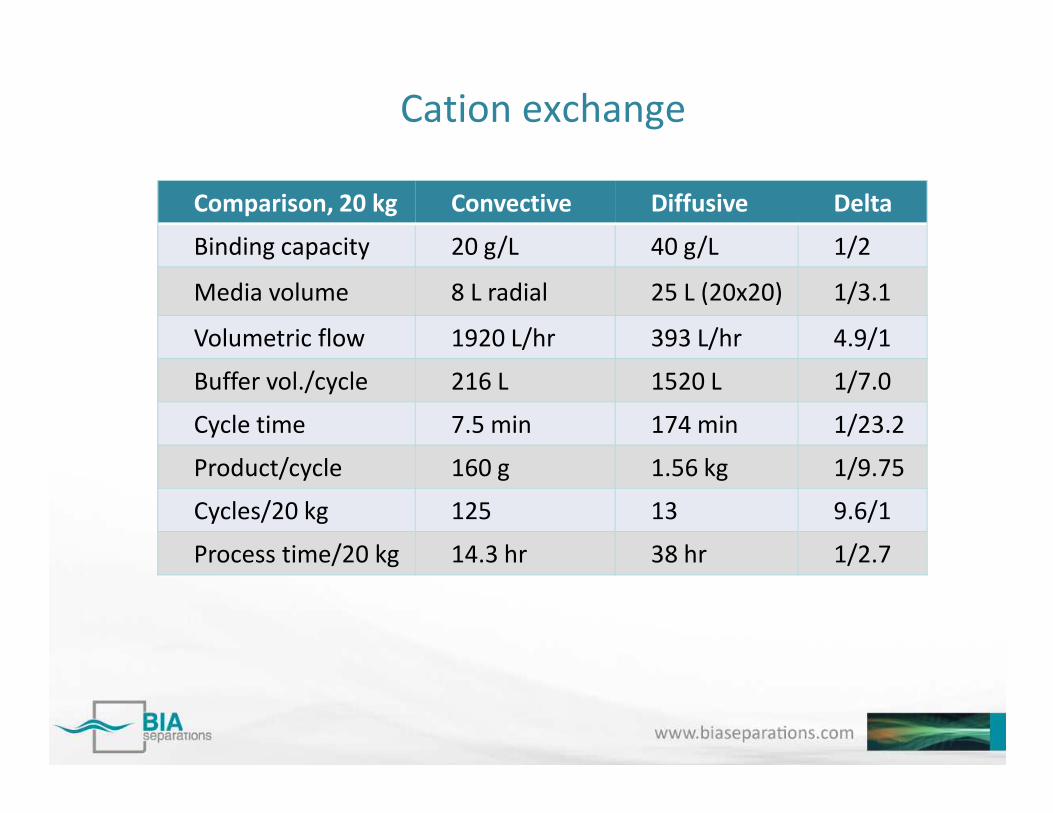
Comparison, 20 kg Convective Diffusive Delta
Binding capacity 20 g/L 40 g/L 1/2
Media volume 8 L radial 25 L (20x20) 1/3.1
Volumetric flow 1920 L/hr 393 L/hr 4.9/1
Buffer vol./cycle 216 L 1520 L 1/7.0
Cycle time 7.5 min 174 min 1/23.2
Product/cycle 160 g 1.56 kg 1/9.75
Cycles/20 kg 125 13 9.6/1
Process time/20 kg 14.3 hr 38 hr 1/2.7
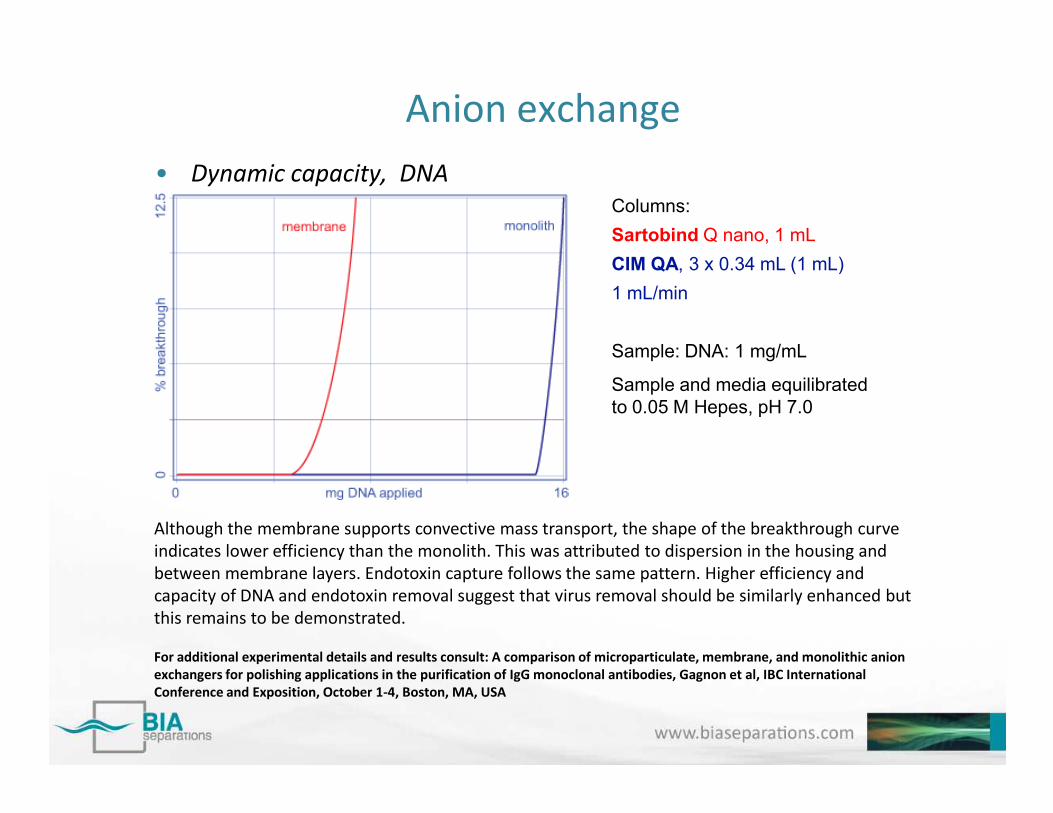
Anion exchange• Dynamic capacity, DNA
Columns:
Sartobind Q nano, 1 mL
CIM QA, 3 x 0.34 mL (1 mL)
1 mL/min
Sample: DNA: 1 mg/mL
Sample and media equilibrated to 0.05 M Hepes, pH 7.0
Although the membrane supports convective mass transport, the shape of the breakthrough curve indicates lower efficiency than the monolith. This was attributed to dispersion in the housing and between membrane layers. Endotoxin capture follows the same pattern. Higher efficiency and capacity of DNA and endotoxin removal suggest that virus removal should be similarly enhanced but this remains to be demonstrated.
For additional experimental details and results consult: A comparison of microparticulate, membrane, and monolithic anion exchangers for polishing applications in the purification of IgG monoclonal antibodies, Gagnon et al, IBC International Conference and Exposition, October 1-4, Boston, MA, USA
to 0.05 M Hepes, pH 7.0
Anion exchange
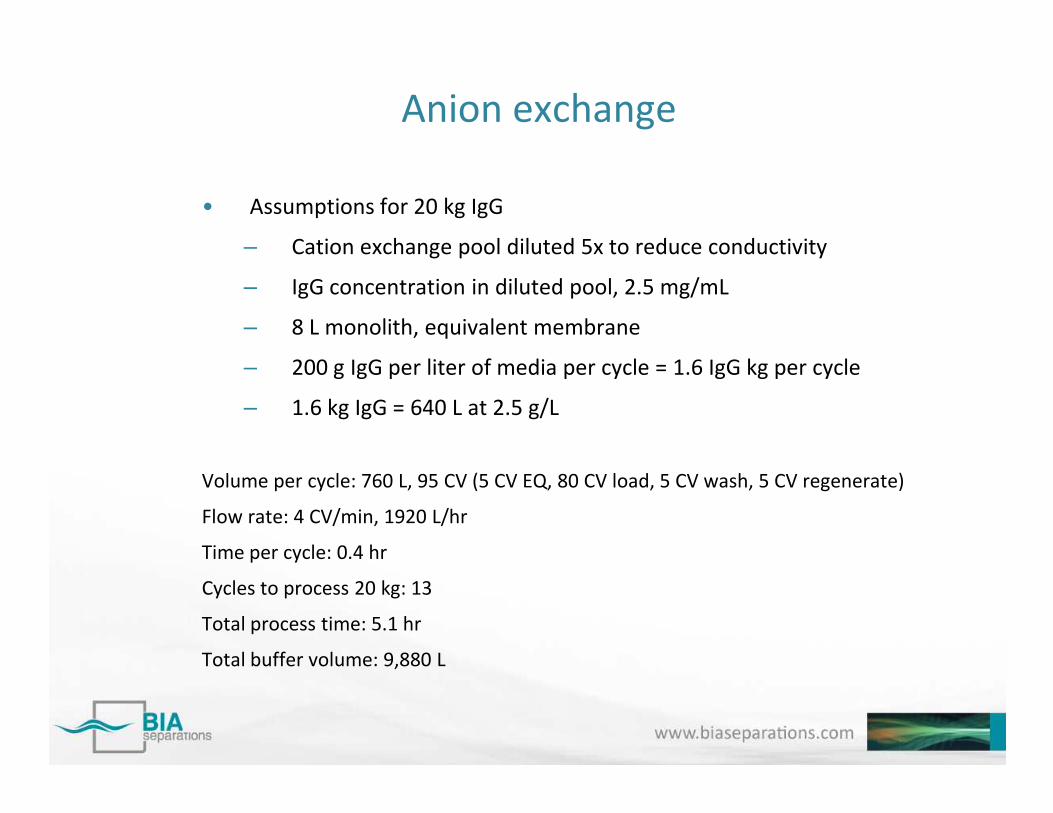
• Assumptions for 20 kg IgG
– Cation exchange pool diluted 5x to reduce conductivity
– IgG concentration in diluted pool, 2.5 mg/mL
– 8 L monolith, equivalent membrane
– 200 g IgG per liter of media per cycle = 1.6 IgG kg per cycle
– 1.6 kg IgG = 640 L at 2.5 g/L– 1.6 kg IgG = 640 L at 2.5 g/L
Volume per cycle: 760 L, 95 CV (5 CV EQ, 80 CV load, 5 CV wash, 5 CV regenerate)
Flow rate: 4 CV/min, 1920 L/hr
Time per cycle: 0.4 hr
Cycles to process 20 kg: 13
Total process time: 5.1 hr
Total buffer volume: 9,880 L
Process summary
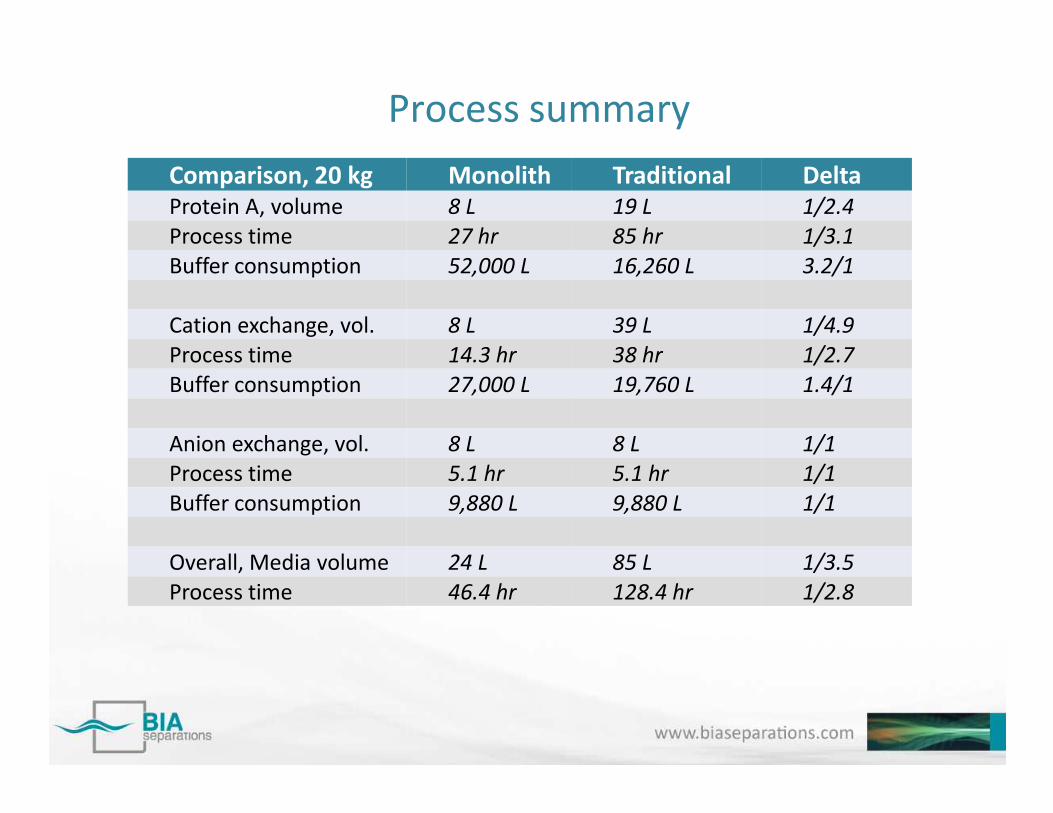
Comparison, 20 kg Monolith Traditional DeltaProtein A, volume 8 L 19 L 1/2.4Process time 27 hr 85 hr 1/3.1Buffer consumption 52,000 L 16,260 L 3.2/1
Cation exchange, vol. 8 L 39 L 1/4.9Process time 14.3 hr 38 hr 1/2.7Buffer consumption 27,000 L 19,760 L 1.4/1
Anion exchange, vol. 8 L 8 L 1/1Process time 5.1 hr 5.1 hr 1/1Buffer consumption 9,880 L 9,880 L 1/1
Overall, Media volume 24 L 85 L 1/3.5Process time 46.4 hr 128.4 hr 1/2.8

Conventional Batch Vs Monolith-SMB
Comparison, 50 kg Conventional Batch Monolith-SMB
Binding capacity 25 g/L 12.5/L
Media volume 160 L 80 L
Flow rate 1571 L/hr 4320 L/hr
Cycles 13 50
Process volume 62,400 L 60,480 L
Time 40 hr 14 hr
Conclusions
• Multiple cycles make it economically feasible to dispose of the used monoliths after processing a single antibody production lot. This suspend the need to develop and validate cleaning and sanitization procedures.
• Monoliths also eliminate column packing, removing a significant manufacturing expense and source of process variability. This benefit is compounded by the ability of monoliths to pass air without loss of chromatographic performance, and without repacking.
Conclusions• For the 3-step process modeled with a single 8 L
monolith at each step monoliths reduce process time nearly 3-fold (less than 2 days to process 20 kg of monoclonal IgG)
• Facility capacity triples.• Labor costs decrease in proportion.• ROI for the facility is accelerated.• ROI for the facility is accelerated.• Media costs are reduced• The protein A monolith is only 40% the volume of its
particle-based counterpart; the cation exchange monolith, only 20%.
• Monolith-SMB combination can further improve overall productivity and reduce COGS
Conclusions
• The speed of monoliths also invites consideration of alternative manufacturing strategies.
• An SMB array of 800 mL protein A monoliths could be accom-modated with existing industrial skids. It could be linked to a cation exchange monolith array via an intermediate viral inactivation loop.* intermediate viral inactivation loop.* The cation exchange array could be linked to an anion exchange monolith array.
• Such a system would allow continuous processing of more than 2 kg of fully purified antibody per day, without exposing the product to excessive hold times.
• *The idea of a viral inactivation loop in conjunction with SMB was suggested by Jorg Thommes.

Applications – Rapid IgM Quantitation with CIMac™ QA
IgM ApplicationDeveloped by: Pete Gagnon, Validated Biosystems, USA.
Poster entitled:
High Speed Monolithic Assays for IgM Quantitation in Cell Culture IgM Quantitation in Cell Culture Production and Purification Process Monitoring
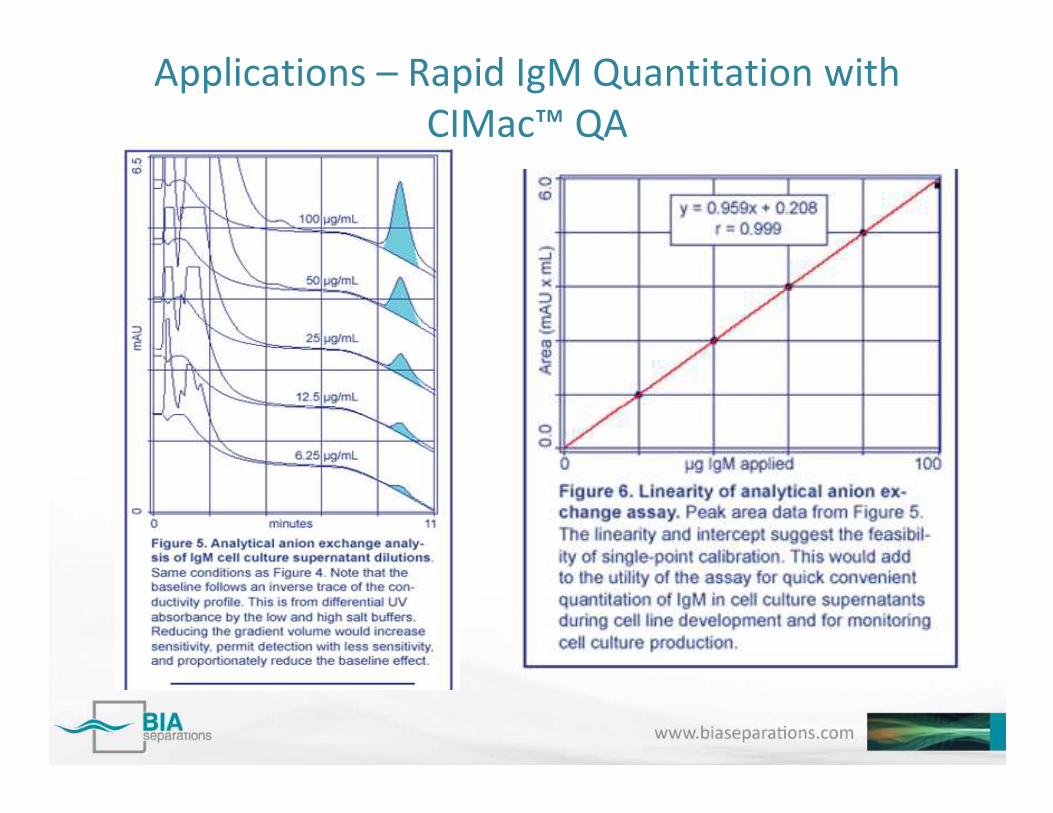
The utility of monolithic analytical columns for monitoring product and contaminant distribution in chromatography fractions. Data are obtained much faster than with conventional methods – PAGE or immunological assays. The sensitivity, accuracy, linearity and speed of the assay!
Applications – Rapid IgM Quantitation with CIMac™ QA
Conclusions
• Monoliths offer a unique set of characteristics that, when properly applied, can significantly improve the overall productivity of manufacturing processes
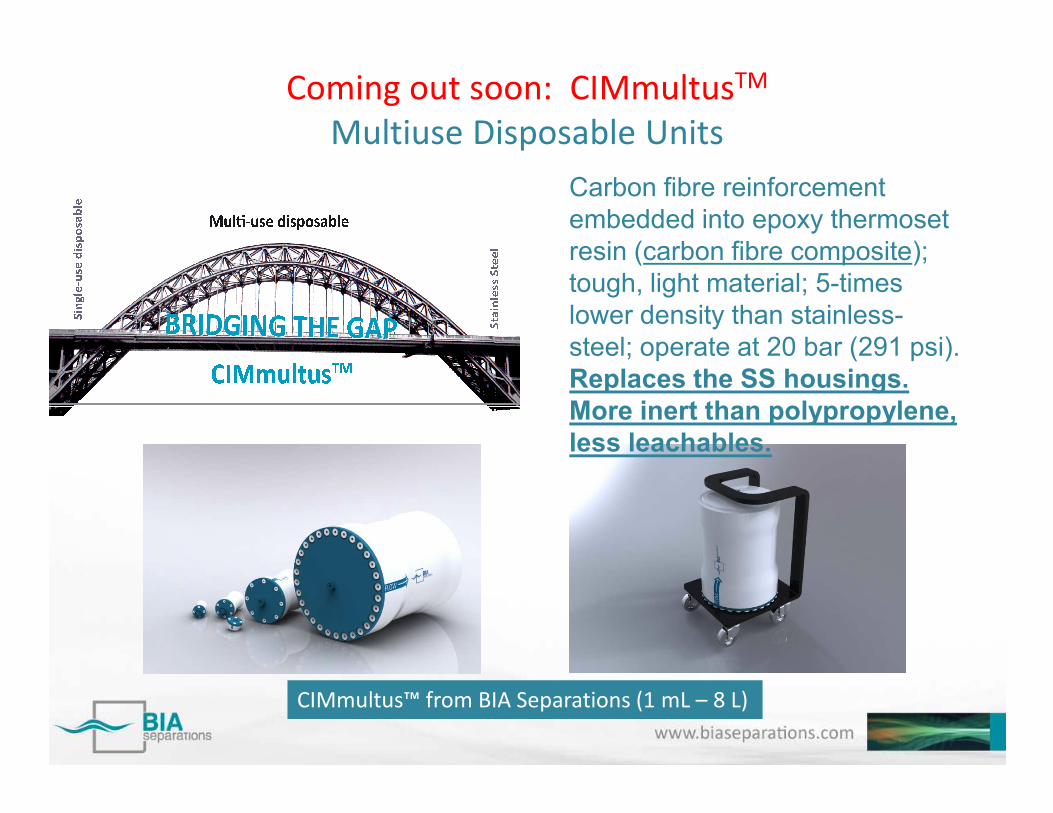
Coming out soon: CIMmultusTM
Multiuse Disposable UnitsCarbon fibre reinforcement embedded into epoxy thermoset resin (carbon fibre composite); tough, light material; 5-times lower density than stainless-steel; operate at 20 bar (291 psi). Replaces the SS housings. More inert than polypropylene,
CIMmultus™ from BIA Separations (1 mL – 8 L)
More inert than polypropylene, less leachables.
Send questions to:[email protected]

![Used plasmid DNA, [pDNA] = 0.2ug/uL Made two 1% Agarose Gel: 1 with EtBr & 1 without EtBr Prepared 6 samples of pDNA to be loaded in each gel with](https://img.pdfslide.us/doc/110x75/56649cef5503460f949bdced/-used-plasmid-dna-pdna-02ugul-made-two-1-agarose-gel-1-with.jpg)


![Plasmid DNA production at Boehringer Ingelheim BioXcellence™ · 2019-12-13 · Bl Bio)(cellence [mg pDNA/ g dry cell weight] 10 20 30 time [h] 40 50 105 90 75 60 45 30 15 60 —.—pDNA](https://img.pdfslide.us/doc/110x75/5e566a9873c0767ed44962f8/plasmid-dna-production-at-boehringer-ingelheim-bioxcellencea-2019-12-13-bl-biocellence.jpg)