Embed Size (px)
Citation preview
UCRL-ID-132135
Semivolatile Organic (GC-MS) and Inorganic Analyses of Groundwater Samples
During the Hydrous Pyrolysis/Oxidation (HPO) Field Test in Visalia, California, 1997
/
Roald N. Leif, Marina Chiarappa, Gene Kumamoto, Roger D. Aines, Robin L. Newmark, and Kevin G. Knauss
February 5,1998
.\ A
This is an informal report intended primarily for internal or limited external distribution. The opinions and conclusions stated are those of the author and may or may not be those of the Laboratory. Work performed under the auspices of the Department of Energy by the Lawrence Livermore National Laboratory under Contract W-7405Eng-48.
DISCLAIMER
This document was prepared as an account of work sponsored by an agency of the United States Government. Neither the United States Government nor the University of California nor any of their employees, makes any warranty, express or implied, or assumes any legal liability or rc?ponsibility for the accuracy, completeness, or usefulness of any information, apparatus, product, or process disclosed, or reprc?icnts that its use would not infringe privately owned rights. Reference herein to any specific commercial product, process, or service by trade name, trademark, manufacturer, or otherwise, does not necessarily constitute or imply its endorsement, recommendation, or favoring by the United States Government or the University of California. The views and opinions of authors expressed herein do not necessarily state or reflect those of the United States Government or the University of California, and shall not be used for advertising or product endorsement purposes.
UCRL-ID-I 32135
Semivolatile Organic (GC-MS) and Inorganic Analyses of Groundwater Samples
During the Hydrous Pyrolysis/Oxidation (HPO) Field Test in Visalia, California, 1997
Roald N. Leif Marina Chiarappa Gene Kumamoto
Roger D. Aines Robin L. Newmark Kevin G. Knauss
February 5,1998 v 2.1
Lawrence Livermore National Laboratory Livermore, California
Contents
Abstract ... ....................................................................................................................................................... 111
Introduction ................................................................................................................................................ 1 Analytical Methods .................................................................................................................................... 2
Sampling and Sample Preservation.. .............................................................................................. 2 Extraction ............................................................................................................................................ 2
Field Analyses .................................................................................................................................... 2
Laboratory Analyses ......................................................................................................................... 3
Results .......................................................................................................................................................... 4 Well MW-36.. ...................................................................................................................................... 5 Well S-13 .............................................................................................................................................. 6
Well S-12 ............................................................................................................................................. 7
Well S-14 ............................................................................................................................................. 7
Well S-15.. ............................................................................................................................................ 7 Miscellaneous Wells (MW-41, MW-44, EW-1, EW-2, EW-3, EW-5). .......................................... .8 Injection Well S-4 ............................................................................................................................... 8
Miscellaneous Water and Free Product.. ........................................................................................ 9 Discussion .................................................................................................................................................. 10 Conclusions ................................................................................................................................................ 13 Acknowledgments .................................................................................................................................... 14 References ................................................................................................................................................... 15 Figures ......................................................................................................................................................... 16 Appendix A: Chemical Structure Diagrams for the Semivolatile Organic Compounds
Quantitated by GC-MS.. ................................................................................................................. .36 Appendix B: Tables of Analytical Results of Samples ....................................................................... . 40
i
DA.FT DIC DNAPL DUS EPA EW FID GC-MS HP0 i.d. LLNL LNAPL MW PAH RIC SPE TIC UCM
Acronyms and Abbreviations dissolved-air flotation tank dissolved inorganic carbon dense, nonaqueous-phase liquid dynamic underground stripping U.S. Environmental Protection Agency extraction well flame ionization detector gas chromatography-mass spectrometry hydrous pyrolosis/oxidation internal diameter Lawrence Livermore National Laboratory light, nonaqueous-phase liquid monitoring well polycyclic aromatic hydrocarbons reconstructed ion chromatogram solid-phase extraction total inorganic carbon unresolved complex mixture
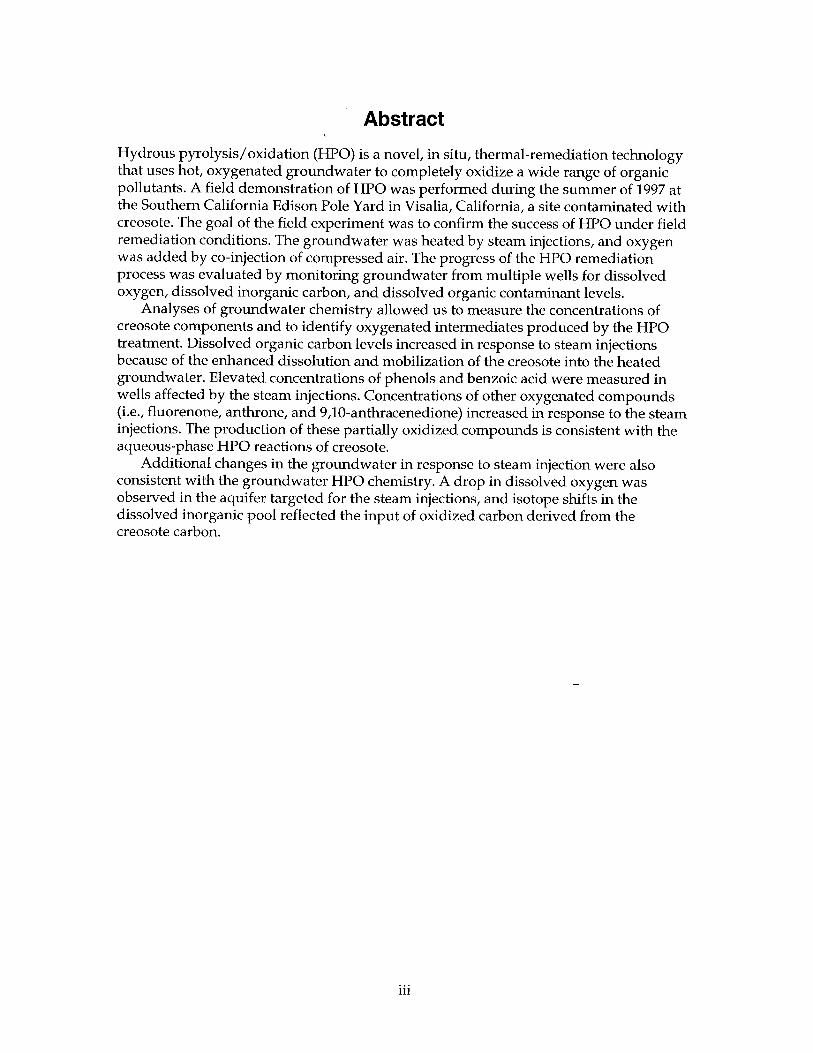
Abstract Hydrous pyrolysis/oxidation (HPO) is a novel, in situ, thermal-remediation technology that uses hot, oxygenated groundwater to completely oxidize a wide range of organic pollutants. A field demonstration of HP0 was performed during the summer of 1997 at the Southern California Edison Pole Yard in Visalia, California, a site contaminated with creosote. The goal of the field experiment was to confirm the success of HP0 under field remediation conditions. The groundwater was heated by steam injections, and oxygen was added by co-injection of compressed air. The progress of the HP0 remediation process was evaluated by monitoring groundwater from multiple wells for dissolved oxygen, dissolved inorganic carbon, and dissolved organic contaminant levels.
Analyses of groundwater chemistry allowed us to measure the concentrations of creosote components and to identify oxygenated intermediates produced by the HP0 treatment. Dissolved organic carbon levels increased in response to steam injections because of the enhanced dissolution and mobilization of the creosote into the heated groundwater. Elevated concentrations of phenols and benzoic acid were measured in wells affected by the steam injections. Concentrations of other oxygenated compounds (i.e., fluorenone, anthrone, and 9,10-anthracenedione) increased in response to the steam injections. The production of these partially oxidized compounds is consistent with the aqueous-phase HP0 reactions of creosote.
Additional changes in the groundwater in response to steam injection were also consistent with the groundwater HP0 chemistry. A drop in dissolved oxygen was observed in the aquifer targeted for the steam injections, and isotope shifts in the dissolved inorganic pool reflected the input of oxidized carbon derived from the creosote carbon.
. . . 111
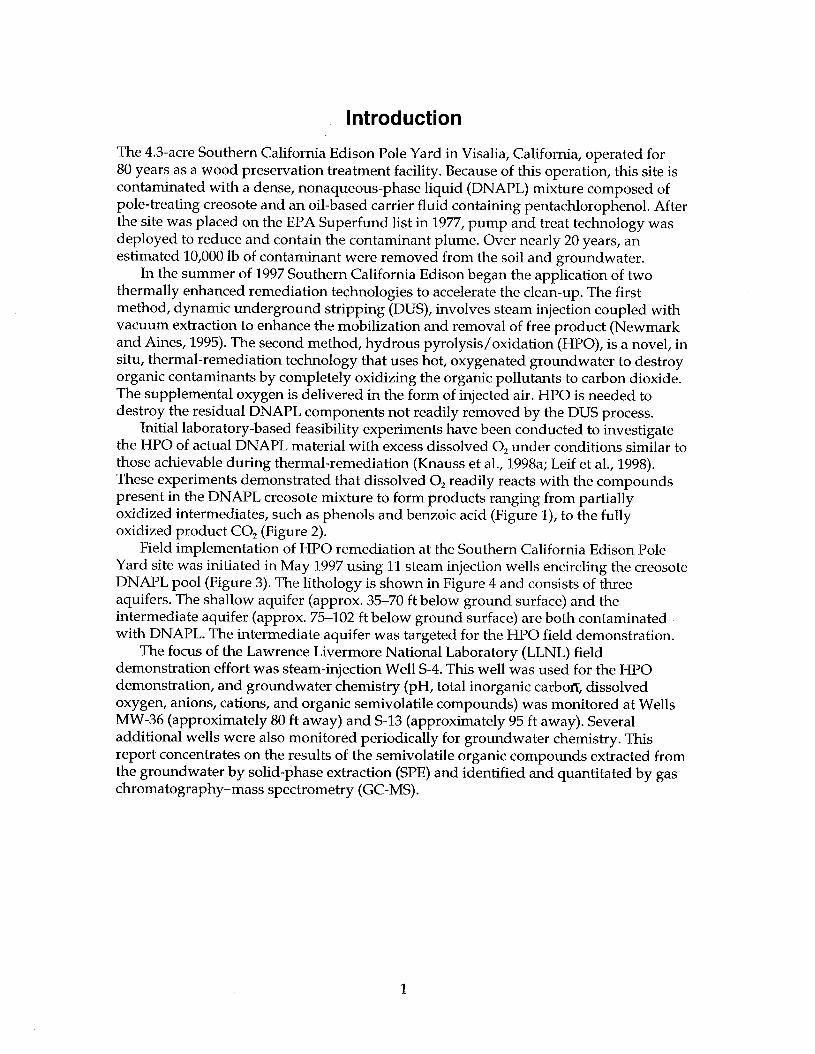
Introduction The 4.3-acre Southern California Edison Pole Yard in Visalia, California, operated for 80 years as a wood preservation treatment facility. Because of this operation, this site is contaminated with a dense, nonaqueous-phase liquid (DNAPL) mixture composed of pole-treating creosote and an oil-based carrier fluid containing pentachlorophenol. After the site was placed on the EPA Superfund list in 1977, pump and treat technology was deployed to reduce and contain the contaminant plume. Over nearly 20 years, an estimated 10,000 lb of contaminant were removed from the soil and groundwater.
In the summer of 1997 Southern California Edison began the application of two thermally enhanced remediation technologies to accelerate the clean-up. The first method, dynamic underground stripping (DUS), involves steam injection coupled with vacuum extraction to enhance the mobilization and removal of free product (Newmark and Aines, 1995). The second method, hydrous pyrolysis/oxidation (HPO), is a novel, in situ, thermal-remediation technology that uses hot, oxygenated groundwater to destroy organic contaminants by completely oxidizing the organic pollutants to carbon dioxide. The supplemental oxygen is delivered in the form of injected air. HP0 is needed to destroy the residual DNAPL components not readily removed by the DUS process.
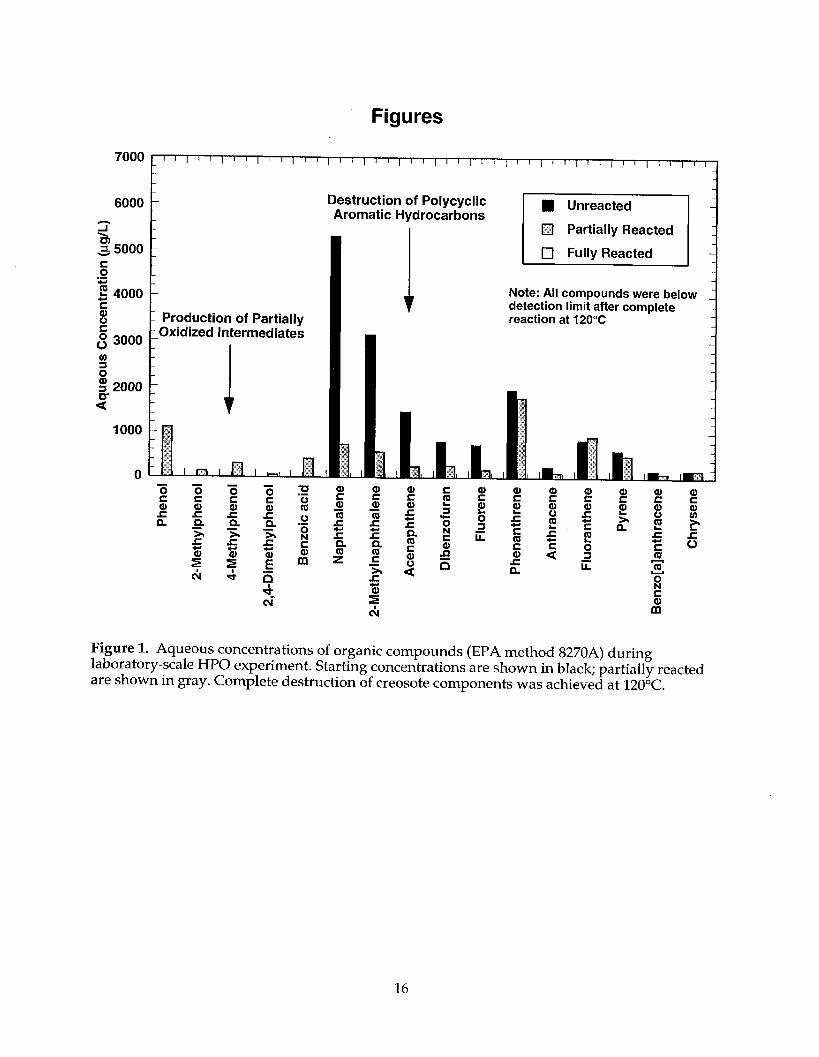
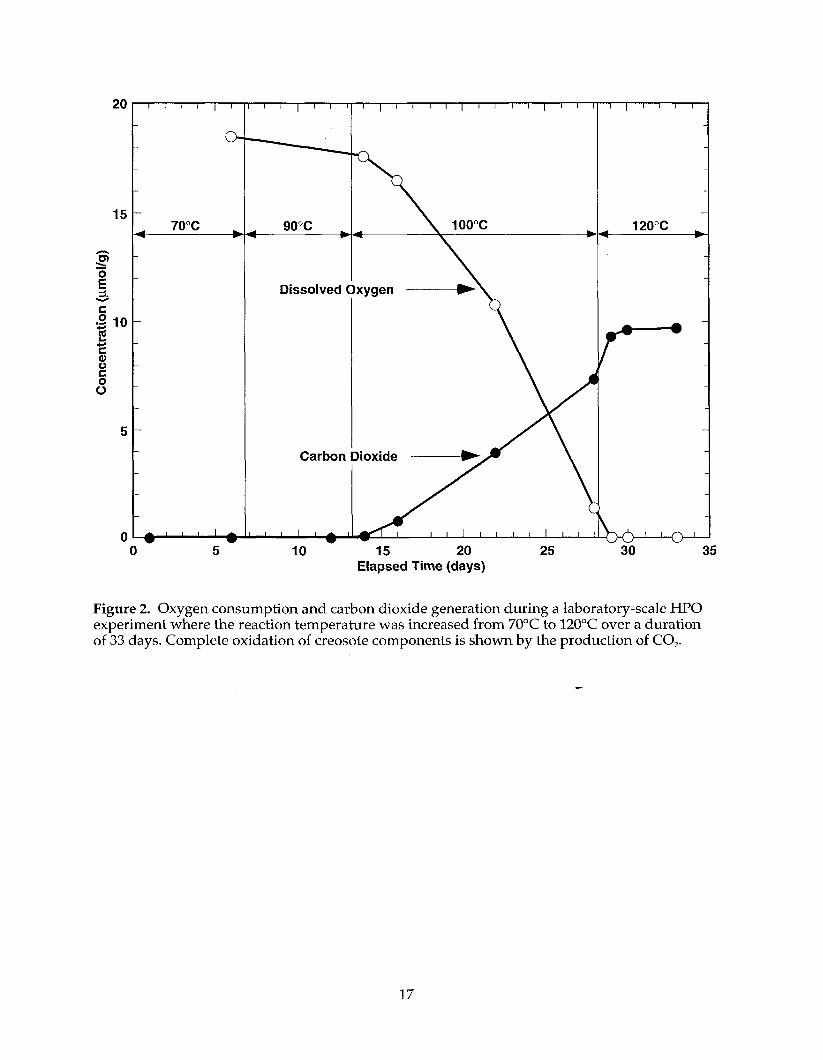
Initial laboratory-based feasibility experiments have been conducted to investigate the HP0 of actual DNAPL material with excess dissolved 0, under conditions similar to those achievable during thermal-remediation (Knauss et al., 1998a; Leif et al., 1998). These experiments demonstrated that dissolved 0, readily reacts with the compounds present in the DNAPL creosote mixture to form products ranging from partially oxidized intermediates, such as phenols and benzoic acid (Figure 1), to the fully oxidized product CO, (Figure 2).
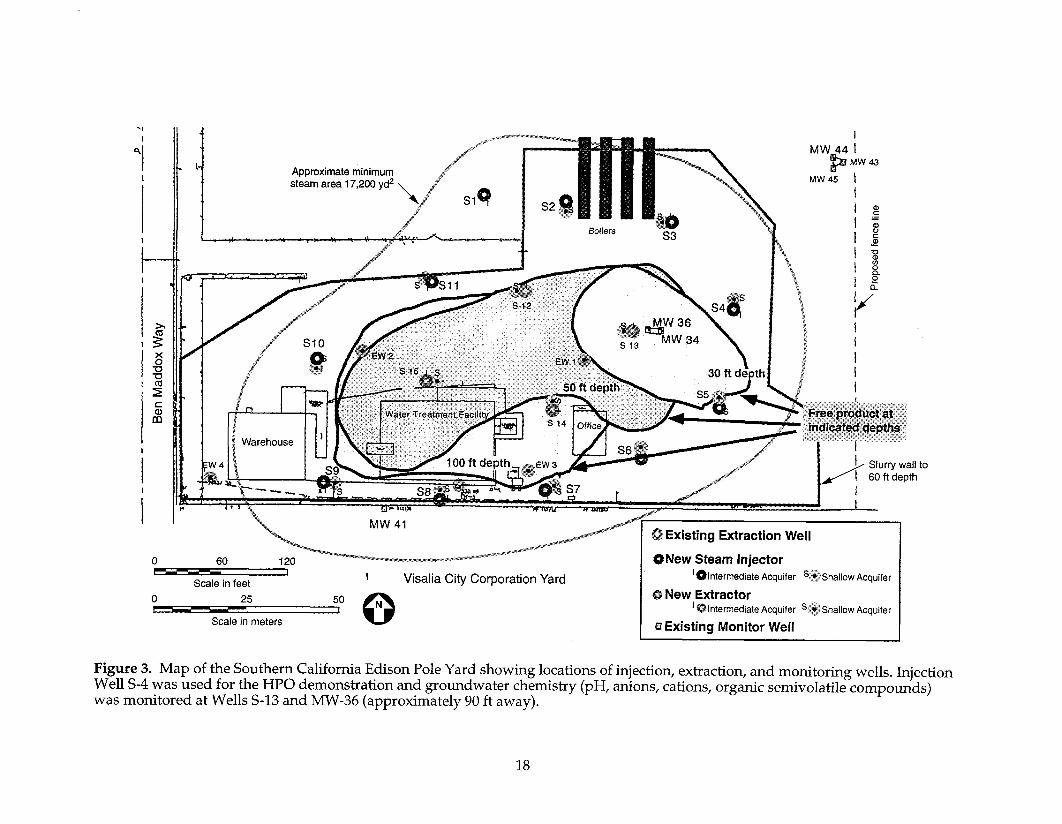
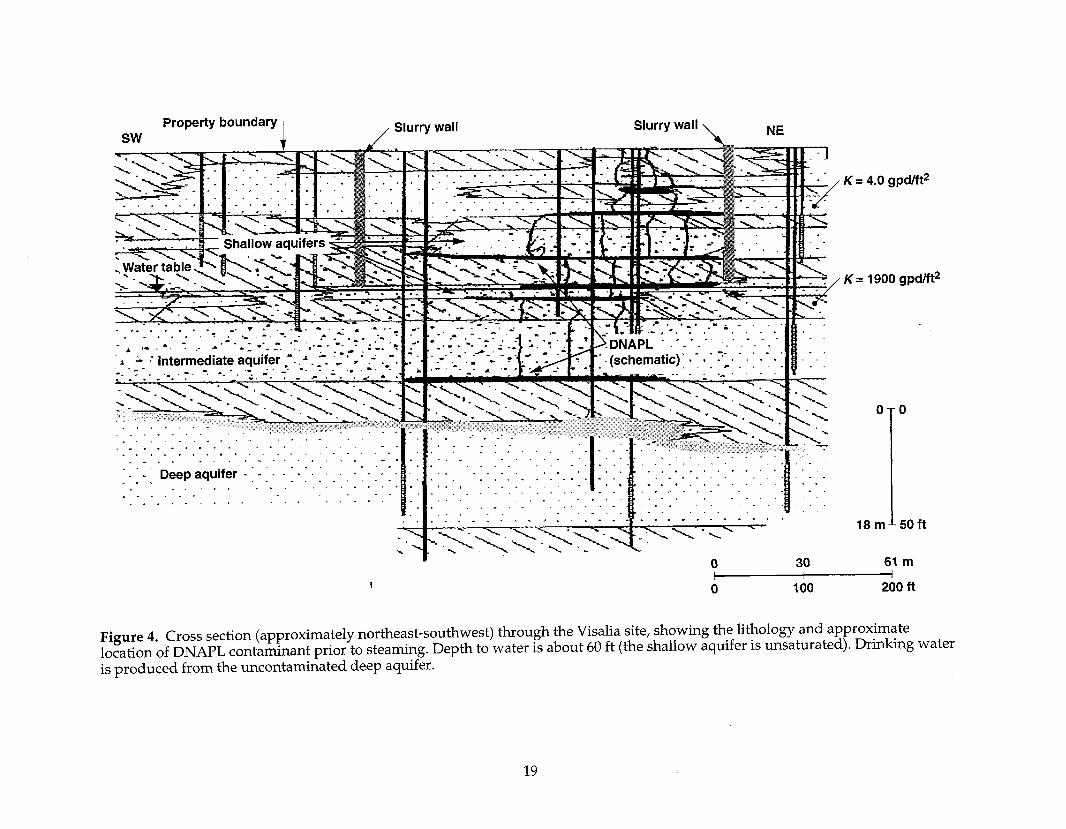
Field implementation of HP0 remediation at the Southern California Edison Pole Yard site was initiated in May 1997 using 11 steam injection wells encircling the creosote DNAPL pool (Figure 3). The lithology is shown in Figure 4 and consists of three aquifers. The shallow aquifer (approx. 35-70 ft below ground surface) and the intermediate aquifer (approx. 75-102 ft below ground surface) are both contaminated with DNAPL. The intermediate aquifer was targeted for the HP0 field demonstration.
The focus of the Lawrence Livermore National Laboratory (LLNL) field demonstration effort was steam-injection Well S-4. This well was used for the HP0 demonstration, and groundwater chemistry (pH, total inorganic carbon, dissolved oxygen, anions, cations, and organic semivolatile compounds) was monitored at Wells MW-36 (approximately 80 ft away) and S-13 (approximately 95 ft away). Several additional wells were also monitored periodically for groundwater chemistry. This report concentrates on the results of the semivolatile organic compounds extracted from the groundwater by solid-phase extraction (SPE) and identified and quantitated by gas chromatography-mass spectrometry (GC-MS).

Analytical Methods
Sampling and Sample Preservation Water samples for inorganic and organic analyses were taken at several monitoring and extraction wells on the Southern California Edison Pole Yard complex. Each sampling event involved collecting water samples for both inorganic and organic analyses. Water samples were collected in the following sample containers: water samples for pH were collected in certified 40-mL VOA vials (I-Chem) and filled to eliminate any headspace; samples for total inorganic carbon (TIC) and anions were collected in 4-mL screw-cap vials and filled to eliminate any headspace; water for cations were collected in 500-mL Nalgene bottles (high density polyethylene with polypropylene screw closure); water samples for semivolatile organic analyses by extraction and concentration using SPE cartridges were taken in certified clean l-liter borosilicate amber bottles with TeflonTM- lined caps; water samples for field liquid-liquid extraction were collected in 500-mL volumetric flasks. Samples for cation analysis were acidified to pH <2 with concentrated nitric acid, and water samples for both SPE extraction and field liquid-liquid extraction were acidified to pH <2 with hydrochloric acid. An attempt was made to keep samples refrigerated until analysis.
Extraction Liquid-Liquid Extraction. Water samples taken in the 500-mL volumetric flasks were allowed to come to ambient temperature and volume adjusted to 500 mL. To this flask was added 2.0 mL of hexane containing an internal standard (2-bromonaphthalene at 200 pg/mL), and the flask was inverted several times and shaken for a duration of 1 minute to standardize the field extraction method.
Solid-Phase Extraction (SPE). Priority pollutants were extracted and concentrated by SPE prior to analysis by GC and GC-MS. Typically a water sample ranging in volume from 1 to 4 liters was flowed by positive pressure through an SPE cartridge packed with 200 mg of ENV+ (International Sorbent Technology), a highly crosslinked styrene- divinylbenzene resin suitable for extraction of nonpolar and polar compounds from water. After sample extraction, the SPE tubes were dried and eluted with 4.5 mL of a dichloromethane/isopropanol mixture (1:l). Sample bottles were also eluted with this solvent mix (1:l) to extract organic compounds adsorbed to the glass. All extracts were spiked with a six-component internal-standard mix.
Field Analyses Measurement of PH. The water samples taken for pH were allowed to come to ambient temperature before analysis. The measurement of pH was performed using a Sentron 2001 pH meter employing a hydrogen-ion-sensitive ion-selective field effect transistor (ISFET) with automatic temperature compensation. Calibration of the meter was done at the beginning of each day using pH standard solutions (pH 4 and pH 7) and checked before each measurement using the pH 7 buffer solution.
Gas Chromatography. Field measurements of the total organic hexane extract were performed on an SRI 9300 gas chromatograph, equipped with a flame ionization detector (FID) in tandem with a dry electrolytic conductivity detector (ELCD). Compounds were injected on-column and separated on an MXT-5 Restek 15-m mega-
2
bore (0.53 mm i.d.) capillary column. The temperature was programmed from 40°C (initial hold time 1.0 min) to 200°C at lO”C/min. Helium was used as the carrier gas. Data were acquired and integrated using SRI PeakSimple software. Quantitation for total organic carbon for components amenable to gas chromatographic analyses was calculated relative to the internal standard using a response factor of 1.0. Results of these analyses are presented elsewhere (Chiarappa et al., 1998).
Laboratory Analyses Gas Chromatography. Laboratory analyses of the organic extracts were conducted on a Hewlett-Packard 5890 Series II gas chromatograph equipped with an FID and an HP 7673 automatic sampler. Compounds were injected in splitless mode on a 30-m (0.53 mm i.d.) fused silica capillary column coated with methylpolysiloxane (DB-5, J & W Scientific; film thickness 0.5 pm). Instrument temperature was increased from 60°C (initial hold time 2 min) to 270°C at lIL”C/min. Helium was used as the carrier gas. Data were acquired and integrated using the HP Series II Chemstation software. Results of these analyses are presented elsewhere (Chiarappa et al., 1998).
Gas chromatography-mass spectrometry. Gas chromatography-mass spectrometry (GC-MS) analyses of the SPE extracts were performed on a Hewlett Packard 6890 gas chromatograph equipped with a 30 m x 0.25 mm i.d. HP-5ms (5% phenyl methyl- siloxane) capillary column (0.25 pm film thickness) coupled to a Hewlett Packard 6890 Series Mass Selective Detector, operated in electron impact mode (70 eV) over the mass range 35450 dalton with a cycle time of 1.1 s. The GC oven temperature was programmed at isothermal for 2 min at 5O”C, increasing by S”C/min to 3OO”C, and isothermal for 6.75 min, with the injector at 250°C and helium as the carrier gas. The MS data were processed using Hewlett Packard Chemstation software. Internal standard method, using relative response factors, was used to quantitate the target compounds. Target compounds quantitated for this study are listed in Appendix A.
Total Inorganic Carbon. TIC analyses were obtained using an 01 Model 524 analyzer. A weighed sample was injected into a purge vessel containing a 25% phosphoric acid solution, which was continuously purged with nitrogen gas. The dissolved inorganic carbon converted to CO, and was swept into a nondispersive infrared detector, where measurement of total inorganic carbon was made.
Anions. Anion concentrations were determined using a Hewlett Packard 1090M HPLC coupled to a Waters 431 conductivity detector. Data were processed using an on- line Hewlett Packard personal computer with Chemstation software. -
Cations. Cation analysis was done by the Analytical Chemistry Section at LLNL using inductively-coupled plasma atomic emission spectrometry (ICI’-AES).
Quality Assurance. A series of quality control and monitoring steps were followed during the field test. The major steps included field and laboratory blank tests, solvent tests to monitor for possible contaminants, and recovery experiments for a large set of representative polar and nonpolar standard compounds.
Results
The field experiment at the Visalia Pole Yard involved injections of steam and steam with compressed air into the intermediate aquifer from injection Well S-4. The effects of the steaming operation were monitored by sampling the intermediate aquifer using Wells MW-36 and S13, located approximately 90 ft away. Wells MW-36 and S13 were the two sampling wells regularly sampled to assess the progress of the steam injection experiments. Therefore, the water chemistry data for organic analyses were primarily from these two wells.
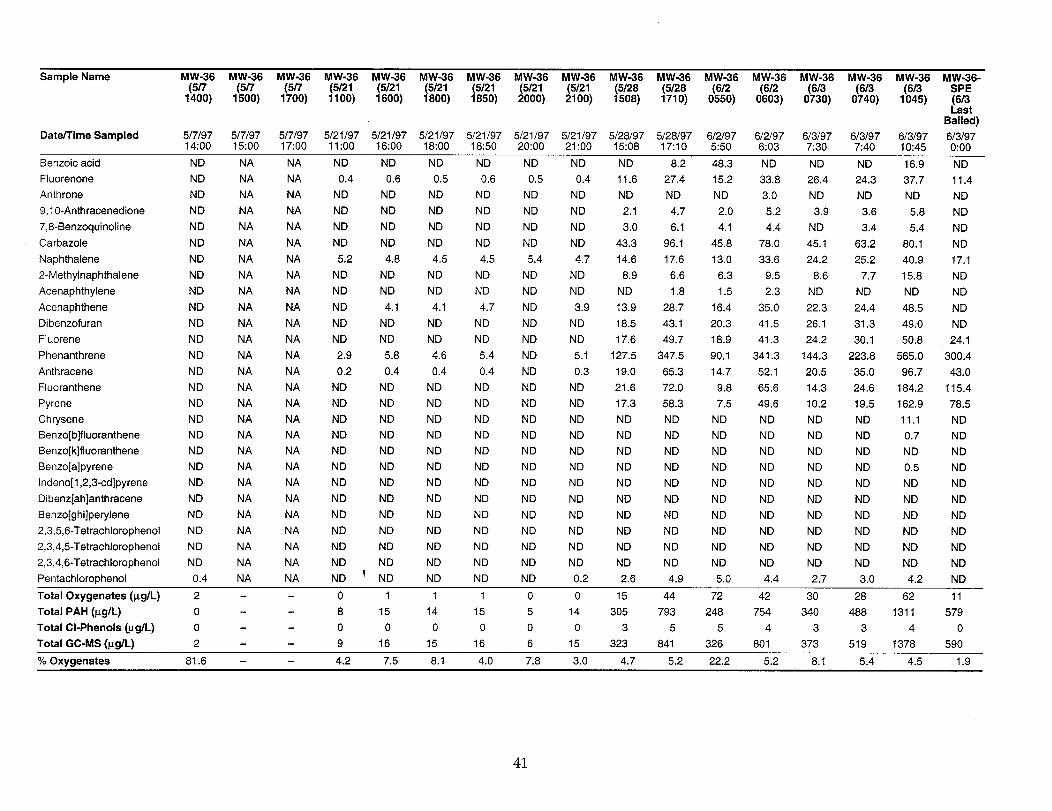
In addition to these two wells, water samples were periodically collected from S-12, S-14, S-15, MW-41, MW-44, EW-1, EW-2, EW-3, and EW-5. Two water samples of condensed steam from the steam injection Well S-4 were also collected and analyzed by GC-MS. Some miscellaneous water samples and free product samples were collected from venting wellheads or the treatment facility. One sample of creosote free product collected in 1996 was analyzed for comparison purposes. These samples were diluted in solvent and analyzed by GC-MS. The list of semivolatile organic target compounds quantitated during this study was derived from EPA Method 8270C and consisted primarily of polycyclic aromatic hydrocarbons (PAH) and phenols. This target compound list was expanded to include all three tetrachlorophenol isomers, three additional oxygenated compounds (fluorenone, anthrone, and 9,10-anthracenedione), and two nitrogen-containing PAH compounds (carbazole and 7,8-benzoquinoline). The analytical results of the GC-MS analyses are listed in Appendix B. Summarized at the bottom of each table in Appendix B are the following:
l Total Oxygenates (l&L): Sum of non-chlorinated phenols in EPA 8270C list plus benzoic acid, fluorenone, anthrone, and 9,10-anthracenedione
l Total PAH (l~g/L): Sum of PAH in EPA 8270C list (including dibenzofuran) plus nitrogen-containing PAH (carbazole and 7,8-benzoquinoline)
l Total Cl-Phenols (l&L): Sum of three tetrachlorophenol isomers and pentachlorophenol
l Total GC-MS (l&L): Sum of all compounds in entire expanded EPA 8270C target compound list
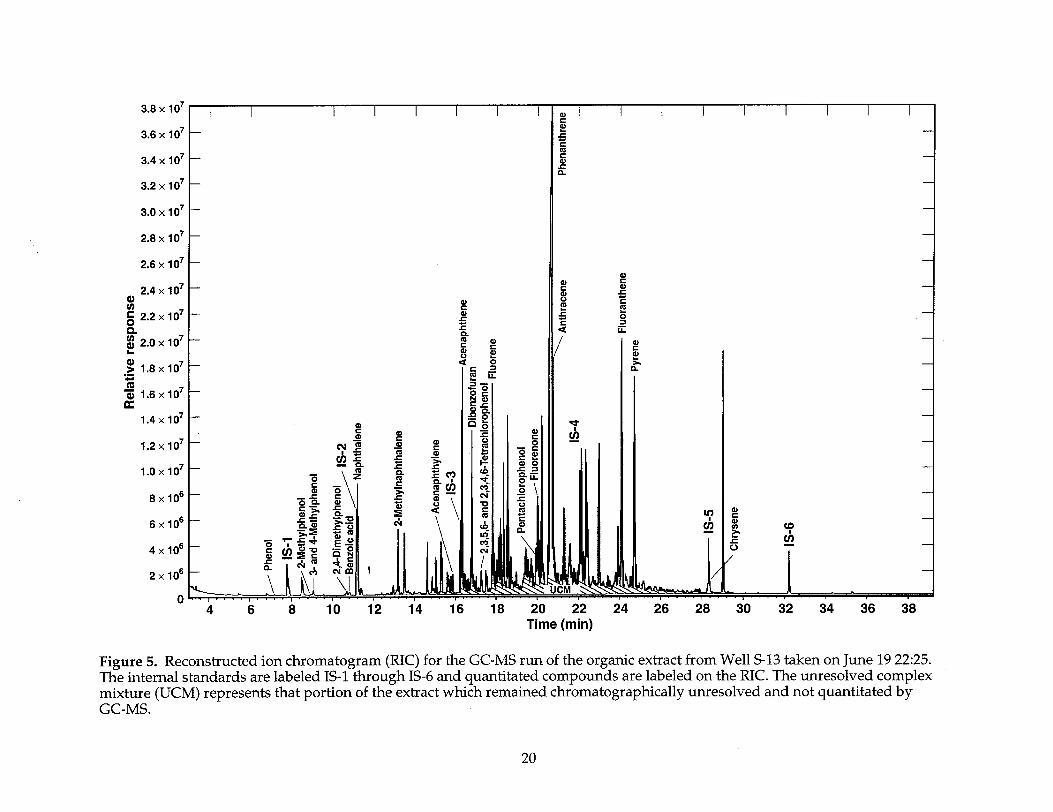
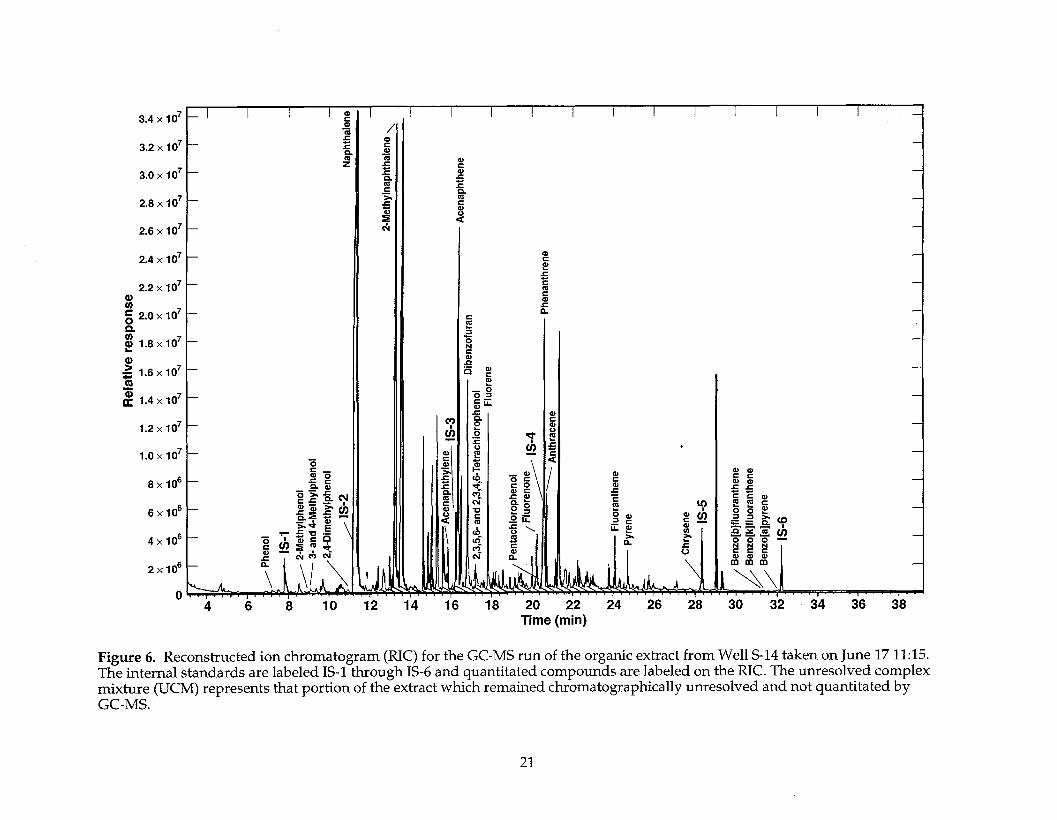
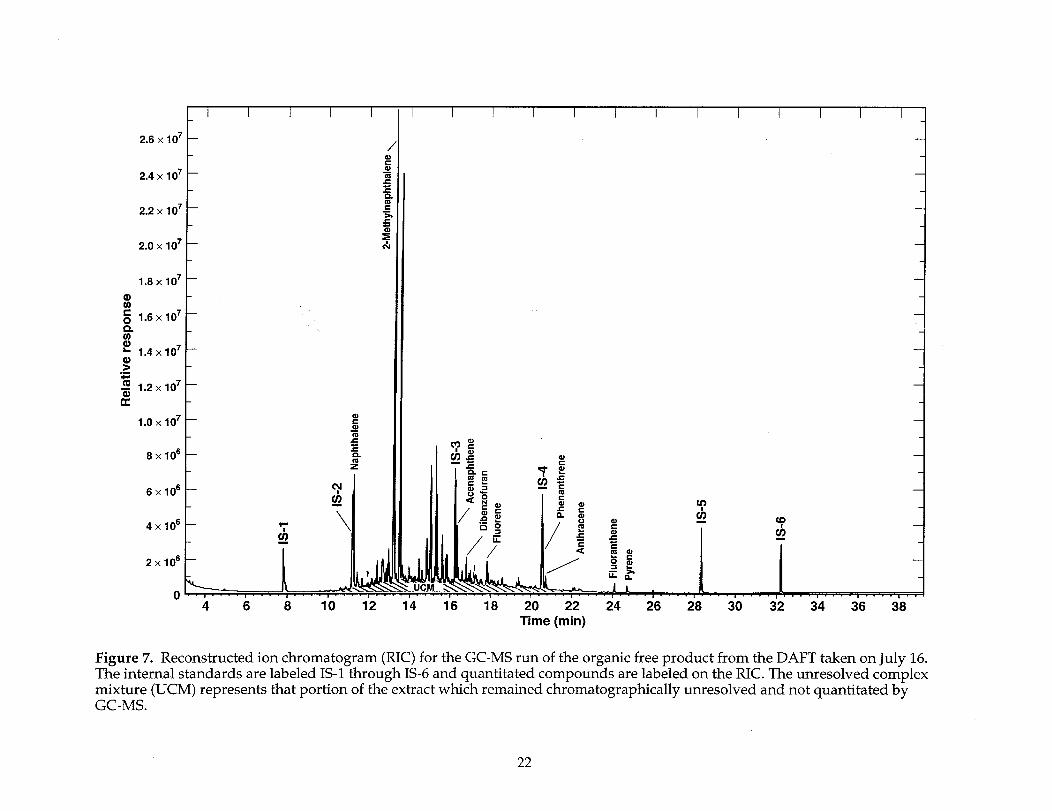
Although Total GC-MS @g/L) is a sum of all target compounds, it does not represent the total amount of organic contaminants extracted from the water samples amenable by gas chromatography. The Total GC-MS @g/L) value represents a sum of those compounds listed in the EPA Method 8270C plus those compounds included in the expanded analyte list discussed above. This point can be illustrated by examining three examples of the raw GC-MS data and quantitation results. Figure 5 and Figure 6 are representative reconstructed ion chromatograms (RIC) for the GC-MS runs of the organic extracts from Wells S-13 (June 19 22:25) and S-14 (June 17 11:15), respectively. Figure 7 is the RIC for a sample of free product collected from the dissolved-air flotation tank (DAFT) on July 16; y is abundance and x is time. These three chromatograms represent abundances of the target analytes (labeled) relative to the six internal standards (labeled IS-l through IS-6). From these three figures it is apparent that many compounds were not quantitated and, for some samples, a significant portion of the extracted organic compounds has remained chromatographically unresolved and unquantitated in the unresolved complex mixture (UCM). For example, the total amount of organic compounds quantitated by GC-MS using this target compound list for the
4
DAFT (July 16) free product sample accounts for 16% of the sample mass. The remain- ing, unquantitated portion consists of alkylated PAH (i.e., di- and trimethylnaphthyl- enes) and compounds which make up the UCM. Therefore, the Total GC-MS value is a sum of the compounds in the target compound list and represents a portion of the total organics amenable by GC and quantitated by a flame ionization detector (FID). A complete discussion of the results of GC-FID is presented by Chiarappa et al. (1998).
For simplicity in the results and discussion sections, the PAH compounds have been further subdivided by molecular weight into three groups; low molecular weight PAH (two-ring PAH, i.e., naphthalene and 2-methylnaphthalene), intermediate molecular weight PAH (three-ring PAH, i.e., acenaphthene, fluorene, and phenanthrene), and high molecular weight PAH (four- and five-ring PAH, i.e., fluoranthene, pyrene, chrysene,’ benzo(b)fluoranthene, benzo(k)fluoranthene, and benzo(a)pyrene). This classification aids in the general description of the distribution of the organic compounds present in the water samples.
The analyses quantitated by GC-MS were compounds whose positive identifications were confirmed by GC retention time match and mass spectral match with a standard mixture made up of pure compounds at known concentrations (Hale and Aneiro, 1997). The oxygenated compounds in the analyte list, although possibly present in the creosote-contaminated soil as minor compounds, could also be formed during HP0 and may be representative of partially oxidized PAH compounds. The complete GC-MS results are presented in Appendix B, Tables l-9. A brief description of the results from each well follows.
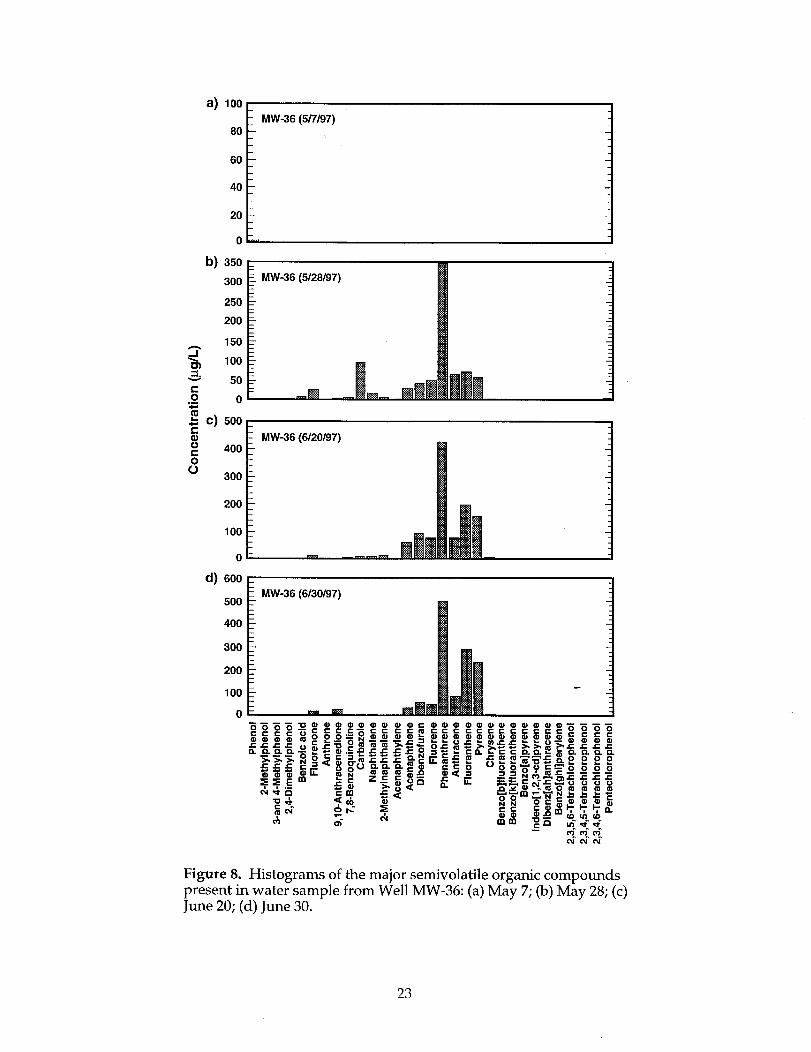
Well MW-36 Table 1 lists the results of the groundwater analyses from Well MW-36. This well was sampled for groundwater organic pollutants on May 7 to obtain a baseline sample representative of groundwater before the injection of steam and was found to be clean of organic contaminants.
The first injection of steam into S-4 began on May 21 and lasted until May 23. Six samples were collected during this period and analyzed for TIC and semivolatile organics before the pump temporarily failed on May 22. This set of samples represents groundwater that has been displaced by the growing steam zone. Total semivolatile organic analyses for these six samples were low, with an average total semivolatile organic level of approximately 12 ppb, and exhibited no trends in organic contaminant levels as a function of time.
Ten samples were taken for semivolatile organic analyses from May 28 to June 4. During this time organic-compound levels were increased substantially over the earlier samples. The water sample of May 28 1710 had PAH components ranging from naphthalene (molecular weight 128) to pyrene (molecular weight 202), with the most abundant being phenanthrene (molecular weight 178) at a concentration of 350 ppb. Some oxygenated compounds were present, and a total oxygenate concentration of 44 ppb was quantitated. The most abundant oxygenate was fluorenone at a concen- tration of 27 ppb. Eight water samples taken from June 2 to June 4 exhibited large variabilities in concentrations of groundwater organics. Difficulties were encountered during this period with the pump installed in the well; some of the large variations in organic concentrations may have been due to these operational difficulties and not to actual groundwater fluctuations. But it was obvious that the levels of PAH and oxygenates in these water samples were still elevated and similar in composition to the May 28 17~10 sample discussed above. The average total oxygenate concentration was
5
41 ppb, with benzoic acid and fluorenone being the most abundant oxygenated compounds present. The average total PAH concentration was 650 ppb for these three samples, with phenanthrene being the most abundant single PAH component.
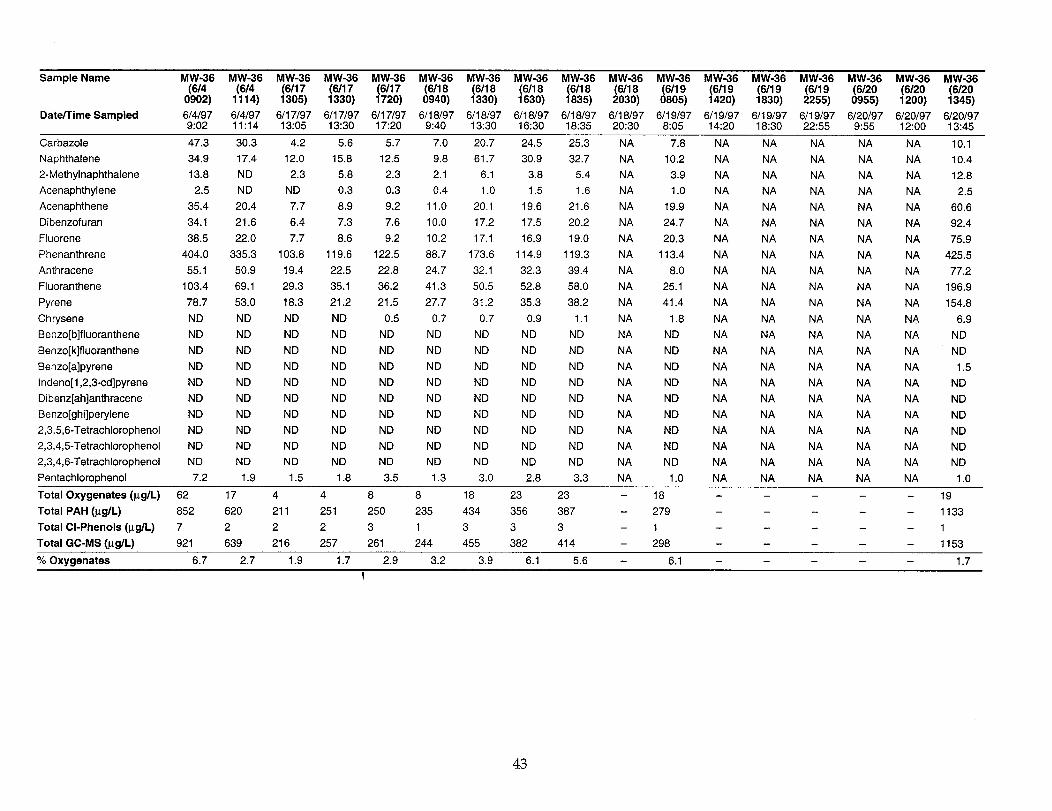
A total of 13 water samples were extracted and analyzed by GC-MS from June 17 to June 30. This sample set covers the time when steam and compressed air were injected into S-4 (June 17-20). The earliest sample taken on June 17 had total organics at approximately 200 ppb. The levels of organics in MW-36 did not change much until June 20, when the total organic level increased to > 1000 ppb, and it peaked at 2300 ppb on June 26, approximately one week after the steam/compressed-air injection. The level of total oxygenates also peaked at 55 ppb approximately one week after the injection. Fluorenone, 9,10-anthracenedione, and benzoic acid were the most abundant oxygenated compounds.
The four histograms in Figure 8 show how the relative abundances of the target analytes changed over time. As stated above, the pre-steam baseline sample was clean of semivolatile compounds. From May 28 to the end of sampling on June 30, the most abundant compound was phenanthrene, but over this time there was a relative increase in the higher molecular weight PAH compounds (i.e., fluoranthene and pyrene).
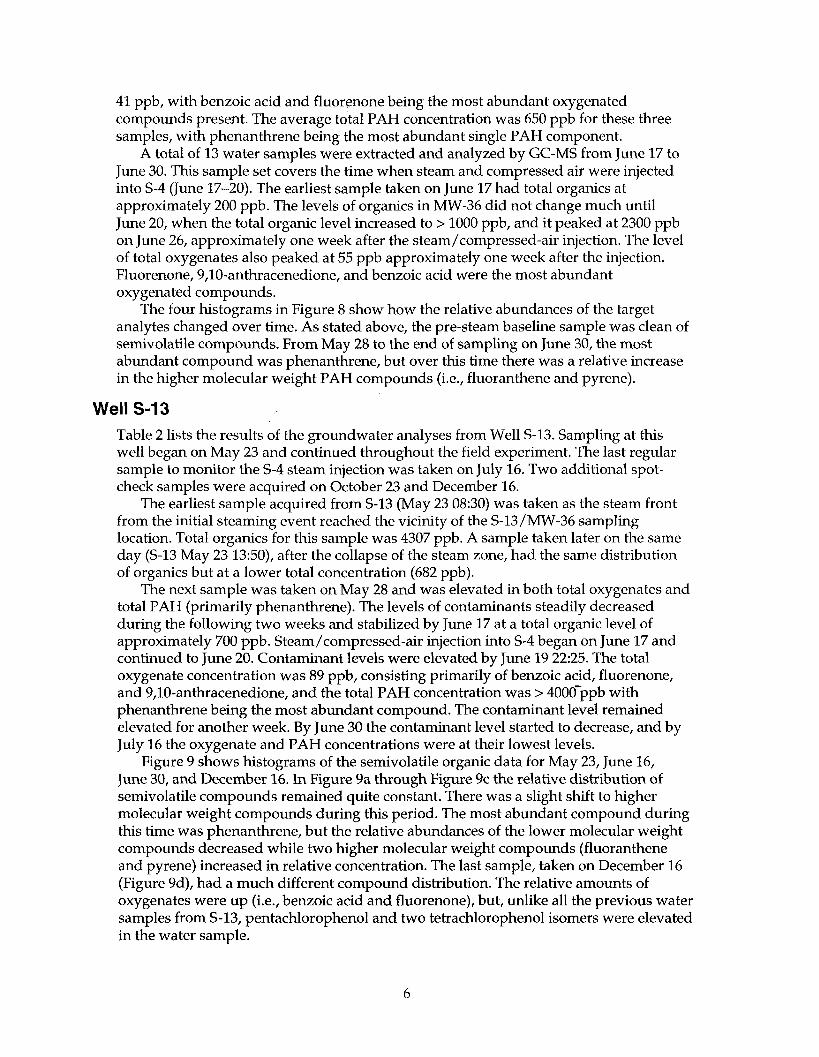
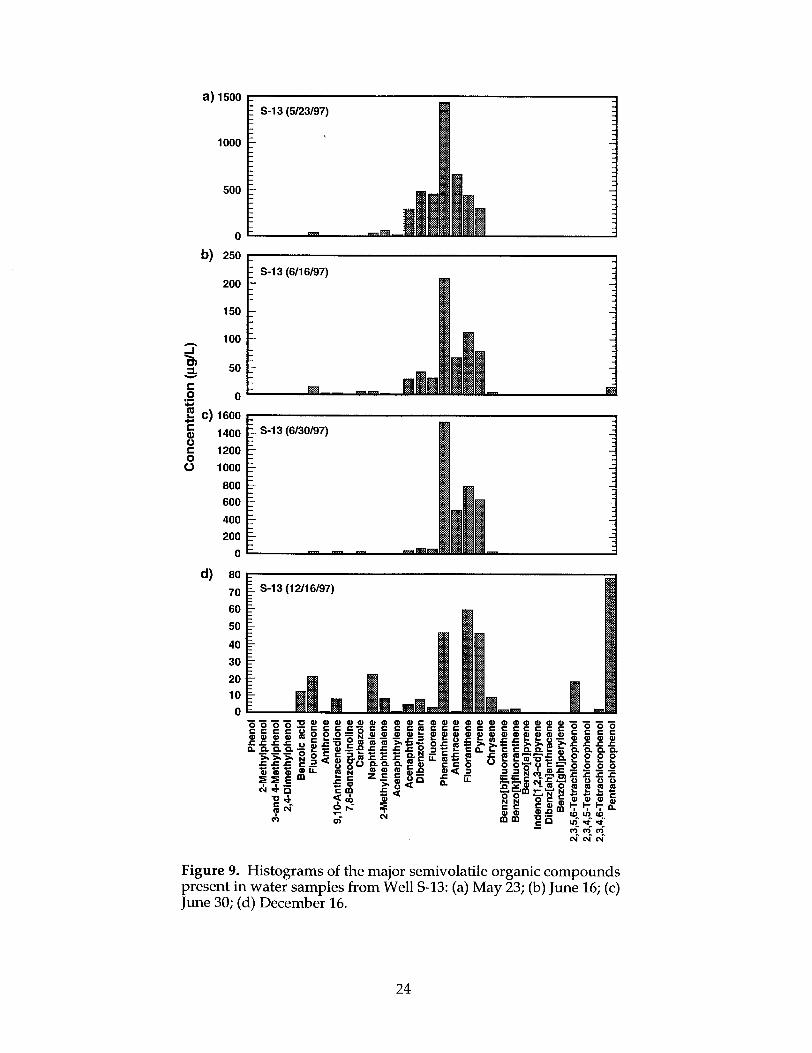
Well S-13 Table 2 lists the results of the groundwater analyses from Well S-13. Sampling at this well began on May 23 and continued throughout the field experiment. The last regular sample to monitor the S-4 steam injection was taken on July 16. Two additional spot- check samples were acquired on October 23 and December 16.
The earliest sample acquired from S-13 (May 23 08:30) was taken as the steam front from the initial steaming event reached the vicinity of the S-13/MW-36 sampling location. Total organics for this sample was 4307 ppb. A sample taken later on the same day (S-13 May 23 13:50), after the collapse of the steam zone, had the same distribution of organics but at a lower total concentration (682 ppb).
The next sample was taken on May 28 and was elevated in both total oxygenates and total PAH (primarily phenanthrene). The levels of contaminants steadily decreased during the following two weeks and stabilized by June 17 at a total organic level of approximately 700 ppb. Steam/compressed-air injection into S-4 began on June 17 and continued to June 20. Contaminant levels were elevated by June 19 22:25. The total oxygenate concentration was 89 ppb, consisting primarily of benzoic acid, fluorenone, and 9,10-anthracenedione, and the total PAH concentration was > 4000-ppb with phenanthrene being the most abundant compound. The contaminant level remained elevated for another week. By June 30 the contaminant level started to decrease, and by July 16 the oxygenate and PAH concentrations were at their lowest levels.
Figure 9 shows histograms of the semivolatile organic data for May 23, June 16, June 30, and December 16. Ln Figure 9a through Figure 9c the relative distribution of semivolatile compounds remained quite constant. There was a slight shift to higher molecular weight compounds during this period. The most abundant compound during this time was phenanthrene, but the relative abundances of the lower molecular weight compounds decreased while two higher molecular weight compounds (fluoranthene and pyrene) increased in relative concentration. The last sample, taken on December 16 (Figure 9d), had a much different compound distribution. The relative amounts of oxygenates were up (i.e., benzoic acid and fluorenone), but, unlike all the previous water samples from S-13, pentachlorophenol and two tetrachlorophenol isomers were elevated in the water sample.
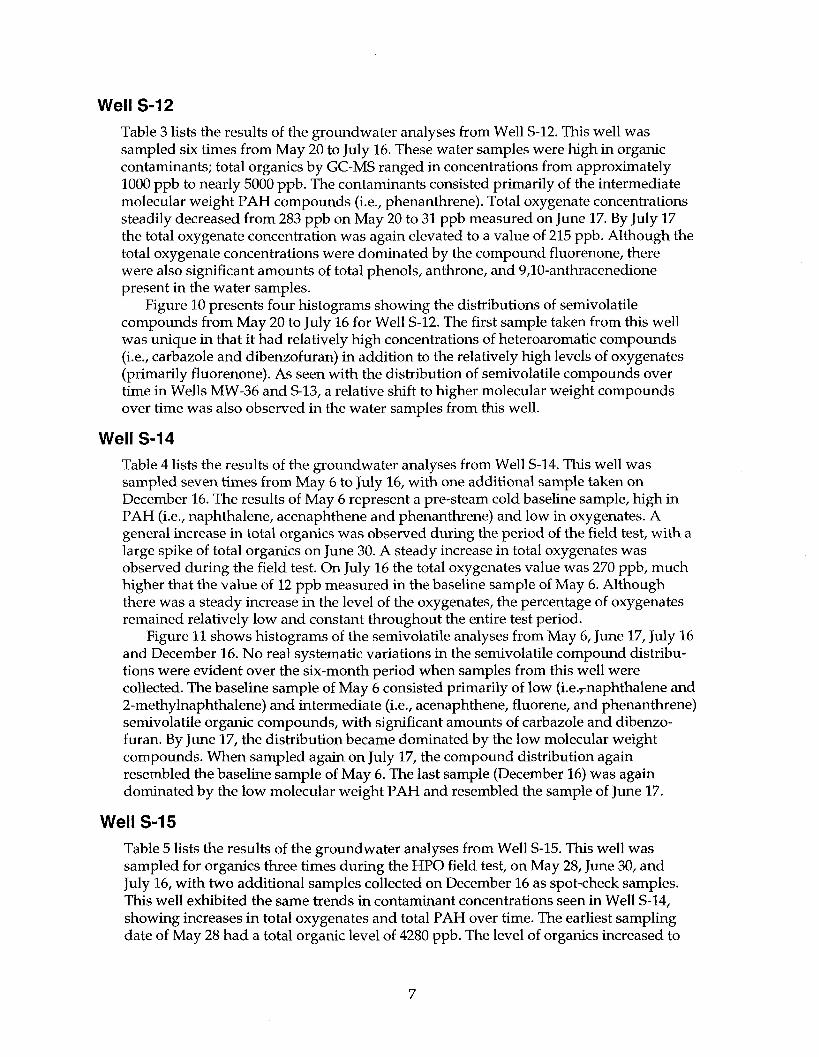
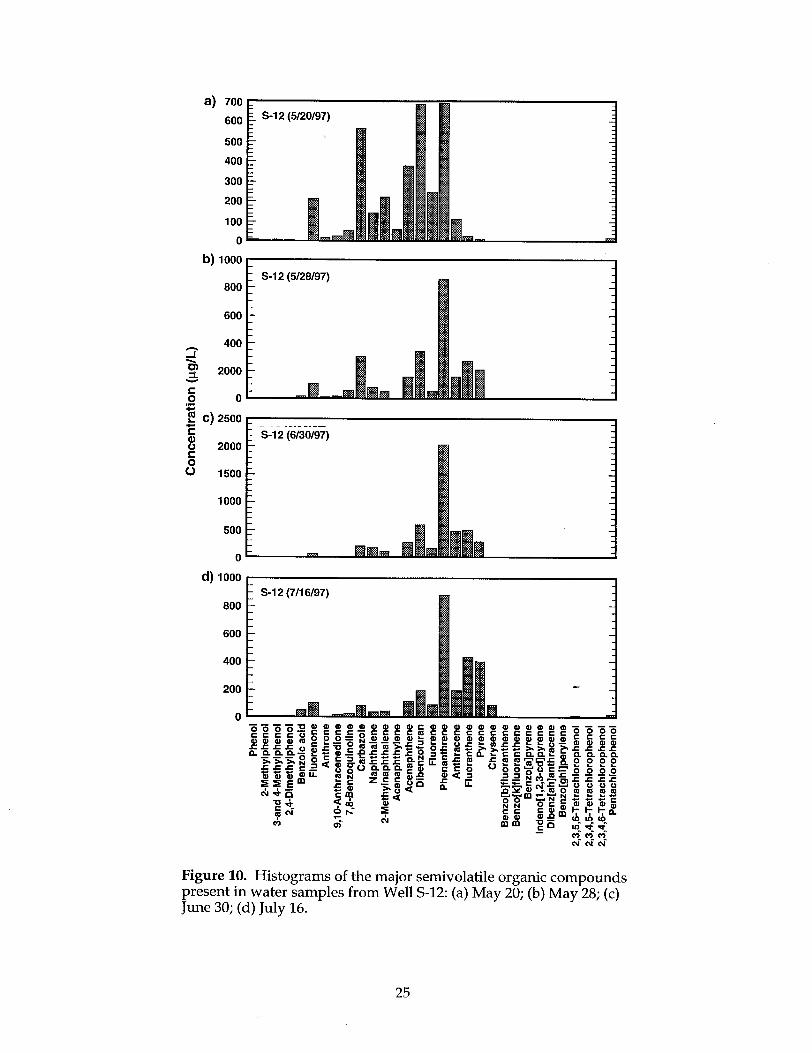
Well S-12 Table 3 lists the results of the groundwater analyses from Well S-12. This well was sampled six times from May 20 to July 16. These water samples were high in organic contaminants; total organics by GC-MS ranged in concentrations from approximately 1000 ppb to nearly 5000 ppb. The contaminants consisted primarily of the intermediate molecular weight PAH compounds (i.e., phenanthrene). Total oxygenate concentrations steadily decreased from 283 ppb on May 20 to 31 ppb measured on June 17. By July 17 the total oxygenate concentration was again elevated to a value of 215 ppb. Although the total oxygenate concentrations were dominated by the compound fluorenone, there were also significant amounts of total phenols, anthrone, and 9,10-anthracenedione present in the water samples.
Figure 10 presents four histograms showing the distributions of semivolatile compounds from May 20 to July 16 for Well S-12. The first sample taken from this well was unique in that it had relatively high concentrations of heteroaromatic compounds (i.e., carbazole and dibenzofuran) in addition to the relatively high levels of oxygenates (primarily fluorenone). As seen with the distribution of semivolatile compounds over time in Wells MW-36 and S13, a relative shift to higher molecular weight compounds over time was also observed in the water samples from this well.
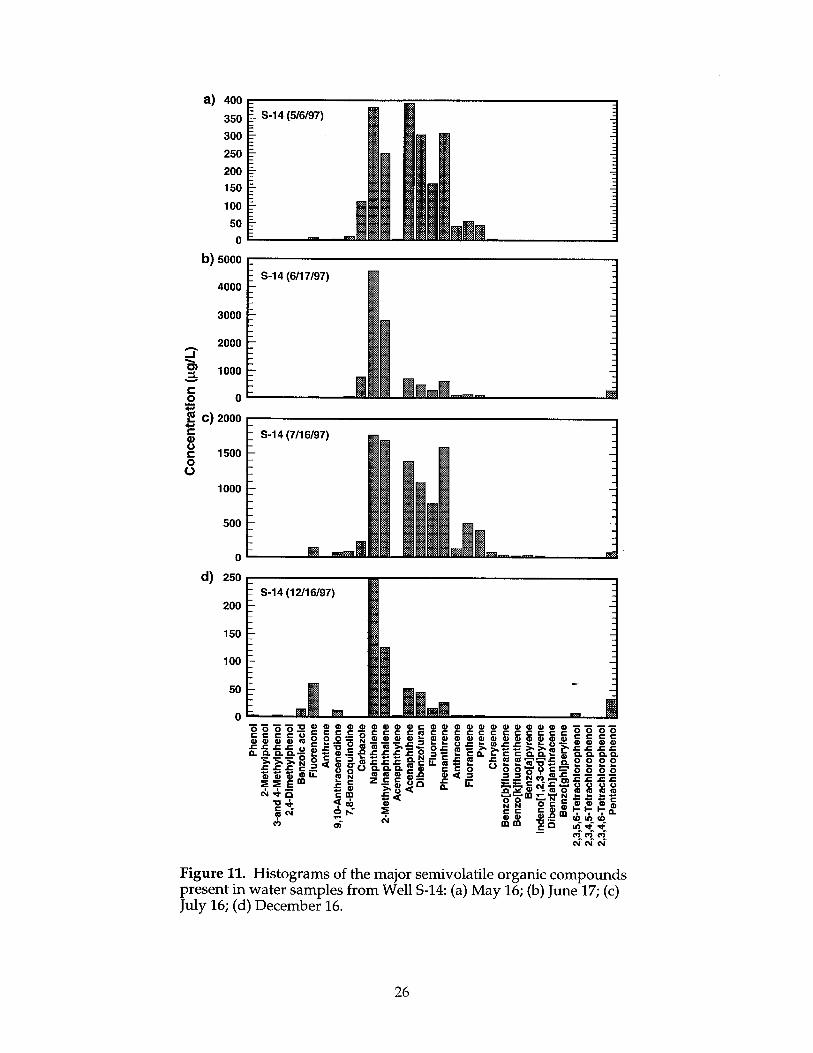
Well S-14 Table 4 lists the results of the groundwater analyses from Well S-14. This well was sampled seven times from May 6 to July 16, with one additional sample taken on December 16. The results of May 6 represent a pre-steam cold baseline sample, high in PAH (i.e., naphthalene, acenaphthene and phenanthrene) and low in oxygenates. A general increase in total organics was observed during the period of the field test, with a large spike of total organics on June 30. A steady increase in total oxygenates was observed during the field test. On July 16 the total oxygenates value was 270 ppb, much higher that the value of 12 ppb measured in the baseline sample of May 6. Although there was a steady increase in the level of the oxygenates, the percentage of oxygenates remained relatively low and constant throughout the entire test period.
Figure 11 shows histograms of the semivolatile analyses from May 6, June 17, July 16 and December 16. No real systematic variations in the semivolatile compound distribu- tions were evident over the six-month period when samples from this well were collected. The baseline sample of May 6 consisted primarily of low (i.e.+raphthalene and 2-methylnaphthalene) and intermediate (i.e., acenaphthene, fluorene, and phenanthrene) semivolatile organic compounds, with significant amounts of carbazole and dibenzo- furan. By June 17, the distribution became dominated by the low molecular weight compounds. When sampled again on July 17, the compound distribution again resembled the baseline sample of May 6. The last sample (December 16) was again dominated by the low molecular weight PAH and resembled the sample of June 17.
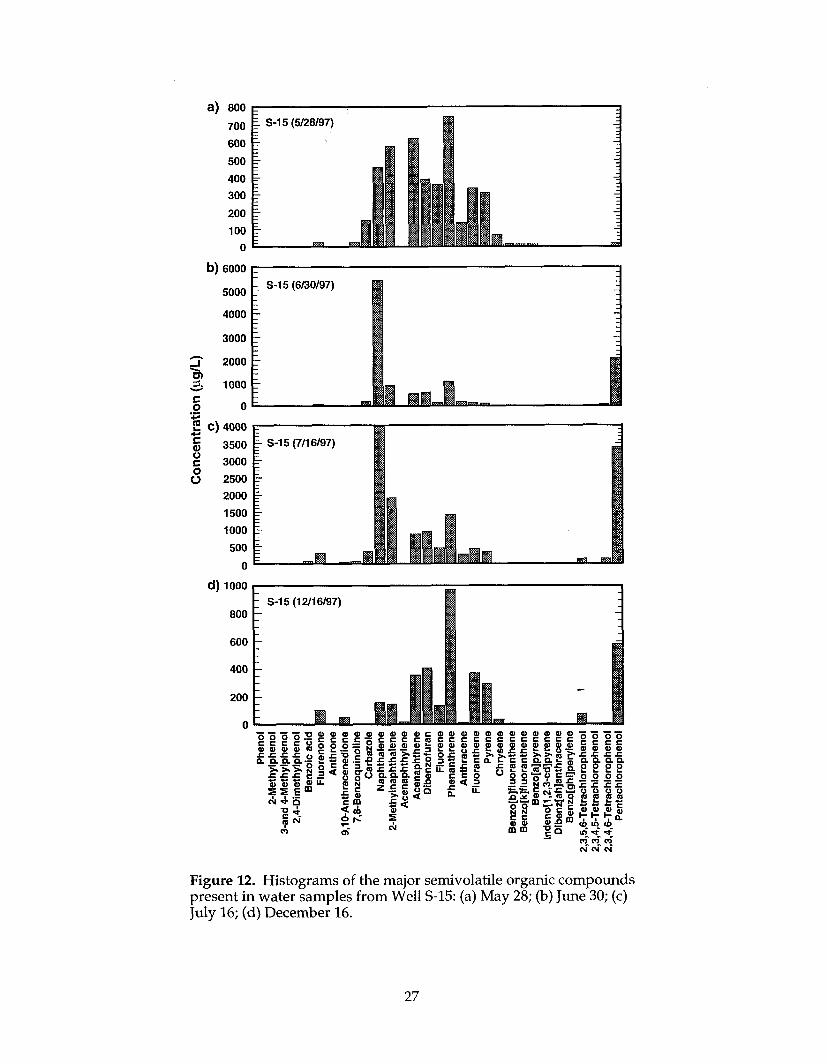
Well S-15 Table 5 lists the results of the groundwater analyses from Well S-15. This well was sampled for organics three times during the HP0 field test, on May 28, June 30, and July 16, with two additional samples collected on December 16 as spot-check samples. This well exhibited the same trends in contaminant concentrations seen in Well S-14, showing increases in total oxygenates and total PAH over time. The earliest sampling date of May 28 had a total organic level of 4280 ppb. The level of organics increased to
7
12000 ppb on June 30 and 15300 ppb on July 16. The levels of total oxygenates increased from 150 ppb on May 28 to nearly 400 ppb on July 16. The most abundant compounds present were the low and interm,ediate molecular weight PAH compounds (i.e., naphthalene and phenanthrene) and pentachlorophenol. Although the level of pentachlorophenol was low (18 ppb) in the May 28 sample, the PCP level increased to 2000 ppb by June 30 and was measured at 3400 ppb on July 16.
Figure 12 presents four histograms sampled from May 28 to December 16, covering approximately the same time period as was shown in Figure 11 for Well S-14. The sample of May 28 consisted of compounds spanning a large molecular weight range, from naphthalene to pyrene. On June 30 the distribution was dominated by naphthalene with lesser amounts of the other PAH. A similar distribution was found on July 17. On December 16 the major compound present was phenanthrene.
Miscellaneous Wells (MW-41, MW-44, EW-1, EW-2, EW-3, EW-5) Table 6 lists the results of the groundwater analyses from a set of assorted wells. The wells listed in this section were not sampled on a regular basis but rather were collected as spot checks around the site.
MW-41 was sampled three times during the field test. The first sample was taken on May 6 and represented a baseline sample before steaming operations began. The water on this date was clean of semivolatile compounds, and none of the target compounds were detected. Midway through the steaming operations, another sample was taken (June 18) and some target compounds were detected at very low levels. The total semivolatile compound level quantitated by GC-MS was approximately 20 ppb. A final sample was taken on July 16 and was similar to the previous sample taken on June 18. Most of the compounds detected were in the range of l-7 ppb with the exception of pentachlorophenol, which was at 19 ppb.
One sample from MW-44 was taken on July 17. A few semivolatile organic compounds were detected at very low levels (approximately 1 ppb). EW-1 was sampled on May 8 and June 16. PAH compounds at concentrations < 40 ppb were found in both samples and both had total semivolatile levels of approximately 140 ppb. EW-3 was sampled on May 6 and June 16. The May 6 sample consisted primarily of intermediate molecular weight PAH (i.e., acenaphthene, dibenzofuran, and phenanthrene) at approximately 40 ppb and a total semivolatile organic loading of 180 ppb. The EW-3 sample taken on June 16 had a similar compound distribution except for elevated levels of fluorenone and phenanthrene. This sample had a total semivolatile c%ncentration of 390 ppb. EW-5 was sampled once (July 17) and was relatively clean, having a total semivolatile concentration of 28 ppb. Wells EW-5, MW-41 and MW-44 were the cleanest of all the wells sampled after the steaming operations began.
Injection Well S-4 The steam injection Well S-4 was sampled twice for organic analyses by GC-MS. The results are presented in Appendix B, Table 7. The sample dated May 23 13:30 was collected by condensing steam from the S-4 wellhead into ice, so the concentrations for this sampling event include an unknown dilution factor and should be used only as a qualitative look at which organic compounds vented from this well. The analysis showed the condensed steam was quite clean in hydrocarbons with phenanthrene as the compound in highest concentration.
Well S-4 was sampled on June 20 13:00 by condensing the steam in a copper coil submerged in an ice bath, then collecting the water in a 1L amber sampling bottle. This
8
analysis revealed that the major compounds present were the intermediate molecular weight PAH compounds of phenanthrene (89 ppb), pyrene (23 ppb), fluoranthene (11 ppb) and anthracene (10 ppb). A small grab sample from Well S-4 was also taken on June 20 11:OO and analyzed for pH (pH = 7) and TIC (75.9 ug C/g H,O).
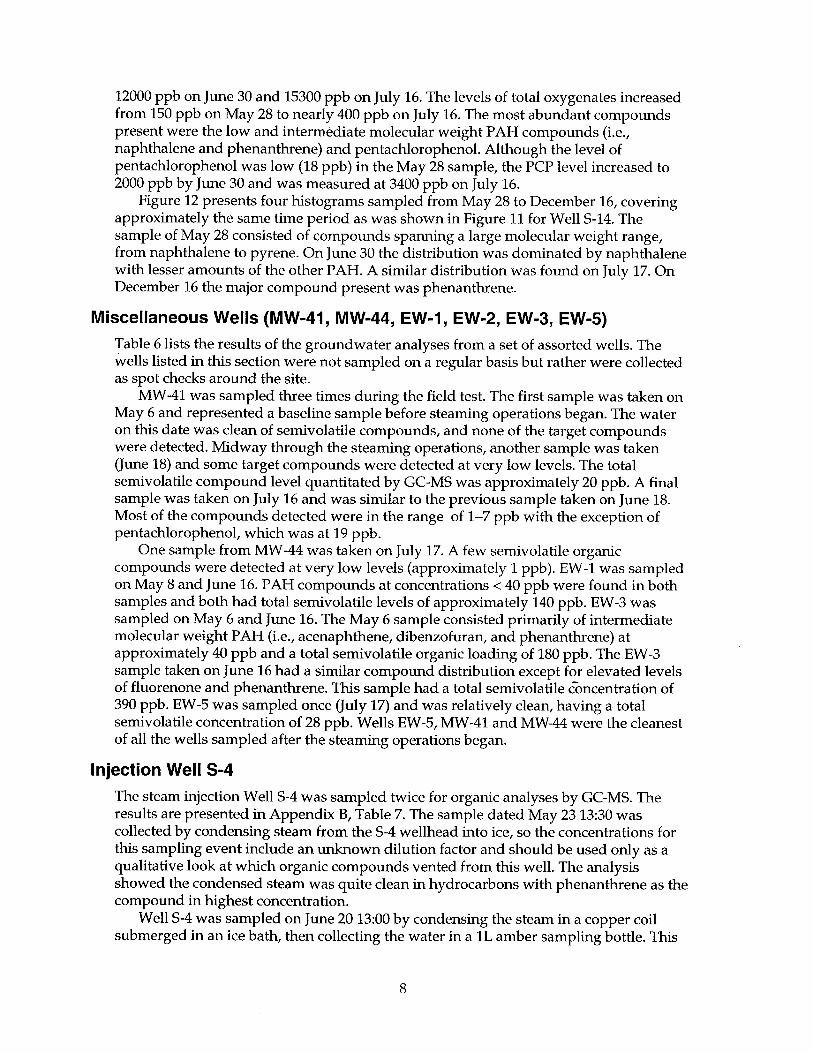
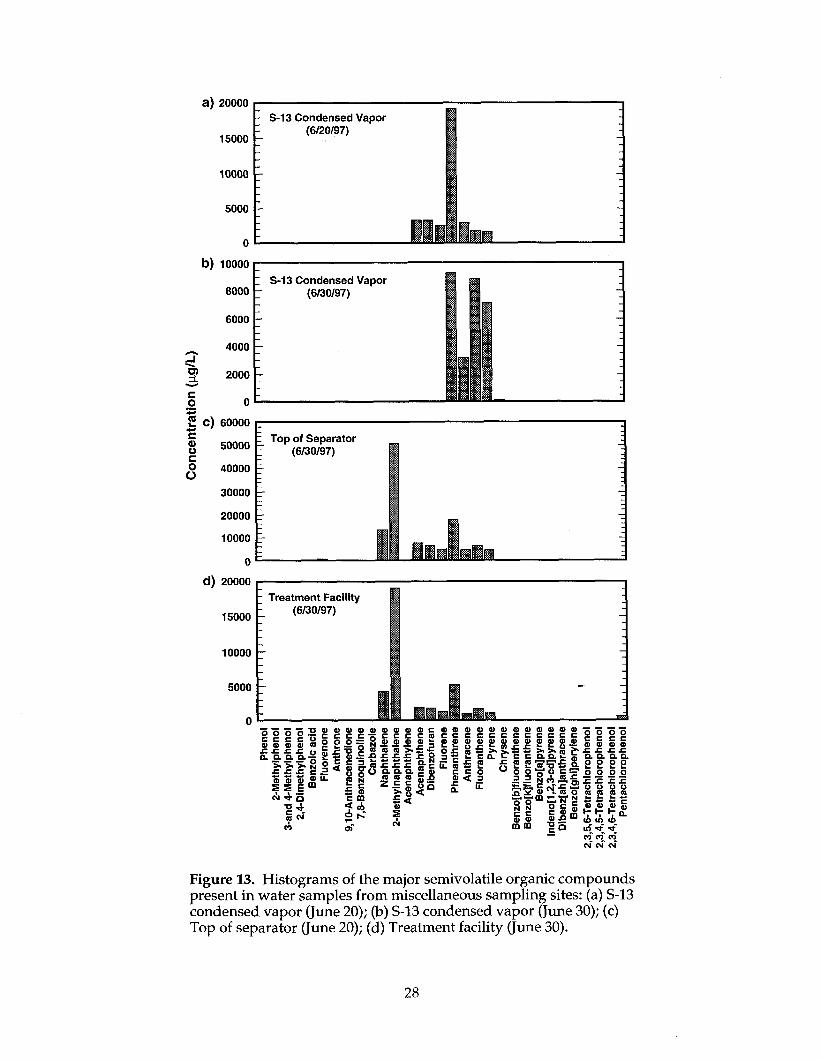
Miscellaneous Water and Free Product Miscellaneous water samples are listed in Table 8, and miscellaneous free product and solid samples are listed in Table 9. The water samples submitted for organic analyses and listed in Table 8 were either condensed vapor samples from Well S-13 or water samples from the treatment facility. As expected for samples of this type, all of these water samples were elevated in organics. Two histograms of condensed vapor from S-13 are presented in Figure 13a and Figure 13b. These samples were unique because they both had extremely elevated organic concentrations but also very limited in the distribution of organic compounds present. For example, the S-13 (June 20) condensed vapor sample consisted primarily of phenanthrene, and the S-13 (June 30) sample consisted almost exclusively of phenanthrene, anthracene, fluoranthene, and pyrene. The distribution of organic compounds found in the water samples from the treatment facility were nearly identical, with the major compound being 2-methylnaphthalene.
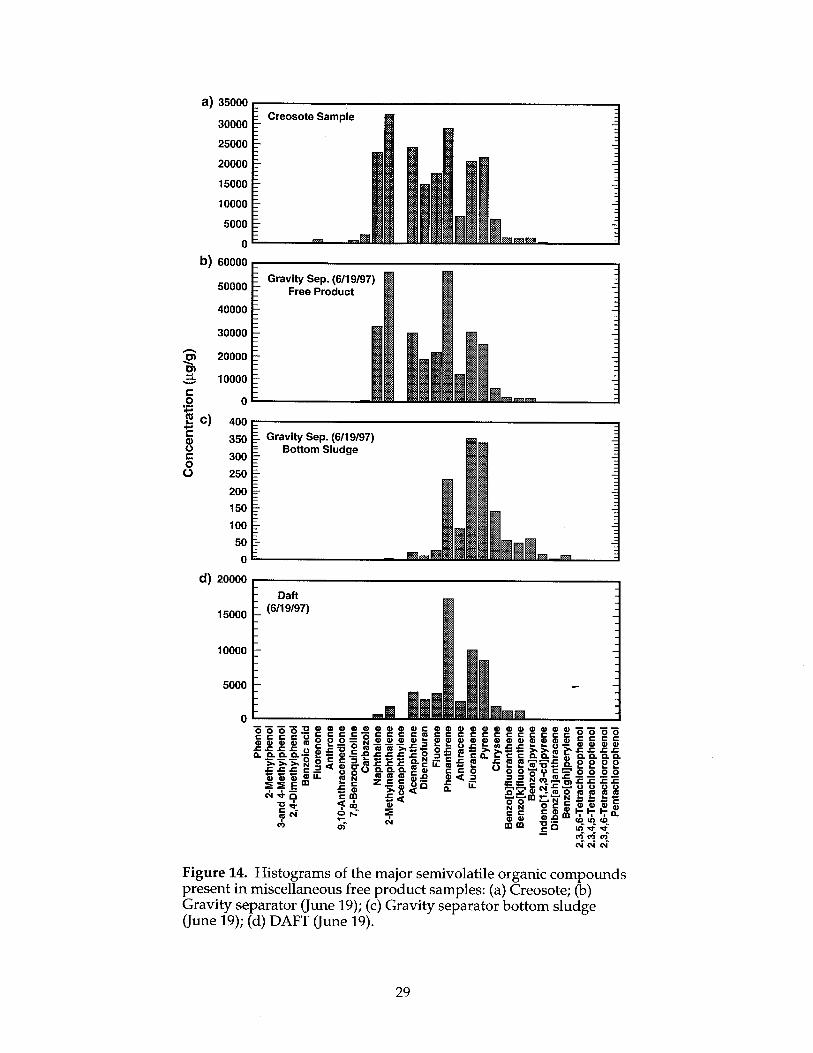
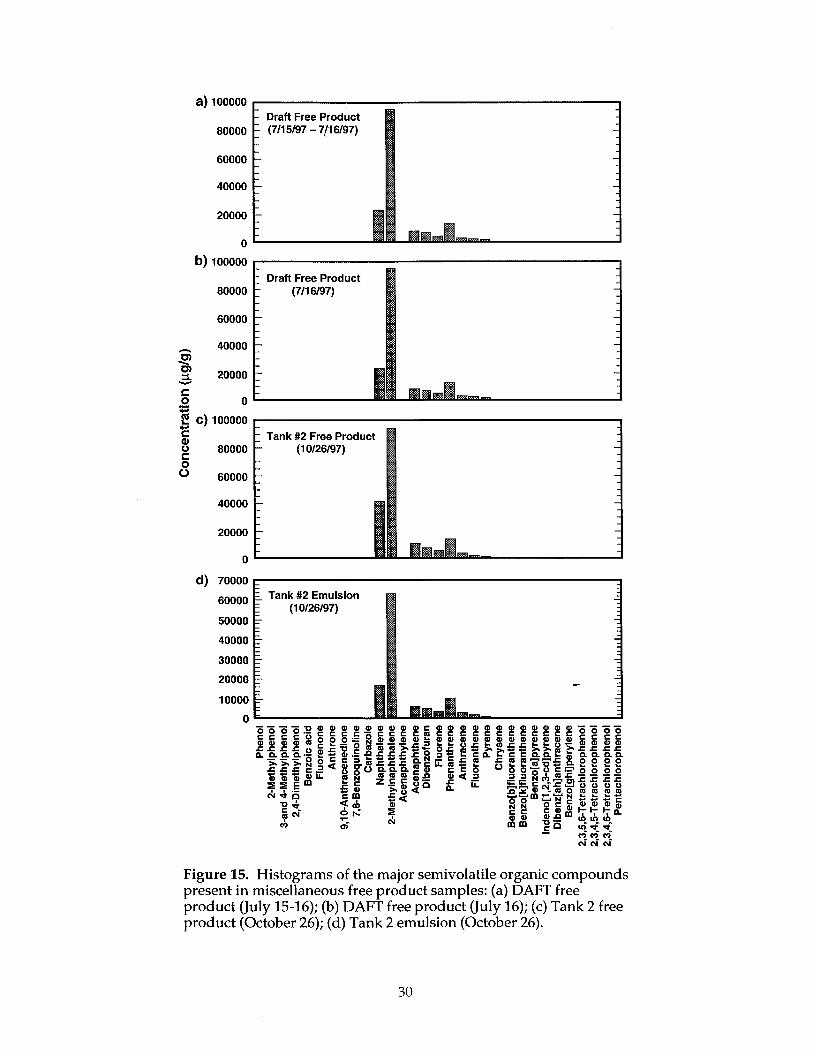
Selected histograms of free products, sludge samples, or emulsion samples are presented in Figure 14 and Figure 15. Figure 14a is a histogram of a creosote sample recovered in 1996 from the vicinity of Well S-14. Figure 14b is a sample of the free product collected from the gravity separator on June 19. The distribution of compounds found in this sample is similar to the creosote sample. The bottom sludge sample collected at the same time is depleted in the lower molecular weight components. The sample from the DAFT (June 19) consisted primarily of intermediate and high molecular weight compounds of phenanthrene, fluoranthene, and pyrene. Figure 15 presents free product samples taken from various locations in the treatment facility. They are all similar in composition, consisting primarily of 2-methylnaphthalene, with lesser amounts naphthalene and the intermediate molecular weight PAH.
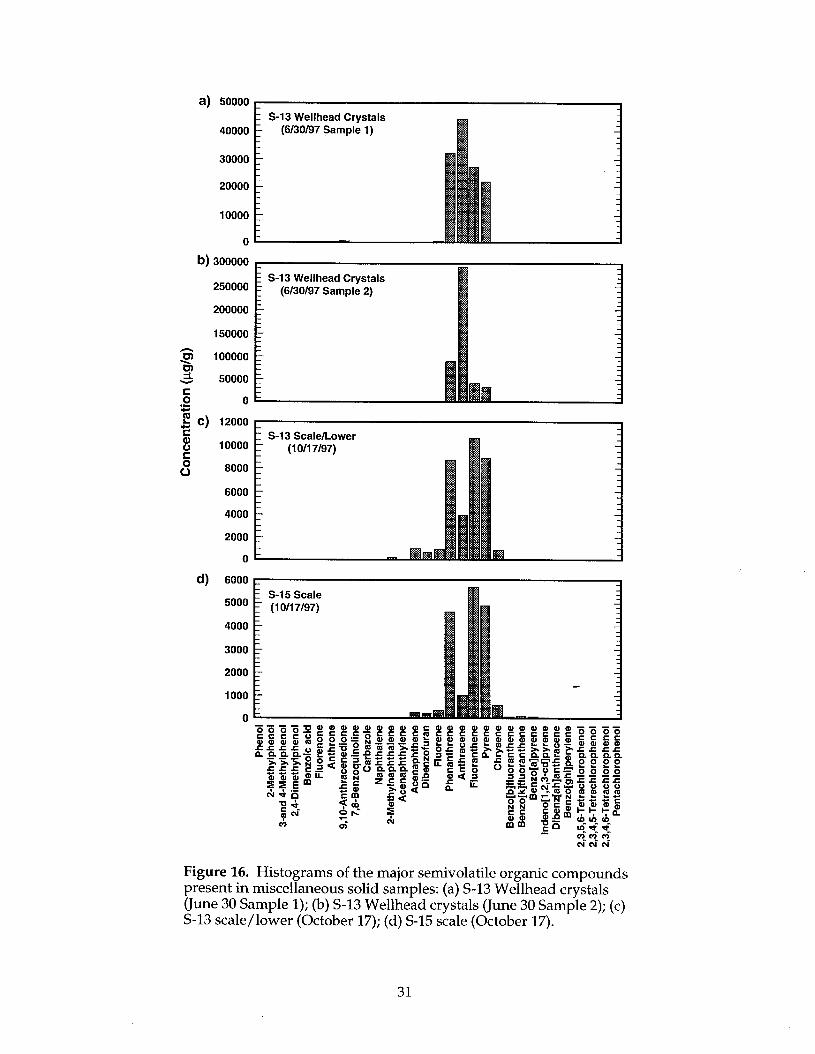
Figure 16a and Figure 16b present results from solid samples, collected on June 30, of material that had condensed on the S-13 wellhead. The distributions consisted primarily of intermediate and high molecular weight compounds (i.e., phenanthrene, anthracene, fluoranthene, and pyrene). Figure 16c and Figure 16d are organic compounds extracted from carbonate scales collected from Wells S-13 and S-15. Like the S-13 wellhead samples, these samples had very limited distributions of organic comp&mds consisting primarily of phenanthrene and the higher molecular weight compounds fluoranthene and pyrene.
Discussion Large variations were found in groundwater contaminant concentrations and compound distributions in water samples from the Southern California Edison Pole Yard. The possible causes of these variations are numerous. Some of the observed differences could have resulted from more than one creosote, dense, nonaqueous-phase liquid (DNAPL) type being present in the intermediate aquifer. The composition of a complex creosote DNAPL pool also can be altered by a variety of physical, chemical, and biochemical processes (Goerlitz et al., 1985). An example of a physical alteration would be the preferential loss of more soluble compounds to the groundwater (Johansen et al., 1997), and an example of a chemical alteration would be the chemical oxidation that occurs at extremely slow rates under ambient conditions but can be greatly accelerated by steam injections (Knauss et al., 1998a; Leif et al., 1998). An example of a biochemical alteration would be the selective utilization of certain types of creosote compounds by microorganisms (Erlich et al., 1982; Mueller et al., 1991).
Prior to any clean-up attempts, the alteration processes acting on the creosote DNAPL and contaminated groundwater were not occurring fast enough to allow natural attenuation to contain the contaminated groundwater plume or remediate the source DNAPL on the site. The application of pump and treat technology contained the plume but did not remove the large source of DNAPL at an acceptable rate.
The implementation of the thermally-enhanced in situ remediation technologies of dynamic underground stripping (DUS) and hydrous pyrolysis/oxidation (HPO) directly targeted the source DNAPL, both by accelerating the physical removal with steam stripping and by accelerating the chemical destruction or mineralization with aqueous oxidation (Knauss et al., 1998a; 1998b). During steam injection, creosote components partition and fractionate into the steam or hot water and are mobilized as a function of their physical properties (Wauchope and Getzen, 1972; Peters et al., 1997). When sufficient oxygen is present, organic compounds can also be completely oxidized to carbon dioxide. The rates of oxidation and tendencies to form partially oxidized intermediates are functions of their chemical reactivities. The injection of steam rapidly heated the entire subsurface to its boiling point and most likely greatly reduced the population of the groundwater microbial community. Therefore, the results of the semivolatile organic analyses during the field test were primarily a reflection of the physical and chemical processes that resulted from the steam injections
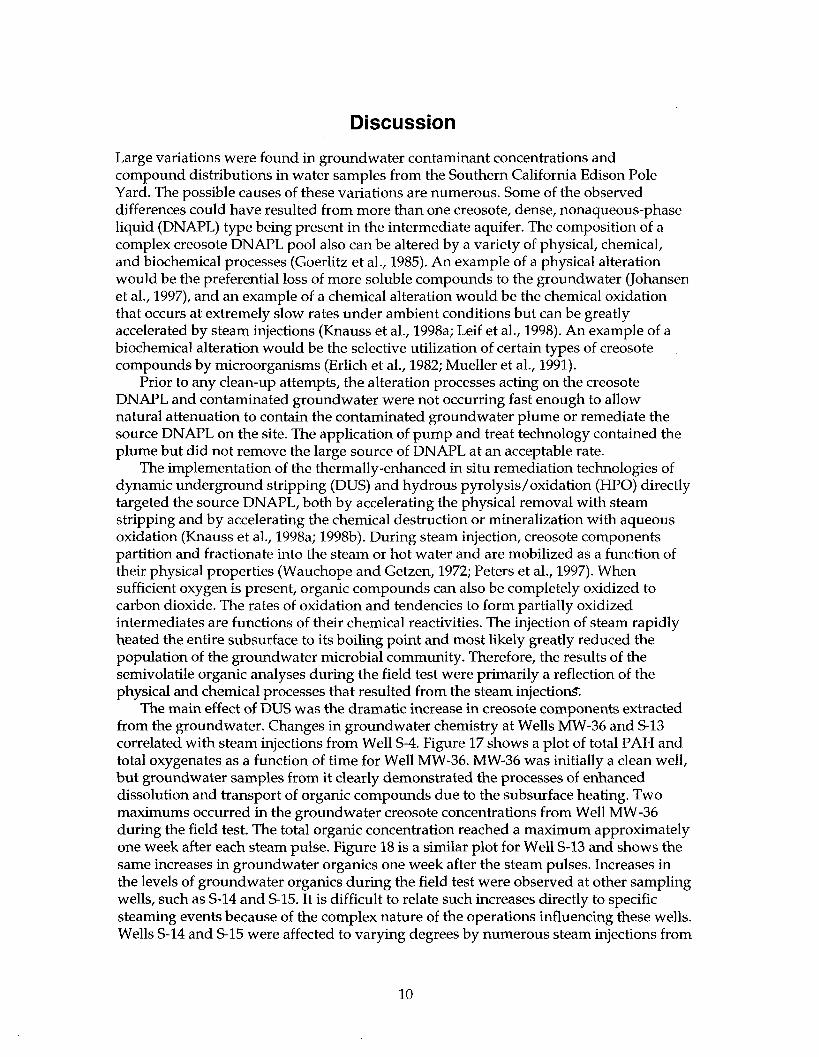
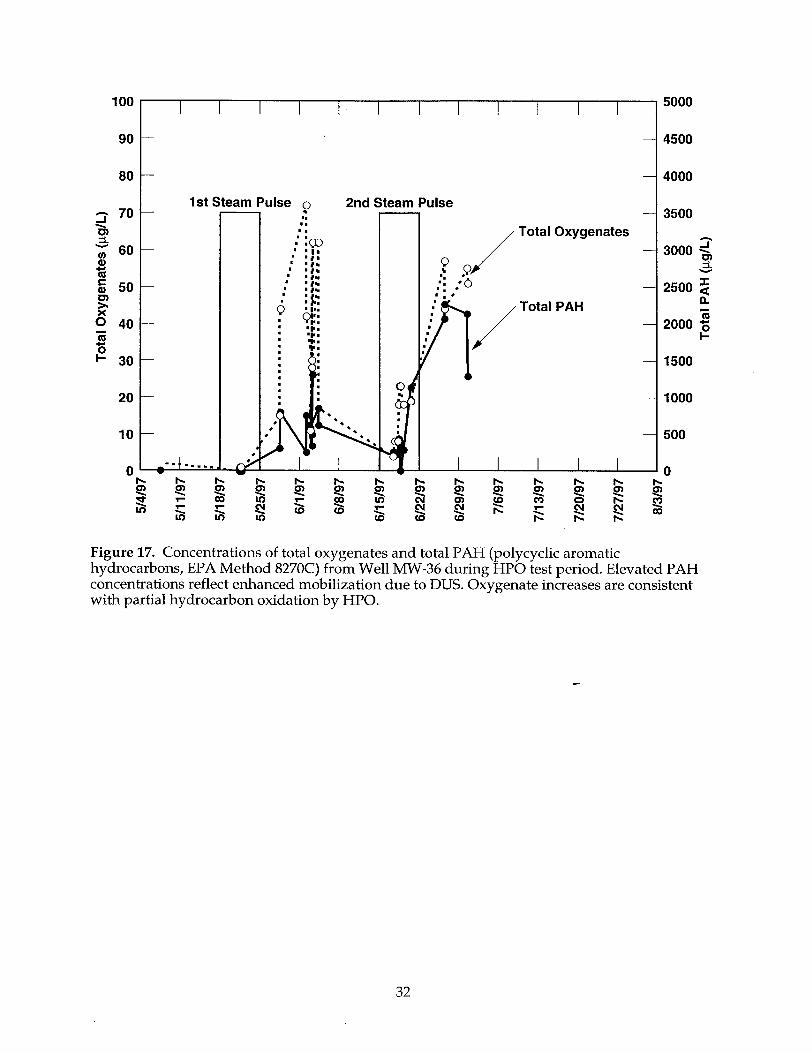
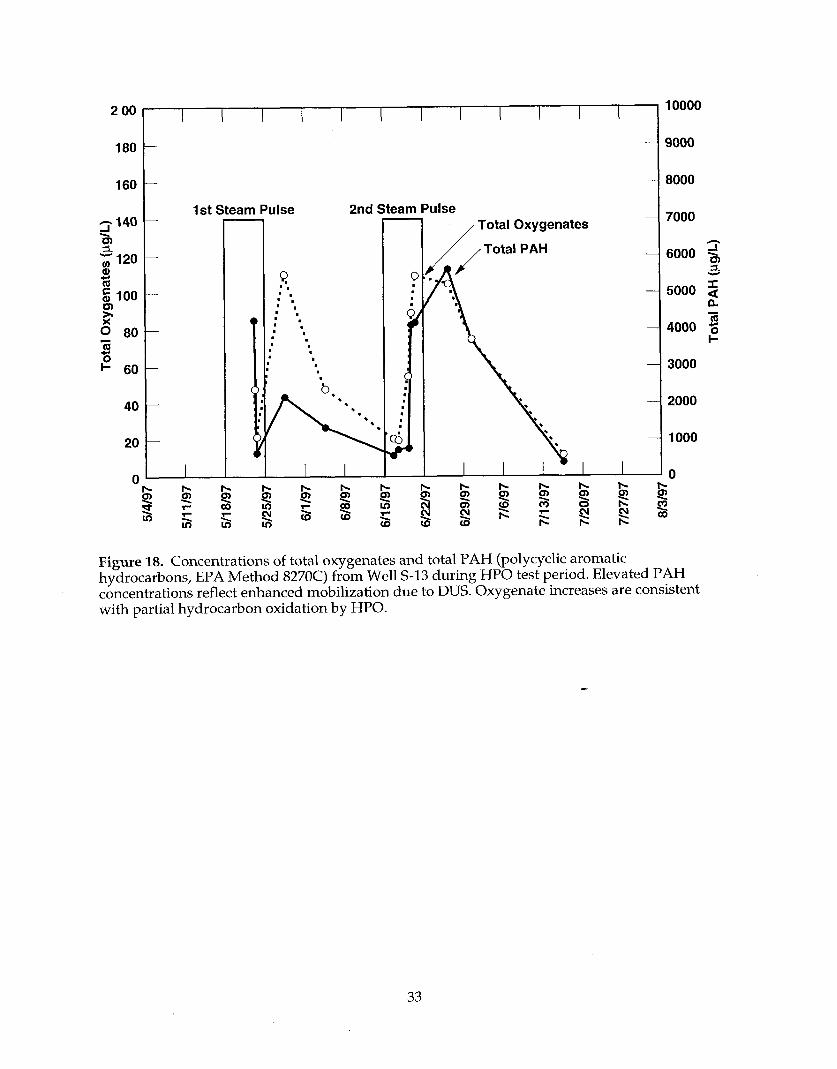
The main effect of DUS was the dramatic increase in creosote components extracted from the groundwater. Changes in groundwater chemistry at Wells MW-36 and S13 correlated with steam injections from Well S-4. Figure 17 shows a plot of total PAH and total oxygenates as a function of time for Well MW-36. MW-36 was initially a clean well, but groundwater samples from it clearly demonstrated the processes of enhanced dissolution and transport of organic compounds due to the subsurface heating. Two maximums occurred in the groundwater creosote concentrations from Well MW-36 during the field test. The total organic concentration reached a maximum approximately one week after each steam pulse. Figure 18 is a similar plot for Well S-13 and shows the same increases in groundwater organics one week after the steam pulses. Increases in the levels of groundwater organics during the field test were observed at other sampling wells, such as S-14 and S15. It is difficult to relate such increases directly to specific steaming events because of the complex nature of the operations influencing these wells. Wells S-14 and 515 were affected to varying degrees by numerous steam injections from
10
multiple injection wells, but, in general, creosote content was definitely enhanced by the steaming operations in these two wells.
In addition to changes in total organic concentrations, the distributions of compounds, relative to each other, in the groundwaters also changed over time. Well MW-36 is an example where the distribution of organics gradually changed during the field test. The histograms in Figure 8 show a moderate progression toward higher molecular weight PAH over time, reflecting the ability of the heated groundwater to mobilize these PAH, which are difficult to remediate under ambient groundwater conditions due to their extremely low aqueous solubilities at lower temperatures. This trend toward an increase in higher molecular weight compounds was also observed in Well S-13 (Figure 9).
The main effect attributed to HP0 was the production of partially oxidized intermediate compounds. As reported earlier for the laboratory-based HP0 experiments using an actual creosote from this site (Leif et al., 1998), low molecular weight phenols and benzoic acid were formed. These oxygenated compounds represent partially oxidized intermediates formed during the HP0 of a complex creosote DNAPL. Figure 17 and Figure 18 show how the concentrations of these same low molecular weight oxygenates changed in response to the steam injections into Well S-4. The levels of total oxygenates reached maximums immediately after both steaming events. Although these compounds cannot be unequivocally attributed to be the products of HP0 chemistry, their presence is consistent with the aqueous-phase oxidation expected under these conditions.
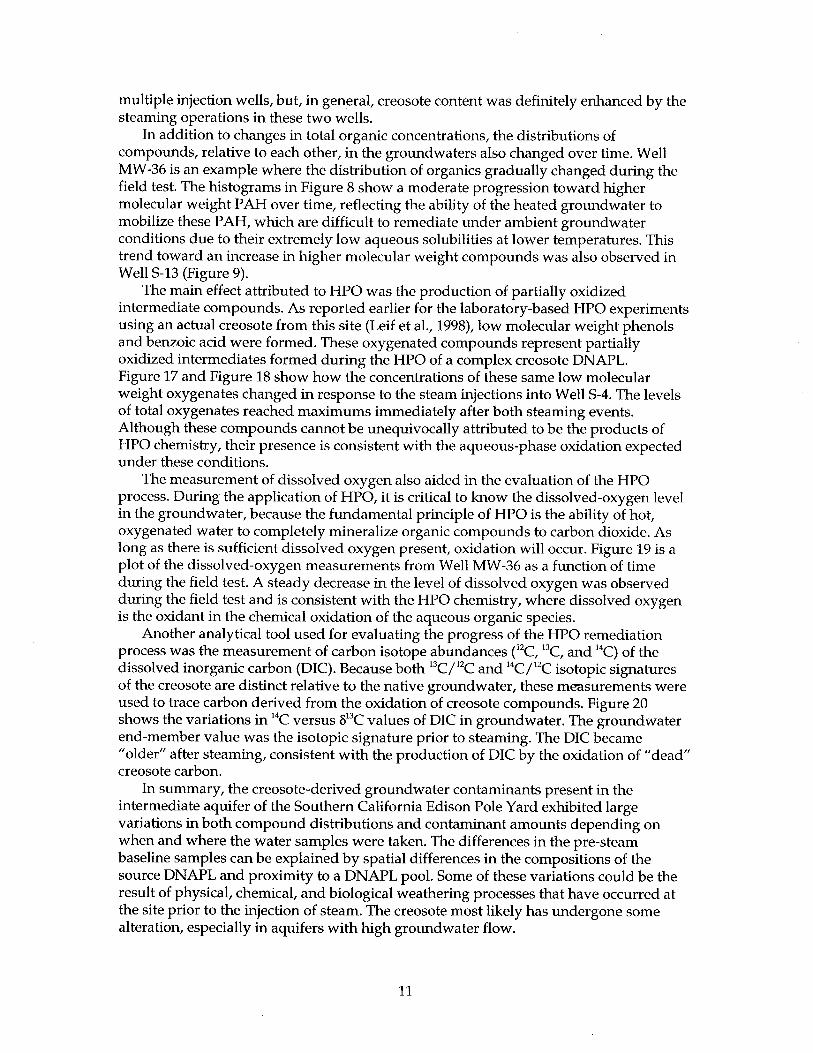
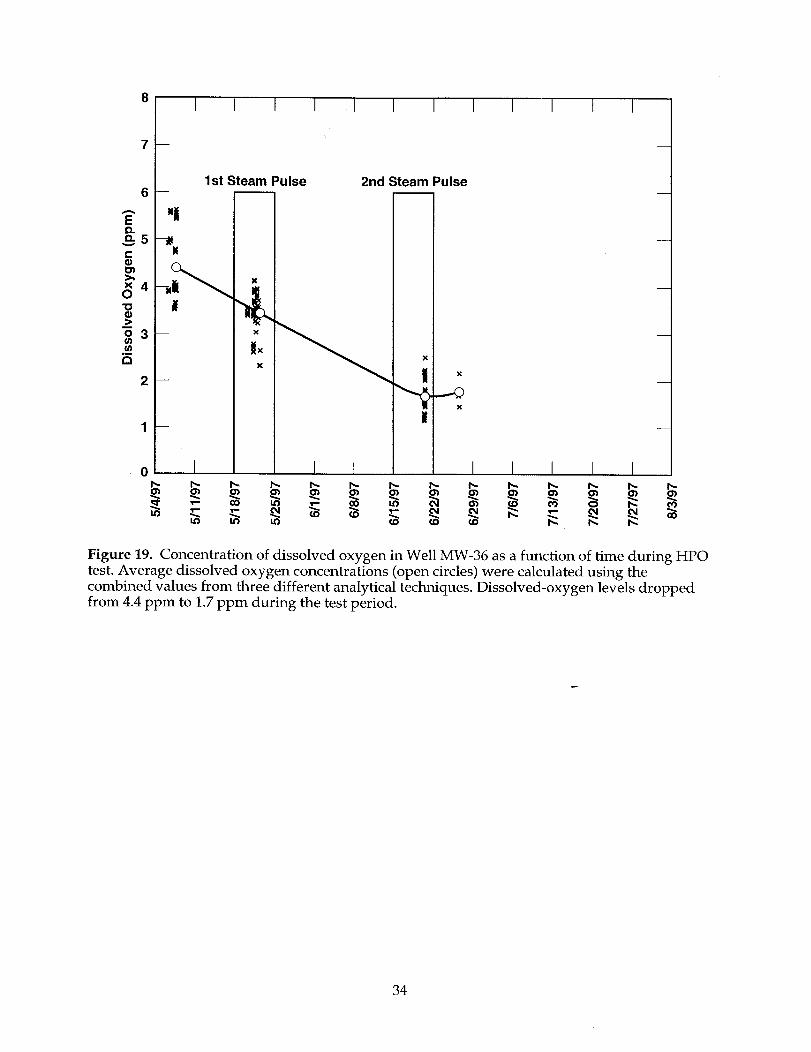
The measurement of dissolved oxygen also aided in the evaluation of the HP0 process. During the application of HPO, it is critical to know the dissolved-oxygen level in the groundwater, because the fundamental principle of HP0 is the ability of hot, oxygenated water to completely mineralize organic compounds to carbon dioxide. As long as there is sufficient dissolved oxygen present, oxidation will occur. Figure 19 is a plot of the dissolved-oxygen measurements from Well MW-36 as a function of time during the field test. A steady decrease in the level of dissolved oxygen was observed during the field test and is consistent with the HP0 chemistry, where dissolved oxygen is the oxidant in the chemical oxidation of the aqueous organic species.
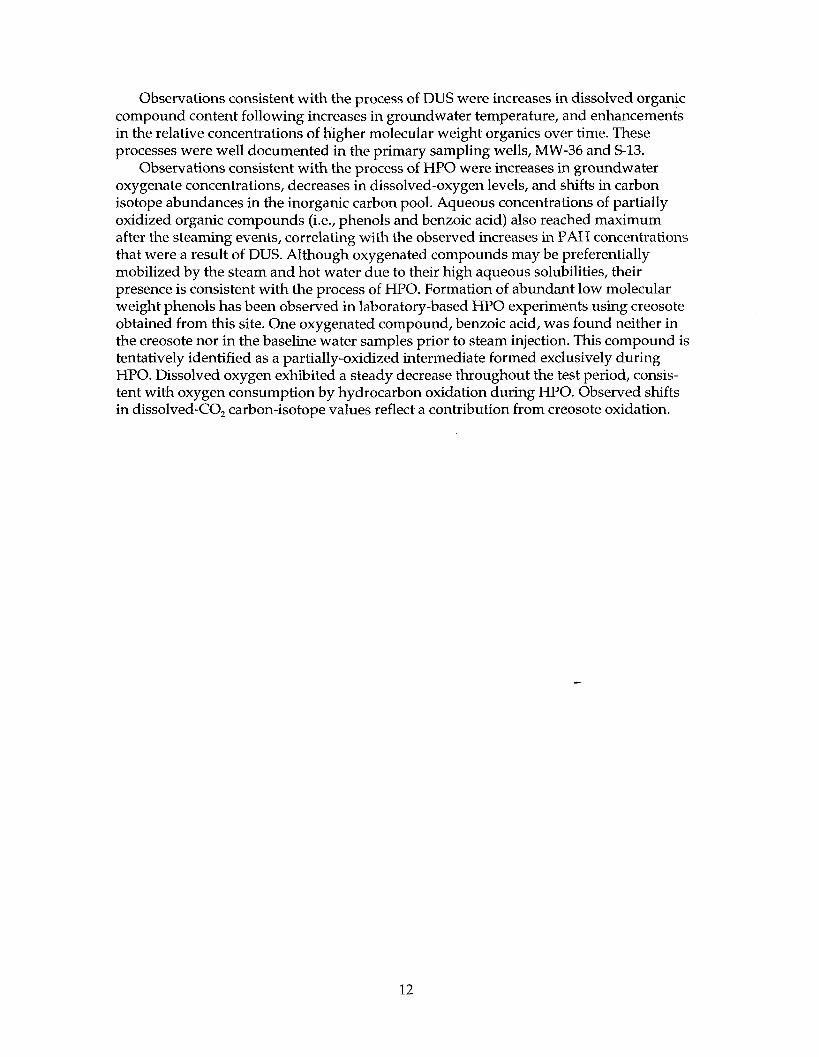
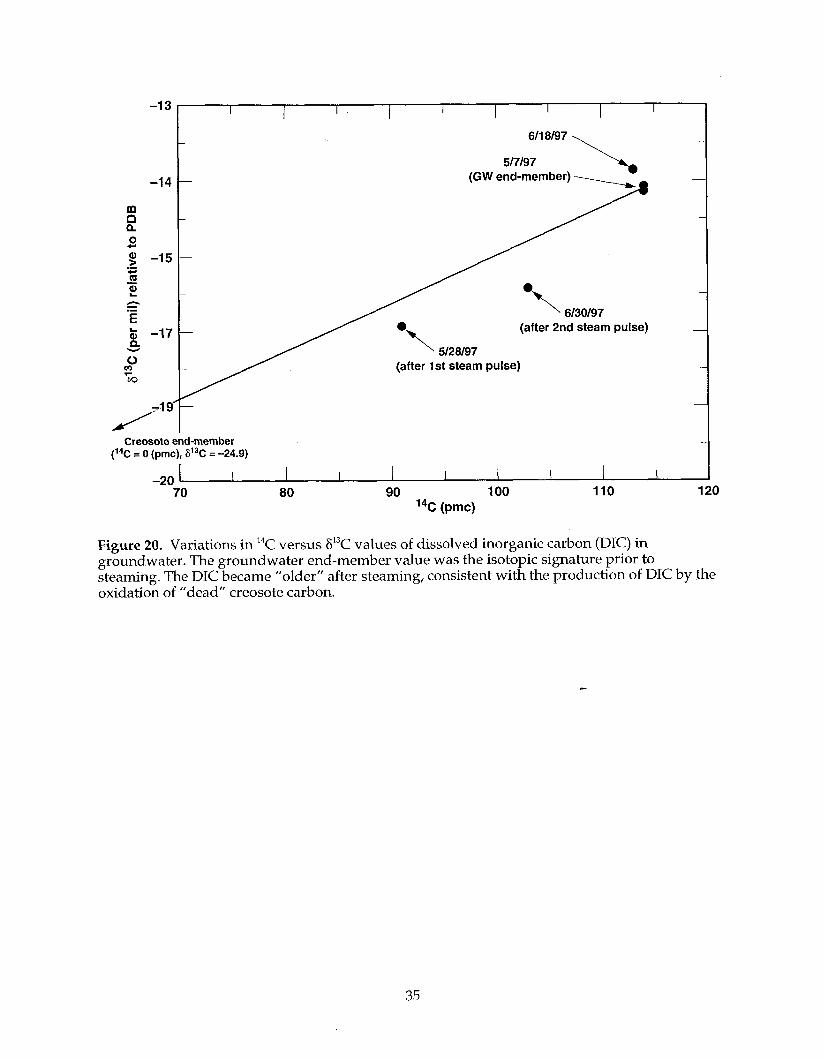
Another analytical tool used for evaluating the progress of the HP0 remediation process was the measurement of carbon isotope abundances (“C, 13C, and ‘*C) of the dissolved inorganic carbon (DIC). Because both 13C/? and ‘*C/“C isotopic signatures of the creosote are distinct relative to the native groundwater, these measurements were used to trace carbon derived from the oxidation of creosote compounds. Figure 20 shows the variations in 14C versus S13C values of DIC in groundwater. The groundwater end-member value was the isotopic signature prior to steaming. The DIC became “older” after steaming, consistent with the production of DIC by the oxidation of “dead” creosote carbon.
In summary, the creosote-derived groundwater contaminants present in the intermediate aquifer of the Southern California Edison Pole Yard exhibited large variations in both compound distributions and contaminant amounts depending on when and where the water samples were taken. The differences in the pre-steam baseline samples can be explained by spatial differences in the compositions of the source DNAPL and proximity to a DNAPL pool. Some of these variations could be the result of physical, chemical, and biological weathering processes that have occurred at the site prior to the injection of steam. The creosote most likely has undergone some alteration, especially in aquifers with high groundwater flow.
11
Observations consistent with the process of DUS were increases in dissolved organic compound content following increases in groundwater temperature, and enhancements in the relative concentrations of higher molecular weight organics over time. These processes were well documented in the primary sampling wells, MW-36 and S-13.
Observations consistent with the process of HP0 were increases in groundwater oxygenate concentrations, decreases in dissolved-oxygen levels, and shifts in carbon isotope abundances in the inorganic carbon pool. Aqueous concentrations of partially oxidized organic compounds (i.e., phenols and benzoic acid) also reached maximum after the steaming events, correlating with the observed increases in PAH concentrations that were a result of DUS. Although oxygenated compounds may be preferentially mobilized by the steam and hot water due to their high aqueous solubilities, their presence is consistent with the process of HPO. Formation of abundant low molecular weight phenols has been observed in laboratory-based HP0 experiments using creosote obtained from this site. One oxygenated compound, benzoic acid, was found neither in the creosote nor in the baseline water samples prior to steam injection. This compound is tentatively identified as a partially-oxidized intermediate formed exclusively during HPO. Dissolved oxygen exhibited a steady decrease throughout the test period, consis- tent with oxygen consumption by hydrocarbon oxidation during HPO. Observed shifts in dissolved-CO, carbon-isotope values reflect a contribution from creosote oxidation.
12
Conclusions It is clear from the Visalia Field Test at the Southern California Edison Pole Yard that the combined applications of two in situ, thermal-remediation technologies, dynamic underground stripping (DUS) and hydrous pyrolysis/oxidation (HPO), have greatly accelerated the remediation of this creosote-contaminated site. Application of DUS to the site has accelerated the mobilization and removal of creosote. The following observations are evidence for DUS:
l Increases in the concentrations of PAH compounds were observed following the steaming events.
l Increases in the relative amounts of higher molecular weight compounds occurred during the field test.
The application of HP0 to the Southern California Edison Pole Yard has accelerated site remediation by oxidizing creosote components. The following observations are evidence supporting HPO:
l Increases in the concentration of partially oxidized organic compounds (i.e., phenol, methyl phenols, benzoic acid) were observed following the steaming events.
l A steady decrease in dissolved oxygen was observed in the intermediate aquifer, consistent with oxygen consumption by creosote oxidation during HPO.
l Carbon isotope shifts in the dissolved inorganic carbon pool coincided with the observed increase in the groundwater oxygenate concentrations. The shifts to “lighter” and “older” isotopic compositions are consistent with creosote oxidation.
From June 20 to August 6, Southern California Edison has reported the following: l 200,000 lb free product removed (as LNAPL and DNAPL) l 17,500 lb hydrocarbon collected by activated carbon filtration l 29,400 lb hydrocarbon burned in boilers l 45,500 lb of carbon removed as CO, produced from creosote oxidation
13
Acknowledgments The authors thank Allen Elsholz and Ben Johnson for field support, and Daniel Mew and Fowzia Zaka for analytical support. We also thank the employees of Visalia Southern California Edison Co. and the employees of SteamTech Environmental Services for expert assistance at the site. This work was performed under the auspices of the U.S. Department of Energy by the Lawrence Livermore National Laboratory under Contract W-7405-Eng-48. Partial support provided by the Southern California Edison Company was greatly appreciated.
14
References Chiarappa, M., et al. (1998). On-Site and Laboratory Semivolatile Organic Analyses of
Groundwater Samples during the HP0 Field Demonstration in Visalia, California. Livermore. California: Lawrence Livermore National Laboratory (in preparation).
Erlich, G.G., D.F. Goerlitz, E.M. Godsy, and M.F. Hult (1982). “Degradation of phenolic contaminants in ground water by anaerobic bacteria: St. Louis Park, Minnesota.” Ground Water 20:703-710.
Goerlitz, D.F., D.E. Troutman, E.M. Godsy, and B.J. Franks (1985). “Migration of wood- preserving chemical in contaminated groundwater in a sand aquifer at Pensacola, Florida.” Environ. Sci. Tech. 19:955-961.
Hale, R.C., and K.M. Aneiro (1997). “Determination of coal tar and creosote constituents in the aquatic environment.” 1. Chrom. A 774:79-95.
Johansen, S.S., A.B. Hansen, Mosbaek, and E. Arvin (1997). “Identification of heteroaromatic and other organic compounds in ground water at creosote sites in Denmark.“Ground Water Monitor. Remed. 17:106-115.
Knauss, K.G., M.J. Dibley, R.N. Leif, D.A. Mew, and R.D. Ames (1998a). “Aqueous oxidation of trichloroethylene (TCE): A kinetic analysis.” Applied Geochem. (submitted).
Knauss, K.G., M.J. Dibley, R.N. Leif, D.A. Mew, and R.D. Aines (1998b). “The aqueous solubility of trichloroethylene (TCE) and tetrachloroethene (ICE) as a function of temperature and calculated thermodynamic quantities.” Applied Geochem. (submitted).
Leif, R.N., R.D. Aines, and K.G. Knauss (1998). Hydrous Pyrolysis ofPole Treating Chemicals: A) Initial Measurement of Hydrous Pyrolysis Rates for Naphthalene and Pentachlorophenol; B) Solubility of Flourene at Temperatures Up To 250°C. Livermore, California: Lawrence Livermore National Laboratory, UCRL-CR-129838.
Mueller, J.G., D.P. Middaugh, S.E. Lantz, and P.J. Chapman (1991). “Biodegradation of creosote and pentachlorophenol in contaminated groundwater: Chemical and biological assessment.” Appl. Environ. Microbial. 57:1277-1285.
Newmark, R.L., and R.D. Aines (1995). Summary Of The LLNL Gasoline Spill Demonstration: Dynamic Underground Stripping Project. Livermore, California: Law.rence Livermore National Laboratory, UCRL-ID-120416.
Peters, C. A., S. Mukherji, C.D. Knightes, and W.J. Weber, Jr. (1997). “Phase stability of multicomponent NAPLs containing PAHs.” Environ. Sci. Tech. 31:2540-2546.
Wauchope, R.D., and F.W. Getzen (1972). “Temperature dependence of solubilities in water and heats of fusion of solid aromatic hydrocarbons.” 1. Chem. Eng. Data 17:3841.
15
Aque
ous
Conc
entra
tion
@q/
L)
4-M
ethy
lphe
nol
2,CD
imet
hylp
heno
l
Benz
oic
acid
Naph
thal
ene
2-M
ethy
lnap
htha
lene
Phen
anth
rene
Benz
o[a]
anth
race
ne
Chry
sene
E
5
0
Dissolved Oxygen ------b
I I I I I I I I 10 15 20 25
Elapsed Time (days)
Figure 2. Oxygen consumption and carbon dioxide generation during a laboratory-scale HP0 experiment where the reaction temperature was increased from 70°C to 120°C over a duration of 33 days. Complete oxidation of creosote components is shown by the production of CO,.
17
Approximate minimum steam area 17,200 yd*
1 Boilers
I MW441
P MW 43
MW45 I
MW 41
I Scale in feet
1 Visalia City Corporation Yard
0 25 50 N
-0 Scale in meters
‘aIntermediate Acquifer s ?Shallow Acquifer
New ractor I termediate Acquifer s ,t‘Shallow Acquifer
B Existing Monitor Well
Figure 3. Map of the Southern California Edison Pole Yard showing locations of injection, extraction, and monitoring wells. Injection Well S-4 was used for the HP0 demonstration and groundwater chemistry (pH, anions, cations, organic semivolatile compounds) was monitored at Wells S-13 and MW-36 (approximately 90 ft away).
18
Property boundary SW 1 /
Slurry wall Slurry wall \
. . . . .._ _ . . . . . . . _ . ._....... . . . ,., I. . . ., . . + ., _ _ . _ ., - _-.. . . ..-.....I. -. I . _ . - Deet>aauifer-.-‘. _*.*.‘. .‘.‘,‘./.‘ . ... .......... ................ .... ...... I: ..................
II-..- ' K= 4.0 gpd/ft2
K = 1900 gpd/ft*
.-e-t.. . . . .
L .-_I.-’ ._. .-_-.-
(schematic):.:.:-:.:.:.:.: I
. _ . . ,,._..,, .I.^
.,_ ____..-. . . , .__ ..,....
I. . . . . ..a .* .
‘I
. . . . . . . . 1 - . a., ,..... - . .
. _ . . . . - . . . .,., .,s,
,._,_ . . . . _ ,.. . . ,_..
........ ..........
....... . ........
......... .......
...... -. ..
18 m
0 30 61 m I I I 0 100 200ft
Figure 4. Cross section (approximately northeast-southwest) through the Visalia site, showing the lithology and approximate location of DNAPL contaminant prior to steaming. Depth to water is about 60 ft (the shallow aquifer is unsaturated). Drinking water is produced from the uncontaminated deep aquifer.
19
-- Ph
enol
-IS-l
7 2-
Met
hylp
heno
l - 3
- and
4-M
ethy
lphe
nol
2-M
ethy
lnap
htha
lene
Acen
apht
hyle
ne
s-y-
,15-
3 P
Acen
apht
hene
t
Dibe
nzof
uran
=‘
2,3,
5,6-
an
d 2,
3,4,
6-Te
trach
loro
phen
ol
Pent
achl
orop
heno
l H
Fl
uore
none
r r L _ Fl
uora
nthe
ne
. Py
rene
- IS
-5
’ Ch
ryse
ne
- IS
-6
le
Rela
tive
resp
onse
A
A A
A A
h)
h)
N
Y P
ZJ
IJ
IJ
rGPc
YsaJ
bbbb
bbbb
cJla
l0Io
P X
X X
X X
X X
X X
x x
x X
X X
X X
, Ph
enol
- IS
-1
i 2-
Met
hylp
heno
l --
3-
and
4-M
ethy
lphe
nol
- 2,
4-Di
met
hylp
heno
l /,
IS-2
Na
phth
aler
2-M
ethy
lnap
htha
lene
,
SAce
naph
thyl
ene
Is-3
Dibe
nzof
uran
y
2,3,
5,6-
and
2,3
,4,6
-Tet
rach
loro
phen
ol
b Fl
uore
ne
L
Acen
apht
hene
’ An
thra
cene
Ph
enan
thre
ne
- 7 Fl
uora
nthe
ne
b Py
rene
.
/
Benz
o[b]
fluor
anth
ene
, Be
nzo[
k]flu
oran
then
e ,
Benz
o[a]
pyre
ne
- IS
-6
t ' I I I I I I I I I I I I I I I I
/ 2.6 x 10'
2.4x10'
1.8 x10'
3 5 1.6x 10'
2 E 1.4x10' $
'i; Q 1.2x10' B
1.0x10'
8~10~
6~10~ t-
4 6 8 10 12 14 16 18 20 22 24 26 28 30 32 34 36 38 Time (min)
Figure 7. Reconstructed ion chromatogram (RIC) for the GC-MS run of the organic free product from the DAFT taken on July 16. The internal standards are labeled IS-1 through IS-6 and quantitated compounds are labeled on the RIC. The unresolved complex mixture (UCM) represents that portion of the extract which remained chromatographically unresolved and not quantitated by GC-MS.
22
a) 100 1 MW-36 (5/7/97)
80 -
60 -
40 -
20 -
0
b) 350
300
250
200
i- 150
& 100 t 50
s ‘E 0
E c) 500 f E 400
s 300
0
d) 600
500
400
Figure 8. Histograms of the major semivolatile organic compounds present in water sample from Well MW-36: (a) May 7; (b) May 28; (c) June 20; (d) June 30.
23
4 Co
ncen
tratio
n (p
g/L)
z
h).P
mm
Zi;~
G
ANW
Pulb
)-ld
D 00
0000
00
0000
0000
0 00
0000
000
Phen
ol 1”
“111
1111
1111
1111
1111
1111
1111
111(
111
2-M
ethy
lphe
nol
J-an
d 4-
Met
hylp
heno
l 2,
4-Di
met
hylp
heno
l Be
nzoi
c ac
id
Fluo
reno
ne
Anth
rone
9,
19-A
nthr
acen
edio
ne
7,8-
Benz
oqui
nolin
e Ca
rbaz
ole
Naph
thal
ene
P-M
ethy
lnap
htha
lene
Ac
enap
hthy
lene
Ac
enap
hthe
ne
Dibe
nzof
uran
Fl
uore
ne
Phen
anth
rene
An
thra
cene
1
Fluo
rant
hene
Py
rene
Ch
ryse
ne
Benz
o[b]
fluor
anth
ene
Benz
o[k]
fluor
anth
ene
Benz
o[a]
pyre
ne
Inde
no[l,
2,3-
cdlp
yren
e Di
benz
[ah]
anth
race
ne
Benz
o[gh
i]per
ylen
e 2,
3,5,
6-Te
trach
loro
phen
ol
2,3,
4,5-
Tetra
chlo
roph
enol
2,
3,4,
6-Te
trach
loro
phen
ol
Pent
achl
orop
heno
l
a) 700
600
500
400
300
200
100
0
b) 1000
800
600
3 400
3l 3 2000
s 0 ‘S !t C) 2500 E 8 2000 s
0 1500
1000
500
0
Figure 10. Histograms of the major semivolatile organic compounds present in water samples from Well S-12: (a) May 20; (b) May 28; (c) June 30; (d) July 16.
25
Phen
ol
P-M
ethy
lphe
nol
3-an
d 4-
Met
hylp
heno
l 2,
CDim
ethy
lphe
nol
Benz
oic
acid
Fl
uore
none
An
thro
ne
9,10
-Ant
hrac
ened
ione
ir,
&Ben
zoqu
inol
ine
Carb
azol
e Na
phth
alen
e 2-
Met
hyln
apht
hale
ne
Acen
apht
hyle
ne
Acen
apht
hene
Di
benz
ofur
an
Fluo
rene
Ph
enan
thre
ne
Anth
race
ne
Fluo
rant
hene
Py
rene
Ch
ryse
ne
Benz
o[b]
fiuor
anth
ene
Benz
o[k]
fluor
anth
ene
Benz
o[a]
pyre
ne
Inde
no[l,
2,3+
d]py
rene
Di
benz
[ah]
anth
race
ne
Benz
o[gh
i]per
ylen
e 2,
3,5,
6-Te
trach
loro
phen
ol
2,3,
4,5-
Tetra
chlo
roph
enol
2,
3,4,
6-Te
trach
loro
phen
ol
Pent
achl
orop
heno
l
a) 800 t
600
500
400 300
200
b) 6000
5000
4000
3000
2 2000
P - 1000
s 0 ‘Z E E
c) 4000
8 3500 s 3000
0 2500
2000
1500
1000
500
0
Figure 12. Histograms of the major semivolatile organic compounds present in water samples from Well S-15: (a) May 28; (b) June 30; (c) July 16; (d) December 16.
27
a) 20000
15000
10000
5000
0
b) 10000
8000
6000
60000
50000
40000
30000
20000
10000
0
d) 20000
Figure 13. Histograms of the major semivolatile organic compounds present in water samples from miscellaneous sampling sites: (a) S-13 condensed vapor (June 20); (b) S-13 condensed vapor (June 30); (c) Top of separator (June 20); (d) Treatment facility (June 30).
28
a) 35000 30000
25000
20000
15000
10000
5000
0
b) 60000 c
50000 Gravity Sep. (6/19,
Free Product
0 250
200 150
100 50
t i.!i
350 Gravity Sep. (6/l 9/97)
s 300
d) 20000 ,
Ii Daft
Figure 14. Histograms of the major semivolatile organic compounds present in miscellaneous free product samples: (a) Creosote; (b) Gravity separator (June 19); (c) Gravity separator bottom sludge (June 19); (d) DAFT (June 19).
29
a) 100000
80000
60000
40000
b) 100000
60000
40000
80000
60000
40000
d) 70000 L
Figure 15. Histograms of the major semivolatile organic compounds present in m iscellaneous free product samples: (a) DAFT free product (July 15-16); (b) DAFT free product (July 16); (c) Tank 2 free product (October 26); (d) Tank 2 emulsion (October 26).
30
a) 50000
0
b) 300000
250000
200000
150000
50000
0
12000
10000
8000
6000
4000
2000
0
6000 I 1
5000
4000
3000
2000
1000
0
Figure 16. Histograms of the major semivolatile organic compounds present in miscellaneous solid samples: (a) S-13 Wellhead crystals (June 30 Sample 1); (b) S-13 Wellhead crystals (June 30 Sample 2); (c) S-13 scale/lower (October 17); (d) S-15 scale (October 17).
31
80
20
10
1st Steam Pulse 0
I I I I I I I I
2nd Steam Pulse I /
Total Oxygenates
Total PAH
/
5000
4500
4000
3500
3000 3 3”
2500 5 D.
2000 z z
1500
1000
500
0
Figure 17. Concentrations of total oxygenates and total PAH (polycyclic aromatic hydrocarbons, EPA Method 8270C) from Well MW-36 during HP0 test period. Elevated PAH concentrations reflect enhanced mobilization due to DUS. Oxygenate increases are consistent with partial hydrocarbon oxidation by HPO.
32
180
160
940 3 %20 8 is 5 100 !2 8 80 ii “0 I- 60
1 1st Steam Pulse
. :
I’
2nd team Pulse Total Oxygenates
10000
9000
8000
7000
3 6000 3 J
5000 2 D. 3
4000 ‘j k
3000
2000
1000
0
Figure 18. Concentrations of total oxygenates and total PAH (polycyclic aromatic hydrocarbons, EPA Method 8270C) from Well S-13 during HP0 test period. Elevated PAH concentrations reflect enhanced mobilization due to DUS. Oxygenate increases are consistent with partial hydrocarbon oxidation by HPO.
33
8
7
1st Steam Pulse 2nd Steam Pulse
X
4
iX
x
Figure 19. Concentration of dissolved oxygen in Well MW-36 as a frmction of time during HP0 test. Average dissolved oxygen concentrations (open circles) were calculated using the combined values from three different analytical techniques. Dissolved-oxygen levels dropped from 4.4 ppm to 1.7 ppm during the test period.
34
-13
-14
8 P 0
9 -15 'E m t! h .Y E 'i -17 a G c-2
-z
I I I I I I I I I I I I I I I I I I
6/l 8197 \
(after 2nd steam pulse)
(after 1st steam pulse)
Creosote end-member (14C = 0 (pmc), PC = -24.9)
-20 I I I i I
70 80 90 100 14C (pmc)
110 120
Figure 20. Variations in 14C versus 613C values of dissolved inorganic carbon (DIG) in groundwater. The groundwater end-member value was the isotopic signature prior to steaming. The DIC became “older” after steaming, consistent with the production of DIC by the oxidation of “dead” creosote carbon.
35
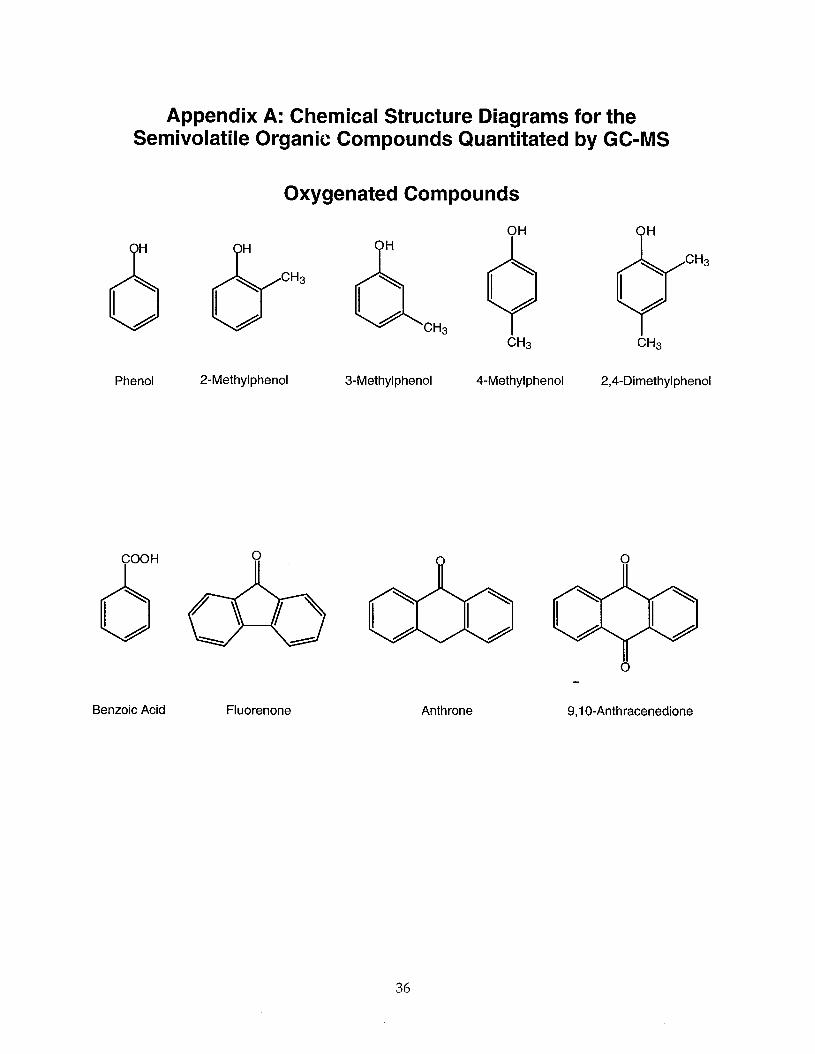
Appendix A: Chemical Structure Diagrams for the Semivolatile Organic Compounds Quantitated by GC-MS
Oxygenated Compounds
$ bH3 hCH3 4 CH3
Phenol 2-Methylphenol 3-Methylphenol 4-Methylphenol 2,4-Dimethylphenol
Benzoic Acid Fluorenone Anthrone 9,10-Anthracenedione
36
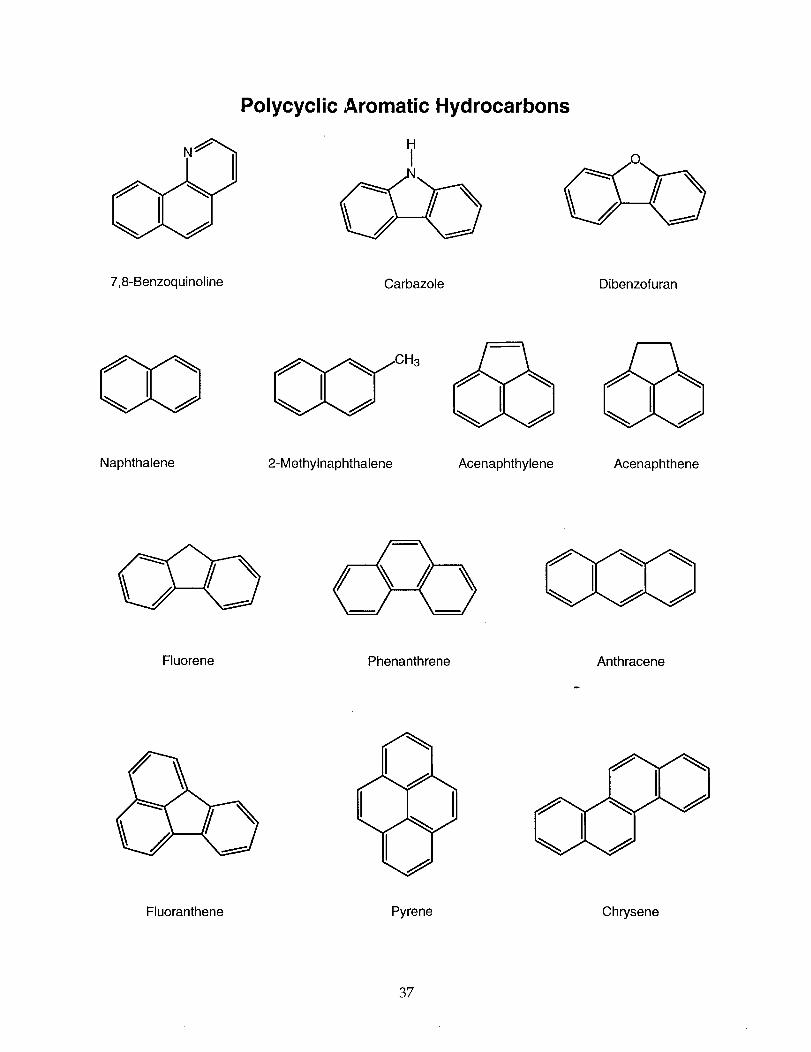
Polycyclic Aromatic Hydrocarbons
N’
I 09 / \
I \ /
7,8-Benzoquinoline
‘i’
60 I \ c&l I \ Carbazole Dibenzofuran
Naphthalene 2-Methylnaphthalene Acenaphthylene Acenaphthene
Fluorene Phenanthrene Anthracene
Fluoranthene Pyrene Chrysene
37
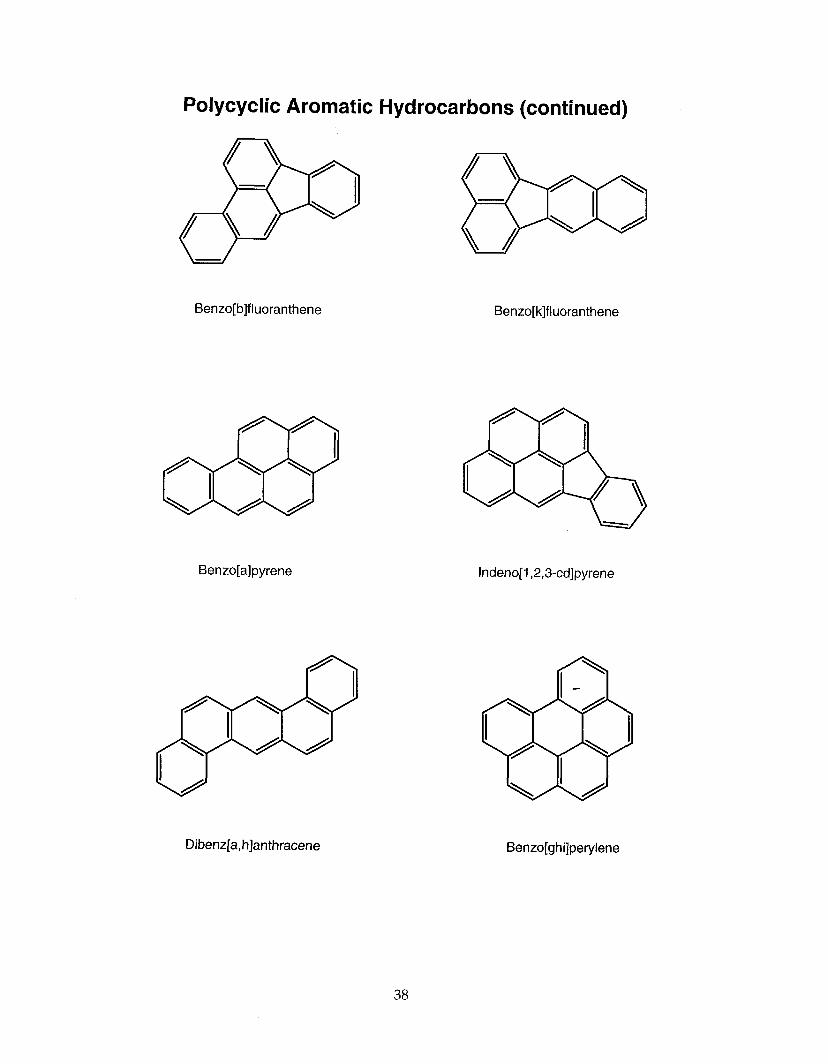
Polycyclic Aromatic Hydrocarbons (continued)
Benzo[b]fluoranthene
Benzo[a]pyrene Indeno[l,2,3-cdlpyrene
Dibenz[a,h]anthracene Benzo[ghi]perylene
38
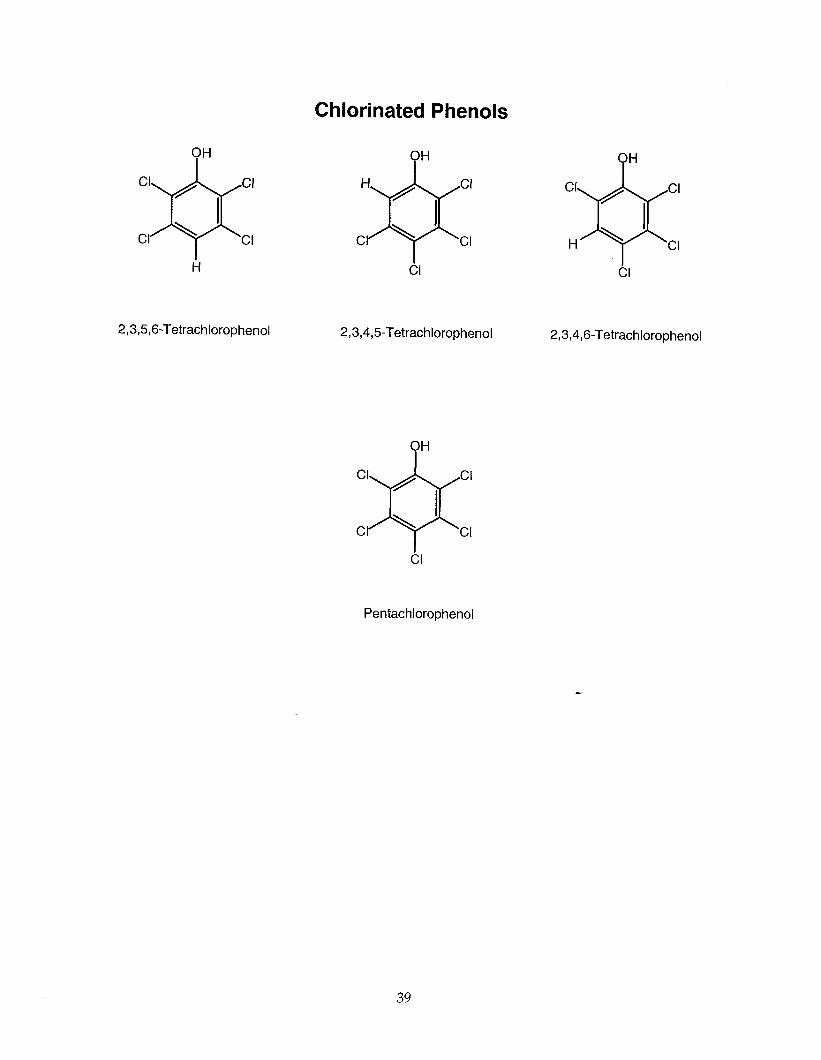
Chlorinated Phenols
2,3,5,6-Tetrachlorophenol 2,3,4,5Tetrachlorophenol 2,3,4,6-Tetrachlorophenol
OH
Pentachlorophenol
39
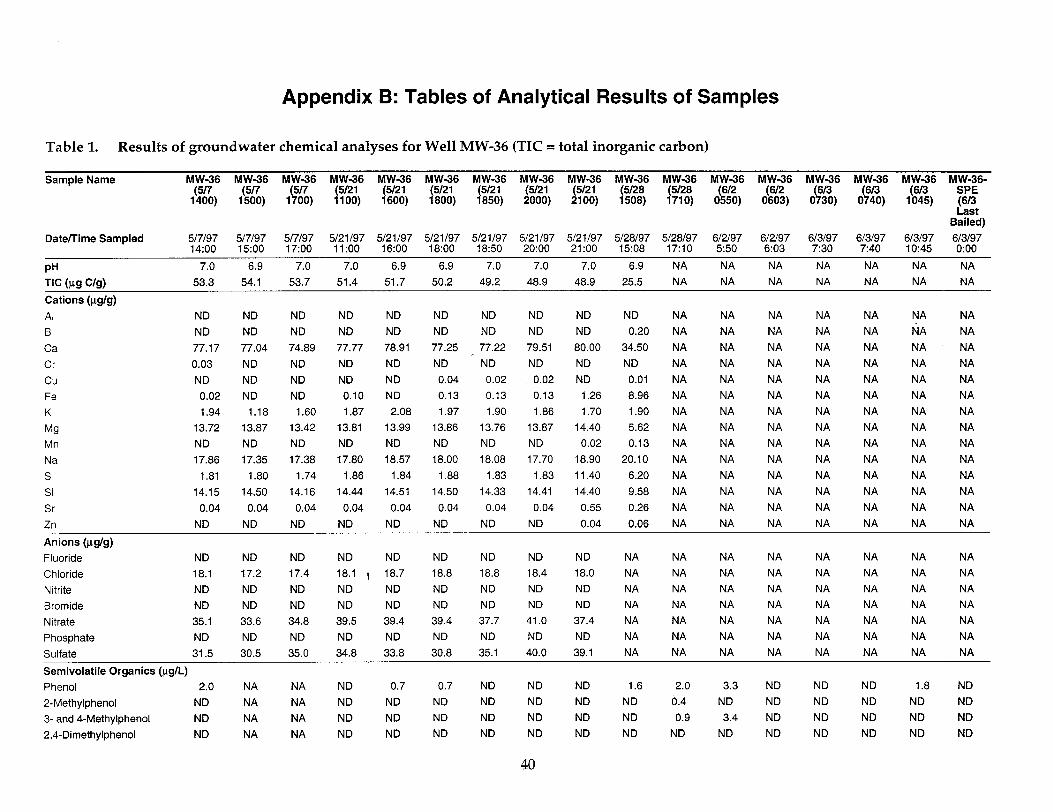
Appendix B: Tables of Analytical Results of Samples
Table 1. Results of groundwater chemical analyses for Well MW-36 (TIC = total inorganic carbon)
Sample Name
Date/Time Sampled
PH TIC (!-a C/g)
MW-36 MW-36 MW-36 MW-36 MW-36 MW-36 MW36 MW-36 MW-36 MW-36 MW-36 MW-36 MW-36 MW-36 MW-36 MW-36 MW-36- (5R
lY& (5/7 (5121 (5/21 (5121 (5/21 (5/21 (5121 (5128 (612 (612 (613 W3 SPE
1400) 1700) 1100) 1600) 1800) 1850) 2000) 2100) E) 1710) 0550) 0603) 0730) 0740) l%) E
Bailed) 517197 %f; ;:I99 5;:1;;7 “:‘$;y 5:‘8.‘;7 5121197 5/21/97 5l21l97 5128197 5128197 6l2l97 6l2l97 613197 613197 613197 613197 14:oo . 18:50 20:oo 21:oo 15:08 17:lO 5:50 6:03 7:30 7:40 10:45 0:oo
7.0 6.9 7.0 7.0 6.9 6.9 7.0 7.0 7.0 6.9 NA NA NA NA NA NA NA 53.3 54.1 53.7 51.4 51.7 50.2 49.2 48.9 48.9 25.5 NA NA NA NA NA NA NA
Cations @g/g) Al B Ca Cr cu Fe K
M9 Mn Na S Si Sr Zn
ND ND ND ND 77.17 77.04 0.03 ND ND ND
0.02 ND 1.94 1.18
13.72 13.87 ND ND 17.86 17.35
1.81 1.80 14.15 14.50
0.04 0.04 ND ND
ND ND 74.89 ND ND ND
1.60 13.42 ND 17.38
1.74 14.16
0.04 ND
ND ND ND ND ND ND 77.77 78.91 77.25 ND ND ND ND ND 0.04
0.10 ND 0.13 1.87 2.08 1.97
13.81 13.99 13.86 ND ND ND 17.80 18.57 18.00
1.86 1.84 1.88 14.44 14.51 14.50
0.04 0.04 0.04 ND ND ND
Anions @g/g) Fluoride Chloride Nitrite Bromide Nitrate
Phosphate
ND ND ND ND ND 18.1 17.2 17.4 18.1 , 18.7 ND ND ND ND ND ND ND ND ND ND 35.1 33.6 34.8 39.5 39.4 ND ND ND ND ND
-
ND ND ND ND 77.22 79.51 ND ND
0.02 0.02 0.13 0.13 1.90 1.86
13.76 13.87 ND ND 18.08 17.70
1.83 1.83 14.33 14.41
0.04 0.04 ND ND
ND ND ND 0.20 80.00 34.50 ND ND ND 0.01
1.26 8.96 1.70 1.90
14.40 5.62 0.02 0.13
18.90 20.10 11.40 6.20 14.40 9.58
0.55 0.26 0.04 0.06
NA NA NA NA NA NA NA NA NA NA NA NA NA NA NA NA NA NA NA NA NA NA NA NA NA NA NA NA NA NA NA NA NA NA NA NA NA NA NA NA NA NA NA NA NA NA NA NA NA NA NA NA NA NA NA NA NA NA NA NA NA NA NA NA NA NA NA NA NA NA NA NA NA NA NA NA NA NA NA NA NA NA NA NA NA NA NA NA NA NA NA NA NA NA NA NA NA NA
ND ND ND ND NA NA NA NA NA NA NA NA 18.8 18.8 18.4 18.0 NA NA NA NA NA NA NA NA ND ND ND ND NA NA NA NA NA NA NA NA ND ND ND ND NA NA NA NA NA NA NA NA 39.4 37.7 41 .o 37.4 NA NA NA NA NA NA NA NA ND ND ND ND NA NA NA NA NA NA NA NA
Sulfate 31.5 30.5 35.0 34.8 33.8 30.8 35.1 40.0 39.1 NA NA NA NA NA NA NA NA
Semivolatile Organics @g/L) Phenol 2.0 NA NA ND 0.7 0.7 ND ND ND 1.6 2.0 3.3 ND ND ND 1.8 ND 2-Methylphenol ND NA NA ND ND ND ND ND ND ND 0.4 ND ND ND ND ND ND 3- and 4-Methylphenol ND NA NA ND ND ND ND ND ND ND 0.9 3.4 ND ND ND ND ND 2,4-Dimethylphenol ND NA NA ND ND ND ND ND ND ND ND ND ND ND ND ND ND
40
W (5/7 (5/7 (5121 (5121 1400) 1500) 1700) 1100)
(5/21 (5/21 1600) 1800) 1850)
Date/Time Sampled 517197 517197 517197 5121197 5121197 5121197 5121197 14:oo 15:oo 17:oo 11 :oo 16:00 18:00 18:50
ND ND Benzoic acid Fluorenone Anthrone 9,10-Anthracenedione 7,8-Benzoquinoline Carbazole Naphthalene 2-Methylnaphthalene Acenaphthylene Acenaphthene Dibenzofuran Fluorene Phenanthrene Anthracene Fluoranthene Pyrene Chrysene Benzo[b]fluoranthene Benzo[k]fluoranthene Benzo[a]pyrene Indeno[l,2,3-cdlpyrene Dibenz[ah]anthracene Benzo[ghi]perylene 2,3,5,6-Tetrachlorophenol 2,3,4,5Tetrachlorophenol 2,3,4,6-Tetrachlorophenol Pentachlorophenol
ND ND ND ND ND ND ND ND ND ND ND ND ND ND ND ND ND ND ND ND ND ND ND ND ND ND
0.4
NA NA NA NA NA NA NA NA NA NA NA NA NA NA NA NA NA NA NA NA NA NA NA NA NA NA NA
NA NA NA NA NA NA NA NA NA NA NA NA NA NA NA NA NA NA NA NA NA NA NA NA NA NA NA
ND 0.4
ND ND ND ND
5.2 ND ND ND ND ND
2.9 0.2
ND ND ND ND ND ND ND ND ND ND ND ND
ND 0.6
ND ND ND ND
4.8 ND ND
4.1 ND ND
5.8 0.4
ND ND ND ND ND ND ND ND ND ND ND ND
ND ’ ND
0.5 ND ND ND ND 4.5
ND ND 4.1
ND ND 4.6 0.4
ND ND ND ND ND ND ND ND ND ND ND ND ND
0.6 ND ND ND ND 4.5
ND ND
4.7 ND ND
5.4 0.4
ND ND ND ND ND ND ND ND ND ND ND ND ND
Sample Name MW-36 MW-36 MW-36 MW-36 MW-36 MW-36 MW-36 MW-36 MW-36 MW-36 MW-36 MW-36 MW-36 MW-36 MW-36 MW-36 MW-36- (5/21 (5121 2000)
(5128 (5/28 (612 (6/2 W3 2100) 1508) 1710) 0550)
(613 W3 SPE 0603) 0730) 0740) 1045)
Eft Bailed)
5121197 5121197 5128197 5128197 6l2l97 6l2l97 613197 613197 613197 613197 20:oo 21:oo 15:08 17:lO 5:50 6:03 7:30 ; 7.40 10:45 0:oo
ND 0.5
ND ND ND ND
5.4 ND ND ND ND ND ND ND ND ND ND ND ND ND ND ND ND ND ND ND ND
ND 0.4
ND ND ND ND
4.7 ND ND
3.9 ND ND 5.1 0.3
ND ND ND ND ND ND ND ND ND ND ND ND
0.2
ND 8.2 11.6 27.4 ND ND
2.1 4.7 3.0 6.1
43.3 96.1 14.6 17.6
8.9 6.6 ND 1.8 13.9 28.7 18.5 43.1 17.6 49.7
127.5 347.5 19.0 65.3 21.6 72.0 17.3 58.3 ND ND ND ND ND ND ND ND ND ND ND ND ND ND ND ND ND ND ND ND 2.6 4.9
48.3 15.2 ND 2.0 4.1
45.8 13.0
6.3 1.5
16.4 20.3 18.9 90.1 14.7
9.8 7.5
ND ND ND ND ND ND ND ND ND ND
5.0
ND 33.8 3.0 5.2 4.4
78.0 33.6
9.5 2.3
35.0 41.5 41.3
341.3 52.1 65.6 49.6 ND ND ND ND ND ND ND ND ND ND
4.4
ND 26.4 ND
3.9 ND 45.1 24.2
8.6 ND 22.3 26.1 24.2
144.3 20.5 14.3 10.2 ND ND ND ND ND ND ND ND ND ND
2.7
ND 16.9 24.3 37.7 ND ND
3.6 5.8 3.4 5.4
63.2 80.1 25.2 40.9
7.7 15.8 ND ND 24.4 48.5 31.3 49.0 30.1 50.8
223.8 565.0 35.0 96.7 24.6 184.2 19.5 162.9 ND 11.1 ND 0.7 ND ND ND 0.5 ND ND ND ND ND ND ND ND ND ND ND ND
3.0 4.2
ND 11.4 ND ND ND ND 17.1 ND ND ND ND 24.1
300.4 43.0
115.4 78.5 ND ND ND ND ND ND ND ND ND ND ND
Total Oxygenates @g/L) 2 - - 0 1 1 1 0 0 15 44 72 42 30 28 62 11 Total PAH (PglL) 0 - - 8 15 14 15 5 14 305 793 248 754 340 488 1311 579 Total Cl-Phenols (@g/L) 0 - - 0 0 0 0 0 0 3 5 5 4 3 3 4 0 Total GC-MS (pg/L) 2 - - 9 16 15 16 6 15 323 841 326 801 373 519 1378 590
% Oxygenates 81.6 - - 4.2 7.5 8.1 4.0 7.8 3.0 4.7 5.2 22.2 5.2 8.1 5.4 4.5 1.9
41
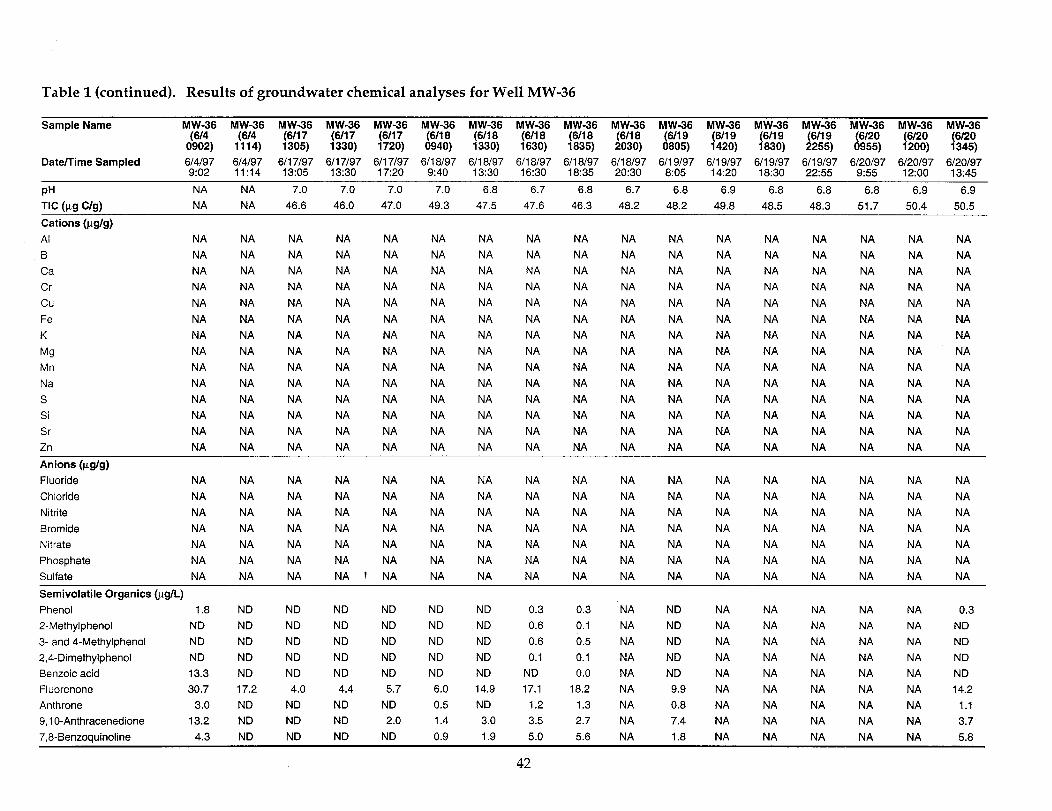
Table 1 (continued). Results of groundwater chemical analyses for Well MW-36
Sample Name
Date/Time Sampled
MW-36 Mw-36 MW-36 MW-36 MW-36 MW-36 MW-36 MW-36 MW-36 y;F86 MW-36 MW-36 MW-36 MW-36 MW-36 MW-36 MW-36 (614 (6117 (6117 (6117 (6118 (6/l 8 (6/l 8 (6/l 8
1305) 1330) 1720) 0940) 1330) 1630) (6119 (6/l 9 (6/l 9 (6/l 9 (6120
1114) 1835) 2030) 0805) 1420) 1830) 2255) (6120 (6120
0955) 1200) 1345) 614197 614197 6117197 6117197 6117197 6118197 6118197 6118197 6118197 6118197 6119197 6119197 6119197 6119197 6120197 6120197 6120197 9:02 11:14 13:05 13:30 17:20 9:40 13:30 16:30 18:35 20:30 8:05 14:20 18:30 22:55 9:55 12:oo 13:45
PH NA NA 7.0 7.0 7.0 7.0 6.8 6.7 6.8 6.7 6.8 6.9 6.8 6.8 6.8 6.9 6.9 TIC bg C/d NA NA 46.6 46.0 47.0 49.3 47.5 47.6 46.3 48.2 48.2 49.8 48.5 48.3 51.7 50.4 50.5
Cations (kg/g) Al B Ca Cr cu Fe K
Mg Mn Na S Si Sr Zn
Anions @g/g) Fluoride Chloride Nitrite Bromide Nitrate Phosphate Sulfate
NA NA NA NA NA NA NA NA NA NA NA NA NA NA NA NA NA NA NA NA NA NA NA NA NA NA NA NA NA NA NA NA NA NA NA NA NA NA NA NA NA NA
NA NA NA NA NA NA NA NA NA NA NA NA NA NA NA NA NA NA NA NA NA
NA NA NA NA NA NA NA NA NA NA NA NA NA NA NA NA NA NA NA NA NA NA NA NA NA NA NA NA
NA NA NA NA NA NA NA
NA NA NA NA NA NA NA NA NA NA NA NA NA NA
NA NA NA NA NA NA NA NA NA NA NA NA NA NA
NA NA NA NA NA NA NA NA NA NA NA NA NA NA
NA NA NA NA NA NA
I NA
NA NA NA NA NA NA NA
NA NA NA NA NA NA NA
NA NA NA NA NA NA NA
NA NA NA NA NA NA NA NA NA NA NA NA NA NA
NA NA NA NA NA NA NA
NA NA NA NA NA NA NA NA NA NA NA NA NA NA NA NA NA NA NA NA NA NA NA NA NA NA NA NA NA NA NA NA NA NA NA NA NA NA NA NA NA NA NA NA NA NA NA NA NA NA NA NA NA NA NA NA NA NA NA NA NA NA NA NA NA NA NA NA NA NA
NA NA NA NA NA NA NA NA NA NA NA NA NA NA NA NA NA NA NA NA NA NA NA NA NA NA NA NA NA NA NA NA NA NA NA
NA NA NA NA NA NA NA NA NA NA NA NA NA NA
NA NA NA NA NA NA NA
NA NA NA NA NA NA NA NA NA NA NA NA NA NA NA NA NA NA NA NA NA NA NA NA NA NA NA NA
NA NA NA NA NA NA NA NA NA NA NA NA NA NA
Semivolatile Organics (&L) Phenol 1.8 2-Methylphenol ND 3- and 4-Methylphenol ND 2,4-Dimethylphenol ND Benzoic acid 13.3 Fluorenone 30.7 Anthrone 3.0 9,10-Anthracenedione 13.2 7,8-Benzoquinoline 4.3
ND ND ND ND ND 17.2 ND ND ND
ND ND ND ND ND ND ND ND ND ND
4.0 4.4 ND ND ND ND ND ND
ND ND ND ND ND
5.7 ND
2.0 ND
ND ND ND ND ND
6.0 0.5 1.4 0.9
ND ND ND ND ND 14.9 ND
3.0 1.9
0.3 0.3 NA ND NA NA NA NA NA 0.6 0.1 NA ND NA NA NA NA NA 0.6 0.5 NA ND NA NA NA NA NA 0.1 0.1 NA ND NA NA NA NA NA
ND 0.0 NA ND NA NA NA NA NA 17.1 18.2 NA 9.9 NA NA NA NA NA
1.2 1.3 NA 0.8 NA NA NA NA NA 3.5 2.7 NA 7.4 NA NA NA NA NA 5.0 5.6 NA 1.8 NA NA NA NA NA
0.3 ND ND ND ND 14.2
1.1 3.7 5.8
42
Sample Name MW-36 MW-36 MW-36 MW-36 MW-36 MW-36 MW-36 MW-36 MW-36 MW-36 MW-36 MW-36 MW-36 MW-36 MW-36 MW-36 MW-36 IMA (SIP \-. . iSI1 7 \-. . . (fill 7 \-. . . i6ll7 (6/l 8
1114) (6/l 8 (6/l 8 (6/l 8 (6/l 8
1305) 1330) 1330) 1630) 1835) (6/l 9 (6/l 9 (6/l 9 (6/l 9
2030) 0805) 1420) 1830) (6/20 (6/20 (6/20
2255) 0955) 1200) 1345) \-. . . 1720) 0940)
Date/Time Sampled
Carbazole Naphthalene 2-Methylnaphthalene Acenaphthylene Acenaphthene Dibenzofuran Fluorene Phenanthrene Anthracene Fluoranthene Pyrene Chrysene Benzo[b]fluoranthene Benzo[k]fluoranthene Benzo[a]pyrene Indeno[l,2,3-cdlpyrene Dibenz[ah]anthracene Benzo[ghi]perylene 2,3,5,6-Tetrachlorophenol 2,3,4,5-Tetrachlorophenol 2,3,4,6-Tetrachlorophenol Pentachlorophenol
\-. 0902) 614197 9:02
47.3 34.9 13.8
2.5 35.4 34.1 38.5
404.0 55.1
103.4 78.7 ND ND ND ND ND ND ND ND ND ND
7.2
614197 11:14
30.3 17.4 ND ND 20.4 21.6 22.0
335.3 50.9 69.1 53.0 ND ND ND ND ND ND ND ND ND ND
1.9
- 6/l 7197 13:05
4.2 12.0
2.3 ND
7.7 6.4 7.7
103.8 19.4 29.3 18.3 ND ND ND ND ND ND ND ND ND ND
1.5
5.6 15.8
5.8 0.3 8.9 7.3 8.6
119.6 22.5 35.1 21.2 ND ND ND ND ND ND ND ND ND ND
1.8
- 6/l 7197
17:20
5.7 12.5
2.3 0.3 9.2 7.6 9.2
122.5 22.8 36.2 21.5
0.5 ND ND ND ND ND ND ND ND ND
3.5
6/l 8197 9:40
7.0 9.8 2.1 0.4
11.0 10.0 10.2 88.7 24.7 41.3 27.7
0.7 ND ND ND ND ND ND ND ND ND
1.3
6118197 6118197 6118197 6118197 6119197 6/l 9197 6119197 6119197 6120197 6120197 6120197 13:30 16~30 18135 20:30 8105 14:20 18~30 22155 9155 12:oo 13145 - 20.7 61.7
6.1 1.0
20.1 17.2 17.1
173.6 32.1 50.5 31.2
0.7 ND ND ND ND ND ND ND ND ND
3.0
24.5 30.9
3.8 1.5
19.6 17.5 16.9
114.9 32.3 52.8 35.3
0.9 ND ND ND ND ND ND ND ND ND 2.8
25.3 32.7
5.4 1.6
21.6 20.2 19.0
119.3 39.4 58.0 38.2
1.1 ND ND ND ND ND ND ND ND ND
3.3
NA NA NA NA NA NA NA NA NA NA NA NA NA NA NA NA NA NA NA NA NA NA
7.8 10.2
3.9 1.0
19.9 24.7 20.3
113.4 8.0
25.1 41.4
1.8 ND ND ND ND ND ND ND ND ND
1.0
NA NA NA NA NA NA NA NA NA NA NA NA NA NA NA NA NA NA NA NA NA NA
NA NA NA NA NA NA NA NA NA NA NA NA NA NA NA NA NA NA NA NA NA NA
NA NA NA NA NA NA NA NA NA NA NA NA NA NA NA NA NA NA NA NA NA NA
NA NA NA NA NA NA NA NA NA NA NA NA NA NA NA NA NA NA NA NA NA NA
NA NA NA NA NA NA NA NA NA NA NA NA NA NA NA NA NA NA NA NA NA NA
10.1 10.4 12.8
2.5 60.6 92.4 75.9
425.5 77.2
196.9 154.8
6.9 ND ND
1.5 ND ND ND ND ND ND
1.0 Total Oxygenates @g/L) 62 17 4 4 8 8 18 23 23 18 - - 19 Total PAH @g/L) 852 620 211 251 250 235 434 356 387 - 279 - - - 1133 Total Cl-Phenols @g/L) 7 2 2 2 3 1 3 3 3 - 1 - - 1 Total GC-MS Q.&L) 921 639 216 257 261 244 455 382 414 - 298 - 1153 % Oxygenates 6.7 2.7 1.9 1.7 2.9 3.2 3.9 6.1 5.6 - 6.1 _ _ _ _ - 1.7
43
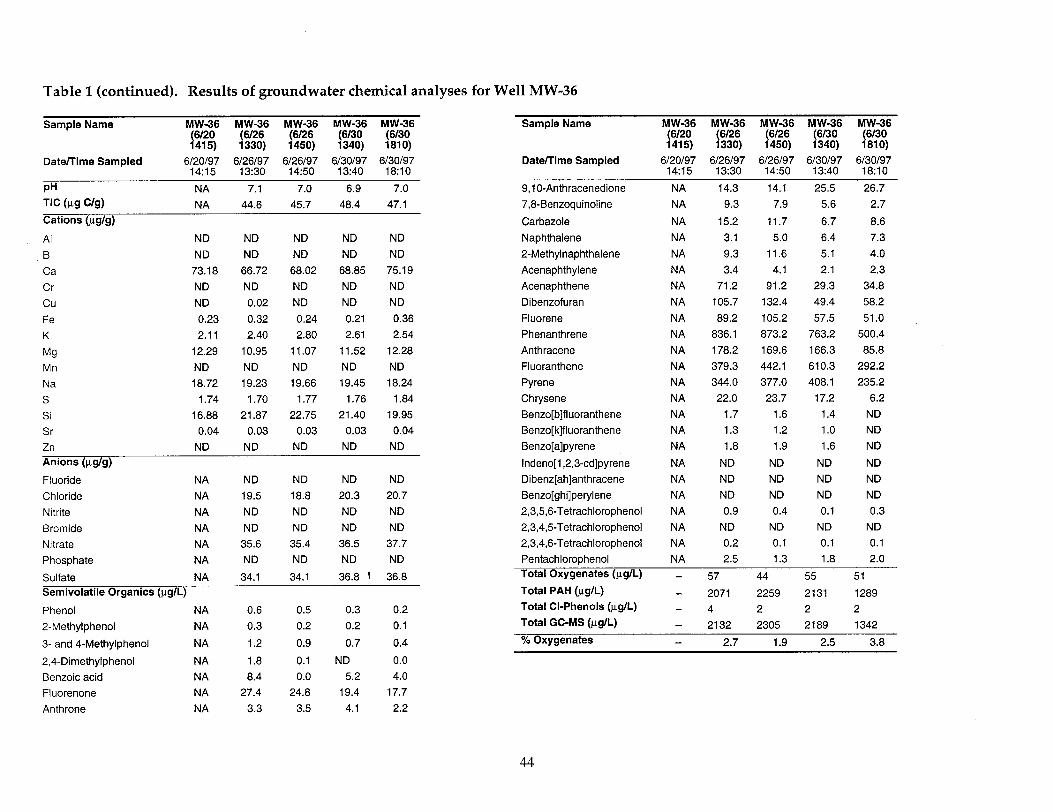
Table 1 (continued). Results of groundwater chemical analyses for Well MW-36
Sample Name MW-36 MW-36 MW-36 MW-36 MW-36 Sample Name MW-36 MW-36 MW-36 MW-36 MW-36 (6/20
!Eg) (6126 (6130 (6130 (6120 (6126 (6/26 (6/30 (6130
1415) 1450) 1340) 1810) 1415) 1330) 1450) 1340) 1810) 6126197 6126197 6130197 6113gq;907 Date/Time Sampled 6120197 6126197 6126197 6130197 6130197
13:30 14:50 13:40 . 14:15 13:30 14:50 13:40 18:lO - Date/Time Sampled
PH TIC (m W Cations @g/g)
Al B Ca Cr cu Fe K
Mg Mn Na S Si Sr Zn
6120197 14:15
NA NA
ND ND
73.18 ND ND 0.23 2.11
12.29 ND 18.72
1.74 16.88
0.04 ND
7.1 7.0 6.9 7.0 9,10-Anthracenedione 44.6 45.7 48.4 47.1
ND ND ND ND ND ND ND ND
66.72 68.02 68.85 75.19 ND ND ND ND 0.02 ND ND ND 0.32 0.24 0.21 0.36 2.40 2.80 2.61 2.54
10.95 11.07 11.52 12.28 ND ND ND ND 19.23 19.66 19.45 18.24
1.70 1.77 1.76 1.84 21.87 22.75 21.40 19.95
0.03 0.03 0.03 0.04 ND ND ND ND
7,8-Benzoquinoline
Carbazole Naphthalene 2-Methylnaphthalene Acenaphthylene Acenaphthene Dibenzofuran Fluorene Phenanthrene Anthracene Fluoranthene Pyrene Chrysene Benzo[b]fluoranthene Benzo[k]fluoranthene Benzo[a]pyrene
Anions @g/g)
Fluoride Chloride Nitrite Bromide Nitrate Phosphate
NA NA NA NA NA NA
ND 19.5 ND ND
35.6 ND
ND 18.8 ND ND
35.4 ND
ND ND 20.3 20.7 ND ND ND ND
36.5 37.7 ND ND
Indeno[l,2,3-cdlpyrene Dibenz[ah]anthracene Benzo[ghi]perylene 2,3,5,6-Tetrachlorophenol 2,3,4,5-Tetrachlorophenol 2,3,4,6-Tetrachlorophenol Pentachlorophenol
NA NA
NA NA NA NA NA NA NA NA NA NA NA NA NA NA NA
NA NA NA NA NA NA NA
14.3 9.3
15.2 3.1 9.3 3.4
71.2 105.7
89.2 836.1 178.2 379.3 344.0
22.0 1.7 1.3 1.8
ND ND ND 0.9
ND 0.2 2.5
14.1 25.5 7.9 5.6
11.7 6.7 5.0 6.4
11.6 5.1 4.1 2.1
91.2 29.3 132.4 49.4 105.2 57.5 873.2 763.2 169.6 166.3 442.1 610.3 377.0 408.1
23.7 17.2 1.6 1.4 1.2 1.0 1.9 1.6
ND ND ND ND ND ND 0.4 0.1
ND ND 0.1 0.1 1.3 1.8
26.7 2.7
8.6 7.3 4.0 2.3
34.8 58.2 51.0
500.4 85.8
292.2 235.2
6.2 ND ND ND
ND ND ND 0.3
ND 0.1 2.0
Sulfate Semivolatlle Organics @g/L)
Phenol 2-Methylphenol
3- and 4-Methylphenol
2,4-Dimethylphenol Benzoic acid Fluorenone Anthrone
NA
NA NA
NA
NA NA NA NA
34.1 34.1
0.6 0.5 0.3 0.2
1.2 0.9
36.8 1 36.8 Total Oxygenates (pg/L) - 57 44 55 51 Total PAH @g/L) 2071 2259 2131 1289
0.3 0.2 Total Cl-Phenols @g/L) - 4 2 2 2 0.2 0.1 Total GC-MS @g/L) 2132 2305 2189 1342
0.7 0.4 % Oxygenates 2.7 1.9 2.5 3.8
1.8 0.1 ND 0.0 8.4 0.0 5.2 4.0
27.4 24.8 19.4 17.7 3.3 3.5 4.1 2.2
44
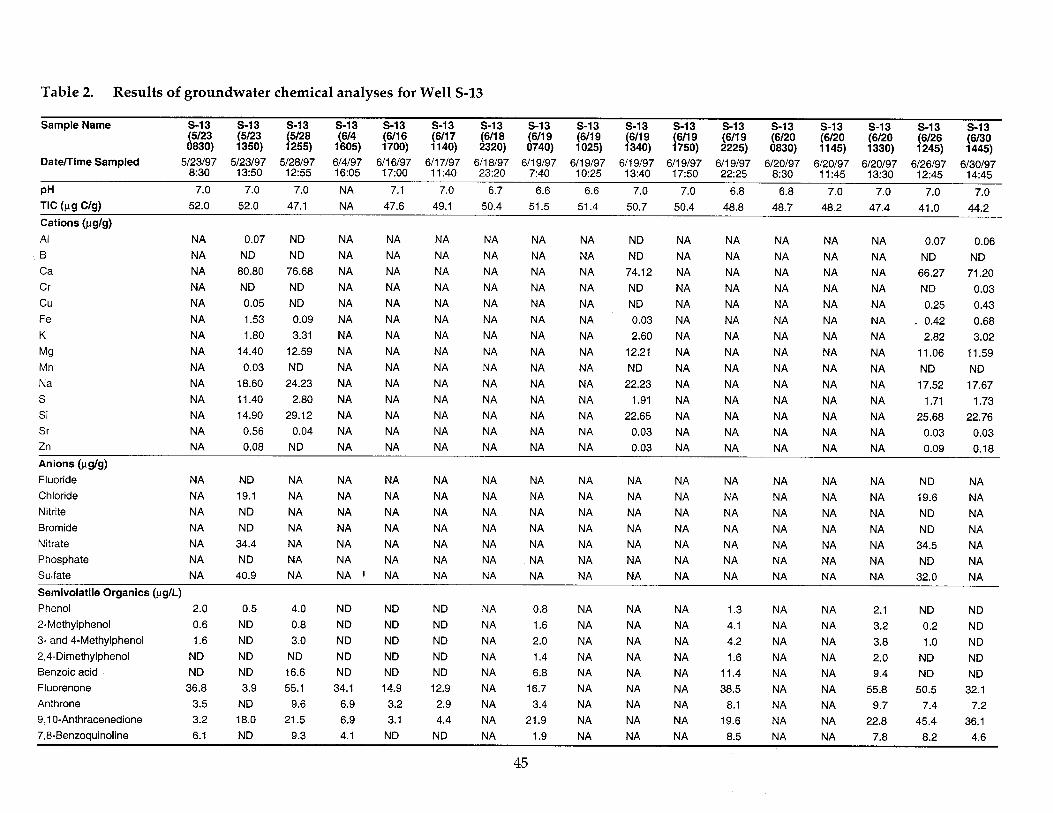
Table 2. Results of groundwater chemical analyses for Well S-13
Sample Name s-13 s-13 s-13 s-13 s-13 s-13 s-13 s-13 s-13 s-13 s-13 s-13 s-13 s-13 s-13 S-l 3 s-13 (5123 (5123 (5128 0830) 1350)
(614 (6/16 (6117 (6/l 8 1255) 1605) 1700) 1140)
(6/l 9 (6/l 9 2320) 0740)
(6/l 9 (6/l 9 1025) 1340)
(6/l 9 (6/20 1750) 2225)
(6120 0830) 1145)
(6/20 (6126 1330)
(6130 1245) 1445)
Date/Time Sampled 5123197 5123197 5128197 614197 6116197 6/l 7197 6118197 6119197 “(W”5’ 6119197 6119197 6/l 9197 6120197 6120197 6120197 6126197 6130197 8:30 13:50 12:55 16:05 17:oo 11:40 23:20 7:40 . 13:40 17:50 22:25 8:30 11:45 13:30 12:45 14:45
PH 7.0 7.0 7.0 NA 7.1 7.0 6.7 6.6 6.6 7.0 7.0 6.8 6.8 7.0 7.0 7.0 7.0
TIC @g W 52.0 52.0 47.1 NA 47.6 49.1 50.4 51.5 51.4 50.7 50.4 48.8 48.7 48.2 47.4 41.0 44.2 Cations (kg/g) Al
.B Ca Cr cu Fe K
Mg Mn Na S Si Sr Zn
Anions @g/g) Fluoride Chloride Nitrite Bromide Nitrate Phosphate Sulfate
NA 0.07 NA ND NA 80.80 NA ND NA 0.05 NA 1.53 NA 1.80 NA 14.40 NA 0.03 NA 18.60 NA 11.40 NA 14.90 NA 0.56 NA 0.08
ND ND
76.68 ND ND 0.09 3.31
12.59 ND
24.23 2.80
29.12 0.04
ND
NA NA NA NA NA NA NA NA NA NA NA NA NA NA NA NA NA NA NA NA NA NA NA NA NA NA NA NA NA NA NA NA NA NA NA NA NA NA NA NA NA NA NA NA NA NA NA NA NA NA NA NA NA NA NA NA NA NA NA NA NA NA NA NA NA NA NA NA NA NA NA NA NA NA NA NA NA NA NA NA NA NA NA NA
ND NA NA NA NA NA ND NA NA NA NA NA
74.12 NA NA NA NA NA ND NA NA NA NA NA ND NA NA NA NA NA 0.03 NA NA NA NA NA 2.60 NA NA NA NA NA
12.21 NA NA NA NA NA ND NA NA NA NA NA
22.23 NA NA NA NA NA 1.91 NA NA NA NA NA
22.65 NA NA NA NA NA 0.03 NA NA NA NA NA 0.03 NA NA NA NA NA
0.07 0.06 ND ND
66.27 71.20 ND 0.03 0.25 0.43 0.42 0.68 2.82 3.02
11.06 11.59 ND ND
17.52 17.67 1.71 1.73
25.68 22.76 0.03 0.03 0.09 0.18
NA ND NA NA NA NA NA NA NA NA NA NA NA NA NA ND NA NA 19.1 NA NA NA NA NA NA NA NA NA NA NA NA NA 19.6 NA NA ND NA NA NA NA NA NA NA NA NA NA NA NA NA ND NA NA ND NA NA NA NA NA NA NA NA NA NA NA NA NA ND NA NA 34.4 NA NA NA NA NA NA NA NA NA NA NA NA NA 34.5 NA NA ND NA NA NA NA NA NA NA NA NA NA NA NA NA ND NA NA 40.9 NA NA 1 NA NA NA NA NA NA NA NA NA NA NA 32.0 NA
Semivolatile Organics (PglL) Phenol 2.0 0.5 4.0 2-Methylphenol 0.6 ND 0.8 3- and 4-Methylphenol 1.6 ND 3.0 2,4-Dimethylphenol ND ND ND Benzoic acid ND ND 16.6 Fluorenone 36.8 3.9 55.1 Anthrone 3.5 ND 9.6 9,10-Anthracenedione 3.2 18.0 21.5
ND ND ND ND ND
34.1 6.9 6.9
ND ND ND ND ND
14.9 3.2 3.1
ND ND ND ND ND 12.9
2.9 4.4
NA 0.8 NA NA 1.6 NA NA 2.0 NA NA 1.4 NA NA 6.8 NA NA 16.7 NA NA 3.4 NA NA 21.9 NA
NA NA 1.3 NA NA 4.1 NA NA 4.2 NA NA 1.6 NA NA 11.4 NA NA 38.5 NA NA 8.1 NA NA 19.6
NA NA 2.1 ND NA NA 3.2 0.2 NA NA 3.8 1.0 NA NA 2.0 ND NA NA 9.4 ND NA NA 55.8 50.5 NA NA 9.7 7.4 NA NA 22.8 45.4
ND ND ND ND ND
32.1 7.2
36.1
7,8-Benzoquinoline 6.1 ND 9.3 4.1 ND ND NA 1.9 NA NA NA 8.5 NA NA 7.8 8.2 4.6
45
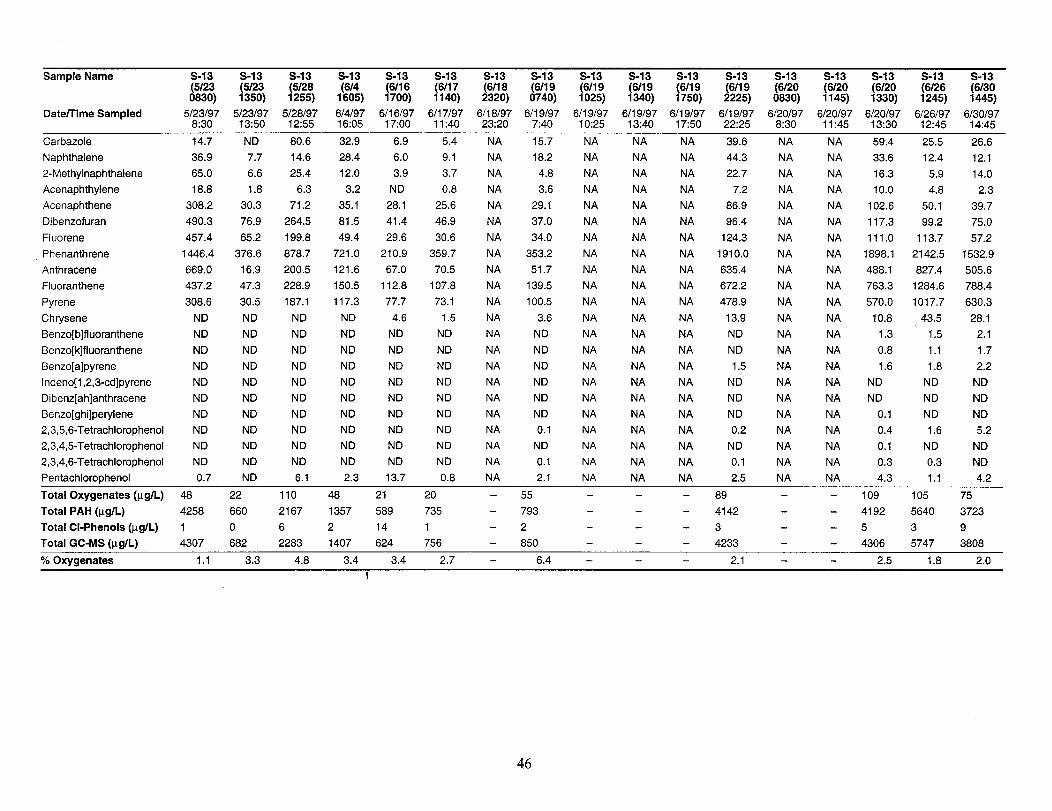
Sample Name s-13 s-13 s-13 s-13 s-13 s-13 s-13 s-13 s-13 s-13 s-13 s-13 s-13 s-13 s-13 s-13 s-13 (5123 (5123 (5128 (614 (6/16 (6117 (6118 (6119 (6/19 (6/l 9 0830) 1350) 1255) 1605) 1700) 1140) 2320) 0740) 1025)
(6/l 9 (6/l 9 (6120 (6120 (6120 (6126 (6130 1340) 1750) 2225) 0830) 1145) 1330) 1245) 1445)
Date/Time Sampled 5123197 5123197 5128197 ;l4B; 6;;6;;7 6117197 6&W/!7 6119197 6119197 6119197 6119197 6119197 6120197 6120197 6120197 6126197 6130197 8:30 13:50 12:55 ’ 11:40 . 7:40 lo:25 13:40 17:50 22:25 8:30 11:45 13:30 12:45 14:45
Carbazole Naphthalene 2-Methylnaphthalene Acenaphthylene Acenaphthene Dibenzofuran Fluorene Phenanthrene Anthracene Fluoranthene Pyrene Chrysene Benzo[b]fluoranthene Benzo[k]fluoranthene Benzo[a]pyrene Indeno[l,2,3od]pyrene Dibenz[ah]anthracene Benzo[ghi]perylene 2,3,5,6-Tetrachlorophenol 2,3,4,5-Tetrachlorophenol 2,3,4,6-Tetrachlorophenol
14.7 36.9 65.0 18.8
308.2 490.3 457.4
1446.4 669.0 437.2 308.6
ND ND ND ND ND ND ND ND ND ND
Pentachlorophenol 0.7
ND 7.7 6.6 1.8
30.3 76.9 65.2
376.6 16.9 47.3 30.5 ND ND ND ND ND ND ND ND ND ND ND
80.6 14.6 25.4
6.3 71.2
264.5 199.8 878.7 200.5 228.9 187.1
ND ND ND ND ND ND ND ND ND ND 6.1
32.9 28.4 12.0
3.2 35.1 81.5 49.4
721 .O 121.6 150.5 117.3
ND ND ND ND ND ND ND ND ND ND 2.3
6.9 6.0 3.9
ND 28.1 41.4 29.6
210.9 67.0
112.8 77.7
4.6 ND ND ND ND ND ND ND ND ND
13.7
5.4 9.1 3.7 0.8
25.6 46.9 30.6
359.7 70.5
107.8 73.1
1.5 ND ND ND ND ND ND ND ND ND 0.8
NA 15.7 NA 18.2 NA 4.8 NA 3.6 NA 29.1 NA 37.0 NA 34.0 NA 353.2 NA 51.7 NA 139.5 NA 100.5 NA 3.6 NA ND NA ND NA ND NA ND NA ND NA ND NA 0.1 NA ND NA 0.1 NA 2.1
NA NA NA NA NA NA NA NA NA NA NA NA NA NA NA NA NA NA NA NA NA NA
NA NA NA NA NA NA NA NA NA NA NA NA NA NA NA NA NA NA NA NA NA NA
NA 39.6 NA 44.3 NA 22.7 NA 7.2 NA 86.9 NA 96.4 NA 124.3 NA 1910.0 NA 635.4 NA 672.2 NA 478.9 NA 13.9 NA ND NA ND NA 1.5 NA ND NA ND NA ND NA 0.2 NA ND NA 0.1 NA 2.5
NA NA NA NA NA NA NA NA NA NA NA NA NA NA NA NA NA NA NA NA NA NA
NA NA NA NA NA NA NA NA NA NA NA NA NA NA NA NA NA NA NA NA NA NA
59.4 25.5 26.6 33.6 12.4 12.1 16.3 5.9 14.0 10.0 4.8 2.3
102.6 50.1 39.7 117.3 99.2 75.0 111.0 113.7 57.2
1898.1 2142.5 1532.9 488.1 827.4 505.6 763.3 1284.6 788.4 570.0 1017.7 630.3
10.8 43.5 28.1 1.3 1.5 2.1 0.8 1.1 1.7 1.6 1.8 2.2
ND ND ND ND ND ND
0.1 ND ND 0.4 1.6 5.2 0.1 ND ND 0.3 0.3 ND 4.3 1.1 4.2
Total Oxygenates @g/L) 48 22 110 48 21 20 - 55 89 - - 109 105 75 Total PAH @g/L) 4258 660 2167 1357 589 735 793 - - 4142 - - 4192 5640 3723 Total Cl-Phenols @g/L) 1 0 6 2 14 1 - 2 - 3 5 3 9 Total GC-MS (fig/L) 4307 682 2283 1407 624 756 850 - 4233 - - 4306 5747 3808
% Oxygenates 1.1 3.3 4.8 3.4 3.4 2.7 - 6.4 - - - 2.1 - - 2.5 1.8 2.0
46
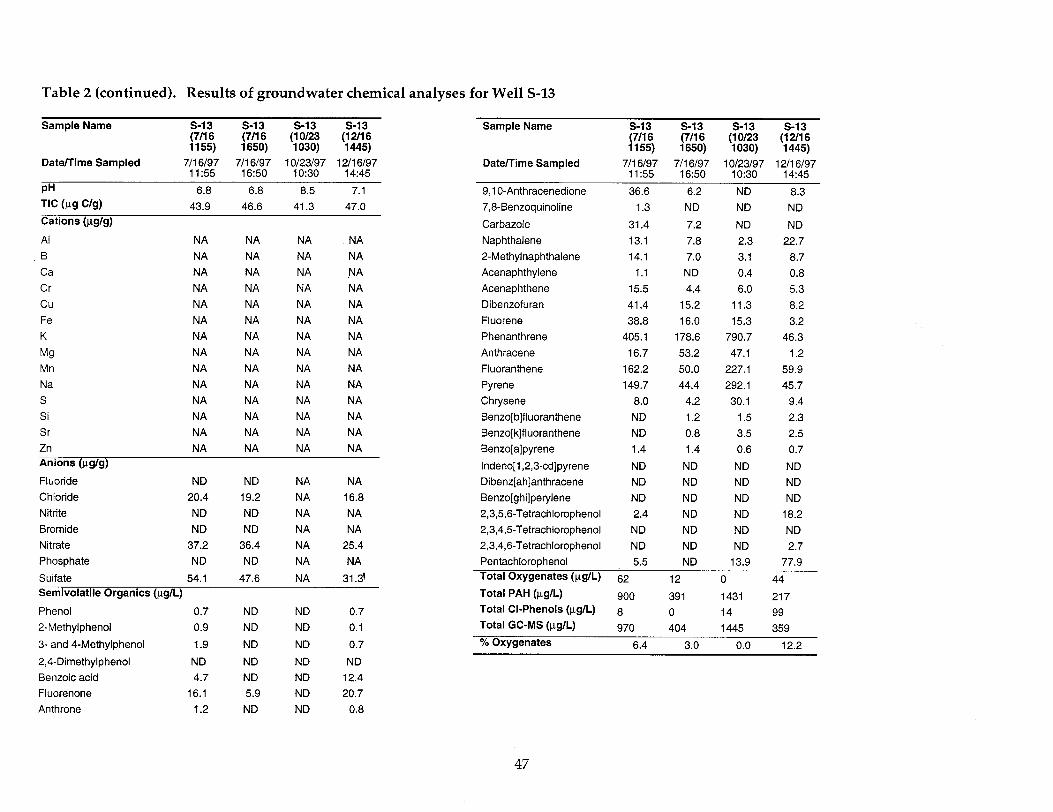
SamDIe Name
Date/lime Sampled
PH TIC (m W Cations (&g)
Al B Ca Cr cu Fe K
Mg Mn Na S Si Sr Zn Anions @g/g)
Fluoride Chloride Nitrite Bromide Nitrate Phosphate
s-13 s-13 s-13 s-13 SamDIe Name s-13 S-l 3 (7116 (7/l 6 1155) 1650)
(7/16 (7116 1155) 1650)
7/l 6197 7/l 6197 10123197 12/l 6197 Date/lime Sampled 7/l 6197 7/l 6197 11:55 16:50 10:30 14145 11:55 16:50 -
6.8 6.8 8.5 7.1 43.9 46.6 41.3 47.0
NA NA NA NA NA NA NA NA NA NA NA NA NA NA NA NA NA NA NA NA NA NA NA NA NA NA NA NA NA NA NA NA NA NA NA NA NA NA NA NA NA NA NA NA NA NA NA NA NA NA NA NA NA NA NA NA
ND ND NA NA 20.4 19.2 NA 16.8 ND ND NA NA ND ND NA NA
37.2 36.4 NA 25.4 ND ND NA NA
9,10-Anthracenedione 7,8-Benzoquinoline
Table 2 (continued). Results of groundwater chemical analyses for Well S-13
Sulfate 54.1 Semivolatile Organics (PglL)
Phenol 0.7 2-Methylphenol 0.9
3- and 4-Methylphenol 1.9
2,4-Dimethylphenol ND Benzoic acid 4.7 Fluorenone 16.1 Anthrone 1.2
47.6
ND ND
ND
ND ND 5.9
ND
Carbazole Naphthalene 2-Methylnaphthalene Acenaphthylene Acenaphthene Dibenzofuran Fluorene Phenanthrene Anthracene Fluoranthene Pyrene Chrysene Benzo[b]fluoranthene Benzo[k]fluoranthene Benzo[a]pyrene
Indeno[l,2,3-cdlpyrene Dibenz[ah]anthracene Benzo[ghi]perylene 2,3,5,6-Tetrachlorophenol 2,3,4,5-Tetrachlorophenol 2,3,4,6-Tetrachlorophenol Pentachlorophenol
1.3
31.4 13.1 14.1
1.1 15.5 41.4 38.8
405.1 16.7
162.2 149.7
8.0 ND ND 1.4
ND ND ND 2.4 ND ND 5.5
6.2 ND
7.2 7.8 7.0
ND 4.4
15.2 16.0
178.6 53.2 50.0 44.4
4.2 1.2 0.8 1.4
ND ND ND ND ND ND ND
ND
ND 2.3 3.1 0.4 6.0
11.3 15.3
790.7 47.1
227.1 292.1
30.1 1.5 3.5 0.6
ND ND ND ND ND ND
13.9
8.3 ND
ND 22.7
8.7 0.8 5.3 8.2 3.2
46.3 1.2
59.9 45.7
9.4 2.3 2.5 0.7
ND ND ND
18.2 ND 2.7
77.9
Total Oxygenates @g/L) 62 12 0 44 Total PAH (pg/L) 900 391 1431 217 Total Cl-Phenols @g/L) 6 0 14 99 Total GC-MS @g/L) 970 404 1445 359
% Oxygenates 6.4 3.0 0.0 12.2
36.6
s-13 s-13
‘:h%; ‘:z; 10123197 12/l 6197
10:30 14:45
ND
NA
ND ND
ND
31.3’
0.7 0.1
0.7 ND ND ND 12.4 ND 20.7 ND 0.8
47
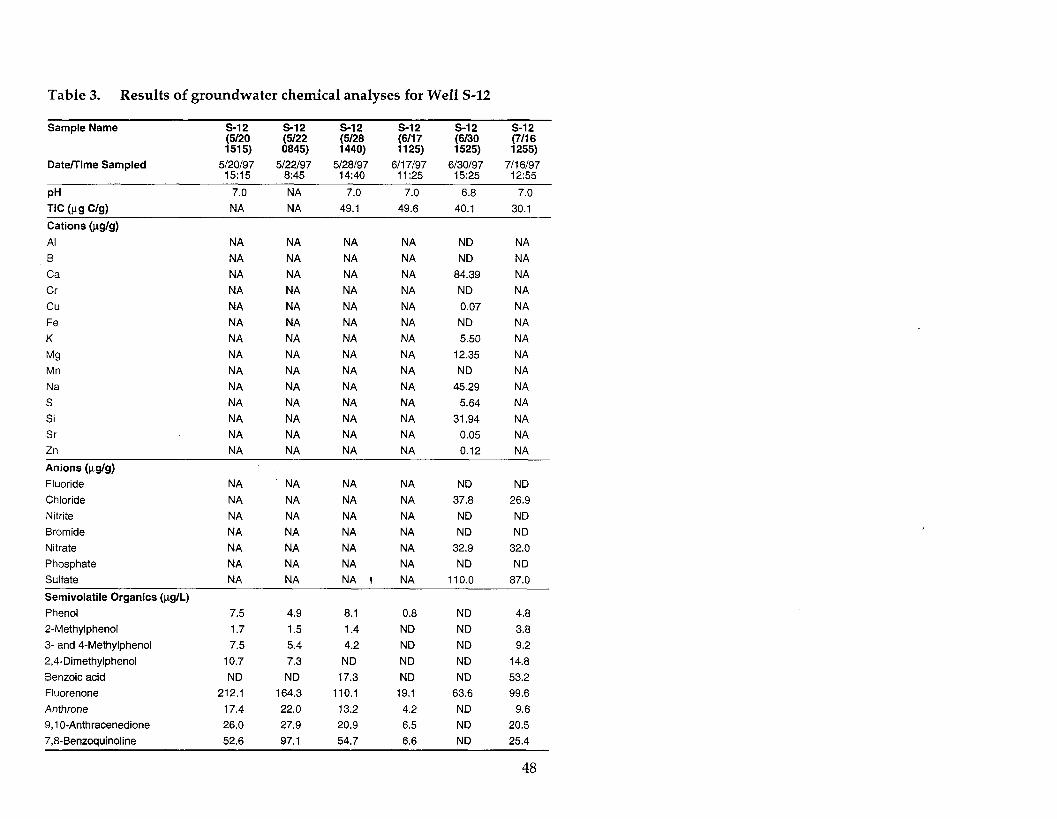
Table 3. Results of groundwater chemical analyses for Well S-12
Sample Name s-12 s-12 S-l 2 s-12 s-1 2 s-12 (5120 (5122 (5128 (6117 (6/30 (7/l 6 1515) 0845) 1440) 1125) 1525) 1255)
Date/Time Sampled 5120197 5l22l97 5128197 6/l 7197 6130197 7/l 6197 15:15 8:45 14:40 11:25 15:25 12:55
PH TIC (w W Cations @g/g) Al B Ca Cr cu Fe K
Mg Mn Na S Si Sr Zn
7.0 NA 7.0 7.0 6.8 7.0 NA NA 49.1 49.6 40.1 30.1
NA NA NA NA ND NA NA NA NA NA ND NA NA NA NA NA 84.39 NA NA NA NA NA ND NA NA NA NA NA 0.07 NA NA NA NA NA ND NA NA NA NA NA 5.50 NA NA NA NA NA 12.35 NA NA NA NA NA ND NA NA NA NA NA 45.29 NA NA NA NA NA 5.64 NA NA NA NA NA 31.94 NA NA NA NA NA 0.05 NA NA NA NA NA 0.12 NA
Anions @g/g) Fluoride Chloride Nitrite Bromide Nitrate Phosphate Sulfate
Semivolatile Organics (PgIL) Phenol 2-Methylphenol 3- and 4-Methylphenol 2,4-Dimethylphenol Benzoic acid Fluorenone Anthrone 9,10-Anthracenedione 7,8-Benzoquinoline
NA NA NA NA ND ND NA NA NA NA 37.8 26.9 NA NA NA NA ND ND NA NA NA NA ND ND NA NA NA NA 32.9 32.0 NA NA NA NA ND ND NA NA NA ! NA 110.0 87.0
7.5 4.9 8.1 0.8 ND 4.8 1.7 1.5 1.4 ND ND 3.8 7.5 5.4 4.2 ND ND 9.2
10.7 7.3 ND ND ND 14.8 ND ND 17.3 ND ND 53.2
212.1 164.3 110.1 19.1 63.6 99.6 17.4 22.0 13.2 4.2 ND 9.6 26.0 27.9 20.9 6.5 ND 20.5 52.6 97.1 54.7 6.6 ND 25.4
48
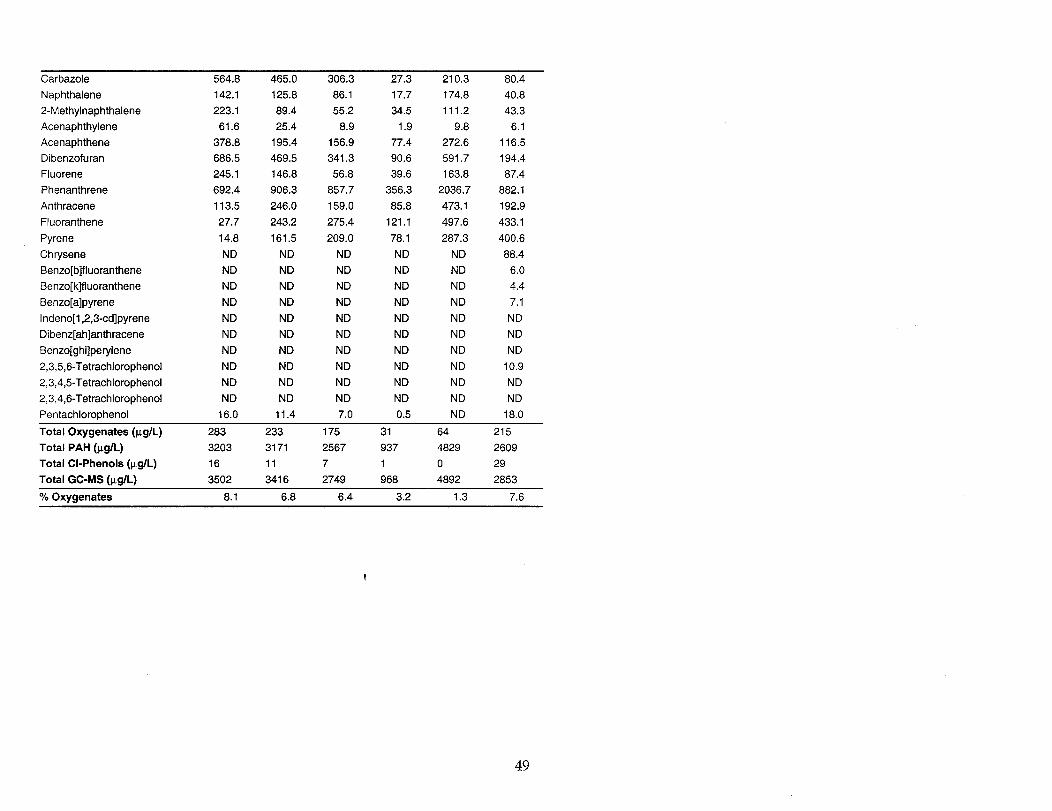
Carbezole 564.8 465.0 306.3 27.3 210.3 80.4 Naphthalene 142.1 2-Methylnaphthalene 223.1 Acenaphthylene 61.6 Acenaphthene 378.8 Dibenzofuran 686.5 Fluorene 245.1 Phenanthrene 692.4 Anthracene 113.5 Fluoranthene 27.7 Pyrene 14.8 Chrysene ND Benzo[b]fluoranthene ND Benzo[k]fluoranthene ND Benzo[a]pyrene ND Indeno[l,2,3od]pyrene ND Dibenz[ah]anthracene ND Benzo[ghi]perylene ND 2,3,5,6-Tetrachlorophenol ND 2,3,4,5Tetrachlorophenol ND 2,3,4,6-Tetrachlorophenol ND Pentachlorophenol 16.0
125.8 89.4 25.4
195.4 469.5 146.8 906.3 246.0 243.2 161.5
ND ND ND ND ND ND ND ND ND ND
11.4
86.1 55.2
a.9 156.9 341.3
56.8 857.7 159.0 275.4 209.0
ND ND ND ND ND ND ND ND ND ND 7.0
17.7 34.5
1.9 77.4 90.6 39.6
356.3 85.8
121.1 78.1 ND ND ND ND ND ND ND ND ND ND 0.5
174.8 40.8 111.2 43.3
9.8 6.1 272.6 116.5 591.7 194.4 163.8 87.4
2036.7 882.1 473.1 192.9 497.6 433.1 287.3 400.6
ND 88.4 ND 6.0 ND 4.4 ND 7.1 ND ND ND ND ND ND ND 10.9 ND ND ND ND ND la.0
Total Oxygenates Q.tg/L) 283 233 175 31 64 215 Total PAH @g/L) 3203 3171 2567 937 4829 2609 Total Cl-Phenols (yg/L) 16 11 7 1 0 29 Total GC-MS (w/L) 3502 3416 2749 968 4892 2853 % Oxygenates a.1 6.8 6.4 3.2 1.3 7.6
49
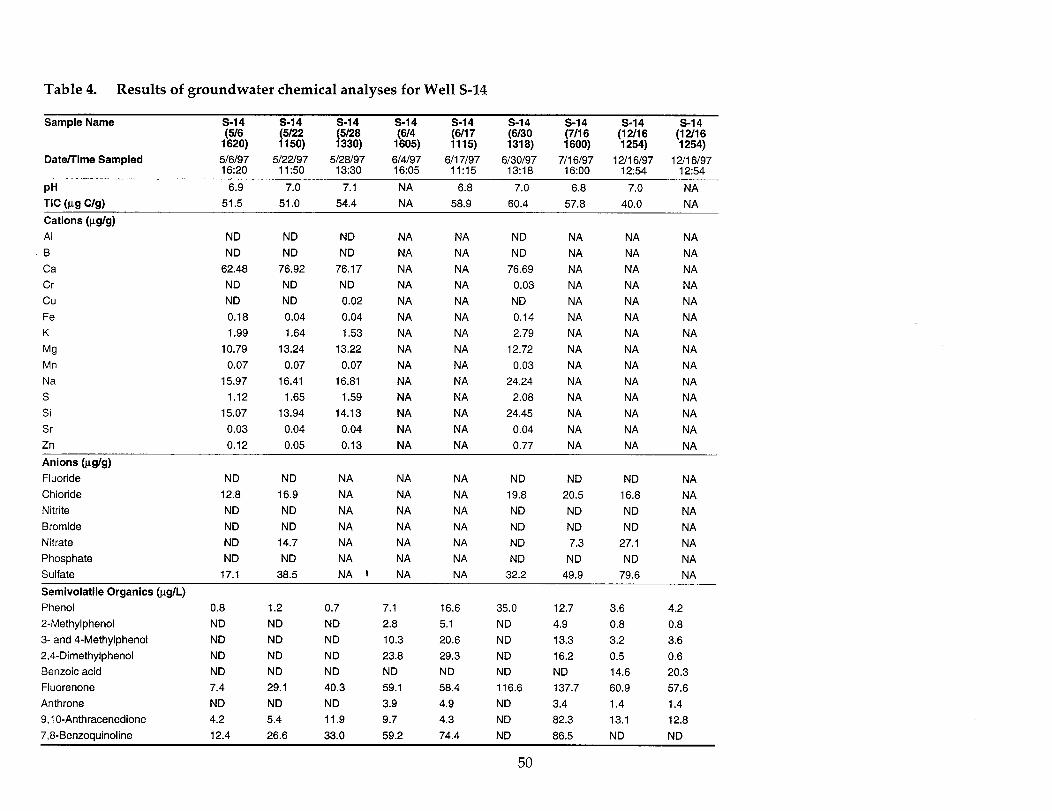
Table 4. Results of groundwater chemical analyses for Well S-14
Sample Name s-14 s-14 s-14 s-14 s-14 s-14 s-14 s-14 s-14 (516 (5122
1620) (5/28 (614 (6/17 (6130
1150) 1330) 1605) 1115) (7/l 6
1318) 1600) Date/Time Sampled 516197 5l22l97 5128197 614197 6/l 7197 6130197 7/l 6197 12/l 6197 12t16l97
16:20 11:50 13:30 16:05 11:15 13:18 16:OO 12:54 12:54
PH 6.9 7.0 7.1 NA 6.8 7.0 6.8 7.0 NA TIC (wg C&d 51.5 51.0 54.4 NA 58.9 60.4 57.8 40.0 NA Cations @g/g) Al
,B Ca Cr cu Fe K
Mg Mn Na S Si Sr
ND ND
62.48 ND ND 0.18 1.99
10.79 0.07
15.97 1.12
15.07 0.03
Zn
Anions (pg/g) Fluoride Chloride Nitrite Bromide Nitrate Phosphate Sulfate
0.12
ND 12.8 ND ND ND ND
17.1
ND ND NA ND ND NA
76.92 76.17 NA ND ND NA ND 0.02 NA 0.04 0.04 NA 1.64 1.53 NA
13.24 13.22 NA 0.07 0.07 NA
16.41 16.81 NA 1.65 1.59 NA
13.94 14.13 NA 0.04 0.04 NA 0.05 0.13 NA
NA ND NA NA NA NA ND NA NA NA NA 76.69 NA NA NA NA 0.03 NA NA NA NA ND NA NA NA NA 0.14 NA NA NA NA 2.79 NA NA NA NA 12.72 NA NA NA NA 0.03 NA NA NA NA 24.24 NA NA NA NA 2.08 NA NA NA NA 24.45 NA NA NA NA 0.04 NA NA NA NA 0.77 NA NA NA
ND NA NA NA ND ND ND NA 16.9 NA NA NA 19.8 20.5 16.8 NA ND NA NA NA ND ND ND NA ND NA NA NA ND ND ND NA
14.7 NA NA NA ND 7.3 27.1 NA ND NA NA NA ND ND ND NA
38.5 NA 1 NA NA 32.2 49.9 79.6 NA Semivolatile Organics @g/L) Phenol 2-Methylphenol 3- and 4-Methylphenol 2,4-Dimethylphenol Benzoic acid Fluorenone Anthrone 9,10-Anthracenedione 7,8-Benzoauinoline
0.8 1.2 ND ND ND ND ND ND ND ND 7.4 29.1 ND ND 4.2 5.4 12.4 26.6
0.7 7.1 16.6 ND 2.8 5.1 ND 10.3 20.6 ND 23.8 29.3 ND ND ND 40.3 59.1 58.4 ND 3.9 4.9 11.9 9.7 4.3 33.0 59.2 74.4
35.0 12.7 3.6 ND 4.9 0.8 ND 13.3 3.2 ND 16.2 0.5 ND ND 14.6 116.6 137.7 60.9 ND 3.4 1.4 ND 82.3 13.1 ND 86.5 ND
4.2 0.8 3.6 0.6 20.3 57.6 1.4 12.8 ND
50
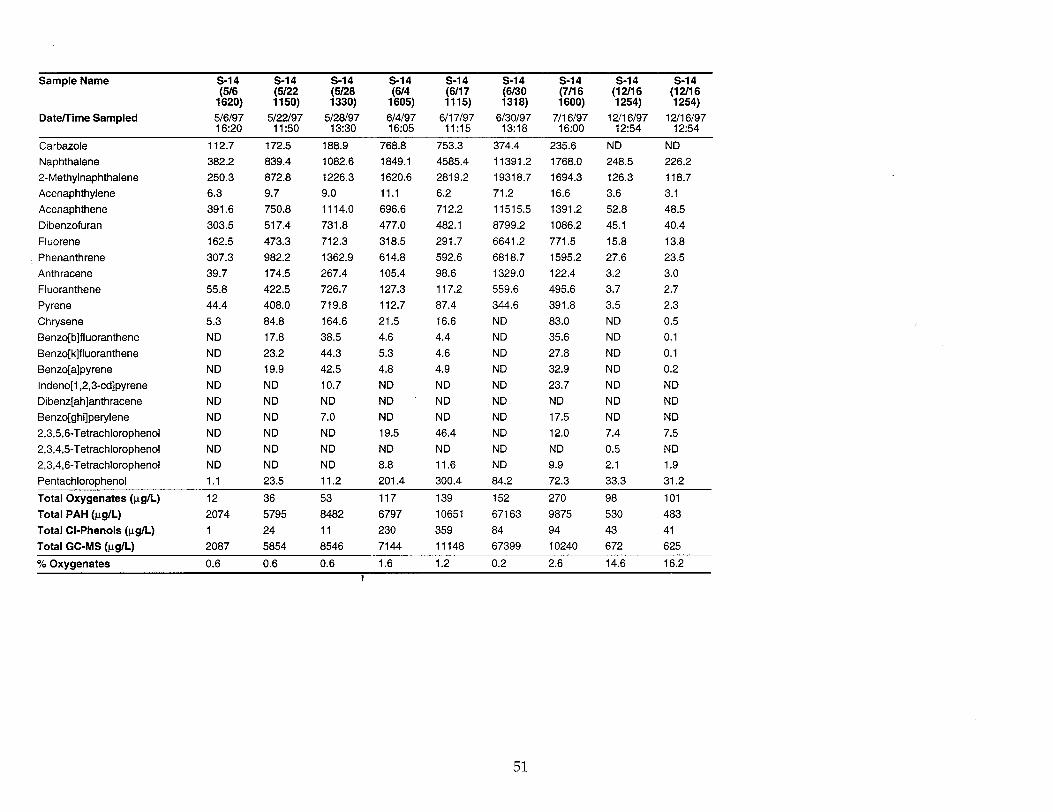
Sample Name S-l 4 s-14 s-14 s-14 s-14 s-14 s-14 s-14 s-14 (516 (5122 (5128 (614 (6117 (6/30 (7/l 6
1620) 1150) 1330) 1605) 1115) 1318) 1600) Date/Time Sampled 516197 5l22l97 5128197 614197
16:20 11:50 13:30 16:05
Carbazole 112.7 Naphthalene 382.2 2-Methylnaphthalene 250.3 Acenaphthylene 6.3 Acenaphthene 391.6 Dibenzofuran 303.5 Fluorene 162.5 Phenanthrene 307.3 Anthracene 39.7 Fluoranthene 55.8 Pyrene 44.4 Chrysene 5.3 Benzo[b]fluoranthene ND Benzo[k]fluoranthene ND Benzo[a]pyrene ND Indeno[l,2,3od]pyrene ND Dibenztahlanthracene ND Benzo[ghi]perylene ND 2,3,5,6-Tetrachlorophenol ND 2,3,4,5-Tetrachlorophenol ND 2,3,4,6-Tetrachlorophenol ND
172.5 188.9 768.8 839.4 872.8 9.7 750.8 517.4 473.3 982.2 174.5 422.5 408.0 84.8 17.8 23.2 19.9 ND ND ND ND ND ND 23.5
1082.6 1226.3 9.0 1114.0 731.8 712.3 1362.9 267.4 726.7 719.8 164.6 38.5 44.3 42.5 10.7 ND 7.0 ND ND ND 11.2
1849.1 1620.6 11.1 696.6 477.0 318.5 614.8 105.4 127.3 112.7 21.5 4.6 5.3 4.8 ND ND ND 19.5 ND 8.8 201.4 Pentachlorophenol 1.1
Total Oxygenates (pg/L) 12 36 53 117 Total PAH (pg/L) 2074 5795 8482 6797 Total Cl-Phenols @g/L) 1 24 11 230
6/l 7197 6130197 7/l 6197 12/l 6197 12/l 6197 - 11:15
753.3 4585.4 2819.2 6.2 712.2 482.1 291.7 592.6 98.6 117.2 87.4 16.6 4.4 4.6 4.9 ND ND ND 46.4 ND 11.6 300.4
139 10651 359
13:18 16:OO 12:54 12:54
374.4 235.6 ND ND 11391.2 1768.0 19318.7 1694.3 71.2 16.6 11515.5 1391.2 8799.2 1086.2 6641.2 771.5 6818.7 1595.2 1329.0 122.4 559.6 495.6 344.6 391.8 ND 83.0 ND 35.6 ND 27.8 ND 32.9 ND 23.7 ND ND ND 17.5 ND 12.0 ND ND ND 9.9 84.2 72.3
152 270 67163 9875 84 94
248.5 226.2 126.3 118.7 3.6 3.1 52.8 48.5 45.1 40.4 15.8 13.8 27.6 23.5 3.2 3.0 3.7 2.7 3.5 2.3 ND 0.5 ND 0.1 ND 0.1 ND 0.2 ND ND ND ND ND ND 7.4 7.5 0.5 ND 2.1 1.9 33.3 31.2 - 98 101 530 483 43 41
Total GC-MS (w/L) 2087 5854 8546 7144 11148 67399 10240 672 625
% Oxygenates 0.6 0.6 0.6 1.6 1.2 0.2 2.6 14.6 16.2
51
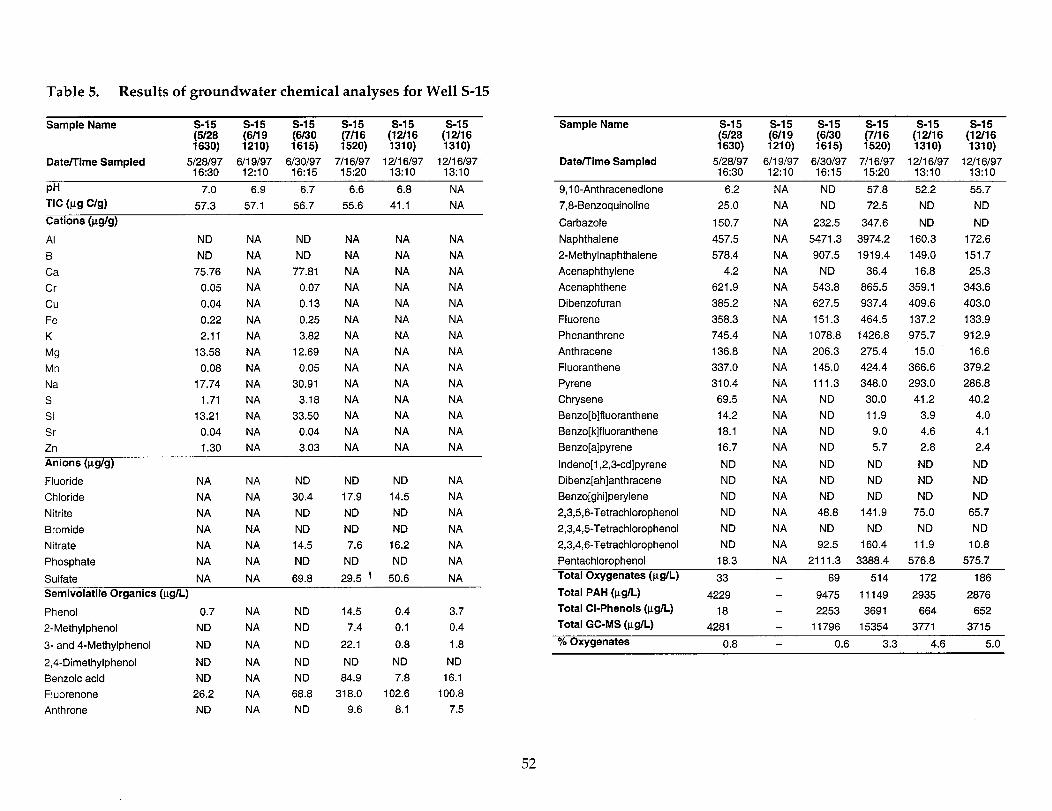
Table 5. Results of groundwater chemical analyses for Well S-15
Sample Name
Date/Time Sampled
s-15 s-15 s-15 s-15 s-15 s-15 (5/28 (6/l 9 (6/30 (7/l 6 1630) 1210) 1615) 1520)
5128197 6/l 9197 6130197 7/l 6197 16:30 12:lO 16:15 15:20
1?;;!7 l$“,;$I
PH 7.0 6.9 6.7 6.6 6.8 NA TIC (19 C/g) 57.3 57.1 56.7 55.6 41.1 NA Cations @g/g)
Al ND NA ND NA NA NA
B ND NA ND NA NA NA Ca 75.76 NA 77.81 NA NA NA Cr 0.05 NA 0.07 NA NA NA cu 0.04 NA 0.13 NA NA NA Fe 0.22 NA 0.25 NA NA NA K 2.11 NA 3.82 NA NA NA Mg 13.58 NA 12.69 NA NA NA Mn 0.08 NA 0.05 NA NA NA Na 17.74 NA 30.91 NA NA NA S 1.71 NA 3.18 NA NA NA Si 13.21 NA 33.50 NA NA NA Sr 0.04 NA 0.04 NA NA NA Zn 1.30 NA 3.03 NA NA NA Anions @g/g)
Fluoride NA NA ND ND ND NA Chloride NA NA 30.4 17.9 14.5 NA
Nitrite NA NA ND ND ND NA
Bromide NA NA ND ND ND NA Nitrate NA NA 14.5 7.6 16.2 NA
Phosphate NA NA ND ND ND NA
Sulfate NA NA 69.8 29.5 ’ 50.6 NA Semivolatile Organics @g/L)
Phenol 0.7 NA ND 14.5 0.4 3.7 2-Methylphenol ND NA ND 7.4 0.1 0.4
3- and 4-Methylphenol ND NA ND 22.1 0.8 1.8
2,CDimethylphenol ND NA ND ND ND ND Benzoic acid ND NA ND 84.9 7.8 16.1 Fluorenone 26.2 NA 68.8 318.0 102.6 100.8 Anthrone ND NA ND 9.6 8.1 7.5
Sample Name
Date/Time Sampled
s-15 s-15 s-15 S-l 5 s-15 s-15 (5128 (6/l 9 (6/30 (7/l 6 1630) 1210) 1615) 1520) %$ Safe
5128197 6/l 9197 6130197 7/l 6197 12l16l97 12l16l97 16:30 12:lO 16:15 15:20 13:lO 13:lO
9,10-Anthracenedione 6.2 7,8-Benzoquinoline 25.0
Carbazole 150.7 Naphthalene 457.5 2-Methylnaphthalene 578.4 Acenaphthylene 4.2 Acenaphthene 621.9 Dibenzofuran 385.2 Fluorene 358.3 Phenanthrene 745.4 Anthracene 136.8 Fluoranthene 337.0 Pyrene 310.4 Chrysene 69.5 Benzo[b]fluoranthene 14.2 Benzo[k]fluoranthene 18.1 Benzo[a]pyrene 16.7
Indeno[l,2,3cd]pyrene ND Dibenz[ah]anthracene ND Benzo[ghi]perylene ND 2,3,5,&Tetrachlorophenol ND 2,3,4,5-Tetrachlorophenol ND 2,3,4,6-Tetrachlorophenol ND Pentachlorophenol 18.3
NA NA
NA NA NA NA NA NA NA NA NA NA NA NA NA NA NA
NA NA NA NA NA NA
ND ND
232.5 5471.3 907.5
ND 543.8 627.5 151.3
1078.8 206.3 145.0 111.3
ND ND ND ND
ND ND ND 48.8 ND 92.5
57.8 52.2 72.5 ND
347.6 ND 3974.2 160.3 1919.4 149.0
36.4 16.8 865.5 359.1 937.4 409.6 464.5 137.2
1426.8 975.7 275.4 15.0 424.4 366.6 348.0 293.0
30.0 41.2 11.9 3.9
9.0 4.6 5.7 2.8
ND ND ND ND ND ND
141.9 75.0 ND ND
160.4 11.9 NA 2111.3 3388.4 576.8
55.7 ND
ND 172.6 151.7 25.3
343.6 403.0 133.9 912.9
16.6 379.2 286.8
40.2 4.0 4.1 2.4
ND ND ND
65.7 ND
10.8 575.7
Total Oxygenates @g/L) 33 - 69 514 172 186
Total PAH (kg/L) 4229 - 9475 11149 2935 2878 Total Cl-Phenols @g/L) 18 2253 3691 664 652 Total GC-MS (pgll) 4281 11796 15354 3771 3715
% Oxygenates 0.8 - 0.6 3.3 4.6 5.0
52
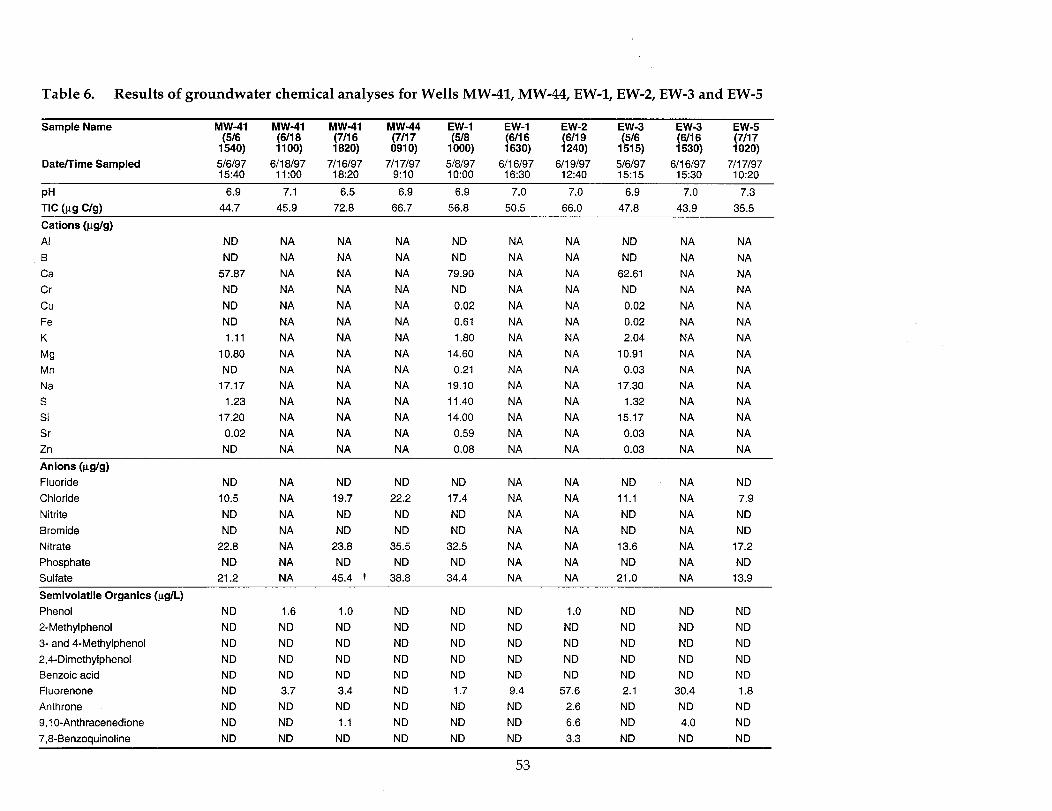
Table 6. Results of groundwater chemical analyses for Wells MW-41, MW-44, EW-1, EW-2, EW-3 and EW-5
Sample Name MW-41 MW-41 MW-41 MW-44 EW-1 EW-1 EW-2 EW-3 EW-3 EW-5 (5/6 (6118 (7/l 6 (7117 (518
1540) 1100) 1820) 0910) (6/l 6 (6/l 9 (516 (6/l 6 (7117
1000) 1630) 1240) 1515) 1530) 1020) Date/Time Sampled 516197 6/l 8197 7/l 6197 7/l 7197 518197 6/l 6197 6/l 9197 516197 6/l 6197 7/l 7197
15:40 ll:oo 18:20 9:lO 1o:oo 16:30 12:40 15:15 15:30 10:20
PH 6.9 7.1 6.5 6.9 6.9 7.0 7.0 6.9 7.0 7.3 TIC fug W) 44.7 45.9 72.8 66.7 56.8 50.5 66.0 47.8 43.9 35.5
Cations @g/g) Al
.B Ca Cr cu Fe K
W Mn Na S Si Sr Zn
ND NA ND NA
57.87 NA ND NA ND NA ND NA 1.11 NA
10.80 NA ND NA
17.17 NA 1.23 NA
17.20 NA 0.02 NA ND NA
NA NA NA NA NA NA NA NA NA NA NA NA NA NA
NA NA NA NA NA NA NA NA NA NA NA NA NA NA
ND NA ND NA
79.90 NA ND NA 0.02 NA 0.61 NA 1.80 NA
14.60 NA 0.21 NA
19.10 NA 11.40 NA 14.00 NA
0.59 NA 0.08 NA
NA NA NA NA NA NA NA NA NA NA NA NA NA NA
ND NA ND NA
62.61 NA ND NA 0.02 NA 0.02 NA 2.04 NA
10.91 NA 0.03 NA
17.30 NA 1.32 NA
15.17 NA 0.03 NA 0.03 NA
NA NA NA NA NA NA NA NA NA NA NA NA NA NA
Anions @g/g) Fluoride Chloride Nitrite Bromide Nitrate Phosphate Sulfate
Semivolatile Organics &g/L) Phenol 2-Methylphenol 3- and 4-Methylphenol 2,4-Dimethylphenol Benzoic acid Fluorenone Anthrone 9,10-Anthracenedione 7,8-Benzoquinoline
ND NA ND ND ND NA NA ND NA ND 10.5 NA 19.7 22.2 17.4 NA NA 11.1 NA 7.9 ND NA ND ND ND NA NA ND NA ND ND NA ND ND ND NA NA ND NA ND
22.8 NA 23.8 35.5 32.5 NA NA 13.6 NA 17.2 ND NA ND ND ND NA NA ND NA ND
21.2 NA 45.4 ’ 38.8 34.4 NA NA 21 .o NA 13.9
ND 1.6 1.0 ND ND ND 1.0 ND ND ND ND ND ND ND ND ND ND ND ND ND ND ND ND ND ND ND ND ND ND ND ND ND ND ND ND ND ND ND ND ND ND ND ND ND ND ND ND ND ND ND ND 3.7 3.4 ND 1.7 9.4 57.6 2.1 30.4 1.8 ND ND ND ND ND ND 2.6 ND ND ND ND ND 1.1 ND ND ND 6.6 ND 4.0 ND ND ND ND ND ND ND 3.3 ND ND ND
53
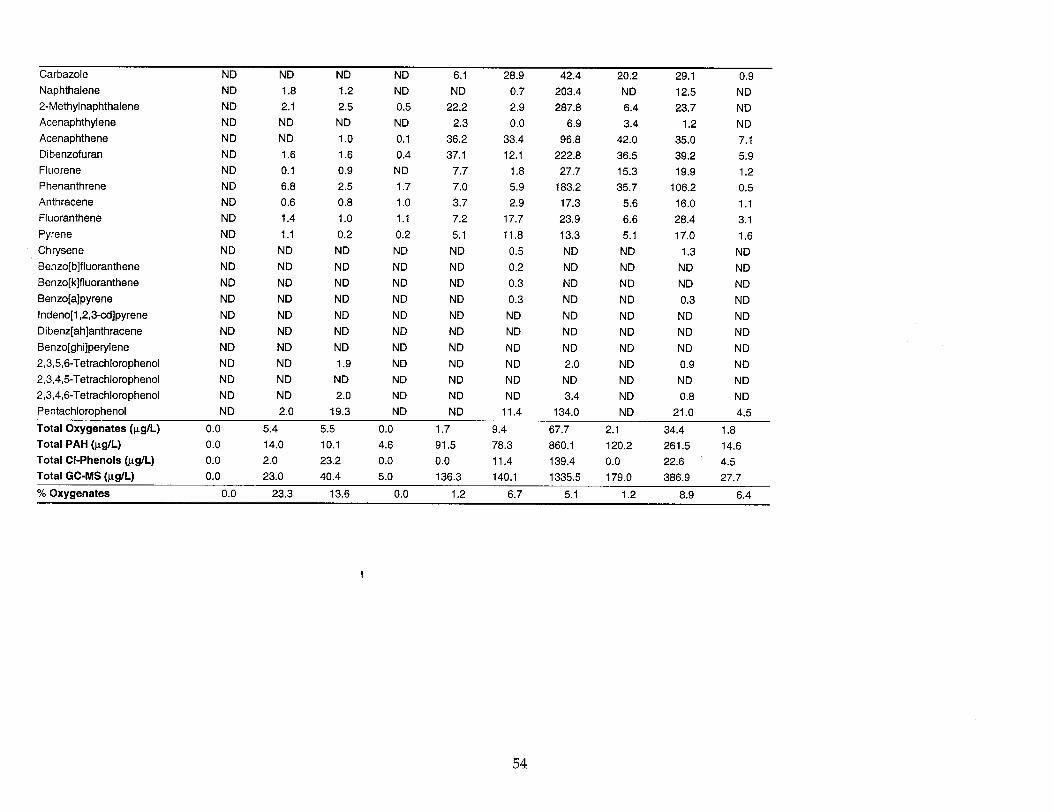
Carbazole Naphthalene 2-Methylnaphthalene Acenaphthylene Acenaphthene Dibenzofuran Fluorene Phenanthrene Anthracene Fluoranthene Pyrene Chrysene Benzo[b]fluoranthene Benzo[k]fluoranthene Benzo[a]pyrene Indeno[l,2,3-cdlpyrene Dibenz[ah]anthracene Benzo[ghi]perylene 2,3,5,6-Tetrachlorophenol 2,3,4,5Tetrachlorophenol 2,3,4,6-Tetrachlorophenol Pentachlorophenol
Total Oxygenates @g/L) 0.0 5.4 5.5 0.0 1.7 9.4 67.7 2.1 34.4 1.8 Total PAH @g/L) 0.0 14.0 10.1 4.6 91.5 78.3 860.1 120.2 261.5 14.6 Total Cl-Phenols @g/L) 0.0 2.0 23.2 0.0 0.0 11.4 139.4 0.0 22.6 4.5 Total GC-MS @g/L) 0.0 23.0 40.4 5.0 136.3 140.1 1335.5 179.0 386.9 27.7
ND ND ND 1.8 ND 2.1 ND ND ND ND ND 1.6 ND 0.1 ND 6.8 ND 0.6 ND 1.4 ND 1.1 ND ND ND ND ND ND ND ND ND ND ND ND ND ND ND ND ND ND ND ND ND 2.0
6.1 28.9 42.4 20.2 29.1 0.9 1.2 ND ND 0.7 203.4 ND 12.5 ND 2.5 0.5 22.2 2.9 287.8 6.4 23.7 ND
ND ND 2.3 0.0 6.9 3.4 1.2 ND 1.0 0.1 36.2 33.4 96.8 42.0 35.0 7.1 1.6 0.4 37.1 12.1 222.8 36.5 39.2 5.9 0.9 ND 7.7 1.8 27.7 15.3 19.9 1.2 2.5 1.7 7.0 5.9 183.2 35.7 106.2 0.5 0.8 1.0 3.7 2.9 17.3 5.6 16.0 1.1 1.0 1.1 7.2 17.7 23.9 6.6 28.4 3.1 0.2 0.2 5.1 11.8 13.3 5.1 17.0 1.6
ND ND ND 0.5 ND ND 1.3 ND ND ND ND 0.2 ND ND ND ND ND ND ND 0.3 ND ND ND ND ND ND ND 0.3 ND ND 0.3 ND ND ND ND ND ND ND ND ND ND ND ND ND ND ND ND ND ND ND ND ND ND ND ND ND 1.9 ND ND ND 2.0 ND 0.9 ND
ND ND ND ND ND ND ND ND 2.0 ND ND ND 3.4 ND 0.8 ND
19.3 ND ND 11.4 134.0 ND 21 .o 4.5
% Oxygenates 0.0 23.3 13.6 0.0 1.2 6.7 5.1 1.2 8.9 6.4
54
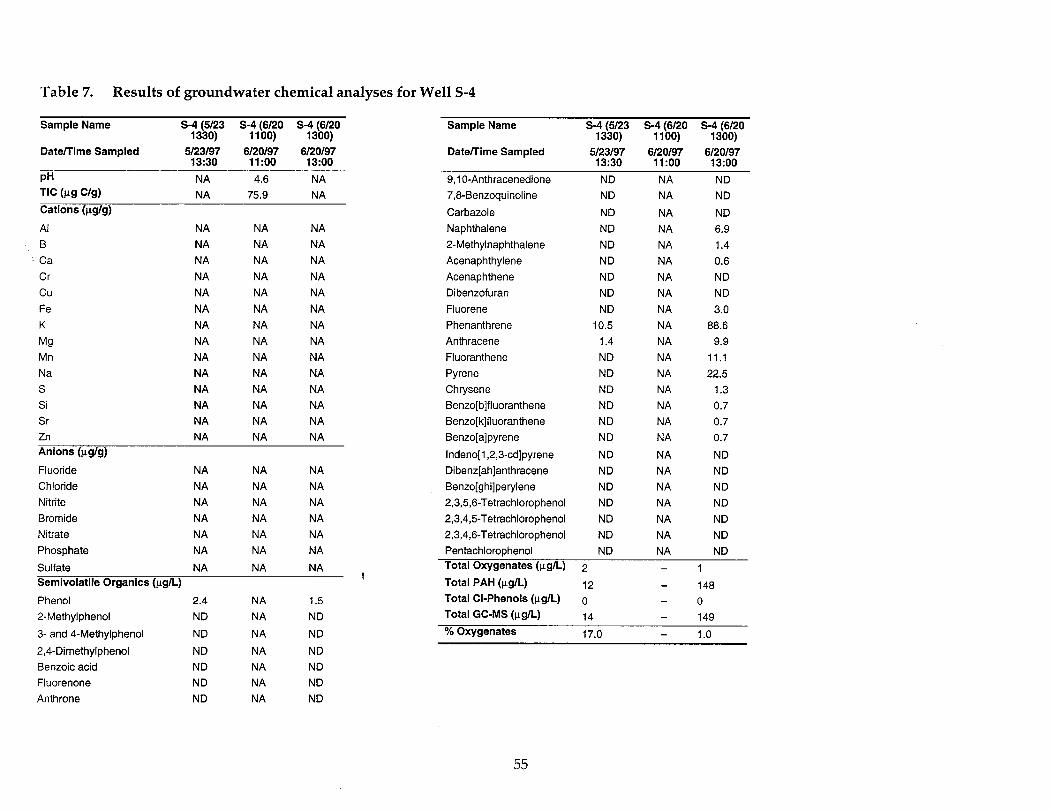
Table 7. Results of groundwater chemical analyses for Well S-4
PH
Sample Name
Date/Time Sampled
S-4 (5123 S-4 (6/20 S-4 (6120
NA
1330) 1100) 1300) 5123197 6120197 6120197
13:30 11:oo 13:oo
4.6 NA
Sample Name
Date/Time Sampled
9.10-Anthracenedione 7,8-Benzoquinoline
Carbazole Naphthalene 2-Methylnaphthalene Acenaphthylene Acenaphthene Dibenzofuran Fluorene Phenanthrene Anthracene Fluoranthene Pyrene Chrysene Benzo[b]fluoranthene Benzo[k]fluoranthene Benzo[a]pyrene
Indeno[l,2,3cd]pyrene Dibenz[ah]anthracene Benzo[ghi]perylene 2,3,5,6-Tetrachlorophenol 2,3,4,5-Tetrachlorophenol 2,3,4,6-Tetrachlorophenol Pentachlorophenol
Sytf$ S-4 (6120 S-4 (6/20 1100) 1300)
5123197 6120197 6120197 13:30 ll:oo 13:oo
ND ND
ND ND ND ND ND ND ND
10.5 1.4 ND ND ND ND ND ND
ND ND ND ND ND ND ND
NA NA
NA NA NA NA NA NA NA NA NA NA NA NA NA NA NA
NA NA NA NA NA NA NA
ND ND
ND 6.9 1.4 0.6 ND ND 3.0
88.6 9.9
11.1 22.5
1.3 0.7 0.7 0.7
ND ND ND ND ND ND ND
TIC (m C/s) Cations @g/g)
Al B Ca Cr cu Fe K
Mg Mn Na S Si Sr Zn Anions (pg/g)
Fluoride Chloride Nitrite Bromide Nitrate Phosphate
NA 75.9 NA
NA NA NA NA NA NA NA NA NA NA NA NA NA NA NA NA NA NA NA NA NA NA NA NA NA NA NA NA NA NA NA NA NA NA NA NA NA NA NA NA NA NA
NA NA NA NA NA NA NA NA NA NA NA NA NA NA NA NA NA NA
Sulfate Semivolatlle Organics @g/L)
Phenol 2-Methylphenol
3- and 4-Methylphenol
2,CDimethylphenol Benzoic acid Fluorenone Anthrone
NA NA
2.4 ND
ND
ND ND ND ND
NA NA
NA
NA NA NA NA
NA
1.5 ND
ND
Total Oxygenates (pg/L) 2 - 1 Total PAH @g/L) 12 148 Total Cl-Phenols @g/L) 0 - 0 Total GC-MS (&L) 14 149
% Oxygenates 17.0 1 .o
ND ND ND ND
55
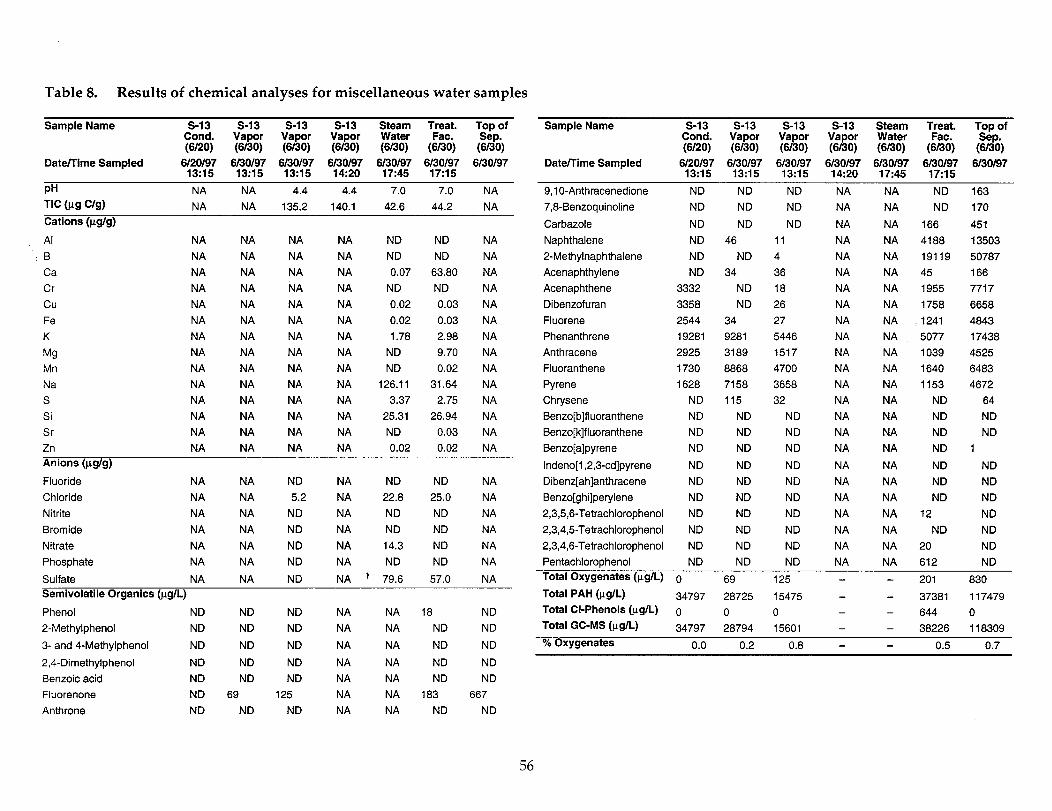
Table 8. Results of chemical analyses for miscellaneous water samples
Sample Name s-13 s-13 s-13 s-13 Steam Treat. Top of Cond. Vapor
(6l30) ;%ii; Vapor Water Fat. Sep.
(6~0) (6130) (6l30) (6l30) @W Date/Time Sampled 6;;O;y 6fII;y 6730:957 6;;Ol$7 6;;01’49; 6;y;y 6l3Ol97
PH NA NA 4.4 4.4 7.0 7.0 NA TIC (wg W NA NA 135.2 140.1 42.6 44.2 NA Cations @g/g)
Al NA NA NA NA ND ND NA
:B NA NA NA NA ND ND NA Ca NA NA NA NA 0.07 63.80 NA Cr NA NA NA NA ND ND NA cu NA NA NA NA 0.02 0.03 NA Fe NA NA NA NA 0.02 0.03 NA K NA NA NA NA 1.78 2.98 NA
Mg NA NA NA NA ND 9.70 NA Mn NA NA NA NA ND 0.02 NA Na NA NA NA NA 126.11 31.64 NA S NA NA NA NA 3.37 2.75 NA Si NA NA NA NA 25.31 26.94 NA Sr NA NA NA NA ND 0.03 NA Zn NA NA NA NA 0.02 0.02 NA Anions @g/g)
Fluoride NA NA ND NA ND ND NA Chloride NA NA 5.2 NA 22.8 25.0 NA Nitrite NA NA ND NA ND ND NA Bromide NA NA ND NA ND ND NA Nitrate NA NA ND NA 14.3 ND NA Phosphate NA NA ND NA ND ND NA
Sulfate NA NA ND NA ’ 79.6 57.0 NA Semlvolatile Organics (kg/L)
Phenol ND 2-Methylphenol ND
3- and 4-Methylphenol ND
2,4-Dimethylphenol ND Benzoic acid ND Fluorenone ND Anthrone ND
ND ND
ND
ND ND
69 ND
ND NA NA ND NA NA
ND NA NA
ND NA NA ND NA NA
125 NA NA ND NA NA
18 ND
ND
ND ND
183 ND
ND ND
ND
ND ND
667 ND
Sample Name
Date/Time Sampled
s-13 s-13 s-13 s-13 Steam Treat. Cond. Vapor Vapor
Top of Vapor Water Fat.
(6120) (6l30) Sep.
(6130) (6l30) (6l30) W30) (6130) 6120197 6l3Ol97 6130197 6130197 6130197 6l3Ol97 6l3Ol97
13:15 13:15 13:15 14:20 17:45 17:15
9,10-Anthracenedione 7,8-Benzoquinoline
Carbazole Naphthalene 2-Methylnaphthalene Acenaphthylene Acenaphthene Dibenzofuran Fluorene Phenanthrene Anthracene Fluoranthene Pyrene Chrysene Benzo[b]fluoranthene Benzo[k]fluoranthene Benzo[a]pyrene
Indeno[l,2,3od]pyrene Dibenz[ah]anthracene Benzo[ghi]perylene 2,3,5,6-Tetrachlorophenol 2,3,4,5-Tetrachlorophenol 2,3,4,6-Tetrachlorophenol Pentachlorophenol
ND ND ND ND
ND ND ND 46 ND ND ND 34
3332 ND 3358 ND 2544 34 19281 9281 2925 3189 1730 8868 1628 7158
ND 115 ND ND ND ND ND ND
ND ND ND ND ND ND ND ND ND ND ND ND ND ND
ND NA ND NA
ND NA 11 NA 4 NA 36 NA 18 NA 26 NA 27 NA 5446 NA 1517 NA 4700 NA 3658 NA 32 NA
ND NA ND NA ND NA
ND NA ND NA ND NA ND NA ND NA ND NA ND NA
NA NA
NA NA NA NA NA NA NA NA NA NA NA NA NA NA NA
NA NA NA NA NA NA NA
ND 163 ND 170
166 451 4188 13503 19119 50787 45 166 1955 7717 1758 6658 1241 4843 5077 17438 1039 4525 1640 6483 1153 4672
ND 64 ND ND ND ND ND 1
ND ND ND ND ND ND
12 ND ND ND
20 ND 612 ND
Total Oxygenates @g/L) 0 69 125 201 830 Total PAH (pg/L) 34797 28725 15475 - - 37381 117479 Total Cl-Phenols @g/L) 0 0 0 - 644 0 Total GC-MS (pg/L) 34797 28794 15601 - - 38226 118309 % Oxygenates 0.0 0.2 0.8 - - 0.5 0.7
56
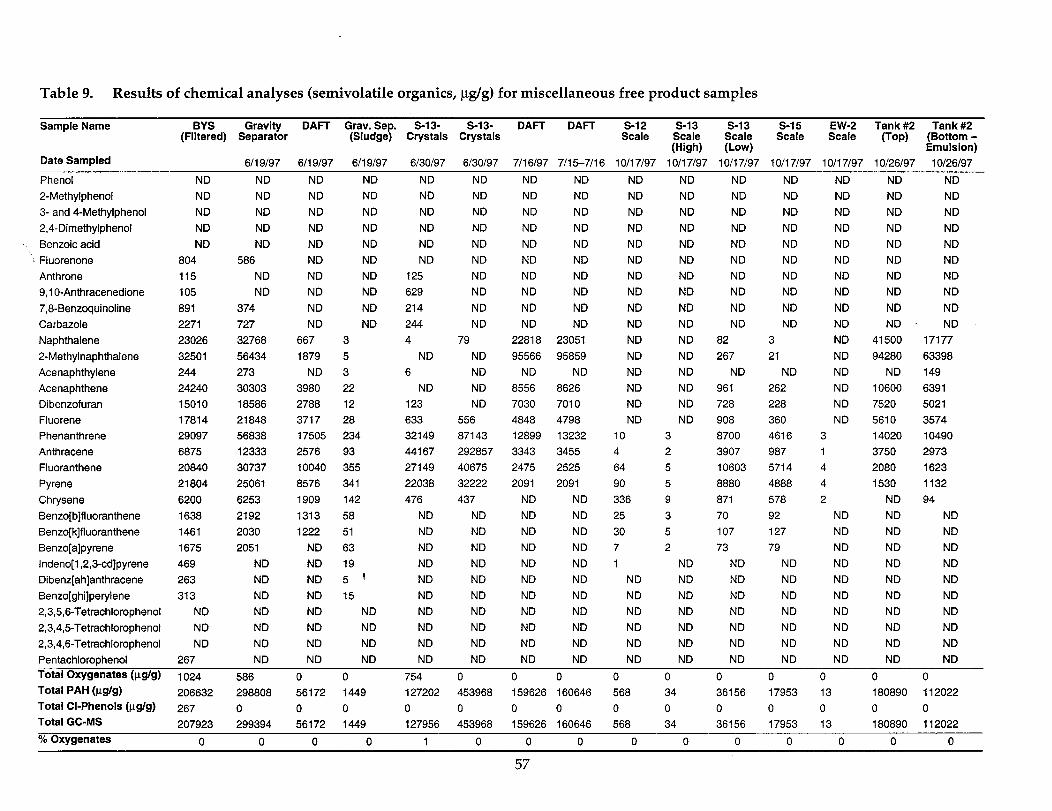
Table 9. Results of chemical analyses (semivolatile organics, pg/g) for miscellaneous free product samples
Sample Name
Date Sampled
BYS Gravity DAFT Grav. Sep. S-l 3- S-l 3- DAFT DAFT s-12 s-13 s-13 s-15 EW-2 Tank #2 Tank #2 (Filtered) Separator (Sludge) Crystals Crystals Scale Scale Scale Scale Scale (Top) (Bottom -
(High) (Low) Emulsion) 6/l 9197 6/l 9197 6/l 9197 6130197 6130197 7116197 7/16-7116 lOll7l97 lOll7l97 lOll7l97 10/17/97 lOll7l97 10126197 10126197
Phenol ND 2-Methylphenol ND 3- and 4-Methylphenol ND 2,CDimethylphenol ND
‘. Benzoic acid ND : Fluorenone 804
Anthrone 115 9,10-Anthracenedione 105 7,&Benzoquinoline 891 Carbazole 2271 Naphthalene 23026 2-Methylnaphthalene 32501 Acenaphthylene 244 Acenaphthene 24240 Dibenzofuran 15010 Fluorene 17814 Phenanthrene 29097 Anthracene 6875 Fluoranthene 20840 Pyrene 21804 Chrysene 6200 Benzo[b]fluoranthene 1638 Benzo[k]fluoranthene 1461 Benzo[a]pyrene 1675 Indeno[l,2,8cd]pyrene 469 Dibenz[ah]anthracene 263 Benzo[ghi]perylene 313 2,3,5,6-Tetrachlorophenol ND 2,3,4,5-Tetrachlorophenol ND 2,3,4,6-Tetrachlorophenol ND Pentachlorophenol 267
ND ND ND ND ND ND ND ND ND ND ND ND ND ND ND ND ND ND ND ND ND ND ND ND ND ND ND ND ND ND ND ND ND ND ND ND ND ND ND ND ND ND ND ND ND ND ND ND ND ND ND ND ND ND ND ND ND ND ND ND ND ND ND ND ND ND ND ND ND ND
586 ND ND ND ND ND ND ND ND ND ND ND ND ND ND ND ND 125 ND ND ND ND ND ND ND ND ND ND ND ND ND 629 ND ND ND ND ND ND ND ND ND ND
374 ND ND 214 ND ND ND ND ND ND ND ND ND ND 727 ND ND 244 ND ND ND ND ND ND ND ND ND ND 32768 667 3 4 79 22818 23051 ND ND 82 3 ND 41500 17177 56434 1879 5 ND ND 95566 95859 ND ND 267 21 ND 94280 63398 273 ND 3 6 ND ND ND ND ND ND ND ND ND 149 30303 3980 22 ND ND 8556 8626 ND ND 961 262 ND 10600 6391 18586 2788 12 123 ND 7030 7010 ND ND 728 228 ND 7520 5021 21848 3717 28 633 556 4848 4798 ND ND 908 360 ND 5610 3574 56838 17505 234 32149 87143 12899 13232 10 3 8700 4616 3 14020 10490 12333 2576 93 44167 292857 3343 3455 4 2 3907 987 1 3750 2973 30737 10040 355 27149 40675 2475 2525 64 5 10603 5714 4 2080 1623 25061 8576 341 22038 32222 2091 2091 90 5 8880 4888 4 1530 1132 6253 1909 142 476 437 ND ND 336 9 871 578 2 ND 94 2192 1313 58 ND ND ND ND 25 3 70 92 ND ND ND 2030 1222 51 ND ND ND ND 30 5 107 127 ND ND ND 2051 ND 63 ND ND ND ND 7 2 73 79 ND ND ND
ND ND 19 ND ND ND ND 1 ND ND ND ND ND ND ND ND 5 ’ ND ND ND ND ND ND ND ND ND ND ND ND ND 15 ND ND ND ND ND ND ND ND ND ND ND ND ND ND ND ND ND ND ND ND ND ND ND ND ND ND ND ND ND ND ND ND ND ND ND ND ND ND ND ND ND ND ND ND ND ND ND ND ND ND ND ND ND ND ND ND ND ND ND ND ND ND ND ND ND ND ND
Total Oxygenates W9) I 024 586 0 0 754 0 0 0 0 0 0 0 0 0 0 Total PAH (Kg/g) 206632 298808 56172 1449 127202 453968 159626 160646 568 34 36156 17953 13 180890 112022 Total Cl-Phenols (pg/g) 267 0 0 0 0 0 0 0 0 0 0 0 0 0 0 Total GC-MS 207923 299394 56172 1449 127956 453968 159626 160646 568 34 36156 17953 13 180890 112022 % Oxygenates 0 0 0 0 1 0 0 0 0 0 0 0 0 0 0
57