Embed Size (px)
Citation preview
a
Semiotic analysis of visual languagesdeveloped by edesign communities
Caroline Brooks
Eng 675 - Final DraftDecember 2, 2002
Table of Contents
Introduction 1
Theoretical background 2
Methods 4
Representational structures chart definitions 7
Analytical structures chart definitions 7
Interactive meaning chart definitions 7
Meaning of composition chart definitions 7
Results 8
Discussion 8
Site 1 - futurefarmers.com screen shot 10
Site 3- fontgraphic.com screen shot 12
Site 4 - Atelier Nord screen shot 12
Site 5 - Bauhaus.de.com screen shot 14
Site 6 - design-museum.de.com screen shot 15
Conclusion 17
Appendix 1 - Futurefarmers.com 19
Appendix 2 - Atlas magazine 21
Appendix 3 - Fontgraphic.com 23
Appendix 4 - Atelier Nord 25
Appendix 5 - Bauhaus archive museum of design 27
Appendix 6 -Vitra design museum 29
Bibliography 31
Introduction
The web is a permanent fixture in many of our lives, and its ubiquity is a major
reason why the visual is becoming the medium ofchoice for communication. As such,
visual literacy is key to the reading and understanding of images within our culture and
society. What is visual literacy? It is a level of awareness, ofknowing that the meaning of
an image is linked implicitly with social context (Hodge & Kress 1988). Images carry
semiotic codes very different from text in their ability to capture and encode societal
norms, expectations and relationships. Kress and Van Leeuwen's social semiotics theory
is the latest in theoretical approaches applied to the analysis ofvisual communication.
Through the extensive use ofvisual examples via art, print media and children's
drawings, Kress and Van Leeuwen strongly reinforce the notion that images carry social
constructs with structural, political and cultural implications.
I would like to take social semiotics theory a step further and apply it to the
analysis of edesign (online design) communities, an area that remains unexplored and
reaches beyond the usability and navigation issues so often associated with analysis of
web sites. These online communities are significant in that they communicate by means
of a hereto undefined visual language. Through the application of social semiotics theory,
my goal is to define and compare, for those outside the communityofweb developers,
these invisible languages which are direct by-products of the sub-cultures from which
they originate.
First a theoretical background for social semiotics will be introduced, including its
originsand an explanation as to why it is the most appropriate semiotics theory to apply
in studying the visual language of edesign communities.
1
Then edesign communities will be identified as categorized by Curt Cloninger in
Fresh stylesfor web designers - Eye candyfrom the underground, along with visual
signs and symbols representative ofeach edesign community. Two examples of each
design style will be analyzed, compared and contrasted according to a number ofcriteria
including:
• Structure
• Interactive meaning
• Composition
Finally, I will conclude with a discussion about the implications of visual literacy,
and the overall significance of social semiotic analysis as it applies to new mediums such
as the web.
Theoretical background
The term semiotics refers to the study and meaning of signs and was named by
Ferdinand Saussure (considered to be the father of Linguistics) (Saussure 1969,
trans.Baskin). Since Saussure's first application of semiotics theory, many schools of
thought have appeared touting their own version ofsemiotics based on their structuralist,
positivist or formalist roots (Saint-Martin 1990). Although there are many schools of
thought, only three apply semiotics to non-linguistic fields such as visual communication.
These schools include the Prague school, the Paris school and the social semiotics school
as defined by Gunther Kress and Theo Van Leeuwen (1996; Merquior 1986).
The Prague school was formed by a group of semioticians and linguists in
Czechoslovakia in 1926 (Dolezel 1997). Their functional view of semiotics emphasized
the importance of social structures upon human communications. Semiotics was not, as
Saussure believed, purely autonomous in form; rather it was closely linked to culture.
This school encouraged interdisciplinary studies as a means for understanding signs and
symbols.
The Paris school was formed by Algirdas Greimas, who propounded a
structuralist approach to semiotics. While similar to Saussure in defining semiotic
systems as autonomous, the Paris school expanded its initial structured analysis of text
into the social sciences. In Semiotics ofthe Natural World, Greimas characterizes
semiotics as "not concerned with sign processes in nature, but with nature seen from the
perspective ofculture" (Noeth 2001).
The social semiotics school was formed based on the work ofM.A.K. Halliday
who developed models of language and applied these to text and context analysis
(Halliday & Hasan 1985). Kress and Van Leeuwen take social semiotics a step further
and apply this theory to the analysis ofvisual commimication where modes of
communication are, ".. ..shaped by the intrinsic characteristics and potential of the
medium and by the requirements, histories and values of societies and their cultures
(ibid.: 34). Kress & Van Leeuwen's contribution to the field of semiotics lies in their
recognition of visual language as an underrated form ofcommunication, which up to now
has been subordinate to verbal language. They suggest that as technology facilitates the
sharing of visual information, a ways and means ofunderstanding visual communication
is more important than ever.
Why is semiotics useful in analyzing visual communication, considering its
linguistic roots? Visual sign systems operate in much the same way as language sign
systems (Koch 1989). According to Kress & Van Leeuwen, "Three parts of traditional
linguistics (semantics, syntactics and pragmatics) have their visual equivalency in
content, composition and medium" (ibid.: 30). While traditional theorists such as Barthes
argue that images are not capable of carrying meaning apart from text, the conceptual
image structures cited by Kress and Van Leeuwen suggest the opposite that "visual
means ofcommunication are rational expressions ofcultural meanings" (ibid.: 75).
Indeed the potential meaning of images has multiplied in the 21®' century and
images are no longer limited to replicating the objects they represent (ibid.: 23). hnages
are becoming more complex signifiers ofmeaning, buried in the social, cultural and
psychological influences that shape visual representation (Sonesson 1989).
Methods
My goal is to determine ifwebsites of the same style classification (as defined in
Cloninger's book, Fresh stylesfor web designers - Eye candyfrom the underground) use
the same visual language semiotically,compared to those web sites with different style
classifications.
The six websites to be analyzed include:
1. Future farmers - Specialists in creative investigation and development ofnew
work between interdisciplinary artists
2. Atlas magazine - Online web design magazine
3. Fontgraphic.com - Japanese font and web design company
4. Atelier Nord - Independent foundation workshop whose focus is new media art,
research, education and development within the realm ofnew media
5. Bauhaus archive museum of design - Bauhaus museum of design website
6. Vitra design museum - Berlin museum website
Each of the above six websites have been classified by Cloninger according to the
following style specifications:
Hello kitty 1950's style:
• bubble characters and pastel colors
• retro futuristic fonts
• contemporary kitsch & vintage art
Mondrian poster style:
• use ofbold blocks of color to delineate sections
• embraces minimalist aesthetic but fills it with color
• modem, functional design
Grid based icon style:
• respect for Bauhaus design
• uses maps, charts, and graphs, focusing on aesthetic usability
• grid based layouts, balancing composition and functional objects
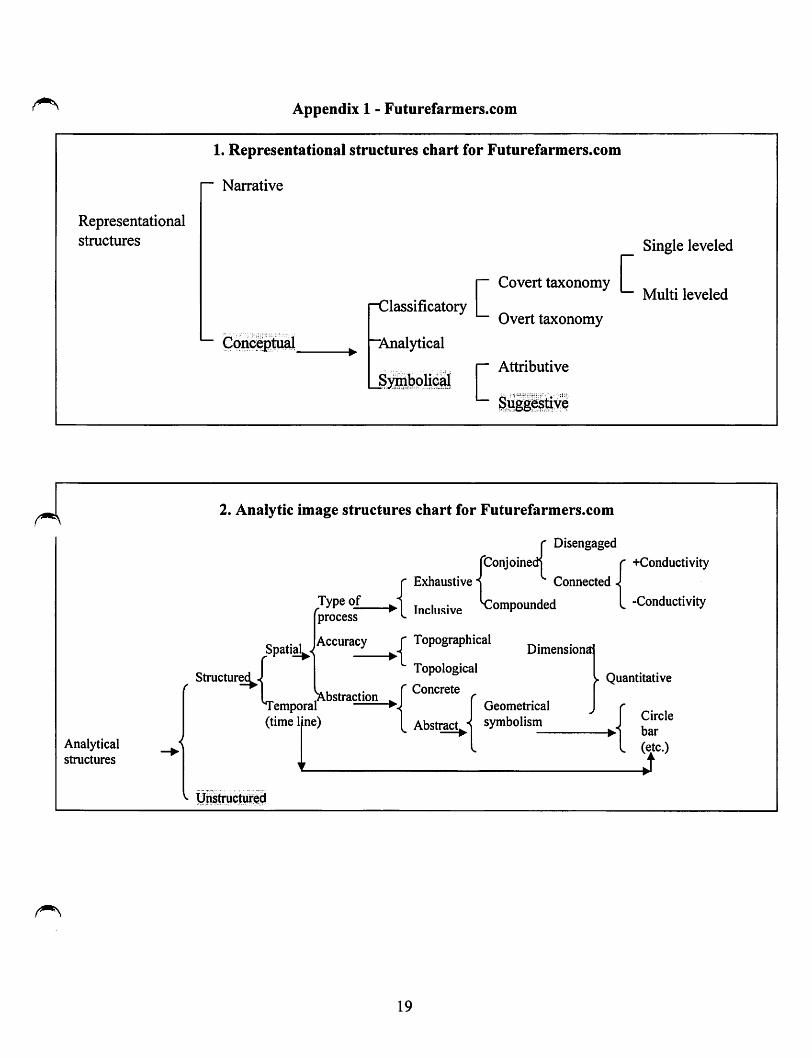
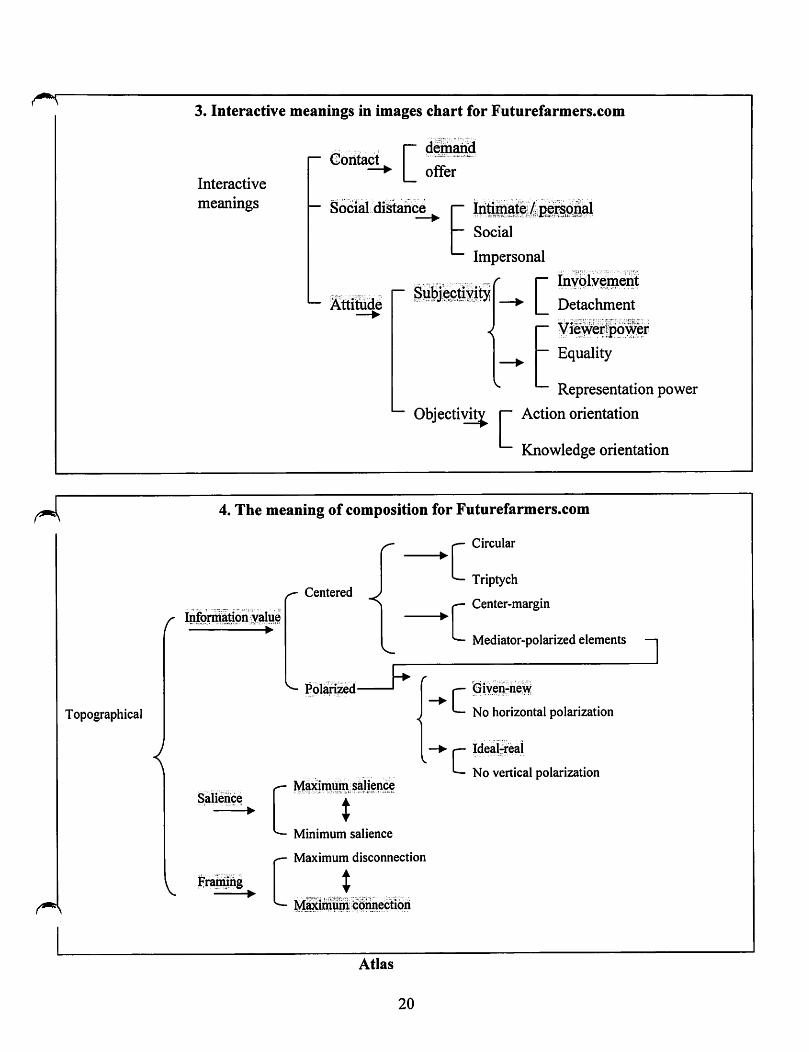
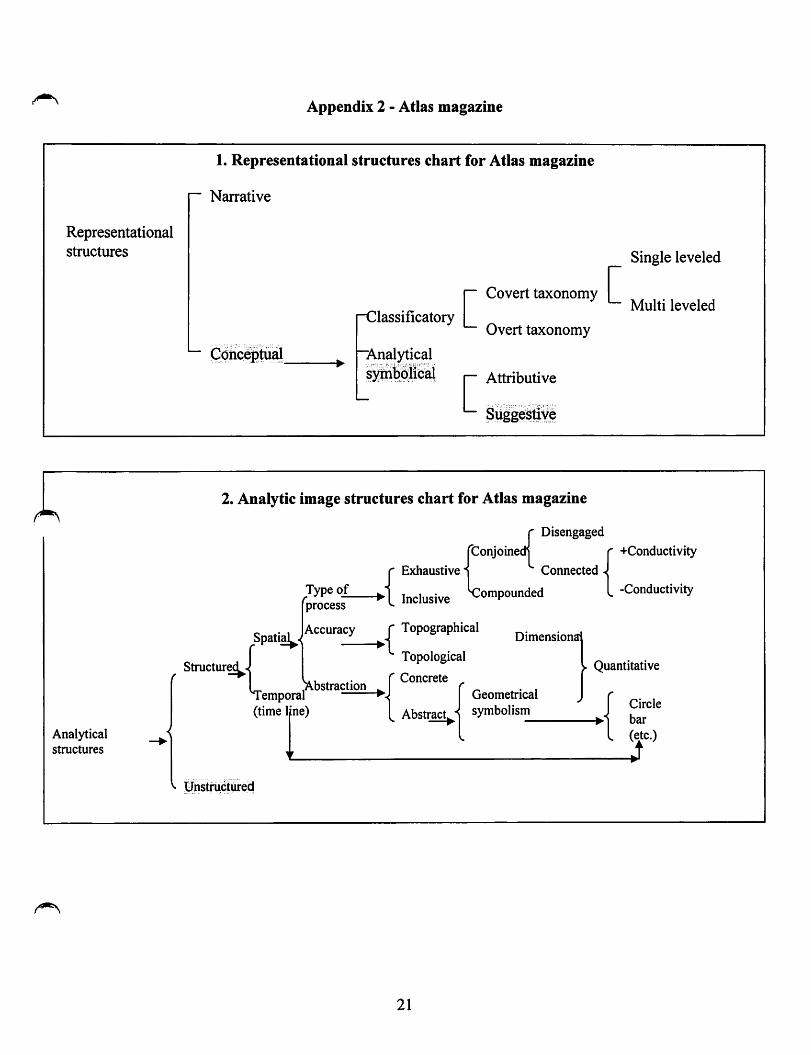
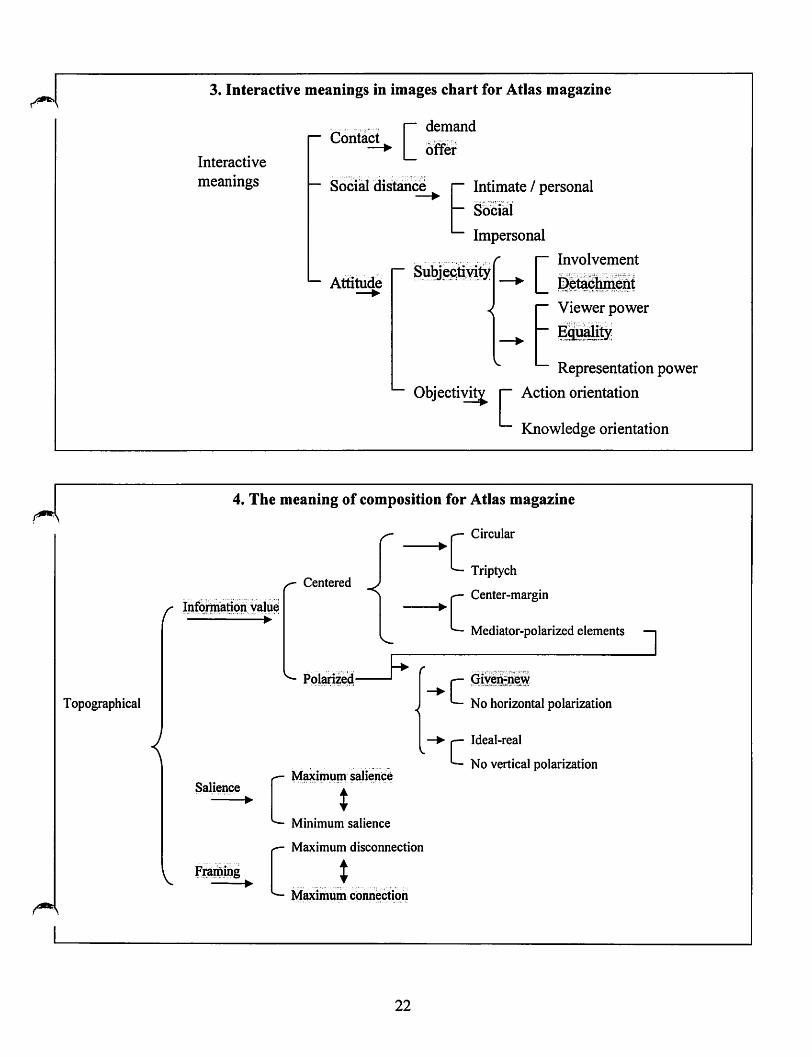
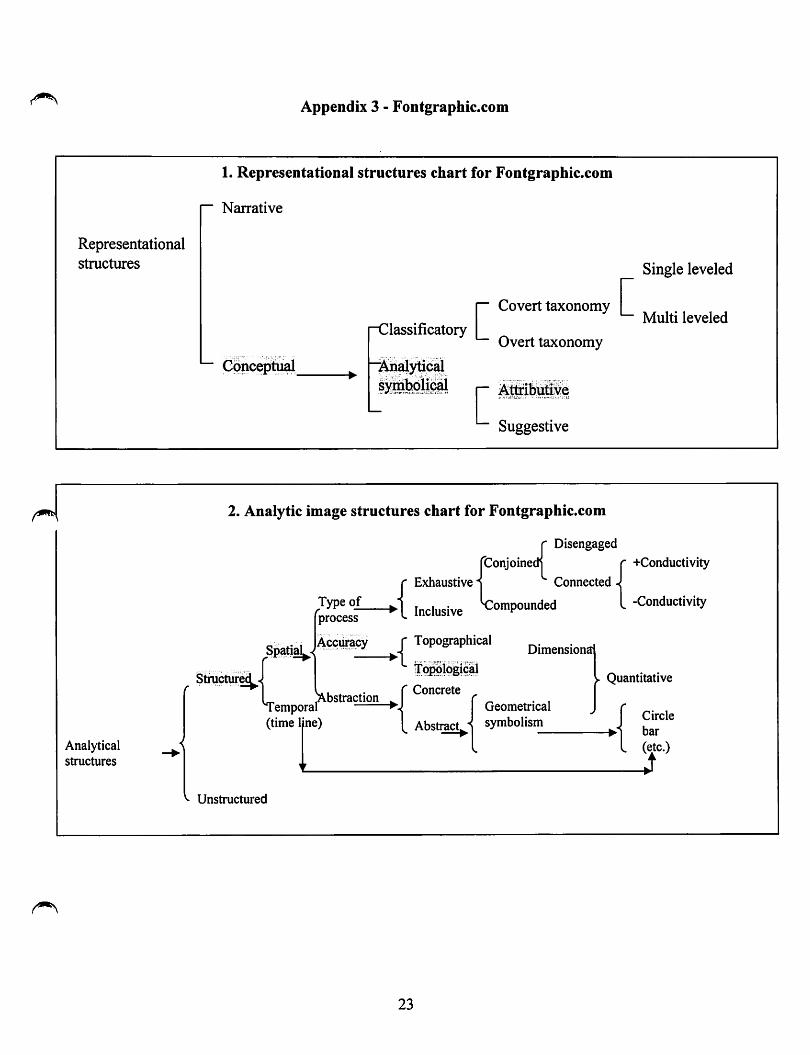
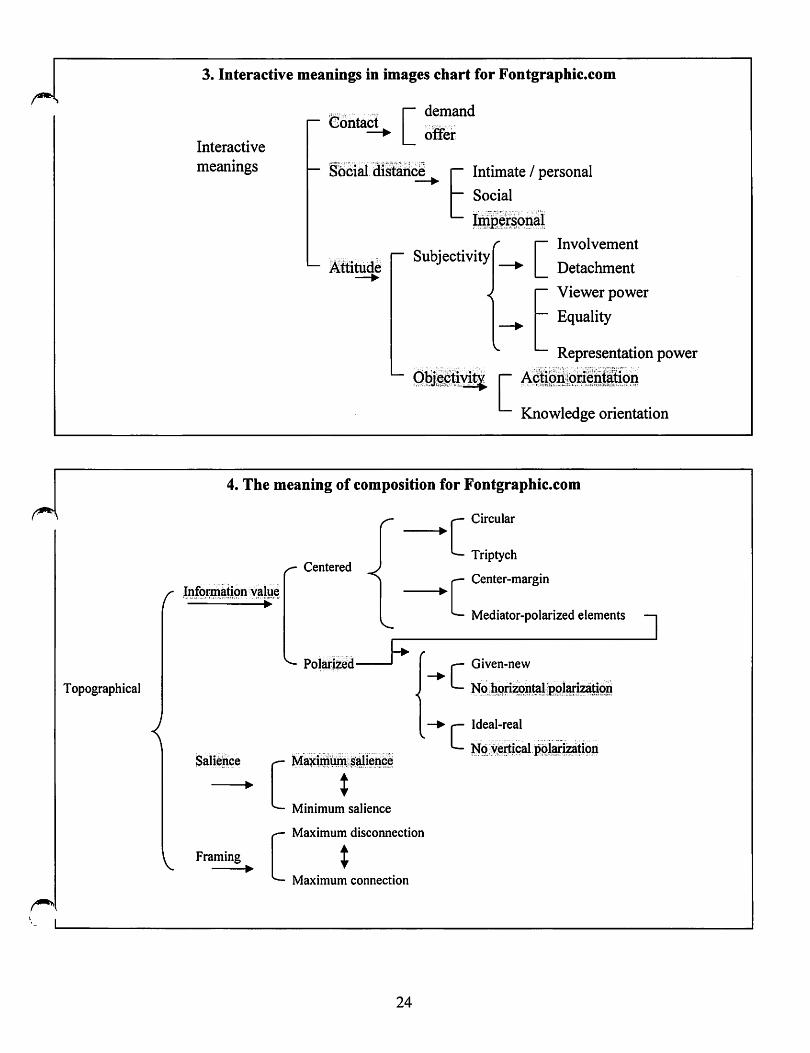
The visual semiotic analysis of each website will be based on the following four
charts created by Kress & Van Leeuwen in Thegrammar ofvisual design:
• Representational structures chart
• Analytic image structures chart
• Interactive meanings in images chart
• Meaning of composition chart
Just as language expresses differences through word classes and semantic structures,
visual communicationexpresses differences through the applicationof compositional
structures and the use of color (Lemke 1998). These charts can be read as maps, where
the process of selecting structures of visual communication is discemable. Eachof the
charts above includes terminology that might be unfamiliar to this audience, and hence a
list ofdefinitions is provided as a quick reference in Table 1.
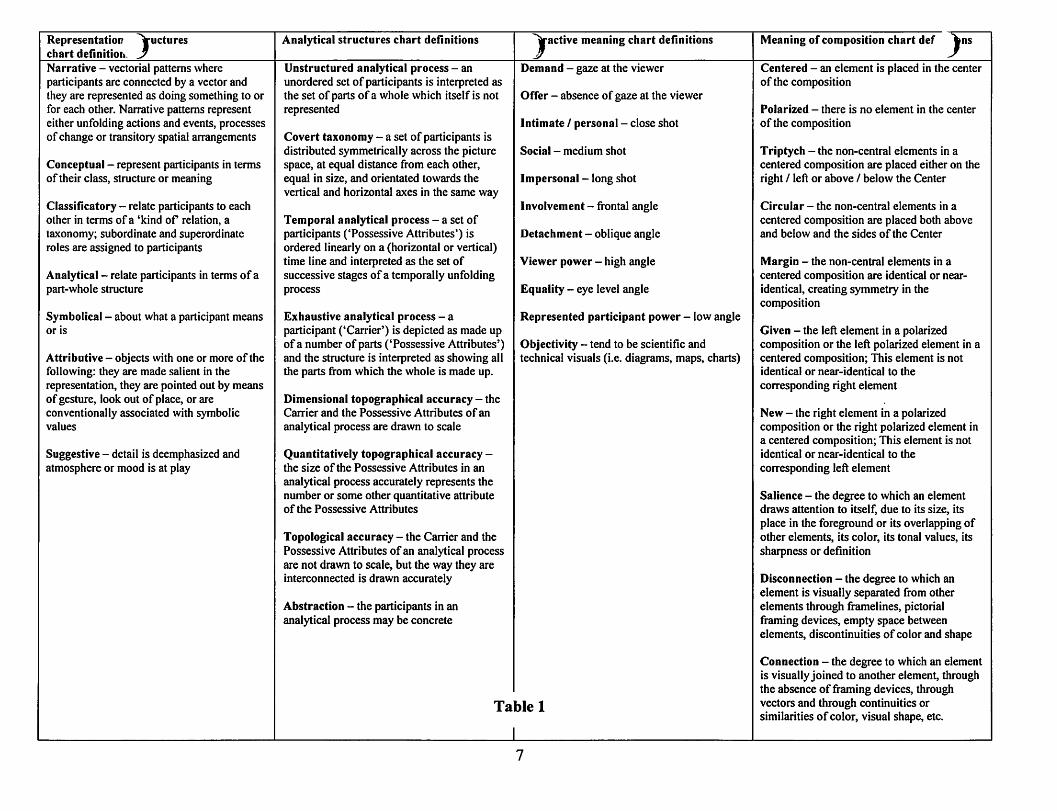
Representationchart definition.
^ucturesNarrative - vectorial patterns whereparticipants are connected by a vector andthey are represented as doing something to orfor each other. Narrative patterns representeither unfolding actions and events, processesofchange or transitory spatial arrangements
Conceptual - represent participants in termsof their class, structure or meaning
Classificatory - relate participants to eachother in terms ofa 'kind of relation, ataxonomy; subordinate and superordinateroles are assigned to participants
Analytical - relate participants in terms of apart-whole structure
Symbolical - about what a participant meansor is
Attributive - objects with one or more of thefollowing: they are made salient in therepresentation, they are pointed out by meansofgesture, look out of place, or areconventionally associated with symbolicvalues
Suggestive - detail is deemphasized andatmosphere or mood is at play
Analytical structures chart definitions
Unstructured analytical process - anunordered set of participants is interpreted asthe set of parts ofa whole which itself is notrepresented
Covert taxonomy - a set ofparticipants isdistributed symmetrically across the picturespace, at equal distance from each other,equal in size, and orientated towards thevertical and horizontal axes in the same way
Temporal analytical process - a set ofparticipants ('Possessive Attributes') isordered linearly on a (horizontal or vertical)time line and interpreted as the set ofsuccessive stages ofa temporally unfoldingprocess
Exhaustive analytical process - aparticipant ('Carrier') is depicted as made upofa number of parts ('Possessive Attributes')and the structure is interpreted as showing allthe parts from which the whole is made up.
Dimensional topographical accuracy - theCarrier and the Possessive Attributes ofan
analytical process are drawn to scale
Quantitatively topographical accuracy -the size of the Possessive Attributes in an
analytical process accurately represents thenumber or some other quantitative attributeof the Possessive Attributes
Topological accuracy - the Carrier and thePossessive Attributes ofan analytical processare not drawn to scale, but the way they areinterconnected is drawn accurately
Abstraction - the participants in ananalytical process may be concrete
^active meaning chart definitionsDemand - gaze at the viewer
Offer - absence of gaze at the viewer
Intimate / personal - close shot
Social - medium shot
Impersonal - long shot
Involvement - frontal angle
Detachment - oblique angle
Viewer power - high angle
Equality - eye level angle
Represented participant power - low angle
Objectivity - tend to be scientific andtechnical visuals (i.e. diagrams, maps, charts)
Table 1
Meaning of composition chart def ^nsCentered - an element is placed in the centerof the composition
Polarized - there is no element in the center
of the composition
Triptych - the non-central elements in acentered composition are placed either on theright / left or above / below the Center
Circular - the non-central elements in a
centered composition are placed both aboveand below and the sides of the Center
Margin - the non-central elements in acentered composition are identical or near-identical, creating symmetry in thecomposition
Given - the left element in a polarizedcomposition or the left polarized element in acentered composition; This element is notidentical or near-identical to the
corresponding right element
New - the right element in a polarizedcomposition or the right polarized element ina centered composition; This element is notidentical or near-identical to the
corresponding left element
Salience - the degree to which an elementdraws attention to itself, due to its size, itsplace in the foreground or its overlapping ofother elements, its color, its tonal values, itssharpness or definition
Disconnection - the degree to which anelement is visually separated from otherelements through framelines, pictorialframing devices, empty space betweenelements, discontinuities ofcolor and shape
Connection - the degree to which an elementis visually joined to another element, throughthe absence of framing devices, throughvectors and through continuities orsimilarities ofcolor, visual shape, etc.
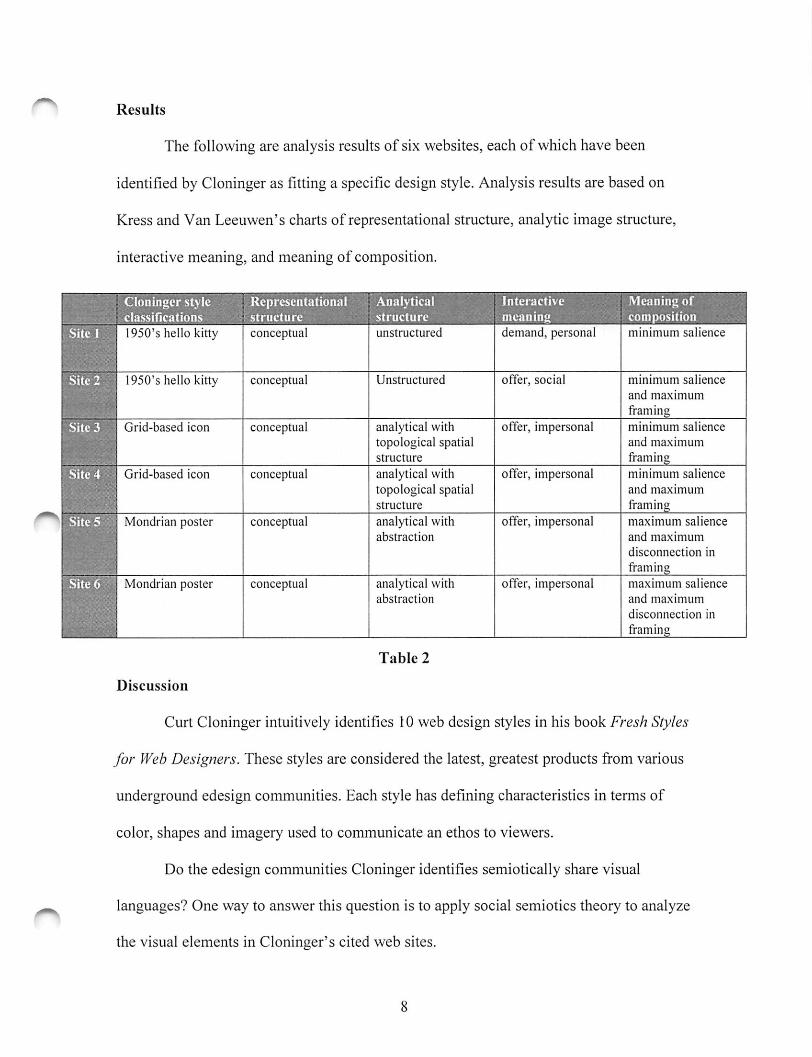
Results
The following are analysis results of six websites, each of which have been
identified by Cloninger as fitting a specific design style. Analysis results are based on
Kress and Van Leeuwen's charts of representational structure, analytic image structure,
interactive meaning, and meaning of composition.
Cloninger style Representational Annlyticalclassifications structure structure
1950's hello kitty j conceptual
1950's hello kitty I conceptual
Grid-based icon I conceptual
Grid-based icon conceptual
Mondrian poster I conceptual
Mondrian poster I conceptual
Discussion
unstructured
Unstructured
analytical withtopological spatialstructure
analytical withtopological spatialstructure
analytical withabstraction
analytical withabstraction
Table 2
Interactive
meanini'
IVIenning ofcomposition
demand, personal minimum salience
offer, social minimum salienceand maximum
framingoffer, impersonal minimum salience
and maximum
framing
offer, impersonal minimum salienceand maximum
framingoffer, impersonal maximum salience
and maximum
disconnection in
framingoffer, impersonal maximum salience
and maximum
disconnection in
framin
Curt Cloninger intuitively identifies 10 web design styles in his book Fresh Styles
for Web Designers. These styles are considered the latest, greatest products from various
underground edesign communities. Each style has defining characteristics in terms of
color, shapes and imagery used to communicate an ethos to viewers.
Do the edesign communities Cloninger identifies semiotically share visual
languages? One way to answer this question is to apply social semiotics theory to analyze
the visual elements in Cloninger's cited web sites.
I first selected three design styles and then identified two websites for each style.
The results of the analysis suggest there are semiotic similarities specific to each style
group, and semiotic differences between different style groups. The results also suggest
all the style groups semiotically have one thing in common, which is in their choosing to
present images conceptually (images are represented according to class, structure or
meaning) rather than narratively (images demonstrating unfolding actions or events).
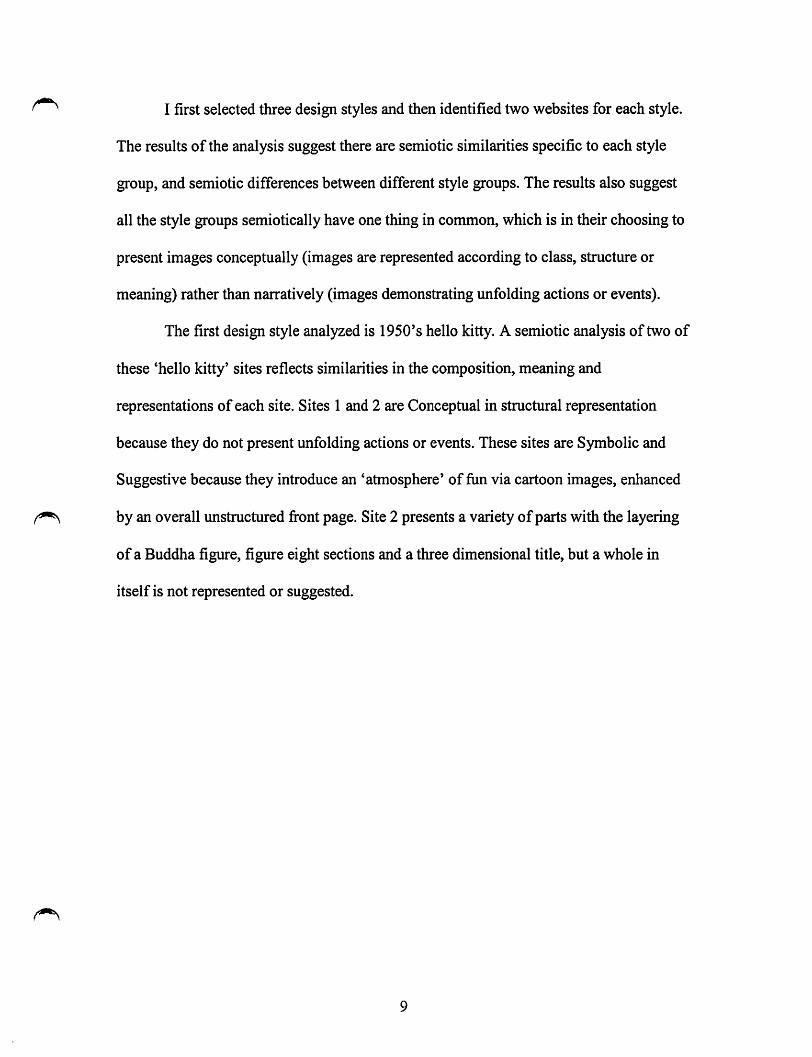
The first design style analyzed is 1950's hello kitty. A semiotic analysis of two of
these 'hello kitty' sites reflects similarities in the composition, meaning and
representations of each site. Sites 1 and 2 are Conceptual in structural representation
because they do not present unfolding actions or events. These sites are Symbolic and
Suggestive because they introduce an 'atmosphere' of fiin via cartoon images, enhanced
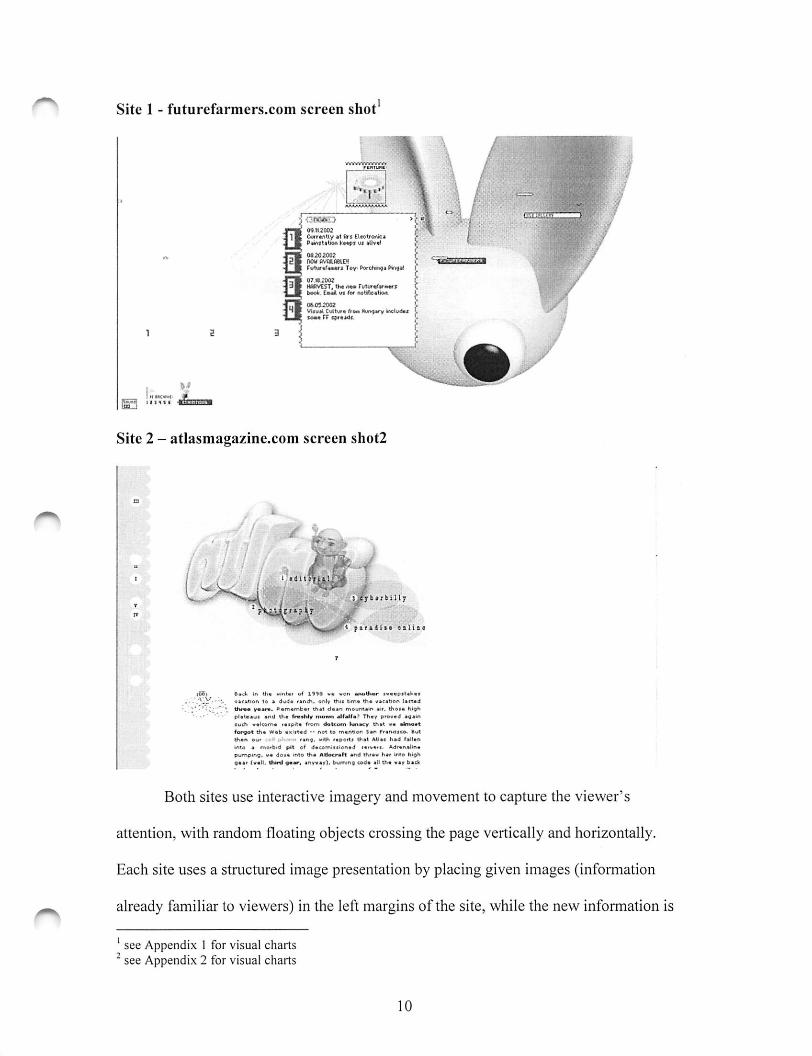
by an overall unstructured fi*ont page. Site 2 presents a variety ofparts with the layering
of a Buddha figure, figure eight sections and a three dimensional title, but a whole in
itself is not represented or suggested.
Site 1 - futurefarmers.com screen shot
pv 04112002|1K CwKntly *t CI*otro<waI K PtintttunktvpT iM *lry*l
1"* 0ii0.»l02ISB nwpvcaiwit<>Ul ru<w«r«M>< T»v: ^cNnftPinfJitrrK o7)8.:oa2laB WWVIST, Ox IHSrirtirWaraM
^ook. EmA vs Itt natjne«tt«\
ITK ObOUOOZ|HB Vi«M( Ci.««ur« Am Hunfvy IncivdM
MM rr
Site 2 - atlasmagazine.com screen shot!
ftfctrbilly
ri pi(ft4U« aaliBi
in Ht4i of «• vO'i
VftcMJon t« * du^« rftntfh. ^nly Chit lim* l«4Ud
thr^# V«ar«. th*t mour»tjir« •ir, thoi« hiQhpUUiaut ftnd th« fi«*l«lv ntovMt TK«y proved
Such f'om doUiim lw>*cv th»( »« yntofft
lor^t eh« Wftb •xiKAd •• not rn«nt)9n $»n Ff»nd<c«. Bwtth«A Our • " '«porti thot AM**
kMA A mo'btd pit of d«eo'Y^S«»>on*d 44r«(S4l<n«pumping. v« dev« into tho Atfecrvft *Ad th'«* h*r lnt« highQ04r (woll. Ui*< J anvv*v), burning cod* »M th4 v4y b4di
Both sites use interactive imagery and movement to capture the viewer's
attention, with random floating objects crossing the page vertically and horizontally.
Each site uses a structured image presentation by placing given images (information
already familiar to viewers) in the left margins of the site, while the new information is
' see Appendix 1for visual charts^seeAppendix 2 for visual charts
presented in the right side margins. For instance, archived versions ofeach site are
accessible through links found in the left side margins.
Salience levels ofboth sites are minimized which means that colors are used in
such a way as to neither distract from nor overtly demand the viewer*s attention.
Connection levels are maximized, meaning visual images are linked in both Site 1 and
Site 2 without the presence of framing devices.
Differences between the hello kitty sites are minor. Site 1 shows the eye of a
bunny rabbit, gazing directly at the viewer. Site 2's Buddha figure is less obtrusive,
gazing off into the distance, offering information rather than demanding the viewer
engage in some sort of interaction with the figure, hi all, these analysis results suggest the
semiotic elements of sites 1 and 2 have more things in common with each other rather
than major differences that separate their visual styles. These commonalities confirm in a
sense that Cloninger has correctly identified two online design communities that not only
communicate in the style of 1950*shello kitty, but also semiotically share similar visual
languages.
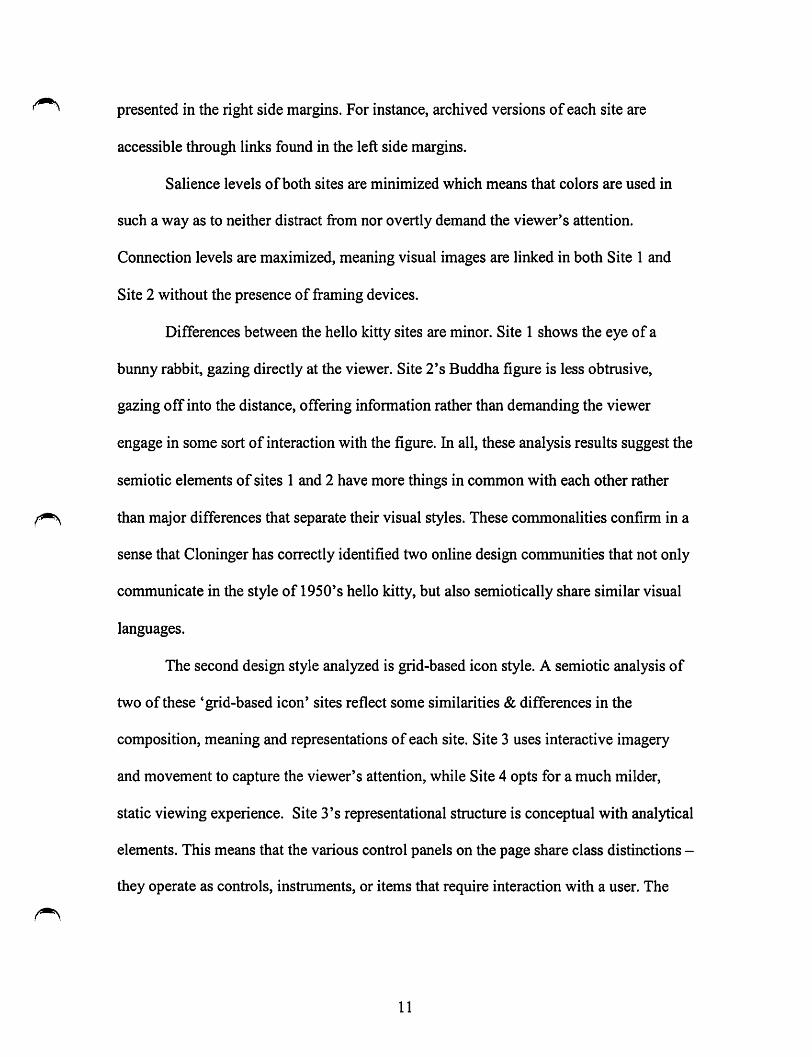
The second design style analyzed is grid-based icon style. A semiotic analysis of
two of these 'grid-based icon' sites reflect some similarities & differences in the
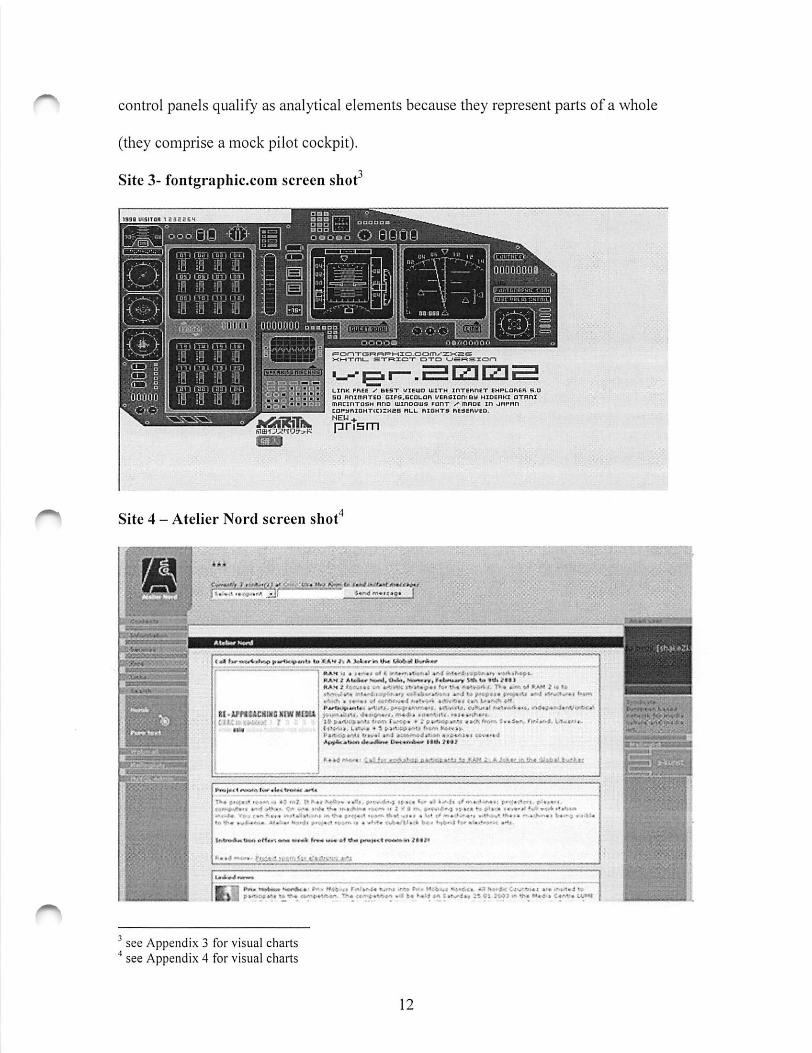
composition, meaning and representations of each site. Site 3 uses interactive imagery
and movement to capture the viewer's attention, while Site 4 opts for a much milder,
static viewing experience. Site 3's representational structure is conceptual with analytical
elements. This means that the various control panels on the page share class distinctions -
they operate as controls, instruments, or items that require interaction with a user. The
11
control panels qualify as analytical elements because they represent parts of a whole
(they comprise a mock pilot cockpit).
Site 3- fontgraphic.com screen shot^
at OOO 0Q m O 0QOQ
(HHHm
ffff;"-mn
OQO.OOO DBBBDa WOKtSl
DOOOiS i?OiiCfC<i50
11-11 -3[ 19 I Il-DOjD
pnsm
Site 4 - Atelier Nord screen shot
I'."
*>• **"**< * ui*/UtniHif
•A*t'< • <* '«i e a' l *•> •'mVKAM i
RAN / K r.its .A fv* tt« j. T>« iMM j t« 1*
ASVyv^f. «te»#**4eWeWfld
iU t^iy* * i 494$*ttrfHhit
iNBWietf^wf•tMVeeiii m'%9
4^ <>• tM •! 7*4 •-» «i tr* »-» »«>»•« •*«• * f> > r«^ ^•« • .kvl »'**•.>*«» H»i f -itMi * H»« •« *
*•» Mtt'J* »•%'<«1* » #*«*• if* •)««*•-»#•< •«*»
Ui»n<t«tliin MM «wiit> 9p** *4*m *4 p»fiai w }M^
Pm Mitim ••««*«« »- « Mw-,i f.«in^4 tvt »M»m «*•»<> »n •»«..!< •: «i* ••••'.•J tct 7s» ft »«ii tM ii «i ;w) ^ m«4.» C4<vt>» Hi»t»
^seeAppendix 3 for visual charts•* see Appendix 4 for visual charts
Jrtunss
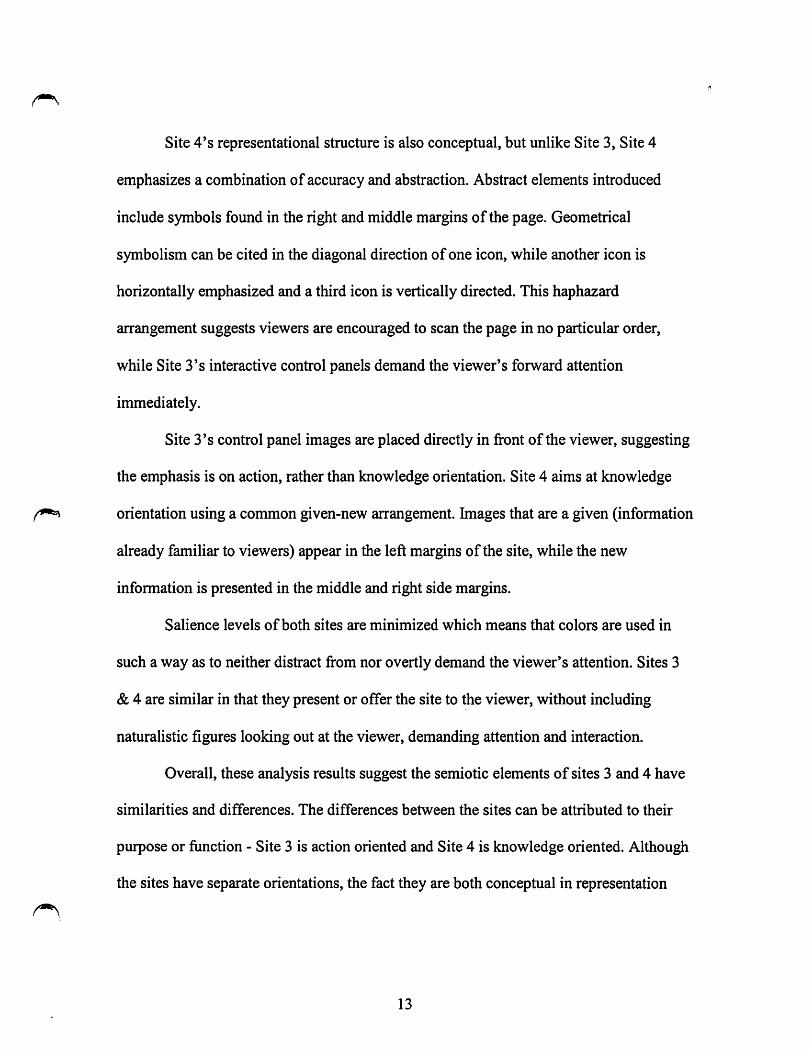
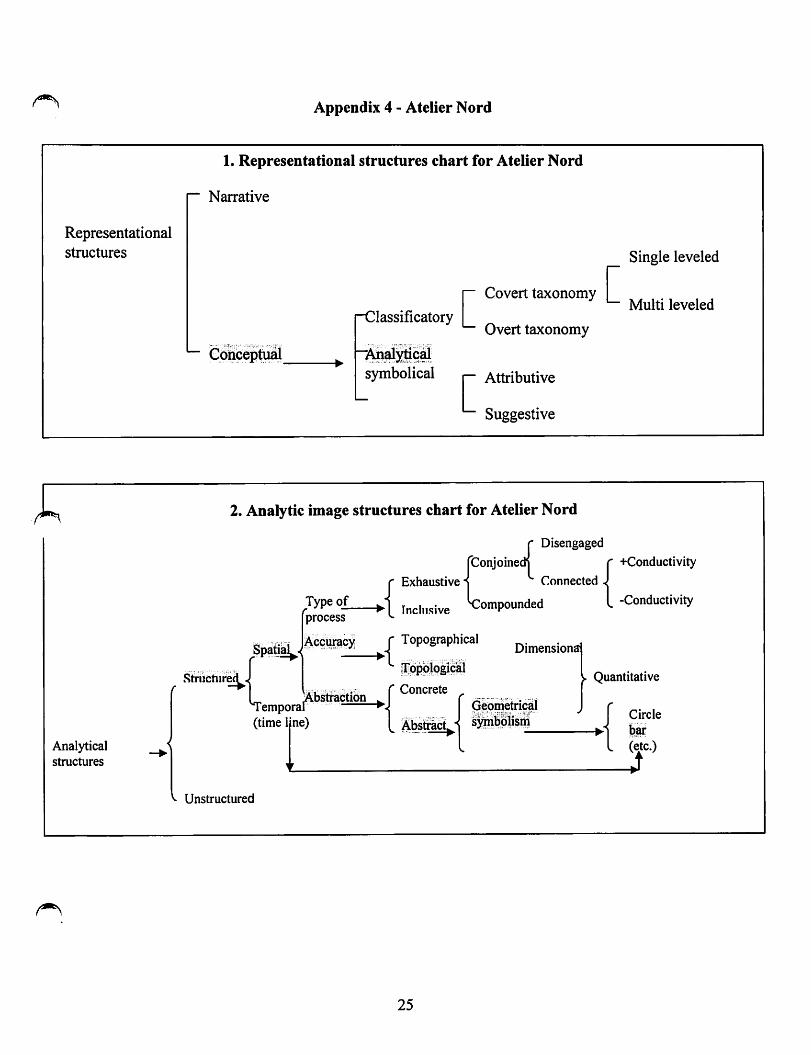
Site 4's representational structure is also conceptual, but unlike Site 3, Site 4
emphasizes a combination of accuracy and abstraction. Abstract elements introduced
include symbols found in the right and middle margins of the page. Geometrical
symbolism can be cited in the diagonal direction ofone icon, while another icon is
horizontally emphasized and a third icon is vertically directed. This haphazard
arrangement suggests viewers are encouraged to scan the page in no particular order,
while Site 3's interactive control panels demand the viewer's forward attention
immediately.
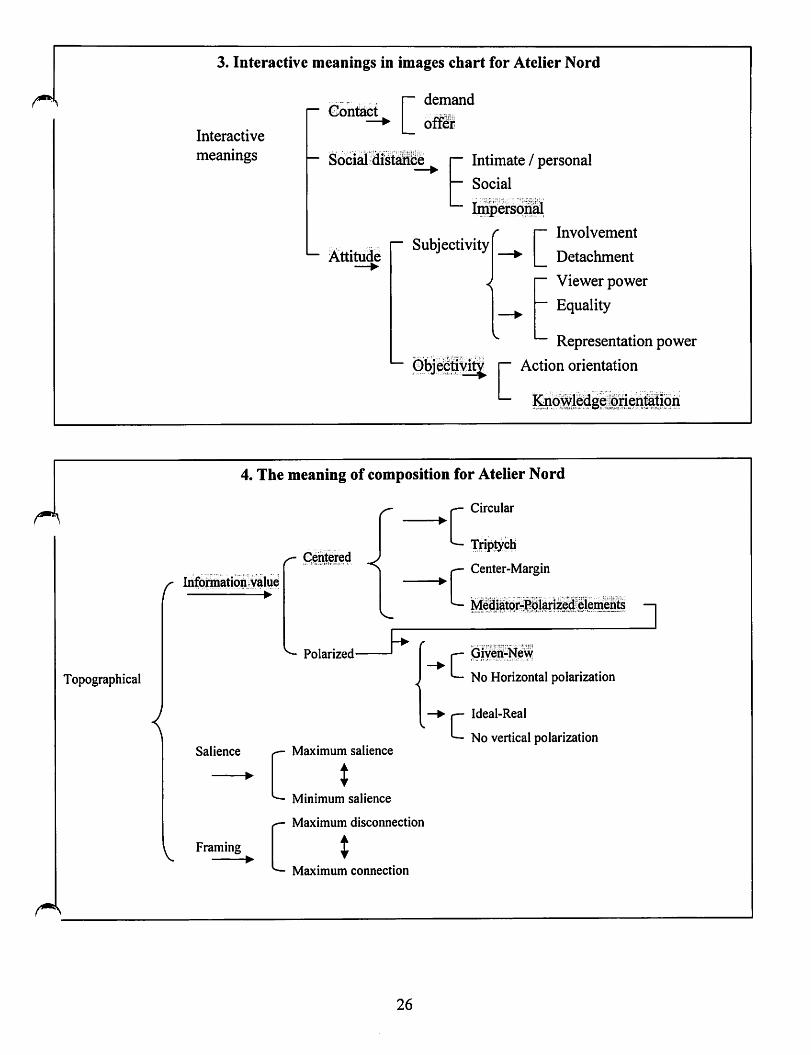
Site 3's control panel images are placed directly in front of the viewer, suggesting
the emphasis is on action, rather than knowledge orientation. Site 4 aims at knowledge
orientation using a common given-new arrangement, hnages that are a given (information
already familiar to viewers) appear in the left margins of the site, while the new
information is presented in the middle and right side margins.
Salience levels ofboth sites are minimized which means that colors are used in
such a way as to neither distract from nor overtly demand the viewer's attention. Sites 3
& 4 are similar in that they present or offer the site to the viewer, without including
naturalistic figures looking out at the viewer, demanding attention and interaction.
Overall, these analysis results suggest the semiotic elements of sites 3 and 4 have
similarities and differences. The differences between the sites can be attributed to their
purpose or fiinction - Site 3 is action oriented and Site 4 is knowledge oriented. Although
the sites have separate orientations, the fact they are both conceptual in representation
13
suggest that again Cloninger has correctly identified two online design communities that
share similar visual languages even while they serve different purposes.
The third design style analyzed is Mondrian poster. A semiotic analysis of two of
these 'Mondrian poster' sites reflects strong similarities in the composition, meaning and
representations of each site. Both sites use color to hierarchically organize space on the
front page. Salience levels of both sites are maximized which means that colors are used
in such a way as to demand the viewer's attention.
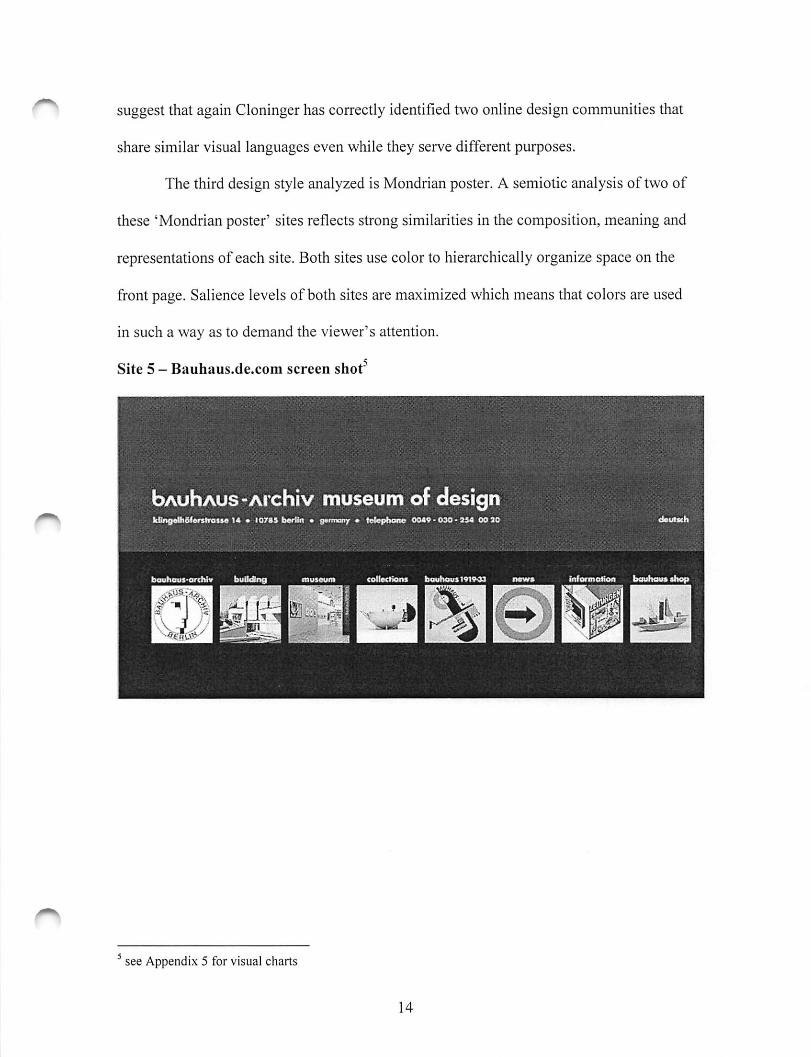
Site 5 - Bauhaus.de.com screen shot^
bAuhAus-Aichiv museum of designi(line*Di3l«rttraiM 14 • I07M bcriiit • Qanmijr • telophane 0049 <030' 254 00 90
bouheus-othlv buOAng mwsawm <olbcHfti» beuheuslVIVM mw» (Rfonnelien bauhowahop
r-n %
see Appendix 5 for visual charts
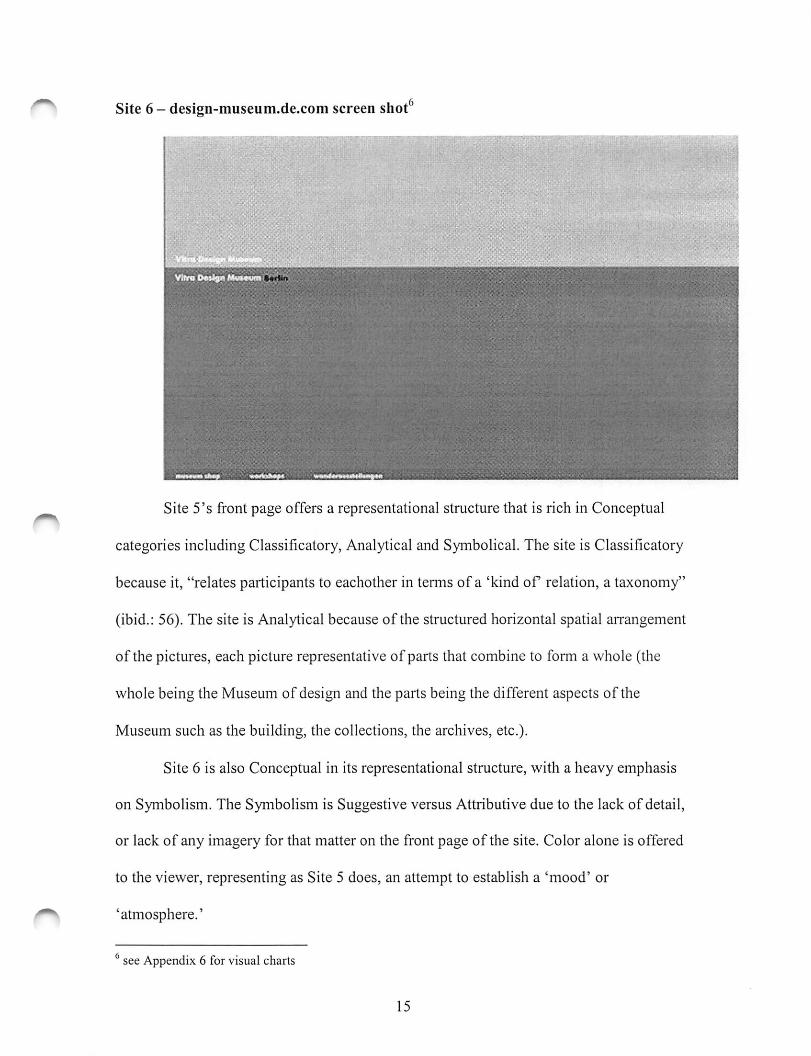
Site 6 - desigii-museum.de.com screen shot
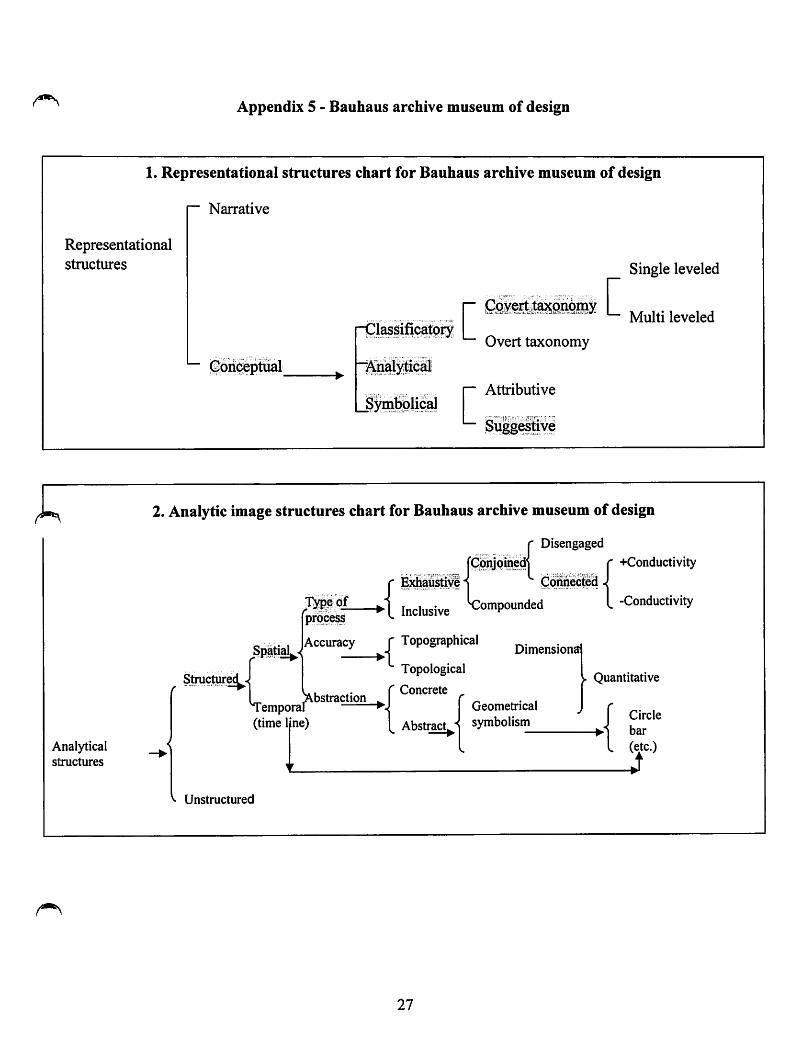
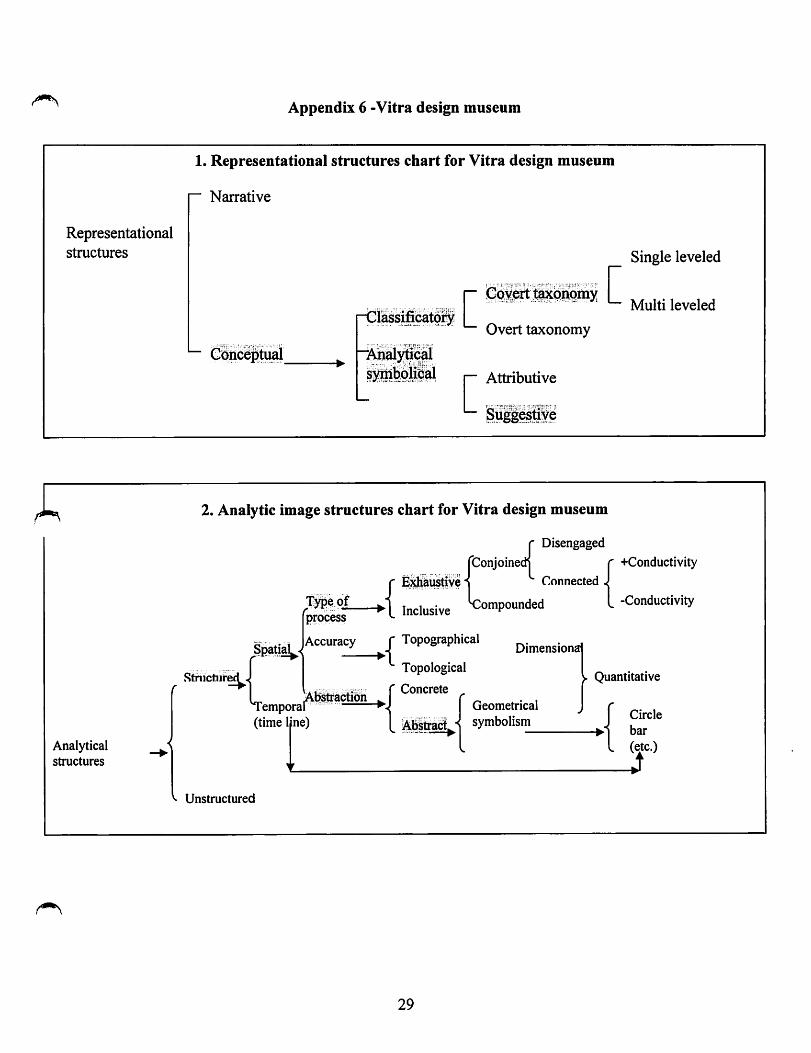
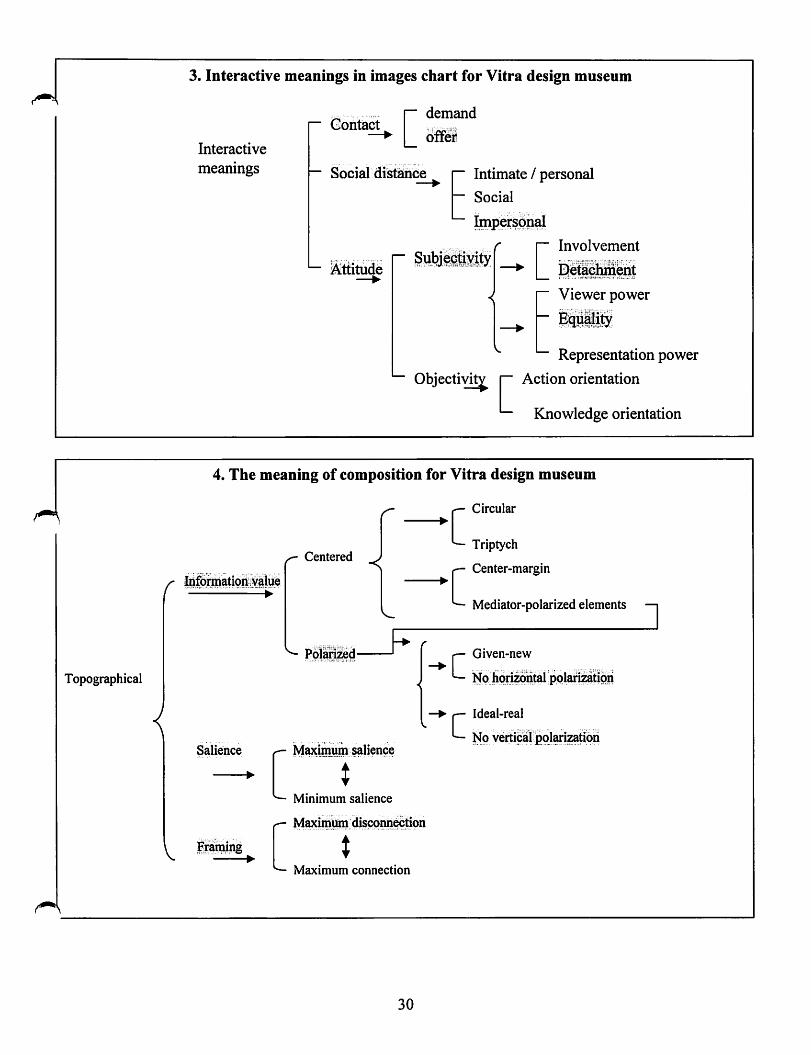
Site 5's front page offers a representational structure that is rich in Conceptual
categories including Classificatory, Analytical and Symbolical. The site is Classificatory
because it, "relates participants to eachother in terms of a 'kind of relation, a taxonomy"
(ibid.: 56). The site is Analytical because of the structured horizontal spatial arrangement
of the pictures, each picture representative of parts that combine to form a whole (the
whole being the Museum of design and the parts being the different aspects of the
Museum such as the building, the collections, the archives, etc.).
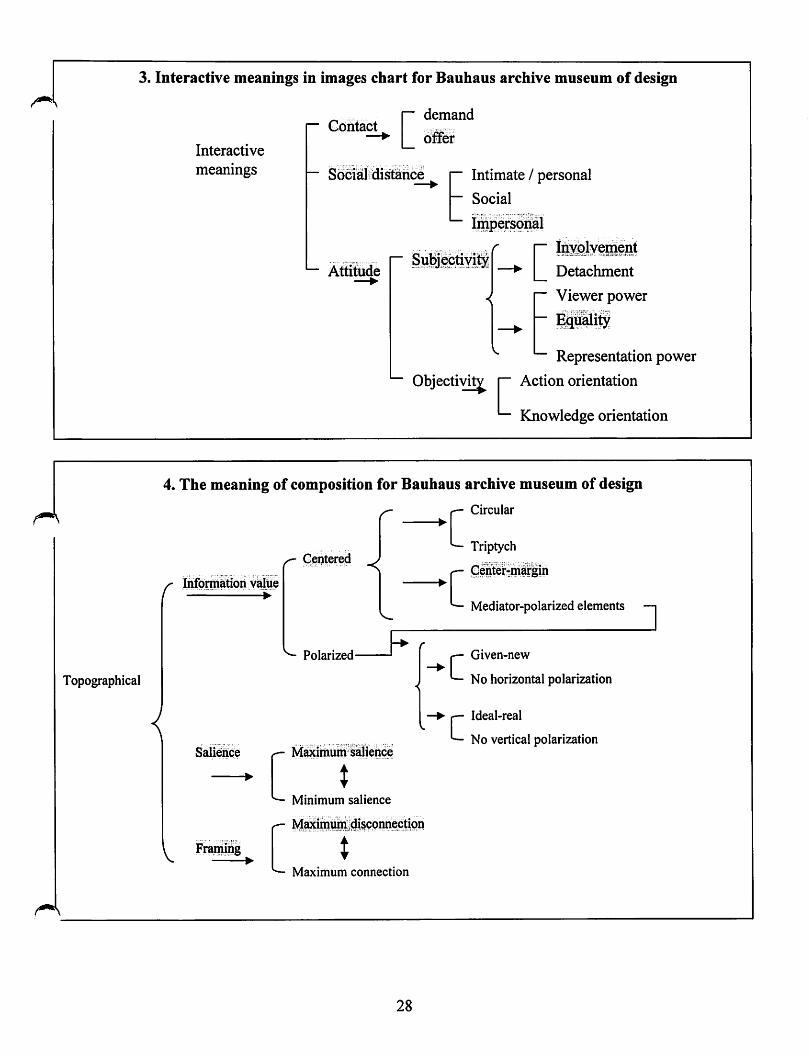
Site 6 is also Conceptual in its representational structure, with a heavy emphasis
on Symbolism. The Symbolism is Suggestive versus Attributive due to the lack of detail,
or lack of any imagery for that matter on the front page of the site. Color alone is offered
to the viewer, representing as Site 5 does, an attempt to establish a 'mood' or
'atmosphere.'
see Appendix 6 for visual charts
Differences betweenthe Mondrian poster sites are minor. Sites 5 and 6 vary
simply in the amount ofdetail presented to the viewer. Both sites offer a sense of
detachment due to the absence ofnaturalistic imagery or interactions offered to viewers.
Both sites have Disconnection that is maximized due to the heavy use and reliance upon
framing devices, specifically the horizontal division of the front page, between the top
and bottom. Both sites focus on knowledge orientation, providing all the information
needed for viewers to grasp the meaning and purpose of each museum.
In all, these analysis results suggest the semiotic elements of sites 5 and 6 have
more things in common with each other rather than major differences that separate their
visual styles. These commonalities again confirm Cloninger has correctly identified two
online design communities that not only communicate in the style ofMondrian poster,
but also semiotically share similar visual languages.
The overall analysis results suggest the sites fitting Cloninger's style
classifications do indeed use similar visual semiotics in communicating to their audience.
Differences between same style sites tend to be related more to the site purpose rather
than to a division between the visual languages used by the sites.
The most interesting observation of the results points to the complete absence of
any narrative representational structures. None of the six websites studied carrya
narrative story element, similar to the narrative one might see in a photographor movie.
The visual language used in these sites is completely limited to conceptual
representational structures.Kress and Van Leeuwen suggest the move to abstract
representation results from, "higher education [which] in our societyis an education in
detachment, abstraction and decontextualization and against naturalism; this results in an
16
attitude which looks for a deeper truth behind appearances" (ibid.: 175). A distinctive
shift to modem design did occur in 1927 where the notion of visual imagery traveled,
"from the dominance ofnature and perception to the dominance of signification and the
conceptual" (Kress & Van Leeuwen 2000: 200).
What do the analysis results imply? They suggest there is an arena of visual
communication that has yet to be explored or even to be acknowledged. Groups ofpeople
interact with one another (physically and virtually), all the while unaware that what is
transparent within one community in forms ofcommunication is not acknowledged or
recognized by those outside the community. What does a better understanding ofvisual
languages (of online communities in particular) offer? The potential is huge, but cannot
be considered without first raising levels of awareness regarding the importance ofvisual
literacy and then establishing a standardized vocabulary for discussing visual
representation and semiotics.
Conclusion
Interpretation ofvisual languages is by its very nature subjective, and an image
can carry multiple messages dependent upon the nature of the visually interpreting
culture. Just as Kress and Van Leeuwen suggest that, ". ..social interactions and social
relations can be encoded in images so that we are instructed silently regarding a set of
implicit norms," the analysis results above suggest it is possible to partially decode
pictorial structures in order to understand visual languages (Kress & Van Leeuwen 1996:
153).
As new mediums ofcommunication are developed within the field of technology,
semiotic analysis ofvisually represented languages is more important than ever. It would
17
seem that the key to understanding these visual languages lies in first recognizing the new
semiotic landscape, and then in exploring the landscape through the ways and means
different cultures communicate amongst each other. Li other words, through studying the
various modes ofrepresentation used in visual languages, perhaps a deeper understanding
can be achieved regarding the effects ofsocial, economic and technological changes
within society upon mediums of communication.
18
Appendix 1 - Futurefarmers.com
1. Representational structures chart for Futurefarmers.com
~ Narrative
Representationalstructures Single leveled
-Classificatory
~ Covert taxonomy
Overt taxonomy
Multi leveled
Gonceptual "Analytical•
Symbolical~ Attributive
Suggestive
Analyticalstructures
2. Analytic image structures chart for Futurefarmers.com
Disengaged
Spatial^.
r Exhaustive
rnrocesf Inclusiveprocess ^
Accuracy
joinecnConjoineI
Connected
xlompounded
' TopographicalDimensions
+Conductivity
^ -Conductivity
Structure^. Topological
Concrete>. Quantitative
Unstructured
Ab;Temporal(time Ime)
straction
Abstract.
19
Geometrical
symbolism Circle
bar
L (^c.)
Topographical
3. Interactive meanings in images chart for Futurefarmers.com
i~ Contact
Interactive
meanings
r~ demand
offer
— Soci^ di^ance Intimate / personal
— Social
Impersonal
^ Attitude—•
SubjectiyityInvolvement
Detachment
Viewer power
Equality
Representation power
Objectivity p Action orientation
Knowledge orientation
4. The meaning of composition for Futurefarmers.com
^ r- Circular
rInformation value
——•
Salience
V FramingV ——•
Centered<
Polarized-
Maximum salience
Minimum salience
Maximum disconnection
Maximum connection
Atlas
20
^ Triptych
^ Center-margin
Mediator-polarized elements —i
Given-new
No horizontal polarization
Ideal-real
No vertical polarization
Appendix 2 - Atlas magazine
1. Representational structures chart for Atlas magazine
~ Narrative
Representationalstructures Single leveled
"Classificatory
~ Covert taxonomy
Overt taxonomy
Multi leveled
Conceptual "Analyticalsymbolical Attributive
Suggestive
Analyticalstructures
2. Analytic image structures chart for Atlas magazine
r Disengaged
Spatial^.
Structurec^^
^empora(time line)
Unstructured
Type ofprocess
Accuracy
straction
r Exhaustive"
'Conjoinedj^ ' +Conductivity
-Conductivity
Connected ^
Inclusive Compounded
' TopographicalDimensionai
Topological
r Concrete .
Abstract.
21
Geometrical
symbolism
Quantitative
Circle
bar
(^c.)-J
Topographical
<
r
3. Interactive meanings in images chart for Atlas magazine
(— Contact
Interactive
meanings
r demand
offer
— Social distance Intimate / personal
— Soci^
Impersonal
~ Attitude—•
SubjectivityInvolvement
Detaclmient
Viewer power
EquMity
Representation power
Objectivity p Action orientation
Knowledge orientation
4. The meaning of composition for Atlas magazine
r- Circular
Information value>"
Salience
Centered
Polarized-
Maximum salience
Triptych
Center-margin
Mediator-polarized elements —
r- Given-new
^ No horizontal polarization
|— Ideal-real
No vertical polarization
V Frariiiing^ ——•
Minimum salience
Maximum disconnection
XMaximum connection
22
Appendix 3 - Fontgraphic.coni
1. Representational structures chart for Fontgraphic.com
~~ Narrative
Representationalstructures Single leveled
Conceptual
"Classificatory
"Analytical
~ Covert taxonomy
Overt taxonomy
Multi leveled
symbolical ~ A.tti:ibutive
Suggestive
Analyticalstructures
2. Analytic image structures chart for Fontgraphic.com
r Disengaged
fConjoinem
r Exhaustive Connected -
' +Conductivity
^ -Conductivityrlrirr Inclusive Woundedprocess ^
Spatial^ >Accuracy
Structure^.
It,emporal(time line)
Abstraction
Unstructured
' Topographical
Topological
Concrete _
Dimensional
Abstract^"Geometrical
symbolism
23
Quantitative
Circle
bar
L (^c.)-J
Topographical
3. Interactive meanings in images chart for Fontgraphic.com
|— Contact
Interactive
meanings
~ demand
offer
— Social distance Intimate / personal
~ Social
Impersonal
Involvement
Detachment
Viewer power
Equality
^ Attitude—•
Subjectivity
Representation power
Objectivity p Action orientation
Knowledge orientation
4. The meaning of composition for Fontgraphic.com
r— Circular
Information value
Saliehce
1 FramingV •
Centered
Polarized-
Maximtim, salience
Minimum salience
Maximum disconnection
XMaximum connection
24
Triptych
Center-margin
Mediator-polarized elements —i
j— Given-new
Nohorizontal ppi^izajS^^
r- Ideal-real
No vertical pol^ization
Appendix 4 - Atelier Nord
1. Representational structures chart for Atelier Nord
~ Narrative
Representationalstructures Single leveled
-Classificatory
~ Covert taxonomy
Overt taxonomy
Multi leveled
Conceptual "Analytic^•
symbolical — Attributive
Suggestive
Analyticalstructures
2. Analytic image structures chart for Atelier Nord
StriicturM
Unstructured
Exhaustive
r Disengaged
'Conjoined] f +ConductivityConnected J
Type of ^-j Icompoundedprocess
^ -Conductivity
laL ^
empora
(time line)
Accuracy
•sttaction
' Topographical
Topological
'• Concrete ,
Dimensional
. Abstract^ ^Geometrical
symbolism
25
Quantitative
r Circle
. (^c.)J
Topographical
3. Interactive meanings in images chart for Atelier Nord
r~ demand
Interactive
meanings
r~ Contact
— Social distance Intimate / personal
— Social
Impersoial
n Involvement
Detachment
Viewer power
Equality
^ Attitude—•
Subjectivity
Representation power
Objectivity p Action orientation
Knowledge orientation
4. The meaning of composition for Atelier Nord
r— Circular
rInfoiination Value——— •
Salience
. FramingV •
Gehtered
Polarized-
Maximum salience
Minimum salience
Maximum disconnection
Maximum connection
26
^ Triptychl
f- Center-Margin
Mediator-Polarized elements ^
[— Given-New
^ No Horizontal polarization
— Ideal-Real
^ No vertical polarization
Appendix 5 - Bauhaus archive museum of design
1. Representational structures chart for Bauhaus archive museum of design
~ Narrative
Representationalstructures Single leveled
-Glassificatory
~ Covert taxonomy
Overt taxonomy
Multi leveled
Conceptual "Analytical
_Symbolical~ Attributive
Suggestive
Analyticalstructures
2. Analytic image structures chart for Bauhaus archive museum of design
Disengaged
Exhaustive
ijoined^Wounded
process
Conjoined^ f +ConductivityGoinected
^ -Conductivity
Spatial^. Accuracy ' TopographicalDimensional
Structurec^.straction
Temporal(time line)
Unstructured
Topological
Concrete ^
Abstract^"
27
Geometrical
symbolism
Quantitative
Circle
bar
(etc.)
-J
3. Interactive meanings in images chart for Bauhaus archive museum of design
(~ Gohtact
Topographical
Interactive
meanings
r~ demand
offer
— Sociali distance Intimate / personal
— Social
Impersonal
r Invqlvenient
Detachment
Viewer power
Equality
— Attitude—•
Subjectivity
Representation power
Objectivity p Action orientation
Knowledge orientation
4. The meaning of composition for Bauhaus archive museum of design
r- Circular
r
{
Infonn^tion value•— •
Salieince
1 FramingV ——•
Centered<
Polarized-
Maxlmiun salience
Minimum salience
Ma?dmum disconnection
Maximum connection
28
^ Triptych
r— Center-^m^gin
^ Mediator-polarized elements —i
|— Given-new
No horizontal polarization
r— Ideal-real
No vertical polarization
Appendix 6 -Vitra design museum
1. Representational structures chart for Vitra design museum
~ Narrative
Representationalstructures Single leveled
Conceptual
-Classificatoi^
"Analytical
~ Covert taxonomy
Overt taxonomy
Multi leveled
symbolical — Attributive
Suggestive
Analyticalstructures
2. Analytic image structures chart for Vitra design museum
Disengaged
Type ofprocess
Accuracy
'Conjoinedj^Exl^iu^e Connected ^
Inclusive Compounded
' TopographicalDimensional
+Conductivity
^ -Conductivity
>Stnictiiref^. Topological
r Concrete ^Quantitative
^empora(time Ime)
Unstructured
straction
Abstract
29
Geometrical
symbolism Circle
bar
(etc.)
Topographical
<
3. Interactive meanings in images chart for Vitra design museum
(— Gontact
Interactive
meanings
r~ demand
offer
— Social diMnce Intimate / personal
~ Social
Impersonal
F Involvement
Detachrnent
Viewer power
Equality
^ i^itude—•
Subjectiyity
Representation power
Objectivity p Action orientation
^ Knowledge orientation
4. The meaning of composition for Vitra design museum
r- Circular
rInformation,value
"""•
Salience
, Framing^ ^—•
Centered•<
Polarized-
Maximimi salience
Minimum salience
Maximum disconn^tion
XMaximum connection
30
^ Triptych
Center-margin
Mediator-polarized elements —i
(— Given-new
^ No horizontal polarization
r— Ideal-real
^ Nq veitic^ pql^z^q^
Bibliography
Barthes, Roland. 1977. Image-Music-Text. New York: Hill & Wang.
Cloninger, Curt. 2001. Fresh Stylesfor Web Designers - Eye Candyfrom theUnderground. Indianapolis: New Riders Publishing.
Dolezel, Lubomir. 1997. 'Prague School Structuralism.' Baltimore, Maryland: The JohnHopkins University Press: 1.
Halliday, Michael, and Hasan, Ruqaiya. 1985.Language, context and text: aspects oflanguage in a social-semioticperspective. Oxford: Oxford University Press.
Hodge, Robert, and Kress, Gunther. 1988. Social Semiotics. Ithaca, New York: CornellUniversity Press.
Koch, Walter. 1989. The Nature ofCulture. Bochum: Brockmeyer.
Kress, Gunther and Van Leeuwen, Theo. 2001. Reading Images: The Grammar of VisualDesign, London, Routledge.
Kress, Gunther and Van Leeuwen, Theo. 2000. The Modern Spring 2000 Volume 14Number 1. Detroit Area Art Deco Society: 200.
Lemke, Jay. 1998. 'Multiplying Meaning: Visual and Verbal Semiotics in ScientificText' in J. R. Martin & R. Veel, Eds., Reading Science. London, Routledge: 87-113.
Merquior, Jose. 1986. From Prague to Paris: A Critique ofStructuralist and Post-Structuralist Thought. London: Verso Books.
Noeth, Winfiied. 2001. Semiotic Threshold Nature Culture. Bakhtin Centre, UniversityofSheffield: 1.
Saint-Martin, Femande.1990. Semiotics of Visual Language. Bloomington, IndianaUniversity Press.
Saussure, Ferdinand. 1969. Course in General Linguistics, trans. Baskin, Wade. NewYork: McGraw-Hill.
Sonesson, Goran. 1989. Pictorial Concepts. Lund: Lund University Press.
Sonesson, Goran. 2002. 'Visual signs in the age of digital reproduction.' Lund, LundUniversity Press.
31