Embed Size (px)
Citation preview
University of LjubljanaFaculty of Mathematics and Physics
Department of physics
Seminar Ib - 1. letnik, II. stopnja
Optical holographic recording incomposite materials from polymers and
ionic liquids
Author: Ga²per Glavan
Mentor: prof. dr. Irena Dreven²ek Olenik
Ljubljana, 2017
Abstract
An investigation of the recording and readout of transmission gratings in composites of poly(ethyleneglycol) dimethacrylate (PEGDMA) and ionic liquids is presented for the series of samples withvarious thicknesses. Monitored was evolution of grating. To obtain a complete characterizationof gratings, measurments of angular dependence of di�raction e�ciency and two-beam couplingexperiments were conducted.
Contents
1 Introduction 1
2 Holography 1
3 Di�raction theories 3
3.1 In-Bragg di�raction . . . . . . . . . . . . . . . . . . . . . . . . . . . . . . . . . . . . . 33.2 O�-Bragg di�raction . . . . . . . . . . . . . . . . . . . . . . . . . . . . . . . . . . . . 3
4 Experiments 7
4.1 Samples . . . . . . . . . . . . . . . . . . . . . . . . . . . . . . . . . . . . . . . . . . . 74.2 Recording of grating structures . . . . . . . . . . . . . . . . . . . . . . . . . . . . . . 74.3 Read out process and kinetics of holographic grating evolution . . . . . . . . . . . . . 84.4 Two-beam coupling experiments . . . . . . . . . . . . . . . . . . . . . . . . . . . . . . 94.5 Angular dependence of di�raction e�ciency . . . . . . . . . . . . . . . . . . . . . . . 94.6 Light-induced scattering . . . . . . . . . . . . . . . . . . . . . . . . . . . . . . . . . . 10
5 Conclusions 12
Bibliography 12
1 Introduction
Traditional photosensitive materials are either photochromic or photorefractive crystals [1] or photo-sensitive polymers [2]. The former o�er excelent optical properties, thermal and temporal stabilityand allow the read-write option, but exhibit a relatively low light-induced refractive-index mod-ulation (in the order of ≤ 10−4). In contrast, the latter (polymers) o�er larger refractive-indexmodulation (up to 10−2), but are less controlable, because of polymer shrinkage and bad thermalstability. In a search for better materials the focus moved to polymer composites, such as polymer-liquid crystal composites [3] or polymer-nanoparticle composites [4]. Recently there were introducedcomposites consisting of ionic liquids embedded in a polymer matrix [5]. These composites allowto combine and make use of individual advantages of their constituents. Consequently they arepromising candidates for applications in devices such as actuators, electrically-switchable elements,in distributed feedback laser or di�ractive optical elements for light and neutrons [6].
The seminar will start with theoretical introduction of basic properties of optical holography. Therest of the seminar will describe experimental investigations of holographic gratings in compositesof polymers and ionic liquids (IL).
2 Holography
Holography is the science and practice of making holograms, which are 3D images recorded in aphotographic plate or some other photosensitive medium.
Light wave re�ected from an object carries information abouth surface morphology of the objectin its phase. When taking photos with camera, only information about intensity of the re�ectedlight is preserved. But in holography also the information about the phase is retained. This isachieved by recording an interference pattern of two beams. One of them is sent directly on the
1
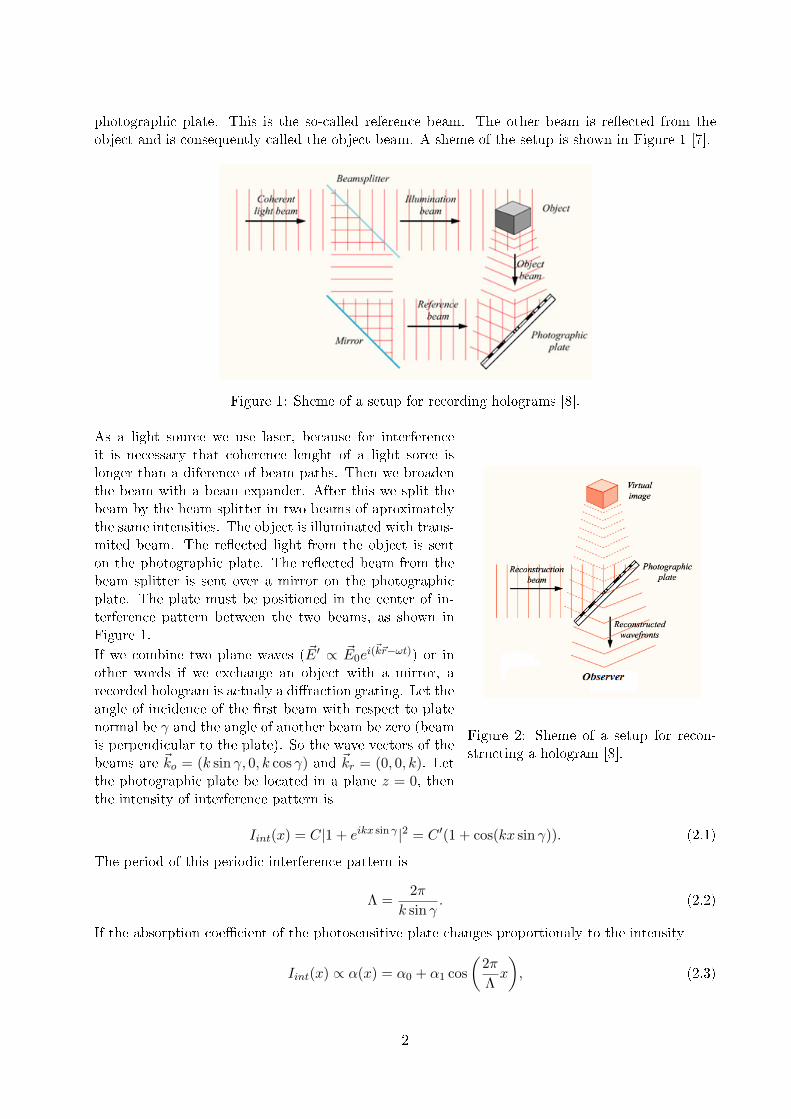
photographic plate. This is the so-called reference beam. The other beam is re�ected from theobject and is consequently called the object beam. A sheme of the setup is shown in Figure 1 [7].
Figure 1: Sheme of a setup for recording holograms [8].
Figure 2: Sheme of a setup for recon-structing a hologram [8].
As a light source we use laser, because for interferenceit is necessary that coherence lenght of a light sorce islonger than a diference of beam paths. Then we broadenthe beam with a beam expander. After this we split thebeam by the beam splitter in two beams of aproximatelythe same intensities. The object is illuminated with trans-mited beam. The re�ected light from the object is senton the photographic plate. The re�ected beam from thebeam splitter is sent over a mirror on the photographicplate. The plate must be positioned in the center of in-terference pattern between the two beams, as shown inFigure 1.
If we combine two plane waves ( ~E′ ∝ ~E0ei(~k~r−ωt)) or in
other words if we exchange an object with a mirror, arecorded hologram is actualy a di�raction grating. Let theangle of incidence of the �rst beam with respect to platenormal be γ and the angle of another beam be zero (beamis perpendicular to the plate). So the wave vectors of thebeams are ~ko = (k sin γ, 0, k cos γ) and ~kr = (0, 0, k). Letthe photographic plate be located in a plane z = 0, thenthe intensity of interference pattern is
Iint(x) = C|1 + eikx sin γ |2 = C ′(1 + cos(kx sin γ)). (2.1)
The period of this periodic interference pattern is
Λ =2π
k sin γ. (2.2)
If the absorption coe�cient of the photosensitive plate changes proportionaly to the intensity
Iint(x) ∝ α(x) = α0 + α1 cos
(2π
Λx
), (2.3)
2
we obtain absorption grating. If refractive index of the medium is modi�ed as
Iint(x) ∝ n(x) = n0 + n1 cos
(2π
Λx
), (2.4)
we obtain phase grating. However, in most of materials it is possible to generate both, absorptionand phase gratings [7].
3 Di�raction theories
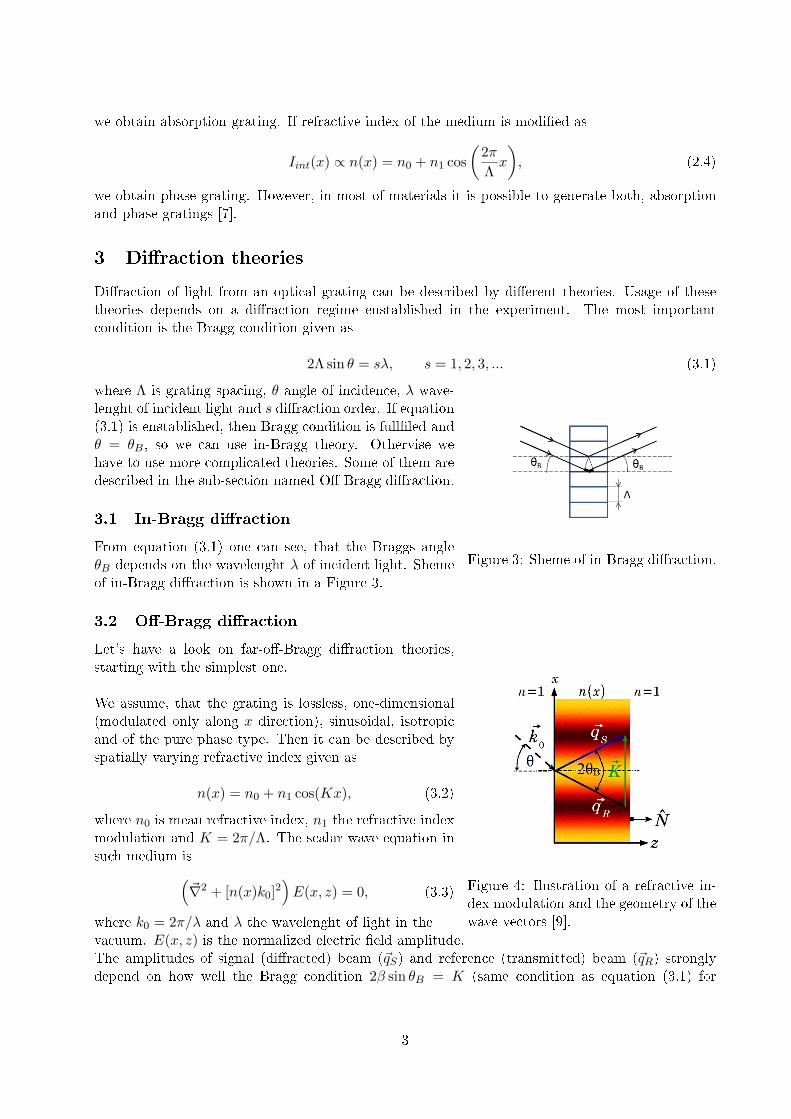
Di�raction of light from an optical grating can be described by di�erent theories. Usage of thesetheories depends on a di�raction regime enstablished in the experiment. The most importantcondition is the Bragg condition given as
2Λ sin θ = sλ, s = 1, 2, 3, ... (3.1)
Figure 3: Sheme of in-Bragg di�raction.
where Λ is grating spacing, θ angle of incidence, λ wave-lenght of incident light and s di�raction order. If equation(3.1) is enstablished, then Bragg condition is full�led andθ = θB, so we can use in-Bragg theory. Othervise wehave to use more complicated theories. Some of them aredescribed in the sub-section named O� Bragg di�raction.
3.1 In-Bragg di�raction
From equation (3.1) one can see, that the Braggs angleθB depends on the wavelenght λ of incident light. Shemeof in-Bragg di�raction is shown in a Figure 3.
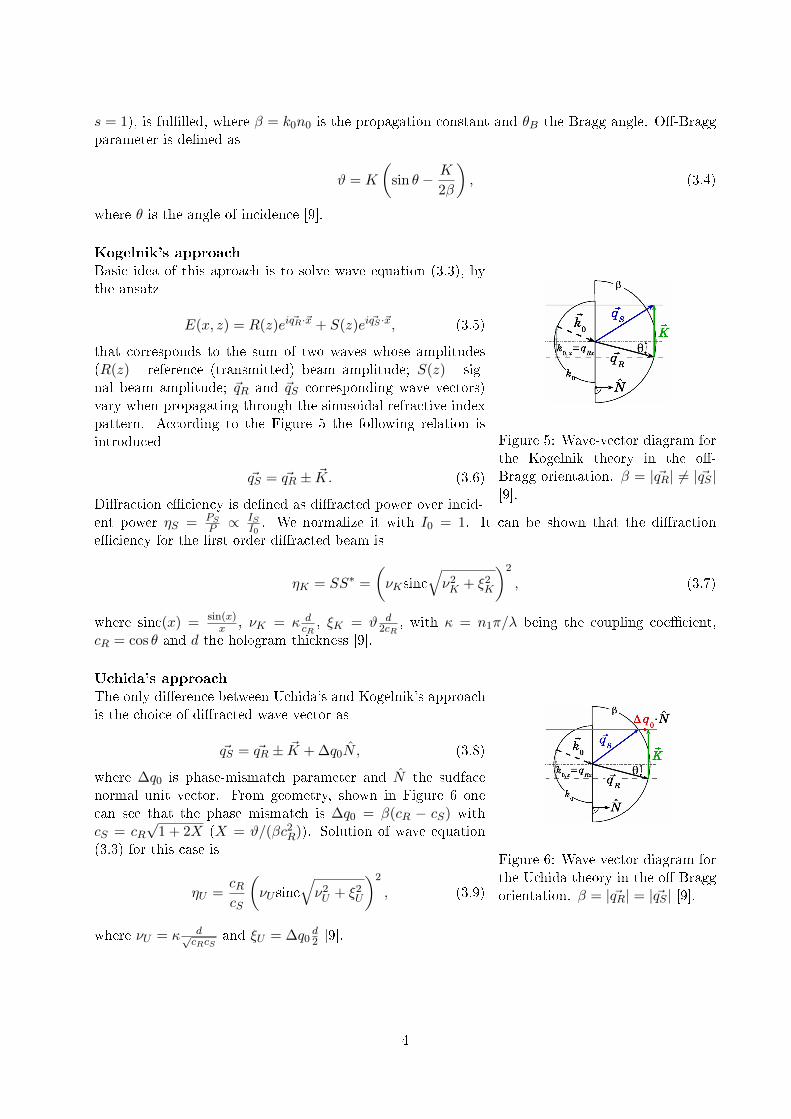
3.2 O�-Bragg di�raction
Figure 4: Ilustration of a refractive in-dex modulation and the geometry of thewave vectors [9].
Let's have a look on far-o�-Bragg di�raction theories,starting with the simplest one.
We assume, that the grating is lossless, one-dimensional(modulated only along x direction), sinusoidal, isotropicand of the pure phase type. Then it can be described byspatially varying refractive index given as
n(x) = n0 + n1 cos(Kx), (3.2)
where n0 is mean refractive index, n1 the refractive indexmodulation and K = 2π/Λ. The scalar wave equation insuch medium is(
~∇2 + [n(x)k0]2)E(x, z) = 0, (3.3)
where k0 = 2π/λ and λ the wavelenght of light in thevacuum. E(x, z) is the normalized electric �eld amplitude.The amplitudes of signal (di�racted) beam (~qS) and reference (transmitted) beam (~qR) stronglydepend on how well the Bragg condition 2β sin θB = K (same condition as equation (3.1) for
3
s = 1), is ful�lled, where β = k0n0 is the propagation constant and θB the Bragg angle. O�-Braggparameter is de�ned as
ϑ = K
(sin θ − K
2β
), (3.4)
where θ is the angle of incidence [9].
Figure 5: Wave-vector diagram forthe Kogelnik theory in the o�-Bragg orientation. β = | ~qR| 6= | ~qS |[9].
Kogelnik's approach
Basic idea of this aproach is to solve wave equation (3.3), bythe ansatz
E(x, z) = R(z)ei ~qR·~x + S(z)ei ~qS ·~x, (3.5)
that corresponds to the sum of two waves whose amplitudes(R(z) - reference (transmitted) beam amplitude; S(z) - sig-nal beam amplitude; ~qR and ~qS corresponding wave vectors)vary when propagating through the sinusoidal refractive indexpattern. According to the Figure 5 the following relation isintroduced
~qS = ~qR ± ~K. (3.6)
Di�raction e�ciency is de�ned as di�racted power over incid-ent power ηS = PS
P ∝ISI0. We normalize it with I0 = 1. It can be shown that the di�raction
e�ciency for the �rst order di�racted beam is
ηK = SS∗ =
(νKsinc
√ν2K + ξ2
K
)2
, (3.7)
where sinc(x) = sin(x)x , νK = κ d
cR, ξK = ϑ d
2cR, with κ = n1π/λ being the coupling coe�cient,
cR = cos θ and d the hologram thickness [9].
Figure 6: Wave-vector diagram forthe Uchida theory in the o�-Braggorientation. β = | ~qR| = | ~qS | [9].
Uchida's approach
The only di�erence between Uchida's and Kogelnik's approachis the choice of di�racted wave vector as
~qS = ~qR ± ~K + ∆q0N̂ , (3.8)
where ∆q0 is phase-mismatch parameter and N̂ the sudfacenormal unit vector. From geometry, shown in Figure 6 onecan see that the phase mismatch is ∆q0 = β(cR − cS) withcS = cR
√1 + 2X (X = ϑ/(βc2
R)). Solution of wave equation(3.3) for this case is
ηU =cRcS
(νU sinc
√ν2U + ξ2
U
)2
, (3.9)
where νU = κ d√cRcS
and ξU = ∆q0d2 [9].
4
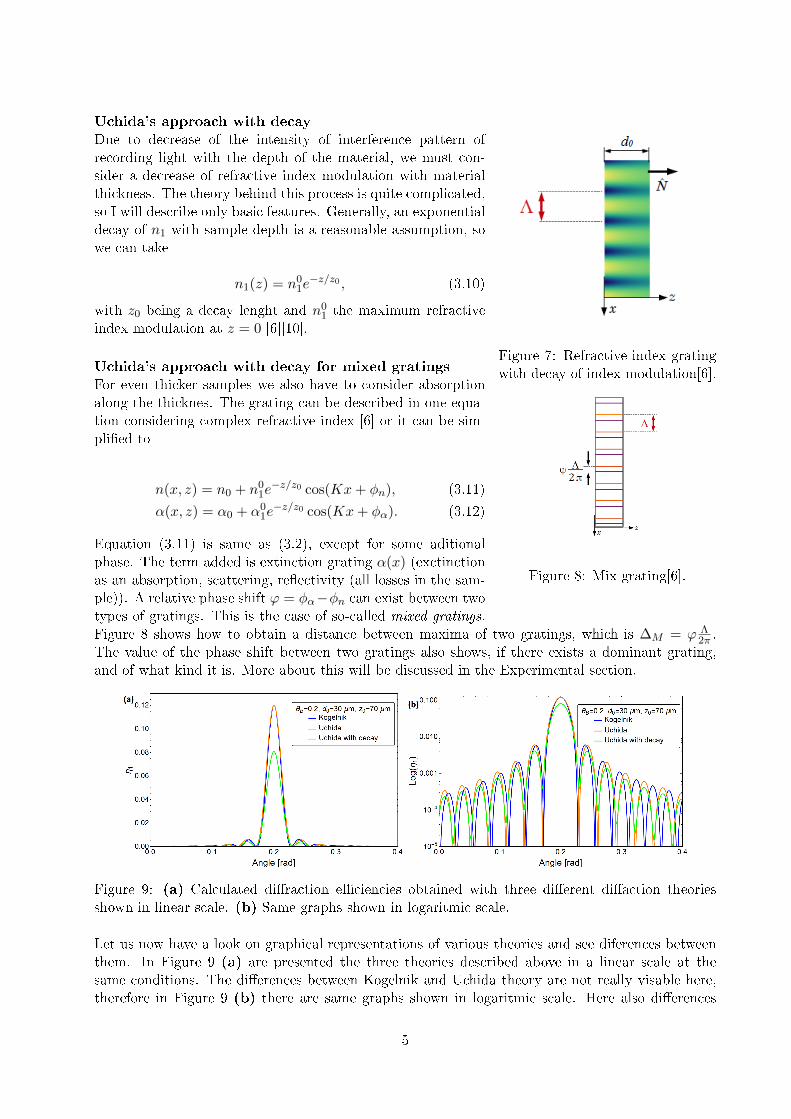
Figure 7: Refractive-index gratingwith decay of index modulation[6].
Uchida's approach with decay
Due to decrease of the intensity of interference pattern ofrecording light with the depth of the material, we must con-sider a decrease of refractive index modulation with materialthickness. The theory behind this process is quite complicated,so I will describe only basic features. Generally, an exponentialdecay of n1 with sample depth is a reasonable assumption, sowe can take
n1(z) = n01e−z/z0 , (3.10)
with z0 being a decay lenght and n01 the maximum refractive
index modulation at z = 0 [6][10].
Figure 8: Mix grating[6].
Uchida's approach with decay for mixed gratings
For even thicker samples we also have to consider absorptionalong the thicknes. The grating can be described in one equa-tion considering complex refractive index [6] or it can be sim-pli�ed to
n(x, z) = n0 + n01e−z/z0 cos(Kx+ φn), (3.11)
α(x, z) = α0 + α01e−z/z0 cos(Kx+ φα). (3.12)
Equation (3.11) is same as (3.2), except for some aditionalphase. The term added is extinction grating α(x) (exctinctionas an absorption, scattering, re�ectivity (all losses in the sam-ple)). A relative phase shift ϕ = φα−φn can exist between twotypes of gratings. This is the case of so-called mixed gratings.Figure 8 shows how to obtain a distance between maxima of two gratings, which is ∆M = ϕ Λ
2π .The value of the phase shift between two gratings also shows, if there exists a dominant grating,and of what kind it is. More about this will be discussed in the Experimental section.
Figure 9: (a) Calculated di�raction e�ciencies obtained with three di�erent di�action theoriesshown in linear scale. (b) Same graphs shown in logaritmic scale.
Let us now have a look on graphical representations of various theories and see diferences betweenthem. In Figure 9 (a) are presented the three theories described above in a linear scale at thesame conditions. The di�erences between Kogelnik and Uchida theory are not really visable here,therefore in Figure 9 (b) there are same graphs shown in logaritmic scale. Here also di�erences
5
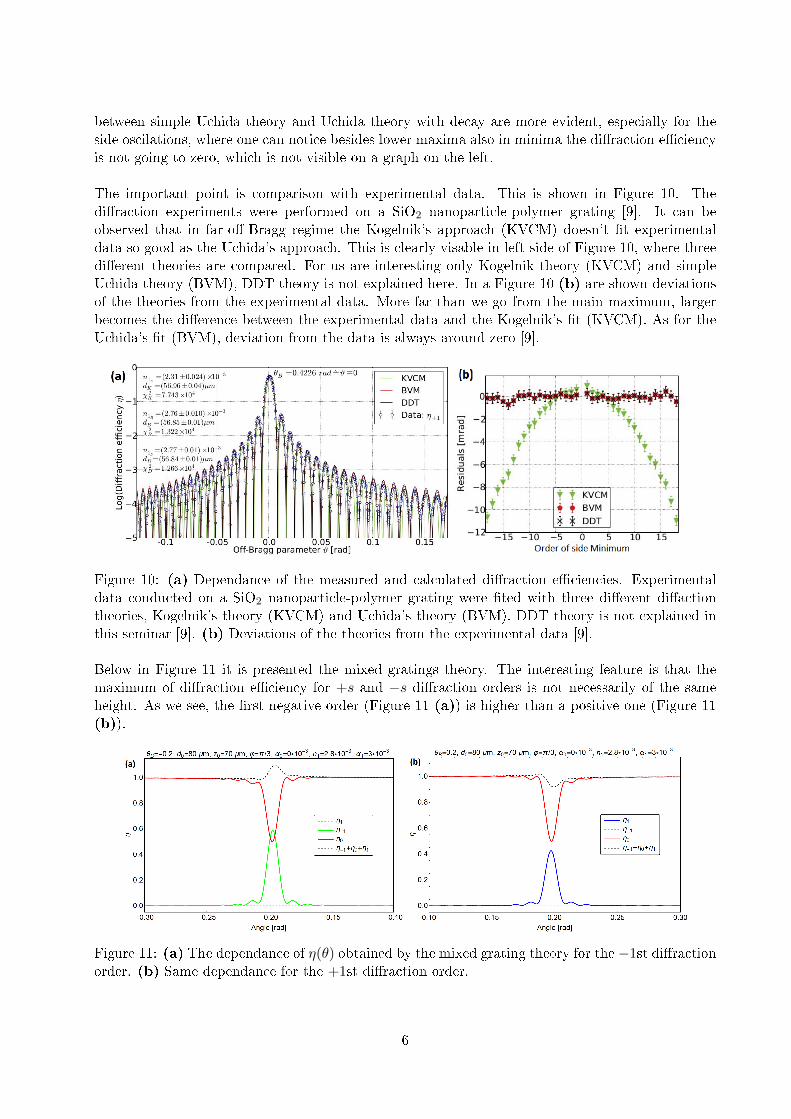
between simple Uchida theory and Uchida theory with decay are more evident, especially for theside oscilations, where one can notice besides lower maxima also in minima the di�raction e�ciencyis not going to zero, which is not visible on a graph on the left.
The important point is comparison with experimental data. This is shown in Figure 10. Thedi�raction experiments were performed on a SiO2 nanoparticle-polymer grating [9]. It can beobserved that in far-o�-Bragg regime the Kogelnik's approach (KVCM) doesn't �t experimentaldata so good as the Uchida's approach. This is clearly visable in left side of Figure 10, where threedi�erent theories are compared. For us are interesting only Kogelnik theory (KVCM) and simpleUchida theory (BVM), DDT theory is not explained here. In a Figure 10 (b) are shown deviationsof the theories from the experimental data. More far than we go from the main maximum, largerbecomes the di�erence between the experimental data and the Kogelnik's �t (KVCM). As for theUchida's �t (BVM), deviation from the data is always around zero [9].
Figure 10: (a) Dependance of the measured and calculated di�raction e�ciencies. Experimentaldata conducted on a SiO2 nanoparticle-polymer grating were �ted with three di�erent di�actiontheories, Kogelnik's theory (KVCM) and Uchida's theory (BVM). DDT theory is not explained inthis seminar [9]. (b) Deviations of the theories from the experimental data [9].
Below in Figure 11 it is presented the mixed gratings theory. The interesting feature is that themaximum of di�raction e�ciency for +s and −s di�raction orders is not necessarily of the sameheight. As we see, the �rst negative order (Figure 11 (a)) is higher than a positive one (Figure 11(b)).
Figure 11: (a) The dependance of η(θ) obtained by the mixed grating theory for the −1st di�ractionorder. (b) Same dependance for the +1st di�raction order.
6
4 Experiments
4.1 Samples
The samples were prepared from the UV curable emulsion, containing 72.5 wt % of the PEGDMAmonomer (poly-(ethylene glycol)-dimethacrylate), 18.0 wt % of the ionic liquid (IL: 1-butyl-3methyli-midazolium tetra�uoroborate (BMIMBF4)), 8.1 wt % of the polymere binder (polyvinyl acetate(PVAC)) and 1.4 wt % of the UV photoinitiator (1-hydroxylchohexyl ketone 98%). The mixturewith a refractive index of n0 = 1.46 was inserted into glass cells consisting of two glass plates sepa-rated by Mylar spacers of various thicknesses d0 = 10, 20, 50, 85, 100, 125, 150 µm [6].
Ionic liquids are organic salts that are in the liquid state at room temperature. Their melting tem-perature is around Tm ≈ −20◦C (for comparison - melting temperature of NaCl is Tm ≈ 800◦C).[11]They consist entirely of ions and have unique properties such as negligible vapor pessure and goodthermal stability. They are non�amable, low or non-toxic, have a high chemical stability and highionic conductivity. Therfore ionic liquids are enviromentally-friendly solvents [6].
Ionic liquids are described as having many potential applications. As said, they are powerful solventsand electrically conducting �uids (electrolytes), which makes them important in electric batteryapplications (lithium batteries). They have been considered also as sealants1, due to their very lowvapor pressure. Potential applications also include next-generation solar cells and hydrogen fuelcells [11][12].
4.2 Recording of grating structures
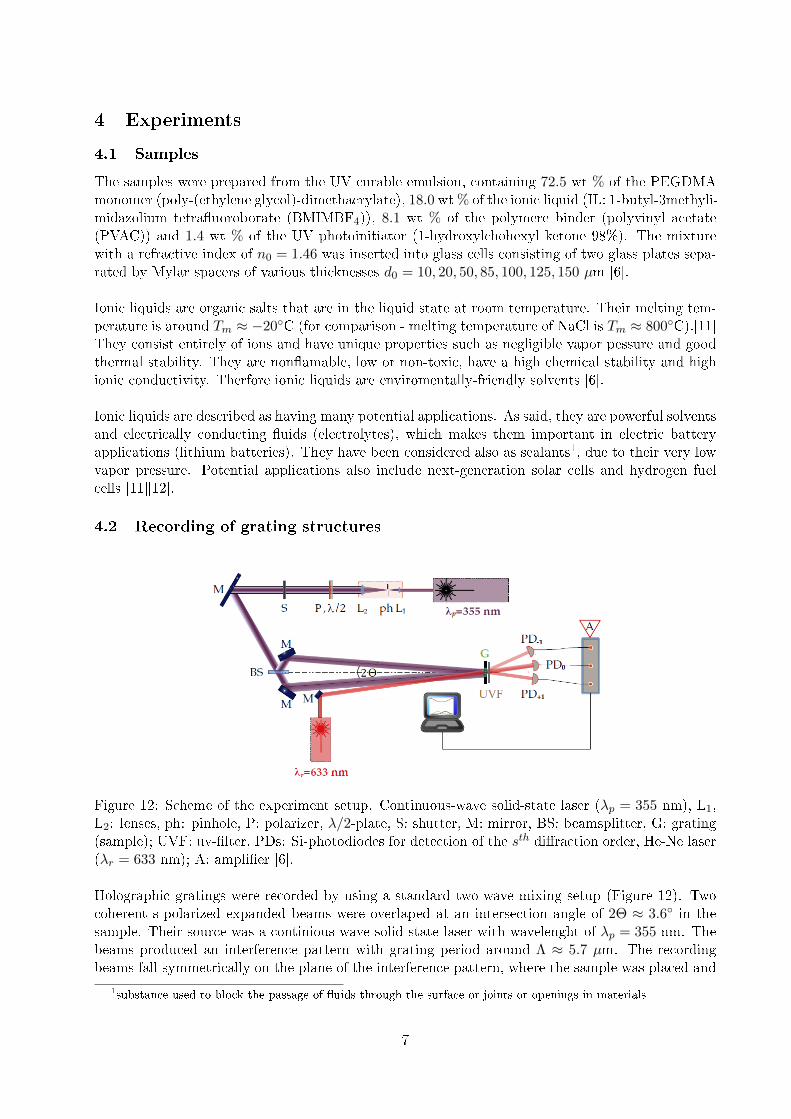
Figure 12: Scheme of the experiment setup. Continuous-wave solid-state laser (λp = 355 nm), L1,L2: lenses, ph: pinhole, P: polarizer, λ/2-plate, S: shutter, M: mirror, BS: beamsplitter, G: grating(sample); UVF: uv-�lter, PDs: Si-photodiodes for detection of the sth di�raction order, He-Ne laser(λr = 633 nm); A: ampli�er [6].
Holographic gratings were recorded by using a standard two-wave mixing setup (Figure 12). Twocoherent s-polarized expanded beams were overlaped at an intersection angle of 2Θ ≈ 3.6◦ in thesample. Their source was a continious-wave solid-state laser with wavelenght of λp = 355 nm. Thebeams produced an interference pattern with grating period around Λ ≈ 5.7 µm. The recordingbeams fall symmetrically on the plane of the interference pattern, where the sample was placed and
1substance used to block the passage of �uids through the surface or joints or openings in materials
7
they generated a transmission grating. The intensity of recording beams was I0 = 3.4 mW/cm2 foreach beam. The recording times were tp = 12 s or tp = 90 s [6].
Recording a holographic grating in a photosensitive material is essentially connected to an ab-sorptive process. Absorbed photons trigger polymerization in illuminated regions. Polymerizationcauses a change and/or modulation of the density, which results in a refractive-index modulation.Polymerization process is faster in the brighter regions of the intensity distribution (interferencepattern) causing monomers di�using from darker regions to brighter regions, which results in adensity modulation and consequently grating formation.
As recording light is absorbed, the intensity of the interference pattern decreases with the thicknessof the holographics medium, which leads to a depth dependent refractive-index and absorptionmodulation [6].
4.3 Read out process and kinetics of holographic grating evolution
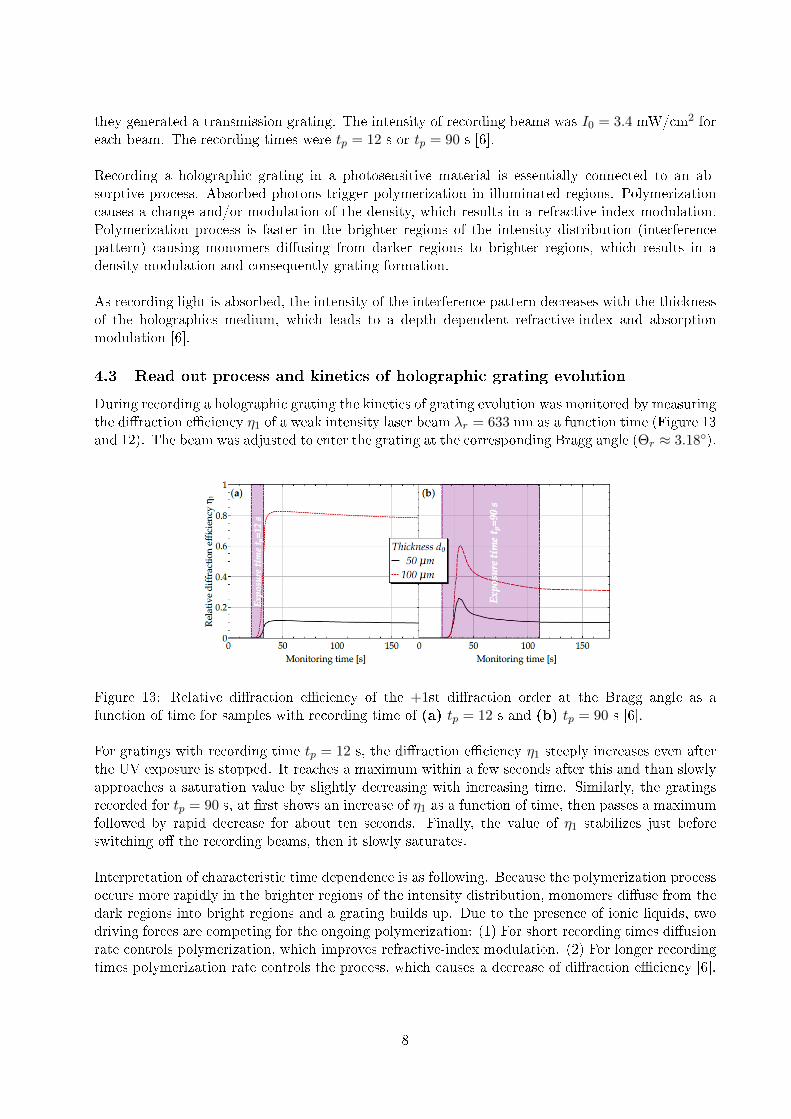
During recording a holographic grating the kinetics of grating evolution was monitored by measuringthe di�raction e�ciency η1 of a weak intensity laser beam λr = 633 nm as a function time (Figure 13and 12). The beam was adjusted to enter the grating at the corresponding Bragg angle (Θr ≈ 3.18◦).
Figure 13: Relative di�raction e�ciency of the +1st di�raction order at the Bragg angle as afunction of time for samples with recording time of (a) tp = 12 s and (b) tp = 90 s [6].
For gratings with recording time tp = 12 s, the di�raction e�ciency η1 steeply increases even afterthe UV exposure is stopped. It reaches a maximum within a few seconds after this and than slowlyapproaches a saturation value by slightly decreasing with increasing time. Similarly, the gratingsrecorded for tp = 90 s, at �rst shows an increase of η1 as a function of time, then passes a maximumfollowed by rapid decrease for about ten seconds. Finally, the value of η1 stabilizes just beforeswitching o� the recording beams, then it slowly saturates.
Interpretation of characteristic time dependence is as following. Because the polymerization processoccurs more rapidly in the brighter regions of the intensity distribution, monomers di�use from thedark regions into bright regions and a grating builds up. Due to the presence of ionic liquids, twodriving forces are competing for the ongoing polymerization: (1) For short recording times di�usionrate controls polymerization, which improves refractive-index modulation. (2) For longer recordingtimes polymerization rate controls the process, which causes a decrease of di�raction e�ciency [6].
8
4.4 Two-beam coupling experiments
Figure 14: Experimental sheme fortwo-beam coupling experiment [6].
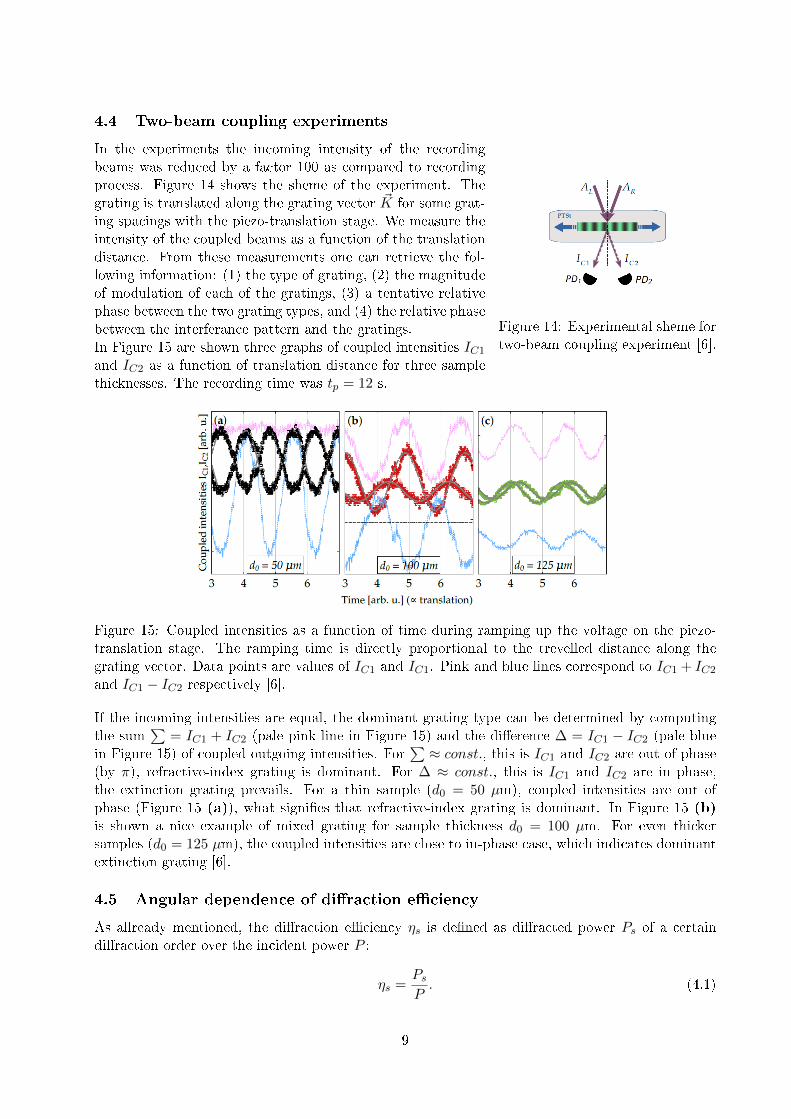
In the experiments the incoming intensity of the recordingbeams was reduced by a factor 100 as compared to recordingprocess. Figure 14 shows the sheme of the experiment. Thegrating is translated along the grating vector ~K for some grat-ing spacings with the piezo-translation stage. We measure theintensity of the coupled beams as a function of the translationdistance. From these measurements one can retrieve the fol-lowing information: (1) the type of grating, (2) the magnitudeof modulation of each of the gratings, (3) a tentative relativephase between the two grating types, and (4) the relative phasebetween the interferance pattern and the gratings.In Figure 15 are shown three graphs of coupled intensities IC1
and IC2 as a function of translation distance for three samplethicknesses. The recording time was tp = 12 s.
Figure 15: Coupled intensities as a function of time during ramping up the voltage on the piezo-translation stage. The ramping time is directly proportional to the trevelled distance along thegrating vector. Data points are values of IC1 and IC1. Pink and blue lines correspond to IC1 + IC2
and IC1 − IC2 respectively [6].
If the incoming intensities are equal, the dominant grating type can be determined by computingthe sum
∑= IC1 + IC2 (pale pink line in Figure 15) and the di�erence ∆ = IC1 − IC2 (pale blue
in Figure 15) of coupled outgoing intensities. For∑≈ const., this is IC1 and IC2 are out of phase
(by π), refractive-index grating is dominant. For ∆ ≈ const., this is IC1 and IC2 are in phase,the extinction grating prevails. For a thin sample (d0 = 50 µm), coupled intensities are out ofphase (Figure 15 (a)), what signi�es that refractive-index grating is dominant. In Figure 15 (b)is shown a nice example of mixed grating for sample thickness d0 = 100 µm. For even thickersamples (d0 = 125 µm), the coupled intensities are close to in-phase case, which indicates dominantextinction grating [6].
4.5 Angular dependence of di�raction e�ciency
As allready mentioned, the di�raction e�ciency ηs is de�ned as di�racted power Ps of a certaindi�raction order over the incident power P :
ηs =PsP. (4.1)
9
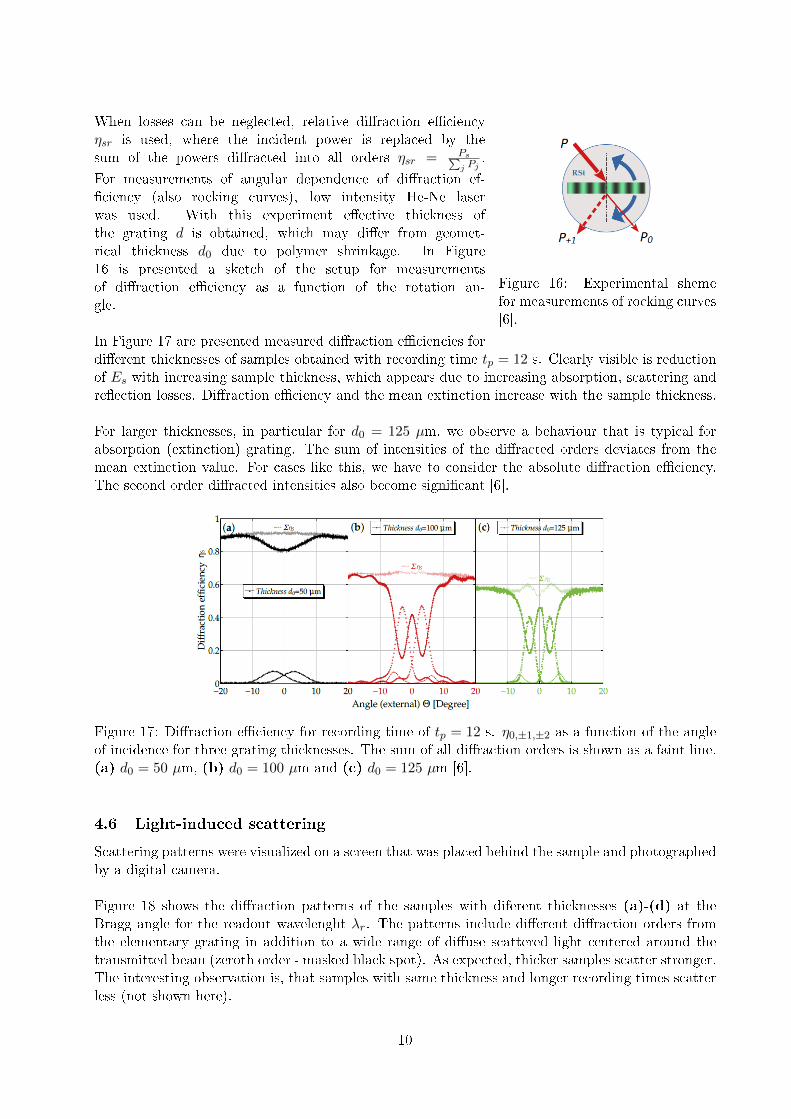
Figure 16: Experimental shemefor measurements of rocking curves[6].
When losses can be neglected, relative di�raction e�ciencyηsr is used, where the incident power is replaced by thesum of the powers di�racted into all orders ηsr = Ps∑
j Pj.
For measurements of angular dependence of di�raction ef-�ciency (also rocking curves), low intensity He-Ne laserwas used. With this experiment e�ective thickness ofthe grating d is obtained, which may di�er from geomet-rical thickness d0 due to polymer shrinkage. In Figure16 is presented a sketch of the setup for measurementsof di�raction e�ciency as a function of the rotation an-gle.
In Figure 17 are presented measured di�raction e�ciencies fordi�erent thicknesses of samples obtained with recording time tp = 12 s. Clearly visible is reductionof Es with increasing sample thickness, which appears due to increasing absorption, scattering andre�ection losses. Di�raction e�ciency and the mean extinction increase with the sample thickness.
For larger thicknesses, in particular for d0 = 125 µm, we observe a behaviour that is typical forabsorption (extinction) grating. The sum of intensities of the di�racted orders deviates from themean extinction value. For cases like this, we have to consider the absolute di�raction e�ciency.The second order di�racted intensities also become signi�cant [6].
Figure 17: Di�raction e�ciency for recording time of tp = 12 s. η0,±1,±2 as a function of the angleof incidence for three grating thicknesses. The sum of all di�raction orders is shown as a faint line.(a) d0 = 50 µm, (b) d0 = 100 µm and (c) d0 = 125 µm [6].
4.6 Light-induced scattering
Scattering patterns were visualized on a screen that was placed behind the sample and photographedby a digital camera.
Figure 18 shows the di�raction patterns of the samples with diferent thicknesses (a)-(d) at theBragg angle for the readout wavelenght λr. The patterns include di�erent di�raction orders fromthe elementary grating in addition to a wide range of di�use scattered light centered around thetransmitted beam (zeroth order - masked black spot). As expected, thicker samples scatter stronger.The interesting observation is, that samples with same thickness and longer recording times scatterless (not shown here).
10
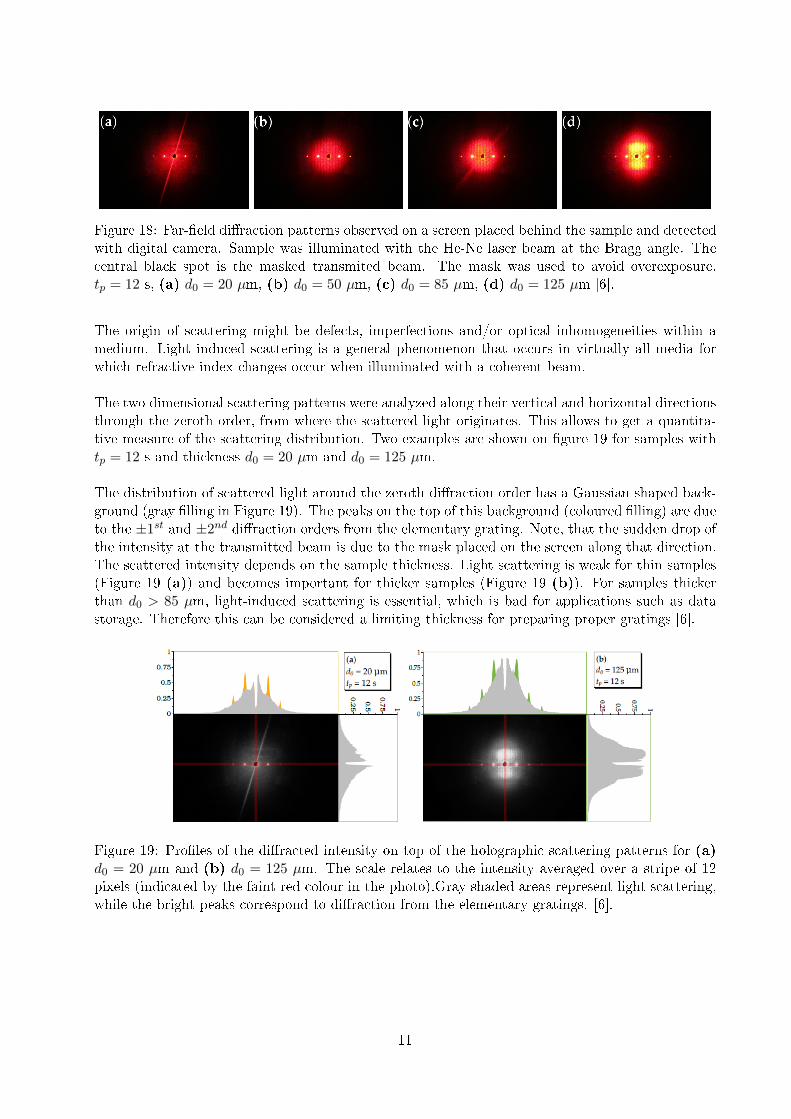
Figure 18: Far-�eld di�raction patterns observed on a screen placed behind the sample and detectedwith digital camera. Sample was illuminated with the He-Ne laser beam at the Bragg angle. Thecentral black spot is the masked transmited beam. The mask was used to avoid overexposure.tp = 12 s, (a) d0 = 20 µm, (b) d0 = 50 µm, (c) d0 = 85 µm, (d) d0 = 125 µm [6].
The origin of scattering might be defects, imperfections and/or optical inhomogeneities within amedium. Light induced scattering is a general phenomenon that occurs in virtually all media forwhich refractive-index changes occur when illuminated with a coherent beam.
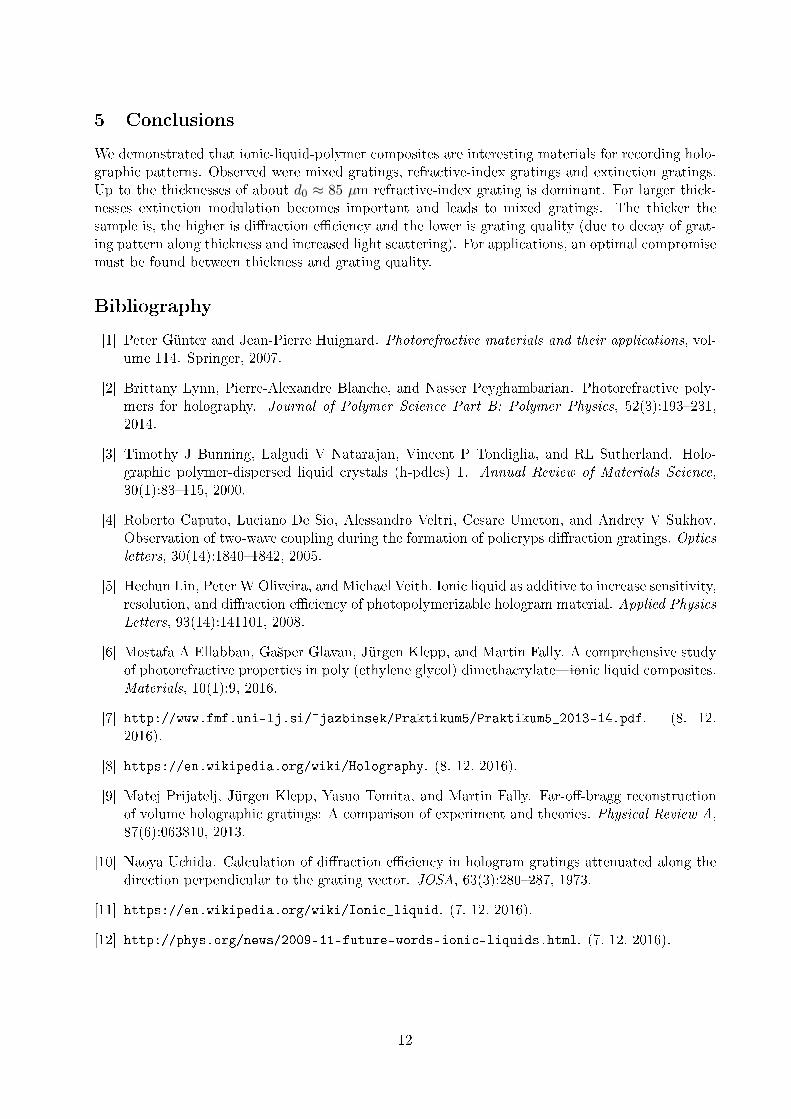
The two dimensional scattering patterns were analyzed along their vertical and horizontal directionsthrough the zeroth order, from where the scattered light originates. This allows to get a quantita-tive measure of the scattering distribution. Two examples are shown on �gure 19 for samples withtp = 12 s and thickness d0 = 20 µm and d0 = 125 µm.
The distribution of scattered light around the zeroth di�raction order has a Gaussian shaped back-ground (gray �lling in Figure 19). The peaks on the top of this background (coloured �lling) are dueto the ±1st and ±2nd di�raction orders from the elementary grating. Note, that the sudden drop ofthe intensity at the transmitted beam is due to the mask placed on the screen along that direction.The scattered intensity depends on the sample thickness. Light scattering is weak for thin samples(Figure 19 (a)) and becomes important for thicker samples (Figure 19 (b)). For samples thickerthan d0 > 85 µm, light-induced scattering is essential, which is bad for applications such as datastorage. Therefore this can be considered a limiting thickness for preparing proper gratings [6].
Figure 19: Pro�les of the di�racted intensity on top of the holographic scattering patterns for (a)d0 = 20 µm and (b) d0 = 125 µm. The scale relates to the intensity averaged over a stripe of 12pixels (indicated by the faint red colour in the photo).Gray shaded areas represent light scattering,while the bright peaks correspond to di�raction from the elementary gratings. [6].
11
5 Conclusions
We demonstrated that ionic-liquid-polymer composites are interesting materials for recording holo-graphic patterns. Observed were mixed gratings, refractive-index gratings and extinction gratings.Up to the thicknesses of about d0 ≈ 85 µm refractive-index grating is dominant. For larger thick-nesses extinction modulation becomes important and leads to mixed gratings. The thicker thesample is, the higher is di�raction e�ciency and the lower is grating quality (due to decay of grat-ing pattern along thickness and increased light scattering). For applications, an optimal compromisemust be found between thickness and grating quality.
Bibliography
[1] Peter Günter and Jean-Pierre Huignard. Photorefractive materials and their applications, vol-ume 114. Springer, 2007.
[2] Brittany Lynn, Pierre-Alexandre Blanche, and Nasser Peyghambarian. Photorefractive poly-mers for holography. Journal of Polymer Science Part B: Polymer Physics, 52(3):193�231,2014.
[3] Timothy J Bunning, Lalgudi V Natarajan, Vincent P Tondiglia, and RL Sutherland. Holo-graphic polymer-dispersed liquid crystals (h-pdlcs) 1. Annual Review of Materials Science,30(1):83�115, 2000.
[4] Roberto Caputo, Luciano De Sio, Alessandro Veltri, Cesare Umeton, and Andrey V Sukhov.Observation of two-wave coupling during the formation of policryps di�raction gratings. Opticsletters, 30(14):1840�1842, 2005.
[5] Hechun Lin, Peter W Oliveira, and Michael Veith. Ionic liquid as additive to increase sensitivity,resolution, and di�raction e�ciency of photopolymerizable hologram material. Applied Physics
Letters, 93(14):141101, 2008.
[6] Mostafa A Ellabban, Ga²per Glavan, Jürgen Klepp, and Martin Fally. A comprehensive studyof photorefractive properties in poly (ethylene glycol) dimethacrylate�ionic liquid composites.Materials, 10(1):9, 2016.
[7] http://www.fmf.uni-lj.si/~jazbinsek/Praktikum5/Praktikum5_2013-14.pdf. (8. 12.2016).
[8] https://en.wikipedia.org/wiki/Holography. (8. 12. 2016).
[9] Matej Prijatelj, Jürgen Klepp, Yasuo Tomita, and Martin Fally. Far-o�-bragg reconstructionof volume holographic gratings: A comparison of experiment and theories. Physical Review A,87(6):063810, 2013.
[10] Naoya Uchida. Calculation of di�raction e�ciency in hologram gratings attenuated along thedirection perpendicular to the grating vector. JOSA, 63(3):280�287, 1973.
[11] https://en.wikipedia.org/wiki/Ionic_liquid. (7. 12. 2016).
[12] http://phys.org/news/2009-11-future-words-ionic-liquids.html. (7. 12. 2016).
12
![A compact holographic projector module for high-resolution ... · Simultaneous steering of multiple laser beams via holographic projection offers a solution [14–22]. High optical](https://img.pdfslide.us/doc/110x75/5eaa53847a62895ac50a3bf9/a-compact-holographic-projector-module-for-high-resolution-simultaneous-steering.jpg)