Embed Size (px)
Citation preview
SEMIANNUAL REPORTUSAA EMERGING MARKETS FUNDFUND SHARES (USEMX) ■ INSTITUTIONAL SHARES (UIEMX)■ ADVISER SHARES (UAEMX)
NOVEMBER 30, 2017
TABLE OF CONTENTS
Fund Objective 1
Investment Overview 2
Financial Information
Portfolio of Investments 4
Notes to Portfolio of Investments 17
Financial Statements 19
Notes to Financial Statements 23
Expense Example 44
This report is for the information of the shareholders and others who have received a copy of thecurrently effective prospectus of the Fund, managed by USAA Asset Management Company. It maybe used as sales literature only when preceded or accompanied by a current prospectus, whichprovides further details about the Fund.
©2018, USAA. All rights reserved.
Fund Objective | 1
FUND OBJECTIVE
The USAA Emerging Markets Fund (the Fund) seeks capitalappreciation.
Types of Investments
The Fund normally invests at least 80% of its assets in equity securities ofemerging-market companies. The “equity securities” in which the Fundprincipally invests are common stocks, preferred stocks, securitiesconvertible into common stocks, and securities that carry the right to buycommon stocks. This 80% policy may be changed upon at least 60 days’written notice to shareholders.
IRA DISTRIBUTION WITHHOLDING DISCLOSUREWe generally must withhold federal income tax at a rate of 10% of the taxable portionof your distribution and, if you live in a state that requires state income tax withholding,at your state’s tax rate. However, you may elect not to have withholding apply or to haveincome tax withheld at a higher rate. Any withholding election that you make will applyto any subsequent distribution unless and until you change or revoke the election. Ifyou wish to make a withholding election or change or revoke a prior withholdingelection, call (800) 531-USAA (8722) or (210) 531-8722. If you do not have a withholding election in place by the date of a distribution, federalincome tax will be withheld from the taxable portion of your distribution at a rateof 10%. If you must pay estimated taxes, you may be subject to estimated tax penaltiesif your estimated tax payments are not sufficient and sufficient tax is not withheldfrom your distribution.For more specific information, please consult your tax adviser.
2 | USAA Emerging Markets Fund
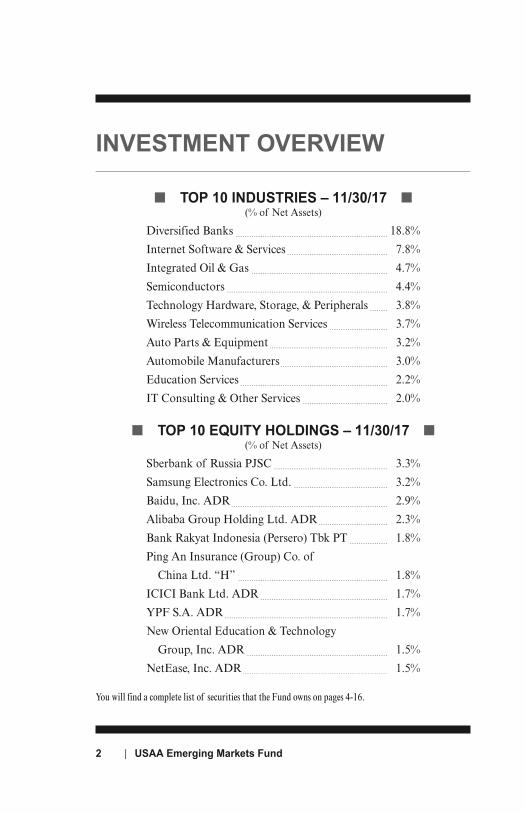
■ TOP 10 INDUSTRIES – 11/30/17 ■(% of Net Assets)
Diversified Banks - - - - - - - - - - - - - - - - - - - - - - - - - - - - - - - - - - - - - - - - - - - - - - - - - - - - - - - - - - - - - - - - - - - -
18.8%Internet Software & Services
- - - - - - - - - - - - - - - - - - - - - - - - - - - - - - - - - - - - - - - - - - - - - 7.8%
Integrated Oil & Gas - - - - - - - - - - - - - - - - - - - - - - - - - - - - - - - - - - - - - - - - - - - - - - - - - - - - - - - - - - - - -
4.7%Semiconductors
- - - - - - - - - - - - - - - - - - - - - - - - - - - - - - - - - - - - - - - - - - - - - - - - - - - - - - - - - - - - - - - - - - - - - - - - 4.4%
Technology Hardware, Storage, & Peripherals - - - - - - - -
3.8%Wireless Telecommunication Services
- - - - - - - - - - - - - - - - - - - - - - - - - - 3.7%
Auto Parts & Equipment - - - - - - - - - - - - - - - - - - - - - - - - - - - - - - - - - - - - - - - - - - - - - - - - - - - - -
3.2%Automobile Manufacturers
- - - - - - - - - - - - - - - - - - - - - - - - - - - - - - - - - - - - - - - - - - - - - - - - 3.0%
Education Services - - - - - - - - - - - - - - - - - - - - - - - - - - - - - - - - - - - - - - - - - - - - - - - - - - - - - - - - - - - - - - - - - -
2.2%IT Consulting & Other Services
- - - - - - - - - - - - - - - - - - - - - - - - - - - - - - - - - - - - - - 2.0%
■ TOP 10 EQUITY HOLDINGS – 11/30/17 ■(% of Net Assets)
Sberbank of Russia PJSC - - - - - - - - - - - - - - - - - - - - - - - - - - - - - - - - - - - - - - - - - - - - - - - - - - -
3.3%Samsung Electronics Co. Ltd.
- - - - - - - - - - - - - - - - - - - - - - - - - - - - - - - - - - - - - - - - - - 3.2%
Baidu, Inc. ADR - - - - - - - - - - - - - - - - - - - - - - - - - - - - - - - - - - - - - - - - - - - - - - - - - - - - - - - - - - - - - - - - - - - - - -
2.9%Alibaba Group Holding Ltd. ADR
- - - - - - - - - - - - - - - - - - - - - - - - - - - - - - - 2.3%
Bank Rakyat Indonesia (Persero) Tbk PT - - - - - - - - - - - - - - - - -
1.8%Ping An Insurance (Group) Co. of
China Ltd. “H” - - - - - - - - - - - - - - - - - - - - - - - - - - - - - - - - - - - - - - - - - - - - - - - - - - - - - - - - - - - - - - - - - - -
1.8%ICICI Bank Ltd. ADR
- - - - - - - - - - - - - - - - - - - - - - - - - - - - - - - - - - - - - - - - - - - - - - - - - - - - - - - - - 1.7%
YPF S.A. ADR - - - - - - - - - - - - - - - - - - - - - - - - - - - - - - - - - - - - - - - - - - - - - - - - - - - - - - - - - - - - - - - - - - - - - - - - -
1.7%New Oriental Education & Technology
Group, Inc. ADR - - - - - - - - - - - - - - - - - - - - - - - - - - - - - - - - - - - - - - - - - - - - - - - - - - - - - - - - - - - - - - -
1.5%NetEase, Inc. ADR
- - - - - - - - - - - - - - - - - - - - - - - - - - - - - - - - - - - - - - - - - - - - - - - - - - - - - - - - - - - - - - - - - 1.5%
You will find a complete list of securities that the Fund owns on pages 4-16.
INVESTMENT OVERVIEW
Investment Overview | 3
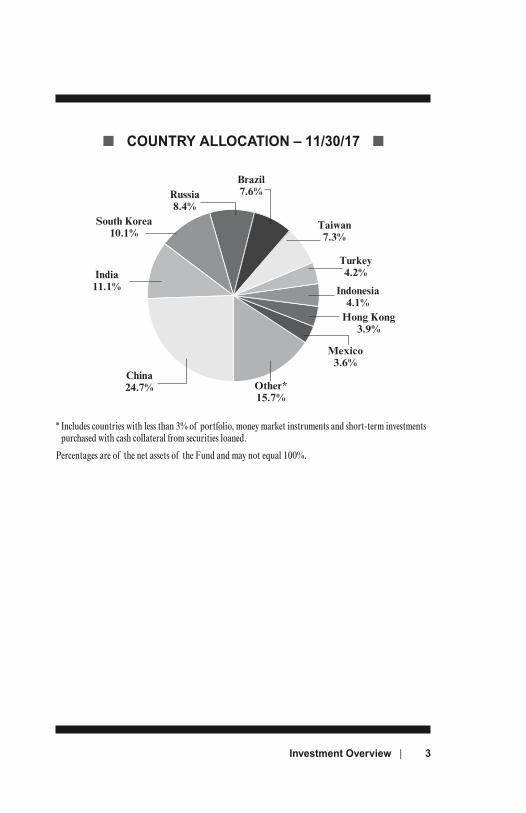
■ COUNTRY ALLOCATION – 11/30/17 ■
Taiwan7.3%
India11.1%
South Korea10.1%
Brazil7.6%Russia
8.4%
Hong Kong3.9%
Mexico3.6%
China24.7% Other*
15.7%
Turkey4.2%
Indonesia4.1%
* Includes countries with less than 3% of portfolio, money market instruments and short-term investmentspurchased with cash collateral from securities loaned.
Percentages are of the net assets of the Fund and may not equal 100%.
4 | USAA Emerging Markets Fund
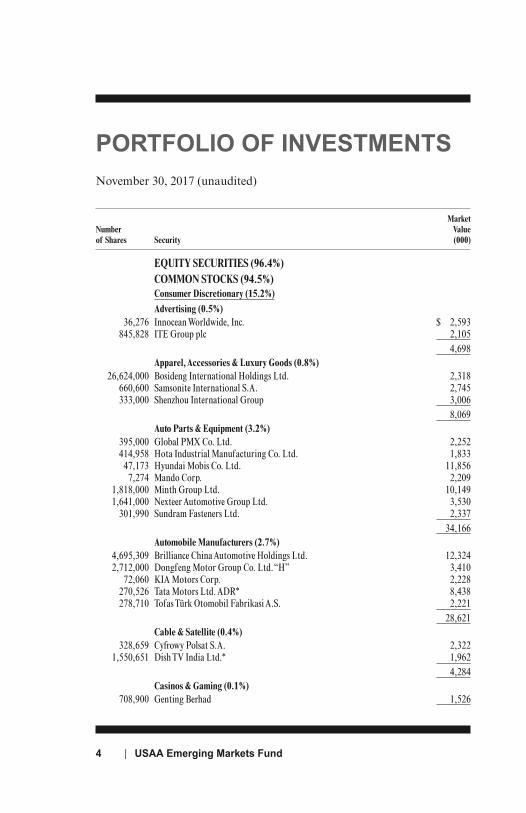
PORTFOLIO OF INVESTMENTS
MarketNumber Valueof Shares Security (000)
EQUITY SECURITIES (96.4%)COMMON STOCKS (94.5%)Consumer Discretionary (15.2%)Advertising (0.5%)
36,276 Innocean Worldwide, Inc. $ 2,593 845,828 ITE Group plc 2,105 4,698
Apparel, Accessories & Luxury Goods (0.8%) 26,624,000 Bosideng International Holdings Ltd. 2,318 660,600 Samsonite International S.A. 2,745 333,000 Shenzhou International Group 3,006 8,069
Auto Parts & Equipment (3.2%) 395,000 Global PMX Co. Ltd. 2,252 414,958 Hota Industrial Manufacturing Co. Ltd. 1,833 47,173 Hyundai Mobis Co. Ltd. 11,856 7,274 Mando Corp. 2,209 1,818,000 Minth Group Ltd. 10,149 1,641,000 Nexteer Automotive Group Ltd. 3,530 301,990 Sundram Fasteners Ltd. 2,337 34,166
Automobile Manufacturers (2.7%) 4,695,309 Brilliance China Automotive Holdings Ltd. 12,324 2,712,000 Dongfeng Motor Group Co. Ltd. “H” 3,410 72,060 KIA Motors Corp. 2,228 270,526 Tata Motors Ltd. ADR* 8,438 278,710 Tofas Türk Otomobil Fabrikasi A.S. 2,221 28,621
Cable & Satellite (0.4%) 328,659 Cyfrowy Polsat S.A. 2,322 1,550,651 Dish TV India Ltd.* 1,962 4,284
Casinos & Gaming (0.1%) 708,900 Genting Berhad 1,526
November 30, 2017 (unaudited)
Portfolio of Investments | 5
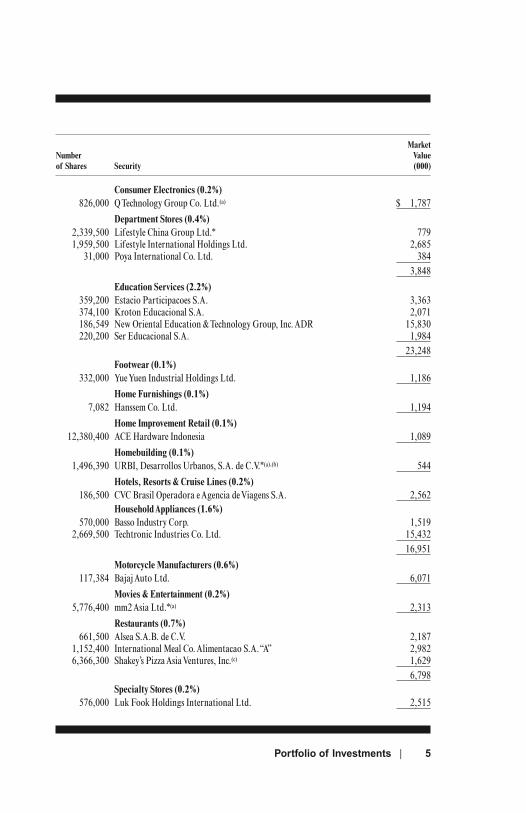
Consumer Electronics (0.2%) 826,000 Q Technology Group Co. Ltd.(a) $ 1,787
Department Stores (0.4%) 2,339,500 Lifestyle China Group Ltd.* 779 1,959,500 Lifestyle International Holdings Ltd. 2,685 31,000 Poya International Co. Ltd. 384 3,848
Education Services (2.2%) 359,200 Estacio Participacoes S.A. 3,363 374,100 Kroton Educacional S.A. 2,071 186,549 New Oriental Education & Technology Group, Inc. ADR 15,830 220,200 Ser Educacional S.A. 1,984 23,248
Footwear (0.1%) 332,000 Yue Yuen Industrial Holdings Ltd. 1,186
Home Furnishings (0.1%) 7,082 Hanssem Co. Ltd. 1,194
Home Improvement Retail (0.1%) 12,380,400 ACE Hardware Indonesia 1,089
Homebuilding (0.1%) 1,496,390 URBI, Desarrollos Urbanos, S.A. de C.V.*(a),(b) 544
Hotels, Resorts & Cruise Lines (0.2%) 186,500 CVC Brasil Operadora e Agencia de Viagens S.A. 2,562
Household Appliances (1.6%) 570,000 Basso Industry Corp. 1,519 2,669,500 Techtronic Industries Co. Ltd. 15,432 16,951
Motorcycle Manufacturers (0.6%) 117,384 Bajaj Auto Ltd. 6,071
Movies & Entertainment (0.2%) 5,776,400 mm2 Asia Ltd.*(a) 2,313
Restaurants (0.7%) 661,500 Alsea S.A.B. de C.V. 2,187 1,152,400 International Meal Co. Alimentacao S.A. “A” 2,982 6,366,300 Shakey’s Pizza Asia Ventures, Inc.(c) 1,629 6,798
Specialty Stores (0.2%) 576,000 Luk Fook Holdings International Ltd. 2,515
MarketNumber Valueof Shares Security (000)
6 | USAA Emerging Markets Fund
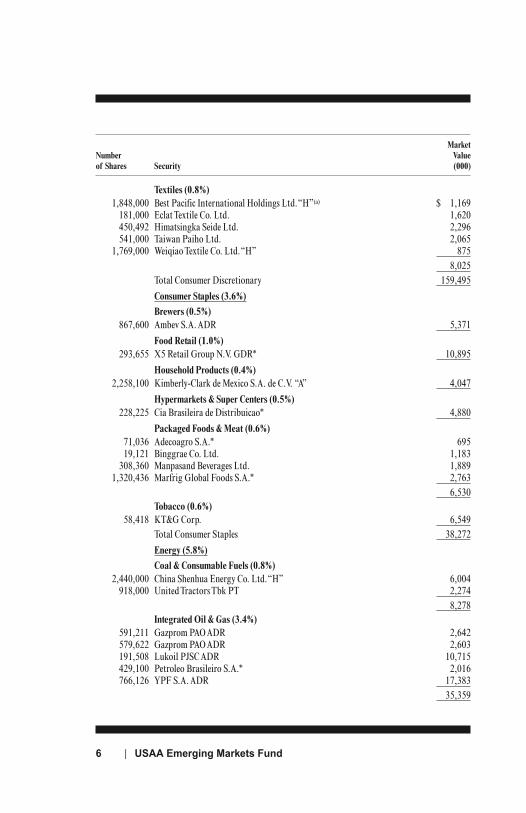
Textiles (0.8%) 1,848,000 Best Pacific International Holdings Ltd. “H”(a) $ 1,169 181,000 Eclat Textile Co. Ltd. 1,620 450,492 Himatsingka Seide Ltd. 2,296 541,000 Taiwan Paiho Ltd. 2,065 1,769,000 Weiqiao Textile Co. Ltd. “H” 875 8,025 Total Consumer Discretionary 159,495
Consumer Staples (3.6%)Brewers (0.5%)
867,600 Ambev S.A. ADR 5,371
Food Retail (1.0%) 293,655 X5 Retail Group N.V. GDR* 10,895
Household Products (0.4%) 2,258,100 Kimberly-Clark de Mexico S.A. de C.V. “A” 4,047
Hypermarkets & Super Centers (0.5%) 228,225 Cia Brasileira de Distribuicao* 4,880
Packaged Foods & Meat (0.6%) 71,036 Adecoagro S.A.* 695 19,121 Binggrae Co. Ltd. 1,183 308,360 Manpasand Beverages Ltd. 1,889 1,320,436 Marfrig Global Foods S.A.* 2,763 6,530
Tobacco (0.6%) 58,418 KT&G Corp. 6,549 Total Consumer Staples 38,272
Energy (5.8%)Coal & Consumable Fuels (0.8%)
2,440,000 China Shenhua Energy Co. Ltd. “H” 6,004 918,000 United Tractors Tbk PT 2,274 8,278
Integrated Oil & Gas (3.4%) 591,211 Gazprom PAO ADR 2,642 579,622 Gazprom PAO ADR 2,603 191,508 Lukoil PJSC ADR 10,715 429,100 Petroleo Brasileiro S.A.* 2,016 766,126 YPF S.A. ADR 17,383 35,359
MarketNumber Valueof Shares Security (000)
Portfolio of Investments | 7
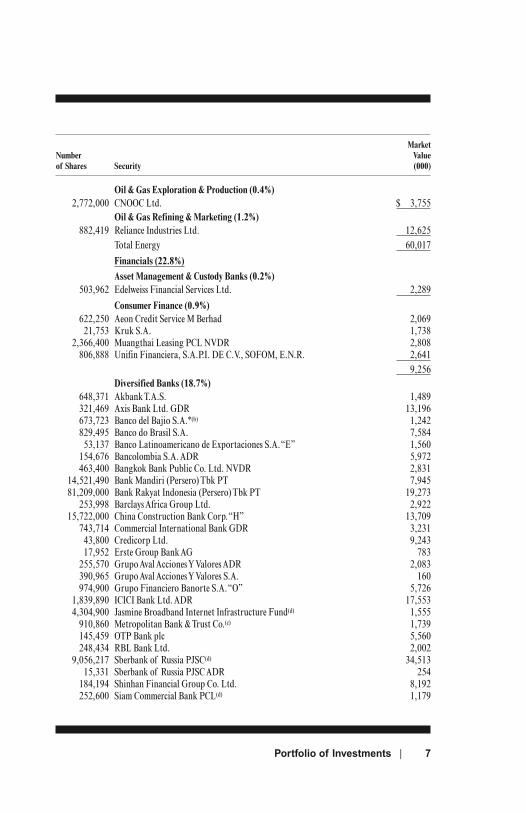
Oil & Gas Exploration & Production (0.4%) 2,772,000 CNOOC Ltd. $ 3,755
Oil & Gas Refining & Marketing (1.2%) 882,419 Reliance Industries Ltd. 12,625 Total Energy 60,017
Financials (22.8%)Asset Management & Custody Banks (0.2%)
503,962 Edelweiss Financial Services Ltd. 2,289
Consumer Finance (0.9%) 622,250 Aeon Credit Service M Berhad 2,069 21,753 Kruk S.A. 1,738 2,366,400 Muangthai Leasing PCL NVDR 2,808 806,888 Unifin Financiera, S.A.P.I. DE C.V., SOFOM, E.N.R. 2,641 9,256
Diversified Banks (18.7%) 648,371 Akbank T.A.S. 1,489 321,469 Axis Bank Ltd. GDR 13,196 673,723 Banco del Bajio S.A.*(b) 1,242 829,495 Banco do Brasil S.A. 7,584 53,137 Banco Latinoamericano de Exportaciones S.A. “E” 1,560 154,676 Bancolombia S.A. ADR 5,972 463,400 Bangkok Bank Public Co. Ltd. NVDR 2,831 14,521,490 Bank Mandiri (Persero) Tbk PT 7,945 81,209,000 Bank Rakyat Indonesia (Persero) Tbk PT 19,273 253,998 Barclays Africa Group Ltd. 2,922 15,722,000 China Construction Bank Corp. “H” 13,709 743,714 Commercial International Bank GDR 3,231 43,800 Credicorp Ltd. 9,243 17,952 Erste Group Bank AG 783 255,570 Grupo Aval Acciones Y Valores ADR 2,083 390,965 Grupo Aval Acciones Y Valores S.A. 160 974,900 Grupo Financiero Banorte S.A. “O” 5,726 1,839,890 ICICI Bank Ltd. ADR 17,553 4,304,900 Jasmine Broadband Internet Infrastructure Fund(d) 1,555 910,860 Metropolitan Bank & Trust Co.(c) 1,739 145,459 OTP Bank plc 5,560 248,434 RBL Bank Ltd. 2,002 9,056,217 Sberbank of Russia PJSC(d) 34,513 15,331 Sberbank of Russia PJSC ADR 254 184,194 Shinhan Financial Group Co. Ltd. 8,192 252,600 Siam Commercial Bank PCL(d) 1,179
MarketNumber Valueof Shares Security (000)
8 | USAA Emerging Markets Fund
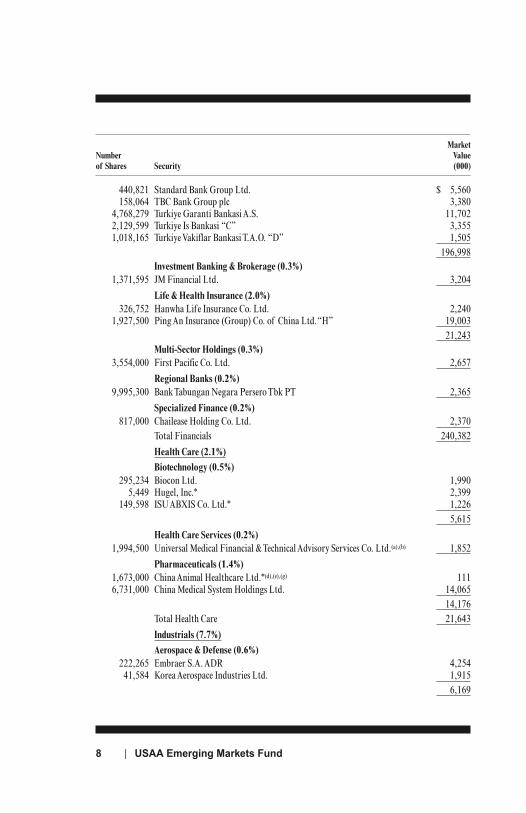
440,821 Standard Bank Group Ltd. $ 5,560 158,064 TBC Bank Group plc 3,380 4,768,279 Turkiye Garanti Bankasi A.S. 11,702 2,129,599 Turkiye Is Bankasi “C” 3,355 1,018,165 Turkiye Vakiflar Bankasi T.A.O. “D” 1,505 196,998
Investment Banking & Brokerage (0.3%) 1,371,595 JM Financial Ltd. 3,204
Life & Health Insurance (2.0%) 326,752 Hanwha Life Insurance Co. Ltd. 2,240 1,927,500 Ping An Insurance (Group) Co. of China Ltd. “H” 19,003 21,243
Multi-Sector Holdings (0.3%) 3,554,000 First Pacific Co. Ltd. 2,657
Regional Banks (0.2%) 9,995,300 Bank Tabungan Negara Persero Tbk PT 2,365
Specialized Finance (0.2%) 817,000 Chailease Holding Co. Ltd. 2,370 Total Financials 240,382
Health Care (2.1%)Biotechnology (0.5%)
295,234 Biocon Ltd. 1,990 5,449 Hugel, Inc.* 2,399 149,598 ISU ABXIS Co. Ltd.* 1,226 5,615
Health Care Services (0.2%) 1,994,500 Universal Medical Financial & Technical Advisory Services Co. Ltd.(a),(b) 1,852
Pharmaceuticals (1.4%) 1,673,000 China Animal Healthcare Ltd.*(d),(e),(g) 111 6,731,000 China Medical System Holdings Ltd. 14,065 14,176 Total Health Care 21,643
Industrials (7.7%)Aerospace & Defense (0.6%)
222,265 Embraer S.A. ADR 4,254 41,584 Korea Aerospace Industries Ltd. 1,915 6,169
MarketNumber Valueof Shares Security (000)
Portfolio of Investments | 9
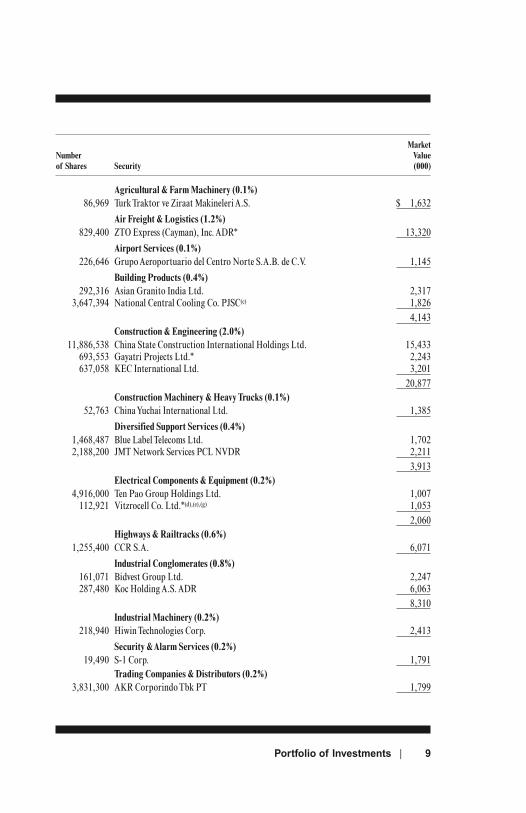
Agricultural & Farm Machinery (0.1%) 86,969 Turk Traktor ve Ziraat Makineleri A.S. $ 1,632
Air Freight & Logistics (1.2%) 829,400 ZTO Express (Cayman), Inc. ADR* 13,320
Airport Services (0.1%) 226,646 Grupo Aeroportuario del Centro Norte S.A.B. de C.V. 1,145
Building Products (0.4%) 292,316 Asian Granito India Ltd. 2,317 3,647,394 National Central Cooling Co. PJSC(c) 1,826 4,143
Construction & Engineering (2.0%) 11,886,538 China State Construction International Holdings Ltd. 15,433 693,553 Gayatri Projects Ltd.* 2,243 637,058 KEC International Ltd. 3,201 20,877
Construction Machinery & Heavy Trucks (0.1%) 52,763 China Yuchai International Ltd. 1,385
Diversified Support Services (0.4%) 1,468,487 Blue Label Telecoms Ltd. 1,702 2,188,200 JMT Network Services PCL NVDR 2,211 3,913
Electrical Components & Equipment (0.2%) 4,916,000 Ten Pao Group Holdings Ltd. 1,007 112,921 Vitzrocell Co. Ltd.*(d),(e),(g) 1,053 2,060
Highways & Railtracks (0.6%) 1,255,400 CCR S.A. 6,071
Industrial Conglomerates (0.8%) 161,071 Bidvest Group Ltd. 2,247 287,480 Koc Holding A.S. ADR 6,063 8,310
Industrial Machinery (0.2%) 218,940 Hiwin Technologies Corp. 2,413
Security & Alarm Services (0.2%) 19,490 S-1 Corp. 1,791
Trading Companies & Distributors (0.2%) 3,831,300 AKR Corporindo Tbk PT 1,799
MarketNumber Valueof Shares Security (000)
10 | USAA Emerging Markets Fund
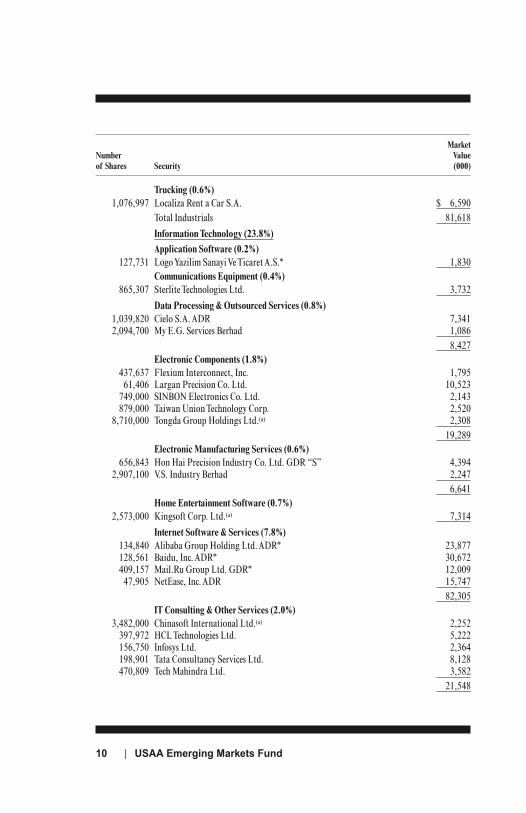
Trucking (0.6%) 1,076,997 Localiza Rent a Car S.A. $ 6,590 Total Industrials 81,618
Information Technology (23.8%)Application Software (0.2%)
127,731 Logo Yazilim Sanayi Ve Ticaret A.S.* 1,830Communications Equipment (0.4%)
865,307 Sterlite Technologies Ltd. 3,732
Data Processing & Outsourced Services (0.8%) 1,039,820 Cielo S.A. ADR 7,341 2,094,700 My E.G. Services Berhad 1,086 8,427
Electronic Components (1.8%) 437,637 Flexium Interconnect, Inc. 1,795 61,406 Largan Precision Co. Ltd. 10,523 749,000 SINBON Electronics Co. Ltd. 2,143 879,000 Taiwan Union Technology Corp. 2,520 8,710,000 Tongda Group Holdings Ltd.(a) 2,308 19,289
Electronic Manufacturing Services (0.6%) 656,843 Hon Hai Precision Industry Co. Ltd. GDR “S” 4,394 2,907,100 V.S. Industry Berhad 2,247 6,641
Home Entertainment Software (0.7%) 2,573,000 Kingsoft Corp. Ltd.(a) 7,314
Internet Software & Services (7.8%) 134,840 Alibaba Group Holding Ltd. ADR* 23,877 128,561 Baidu, Inc. ADR* 30,672 409,157 Mail.Ru Group Ltd. GDR* 12,009 47,905 NetEase, Inc. ADR 15,747 82,305
IT Consulting & Other Services (2.0%) 3,482,000 Chinasoft International Ltd.(a) 2,252 397,972 HCL Technologies Ltd. 5,222 156,750 Infosys Ltd. 2,364 198,901 Tata Consultancy Services Ltd. 8,128 470,809 Tech Mahindra Ltd. 3,582 21,548
MarketNumber Valueof Shares Security (000)
Portfolio of Investments | 11
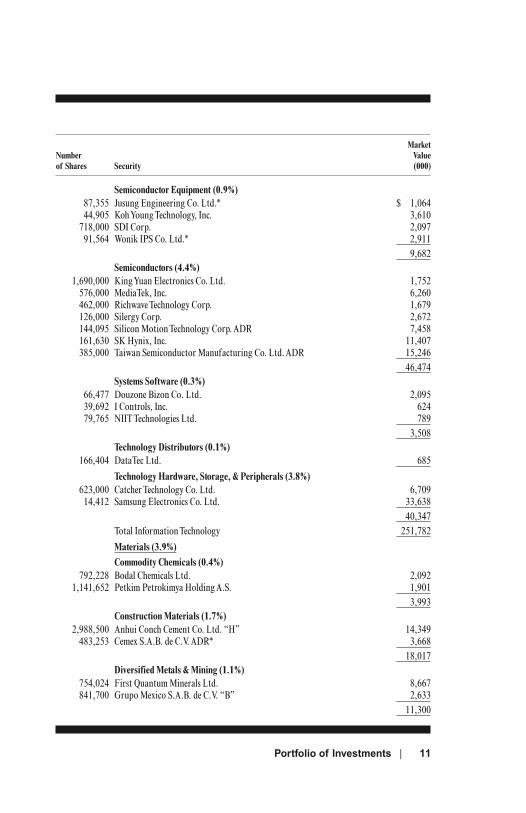
Semiconductor Equipment (0.9%) 87,355 Jusung Engineering Co. Ltd.* $ 1,064 44,905 Koh Young Technology, Inc. 3,610 718,000 SDI Corp. 2,097 91,564 Wonik IPS Co. Ltd.* 2,911 9,682
Semiconductors (4.4%) 1,690,000 King Yuan Electronics Co. Ltd. 1,752 576,000 MediaTek, Inc. 6,260 462,000 Richwave Technology Corp. 1,679 126,000 Silergy Corp. 2,672 144,095 Silicon Motion Technology Corp. ADR 7,458 161,630 SK Hynix, Inc. 11,407 385,000 Taiwan Semiconductor Manufacturing Co. Ltd. ADR 15,246 46,474
Systems Software (0.3%) 66,477 Douzone Bizon Co. Ltd. 2,095 39,692 I Controls, Inc. 624 79,765 NIIT Technologies Ltd. 789 3,508
Technology Distributors (0.1%) 166,404 DataTec Ltd. 685
Technology Hardware, Storage, & Peripherals (3.8%) 623,000 Catcher Technology Co. Ltd. 6,709 14,412 Samsung Electronics Co. Ltd. 33,638 40,347 Total Information Technology 251,782
Materials (3.9%)Commodity Chemicals (0.4%)
792,228 Bodal Chemicals Ltd. 2,092 1,141,652 Petkim Petrokimya Holding A.S. 1,901 3,993
Construction Materials (1.7%) 2,988,500 Anhui Conch Cement Co. Ltd. “H” 14,349 483,253 Cemex S.A.B. de C.V. ADR* 3,668 18,017
Diversified Metals & Mining (1.1%) 754,024 First Quantum Minerals Ltd. 8,667 841,700 Grupo Mexico S.A.B. de C.V. “B” 2,633 11,300
MarketNumber Valueof Shares Security (000)
12 | USAA Emerging Markets Fund
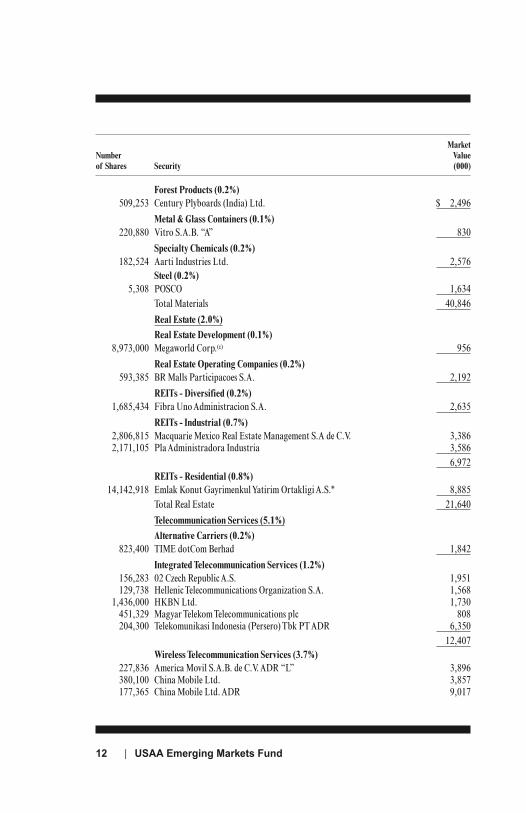
Forest Products (0.2%) 509,253 Century Plyboards (India) Ltd. $ 2,496
Metal & Glass Containers (0.1%) 220,880 Vitro S.A.B. “A” 830
Specialty Chemicals (0.2%) 182,524 Aarti Industries Ltd. 2,576
Steel (0.2%) 5,308 POSCO 1,634 Total Materials 40,846
Real Estate (2.0%)Real Estate Development (0.1%)
8,973,000 Megaworld Corp.(c) 956
Real Estate Operating Companies (0.2%) 593,385 BR Malls Participacoes S.A. 2,192
REITs - Diversified (0.2%) 1,685,434 Fibra Uno Administracion S.A. 2,635
REITs - Industrial (0.7%) 2,806,815 Macquarie Mexico Real Estate Management S.A de C.V. 3,386 2,171,105 Pla Administradora Industria 3,586 6,972
REITs - Residential (0.8%) 14,142,918 Emlak Konut Gayrimenkul Yatirim Ortakligi A.S.* 8,885 Total Real Estate 21,640
Telecommunication Services (5.1%)Alternative Carriers (0.2%)
823,400 TIME dotCom Berhad 1,842
Integrated Telecommunication Services (1.2%) 156,283 02 Czech Republic A.S. 1,951 129,738 Hellenic Telecommunications Organization S.A. 1,568 1,436,000 HKBN Ltd. 1,730 451,329 Magyar Telekom Telecommunications plc 808 204,300 Telekomunikasi Indonesia (Persero) Tbk PT ADR 6,350 12,407
Wireless Telecommunication Services (3.7%) 227,836 America Movil S.A.B. de C.V. ADR “L” 3,896 380,100 China Mobile Ltd. 3,857 177,365 China Mobile Ltd. ADR 9,017
MarketNumber Valueof Shares Security (000)
Portfolio of Investments | 13
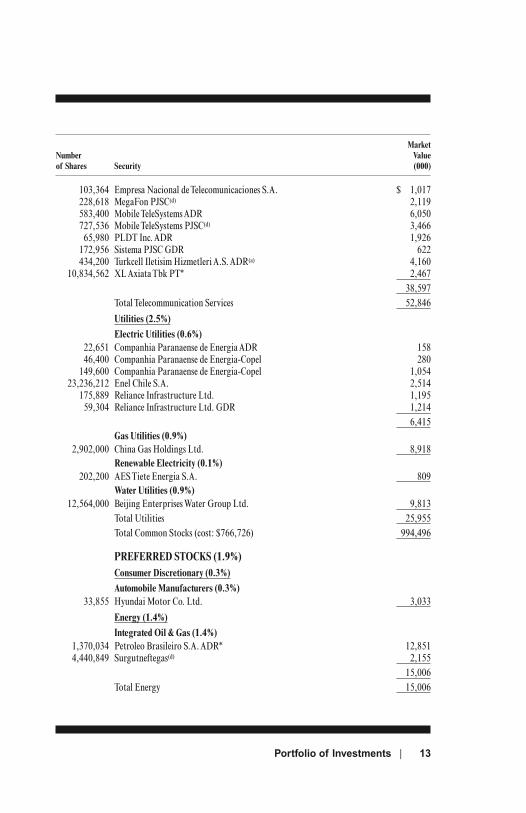
103,364 Empresa Nacional de Telecomunicaciones S.A. $ 1,017 228,618 MegaFon PJSC(d) 2,119 583,400 Mobile TeleSystems ADR 6,050 727,536 Mobile TeleSystems PJSC(d) 3,466 65,980 PLDT Inc. ADR 1,926 172,956 Sistema PJSC GDR 622 434,200 Turkcell Iletisim Hizmetleri A.S. ADR(a) 4,160 10,834,562 XL Axiata Tbk PT* 2,467 38,597 Total Telecommunication Services 52,846
Utilities (2.5%)Electric Utilities (0.6%)
22,651 Companhia Paranaense de Energia ADR 158 46,400 Companhia Paranaense de Energia-Copel 280 149,600 Companhia Paranaense de Energia-Copel 1,054 23,236,212 Enel Chile S.A. 2,514 175,889 Reliance Infrastructure Ltd. 1,195 59,304 Reliance Infrastructure Ltd. GDR 1,214 6,415
Gas Utilities (0.9%) 2,902,000 China Gas Holdings Ltd. 8,918
Renewable Electricity (0.1%) 202,200 AES Tiete Energia S.A. 809
Water Utilities (0.9%) 12,564,000 Beijing Enterprises Water Group Ltd. 9,813 Total Utilities 25,955 Total Common Stocks (cost: $766,726) 994,496
PREFERRED STOCKS (1.9%)Consumer Discretionary (0.3%)Automobile Manufacturers (0.3%)
33,855 Hyundai Motor Co. Ltd. 3,033
Energy (1.4%)Integrated Oil & Gas (1.4%)
1,370,034 Petroleo Brasileiro S.A. ADR* 12,851 4,440,849 Surgutneftegas(d) 2,155 15,006 Total Energy 15,006
MarketNumber Valueof Shares Security (000)
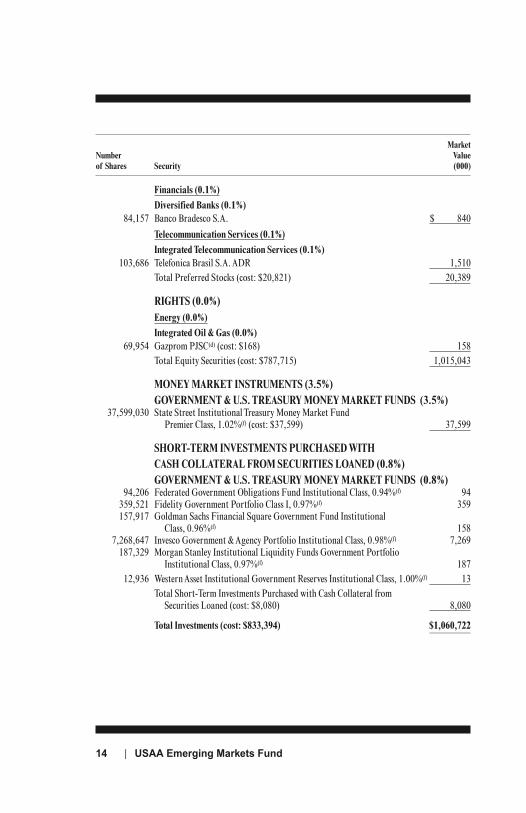
14 | USAA Emerging Markets Fund
Financials (0.1%)Diversified Banks (0.1%)
84,157 Banco Bradesco S.A. $ 840
Telecommunication Services (0.1%)Integrated Telecommunication Services (0.1%)
103,686 Telefonica Brasil S.A. ADR 1,510 Total Preferred Stocks (cost: $20,821) 20,389
RIGHTS (0.0%)Energy (0.0%)Integrated Oil & Gas (0.0%)
69,954 Gazprom PJSC(d) (cost: $168) 158 Total Equity Securities (cost: $787,715) 1,015,043
MONEY MARKET INSTRUMENTS (3.5%)GOVERNMENT & U.S. TREASURY MONEY MARKET FUNDS (3.5%)
37,599,030 State Street Institutional Treasury Money Market Fund Premier Class, 1.02%(f) (cost: $37,599) 37,599
SHORT-TERM INVESTMENTS PURCHASED WITH CASH COLLATERAL FROM SECURITIES LOANED (0.8%)GOVERNMENT & U.S. TREASURY MONEY MARKET FUNDS (0.8%)
94,206 Federated Government Obligations Fund Institutional Class, 0.94%(f) 94 359,521 Fidelity Government Portfolio Class I, 0.97%(f) 359 157,917 Goldman Sachs Financial Square Government Fund Institutional Class, 0.96%(f) 158 7,268,647 Invesco Government & Agency Portfolio Institutional Class, 0.98%(f) 7,269 187,329 Morgan Stanley Institutional Liquidity Funds Government Portfolio Institutional Class, 0.97%(f) 187 12,936 Western Asset Institutional Government Reserves Institutional Class, 1.00%(f) 13 Total Short-Term Investments Purchased with Cash Collateral from Securities Loaned (cost: $8,080) 8,080
Total Investments (cost: $833,394) $1,060,722
MarketNumber Valueof Shares Security (000)
Portfolio of Investments | 15
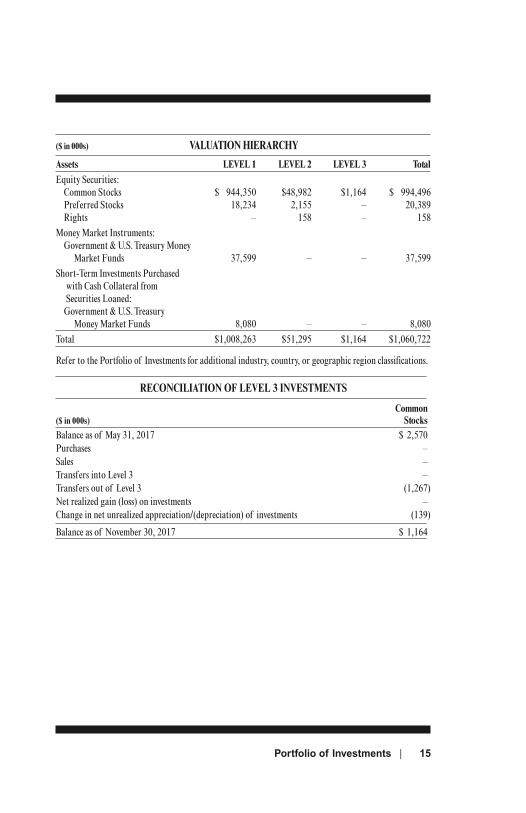
($ in 000s) VALUATION HIERARCHY
Assets LEVEL 1 LEVEL 2 LEVEL 3 TotalEquity Securities: Common Stocks $ 944,350 $48,982 $1,164 $ 994,496 Preferred Stocks 18,234 2,155 – 20,389 Rights – 158 – 158Money Market Instruments: Government & U.S. Treasury Money Market Funds 37,599 – – 37,599Short-Term Investments Purchased
with Cash Collateral from Securities Loaned:
Government & U.S. Treasury Money Market Funds 8,080 – – 8,080Total $1,008,263 $51,295 $1,164 $1,060,722
Refer to the Portfolio of Investments for additional industry, country, or geographic region classifications.
RECONCILIATION OF LEVEL 3 INVESTMENTS
Common($ in 000s) StocksBalance as of May 31, 2017 $ 2,570Purchases –Sales –Transfers into Level 3 –Transfers out of Level 3 (1,267)Net realized gain (loss) on investments –Change in net unrealized appreciation/(depreciation) of investments (139)
Balance as of November 30, 2017 $ 1,164
16 | USAA Emerging Markets Fund
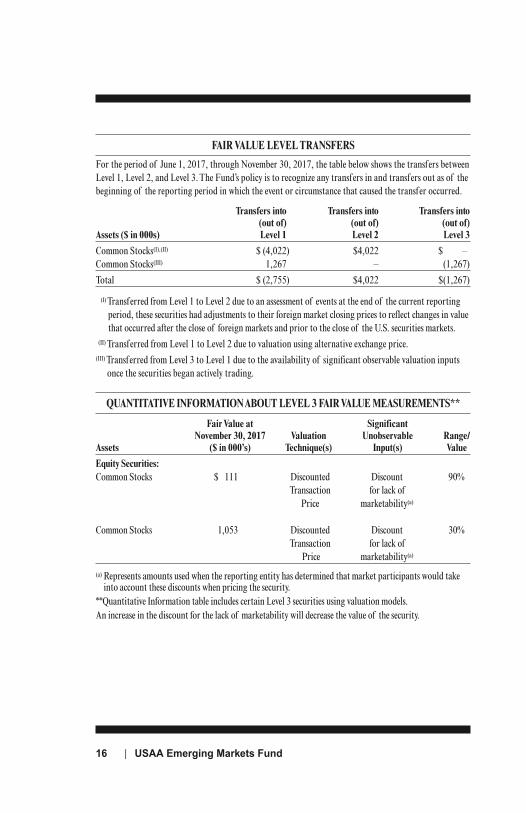
FAIR VALUE LEVEL TRANSFERS
For the period of June 1, 2017, through November 30, 2017, the table below shows the transfers betweenLevel 1, Level 2, and Level 3. The Fund’s policy is to recognize any transfers in and transfers out as of thebeginning of the reporting period in which the event or circumstance that caused the transfer occurred.
Transfers into Transfers into Transfers into (out of) (out of) (out of) Assets ($ in 000s) Level 1 Level 2 Level 3
Common Stocks(I),(II) $ (4,022) $4,022 $ –Common Stocks(III) 1,267 – (1,267)
Total $ (2,755) $4,022 $(1,267)
(I) Transferred from Level 1 to Level 2 due to an assessment of events at the end of the current reportingperiod, these securities had adjustments to their foreign market closing prices to reflect changes in valuethat occurred after the close of foreign markets and prior to the close of the U.S. securities markets.
(II) Transferred from Level 1 to Level 2 due to valuation using alternative exchange price.(III) Transferred from Level 3 to Level 1 due to the availability of significant observable valuation inputs
once the securities began actively trading.
QUANTITATIVE INFORMATION ABOUT LEVEL 3 FAIR VALUE MEASUREMENTS**
Fair Value at Significant November 30, 2017 Valuation Unobservable Range/Assets ($ in 000’s) Technique(s) Input(s) Value
Equity Securities:Common Stocks $ 111 Discounted Discount 90% Transaction for lack of Price marketability(a)
Common Stocks 1,053 Discounted Discount 30% Transaction for lack of Price marketability(a)
(a) Represents amounts used when the reporting entity has determined that market participants would takeinto account these discounts when pricing the security.
**Quantitative Information table includes certain Level 3 securities using valuation models.An increase in the discount for the lack of marketability will decrease the value of the security.
Notes to Portfolio of Investments | 17
NOTES TO PORTFOLIOOF INVESTMENTS
■ GENERAL NOTES
Market values of securities are determined by procedures and practicesdiscussed in Note 1A to the financial statements.
The Portfolio of Investments category percentages shown represent thepercentages of the investments to net assets, and, in total, may not equal100%. A category percentage of 0.0% represents less than 0.1% of netassets.
■ CATEGORIES AND DEFINITIONS
Rights – Enable the holder to buy a specified number of shares of newissues of a common stock before it is offered to the public.
■ PORTFOLIO ABBREVIATIONS AND DESCRIPTIONS
ADR American depositary receipts are receipts issued by a U.S. bankevidencing ownership of foreign shares. Dividends are paid inU.S. dollars.
GDR Global depositary receipts are receipts issued by a U.S. orforeign bank evidencing ownership of foreign shares.Dividends are paid in U.S. dollars.
NVDR Non-voting depositary receipts are receipts issued by ThaiNVDR Company Limited.
REIT Real estate investment trust – Dividend distributions fromREITs may be recorded as income and later characterized bythe REIT at the end of the fiscal year as capital gains or a
November 30, 2017 (unaudited)
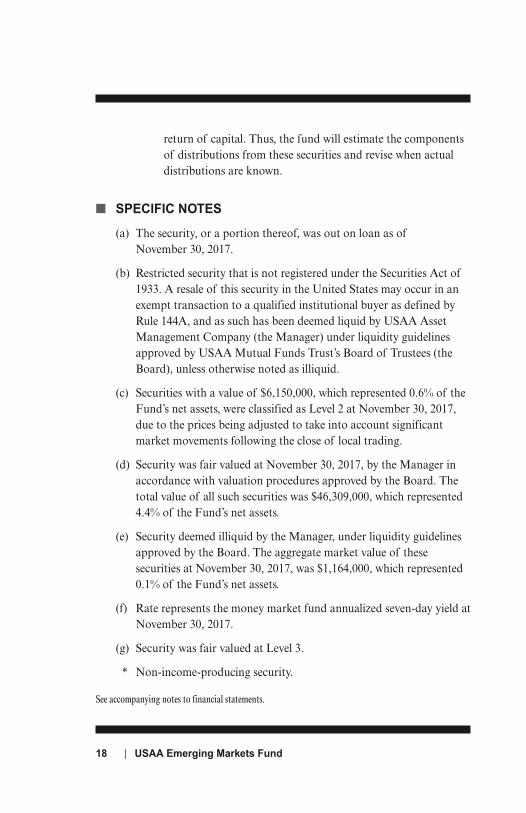
return of capital. Thus, the fund will estimate the componentsof distributions from these securities and revise when actualdistributions are known.
■ SPECIFIC NOTES
(a) The security, or a portion thereof, was out on loan as ofNovember 30, 2017.
(b) Restricted security that is not registered under the Securities Act of1933. A resale of this security in the United States may occur in anexempt transaction to a qualified institutional buyer as defined byRule 144A, and as such has been deemed liquid by USAA AssetManagement Company (the Manager) under liquidity guidelinesapproved by USAA Mutual Funds Trust’s Board of Trustees (theBoard), unless otherwise noted as illiquid.
(c) Securities with a value of $6,150,000, which represented 0.6% of theFund’s net assets, were classified as Level 2 at November 30, 2017,due to the prices being adjusted to take into account significantmarket movements following the close of local trading.
(d) Security was fair valued at November 30, 2017, by the Manager inaccordance with valuation procedures approved by the Board. Thetotal value of all such securities was $46,309,000, which represented4.4% of the Fund’s net assets.
(e) Security deemed illiquid by the Manager, under liquidity guidelinesapproved by the Board. The aggregate market value of thesesecurities at November 30, 2017, was $1,164,000, which represented0.1% of the Fund’s net assets.
(f) Rate represents the money market fund annualized seven-day yield atNovember 30, 2017.
(g) Security was fair valued at Level 3.
* Non-income-producing security.
See accompanying notes to financial statements.
18 | USAA Emerging Markets Fund
Financial Statements | 19
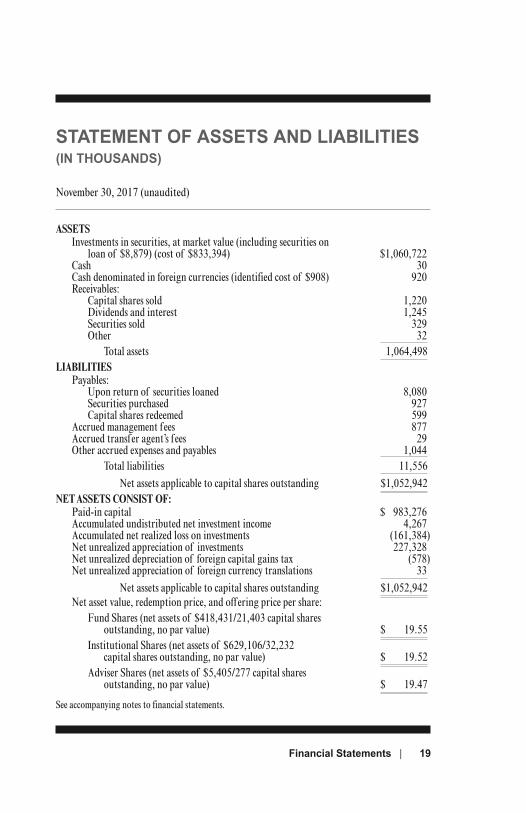
ASSETSInvestments in securities, at market value (including securities on
loan of $8,879) (cost of $833,394) $1,060,722Cash 30Cash denominated in foreign currencies (identified cost of $908) 920Receivables: Capital shares sold 1,220 Dividends and interest 1,245 Securities sold 329 Other 32 Total assets 1,064,498
LIABILITIESPayables: Upon return of securities loaned 8,080 Securities purchased 927 Capital shares redeemed 599Accrued management fees 877Accrued transfer agent’s f ees 29Other accrued expenses and payables 1,044 Total liabilities 11,556 Net assets applicable to capital shares outstanding $1,052,942
NET ASSETS CONSIST OF:Paid-in capital $ 983,276Accumulated undistributed net investment income 4,267Accumulated net realized loss on investments (161,384)Net unrealized appreciation of investments 227,328Net unrealized depreciation of foreign capital gains tax (578)Net unrealized appreciation of foreign currency translations 33 Net assets applicable to capital shares outstanding $1,052,942Net asset value, redemption price, and offering price per share: Fund Shares (net assets of $418,431/21,403 capital shares outstanding, no par value) $ 19.55 Institutional Shares (net assets of $629,106/32,232 capital shares outstanding, no par value) $ 19.52 Adviser Shares (net assets of $5,405/277 capital shares outstanding, no par value) $ 19.47
See accompanying notes to financial statements.
STATEMENT OF ASSETS AND LIABILITIES(IN THOUSANDS)
November 30, 2017 (unaudited)
20 | USAA Emerging Markets Fund
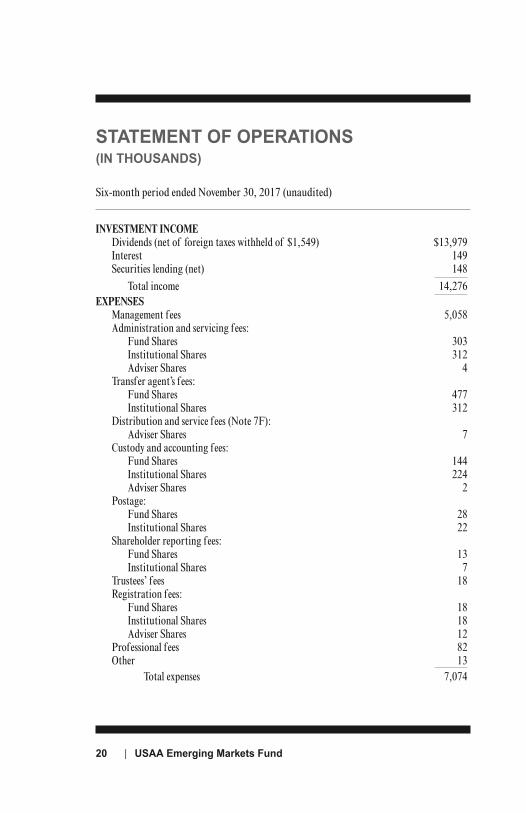
STATEMENT OF OPERATIONS(IN THOUSANDS)
Six-month period ended November 30, 2017 (unaudited)
INVESTMENT INCOMEDividends (net of foreign taxes withheld of $1,549) $13,979Interest 149Securities lending (net) 148 Total income 14,276
EXPENSESManagement fees 5,058Administration and servicing fees: Fund Shares 303 Institutional Shares 312 Adviser Shares 4Transfer agent’s f ees: Fund Shares 477 Institutional Shares 312Distribution and service fees (Note 7F): Adviser Shares 7Custody and accounting fees: Fund Shares 144 Institutional Shares 224 Adviser Shares 2Postage: Fund Shares 28 Institutional Shares 22Shareholder reporting fees: Fund Shares 13 Institutional Shares 7Trustees’ fees 18Registration fees: Fund Shares 18 Institutional Shares 18 Adviser Shares 12Professional f ees 82Other 13 Total expenses 7,074
Financial Statements | 21
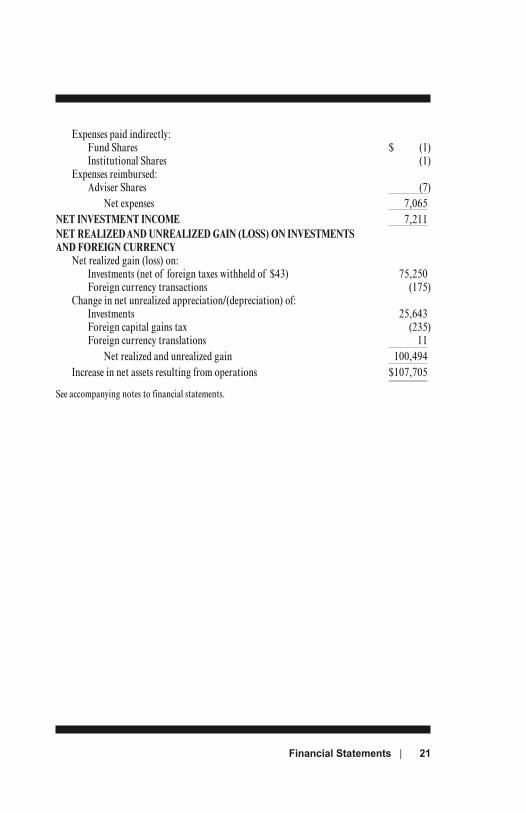
Expenses paid indirectly: Fund Shares $ (1) Institutional Shares (1)Expenses reimbursed: Adviser Shares (7) Net expenses 7,065
NET INVESTMENT INCOME 7,211NET REALIZED AND UNREALIZED GAIN (LOSS) ON INVESTMENTS AND FOREIGN CURRENCY
Net realized gain (loss) on: Investments (net of foreign taxes withheld of $43) 75,250 Foreign currency transactions (175)Change in net unrealized appreciation/(depreciation) of: Investments 25,643 Foreign capital gains tax (235) Foreign currency translations 11 Net realized and unrealized gain 100,494Increase in net assets resulting from operations $107,705
See accompanying notes to financial statements.
22 | USAA Emerging Markets Fund
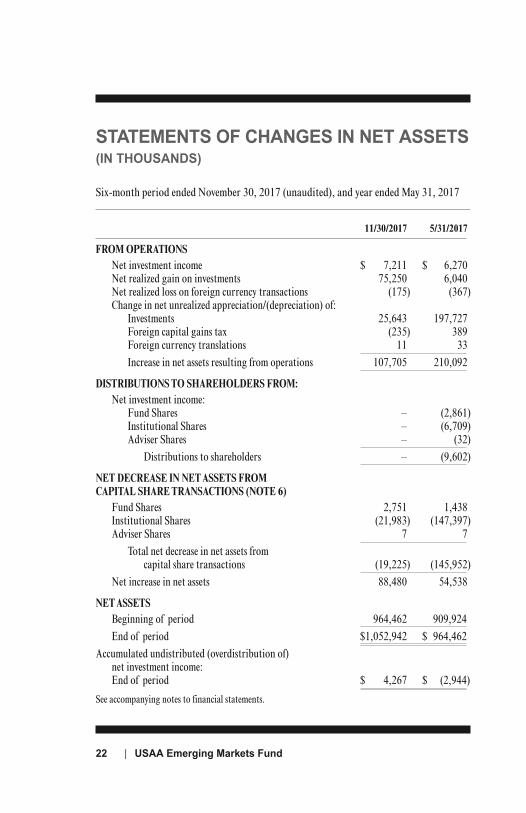
STATEMENTS OF CHANGES IN NET ASSETS(IN THOUSANDS)
Six-month period ended November 30, 2017 (unaudited), and year ended May 31, 2017
11/30/2017 5/31/2017
FROM OPERATIONSNet investment income $ 7,211 $ 6,270Net realized gain on investments 75,250 6,040Net realized loss on foreign currency transactions (175) (367)Change in net unrealized appreciation/(depreciation) of: Investments 25,643 197,727 Foreign capital gains tax (235) 389 Foreign currency translations 11 33 Increase in net assets resulting from operations 107,705 210,092
DISTRIBUTIONS TO SHAREHOLDERS FROM:Net investment income: Fund Shares – (2,861) Institutional Shares – (6,709) Adviser Shares – (32) Distributions to shareholders – (9,602)
NET DECREASE IN NET ASSETS FROM CAPITAL SHARE TRANSACTIONS (NOTE 6)
Fund Shares 2,751 1,438Institutional Shares (21,983) (147,397)Adviser Shares 7 7 Total net decrease in net assets from capital share transactions (19,225) (145,952)Net increase in net assets 88,480 54,538
NET ASSETSBeginning of period 964,462 909,924End of period $1,052,942 $ 964,462
Accumulated undistributed (overdistribution of) net investment income: End of period $ 4,267 $ (2,944)
See accompanying notes to financial statements.
Notes to Financial Statements | 23
NOTES TO FINANCIAL STATEMENTSNovember 30, 2017 (unaudited)
(1) SUMMARY OF SIGNIFICANT ACCOUNTING POLICIESUSAA MUTUAL FUNDS TRUST (the Trust), registered under theInvestment Company Act of 1940, as amended (the 1940 Act), is an open-end management investment company organized as a Delaware statutorytrust consisting of 51 separate funds. Additionally, USAA Emerging MarketsFund (the Fund) qualifies as a registered investment company underAccounting Standards Codification Topic 946. The information presented inthis semiannual report pertains only to the Fund, which is classified asdiversified under the 1940 Act. The Fund’s investment objective is to seekcapital appreciation.
The Fund consists of three classes of shares: Emerging Markets Fund Shares(Fund Shares), Emerging Markets Fund Institutional Shares (InstitutionalShares), and Emerging Markets Fund Adviser Shares (Adviser Shares). Eachclass of shares has equal rights to assets and earnings, except that each classbears certain class-related expenses specific to the particular class. Theseexpenses include administration and servicing fees, transfer agent fees, postage,shareholder reporting fees, distribution and service (12b-1) fees, and certainregistration and custodian fees. Expenses not attributable to a specific class,income, and realized gains or losses on investments are allocated to each classof shares based on each class’ relative net assets. Each class has exclusive votingrights on matters related solely to that class and separate voting rights onmatters that relate to all classes. The Institutional Shares are available forinvestment through a USAA discretionary managed account program andcertain advisory programs sponsored by financial intermediaries, such asbrokerage firms, investment advisors, financial planners, third-partyadministrators, and insurance companies. Institutional Shares also are availableto institutional investors, which include retirement plans, endowments,
24 | USAA Emerging Markets Fund
foundations, and bank trusts, as well as other persons or legal entities that theFund may approve from time to time, or for purchase by a USAA fundparticipating in a fund-of-funds investment strategy (USAA fund-of-funds).The Adviser Shares permit investors to purchase shares through financialintermediaries, including banks, broker-dealers, insurance companies,investment advisers, plan sponsors, and financial professionals that providevarious administrative and distribution services.
A. Security valuation – The Trust’s Board of Trustees (the Board) hasestablished the Valuation Committee (the Committee), and subject toBoard oversight, the Committee administers and oversees the Fund’svaluation policies and procedures, which are approved by the Board.Among other things, these policies and procedures allow the Fund toutilize independent pricing services, quotations from securities dealers,and a wide variety of sources and information to establish and adjust thefair value of securities as events occur and circumstances warrant.
The Committee reports to the Board on a quarterly basis and makesrecommendations to the Board as to pricing methodologies and servicesused by the Fund and presents additional information to the Boardregarding application of the pricing and fair valuation policies andprocedures during the preceding quarter.
The Committee meets as often as necessary to make pricing and fairvalue determinations. In addition, the Committee holds regular monthlymeetings to review prior actions taken by the Committee and USAAAsset Management Company (the Manager), an affiliate of the Fund.Among other things, these monthly meetings include a review andanalysis of backtesting reports, pricing service quotation comparisons,illiquid securities and fair value determinations, pricing movements, anddaily stale price monitoring.
The value of each security is determined (as of the close of trading onthe New York Stock Exchange (NYSE) on each business day the NYSEis open) as set forth below:
1. Equity securities, including exchange-traded funds (ETFs),exchange-traded notes (ETNs), and equity-linked structured notes,
Notes to Financial Statements | 25
except as otherwise noted, traded primarily on a domestic securitiesexchange or the over-the-counter markets, are valued at the last salesprice or official closing price on the exchange or primary market onwhich they trade. Securities traded primarily on foreign securitiesexchanges or markets are valued at the last quoted sale price, or themost recently determined official closing price calculated accordingto local market convention, available at the time the Fund is valued.If no last sale or official closing price is reported or available, theaverage of the bid and ask prices generally is used. Actively tradedequity securities listed on a domestic exchange generally arecategorized in Level 1 of the fair value hierarchy. Certain preferredand equity securities traded in inactive markets generally arecategorized in Level 2 of the fair value hierarchy.
2. Equity securities trading in various foreign markets may take place ondays when the NYSE is closed. Further, when the NYSE is open, theforeign markets may be closed. Therefore, the calculation of the Fund’snet asset value (NAV) may not take place at the same time the prices ofcertain foreign securities held by the Fund are determined. In manycases, events affecting the values of foreign securities that occurbetween the time of their last quoted sale or official closing price andthe close of normal trading on the NYSE on a day the Fund’s NAV iscalculated will not need to be reflected in the value of the Fund’sforeign securities. However, the Manager and the Fund’s subadviser(s),if applicable, will monitor for events that would materially affect thevalue of the Fund’s foreign securities. The Fund’s subadviser(s) haveagreed to notify the Manager of significant events they identify thatwould materially affect the value of the Fund’s foreign securities. If theManager determines that a particular event would materially affect thevalue of the Fund’s foreign securities, then the Committee will considersuch available information that it deems relevant and will determine afair value for the affected foreign securities in accordance withvaluation procedures. In addition, information from an external vendoror other sources may be used to adjust the foreign market closing pricesof foreign equity securities to reflect what the Committee believes to bethe fair value of the securities as of the close of the NYSE. Fair
26 | USAA Emerging Markets Fund
valuation of affected foreign equity securities may occur frequentlybased on an assessment that events which occur on a fairly regularbasis (such as U.S. market movements) are significant. Such securitiesare categorized in Level 2 of the fair value hierarchy.
3. Investments in open-end investment companies, commingled, orother funds, other than ETFs, are valued at their NAV at the end ofeach business day and are categorized in Level 1 of the fair valuehierarchy.
4. Debt securities with maturities greater than 60 days are valued eachbusiness day by a pricing service (the Service) approved by the Board.The Service uses an evaluated mean between quoted bid and askprices or the last sales price to value a security when, in the Service’sjudgment, these prices are readily available and are representative ofthe security’s market value. For many securities, such prices are notreadily available. The Service generally prices those securities based onmethods which include consideration of yields or prices of securitiesof comparable quality, coupon, maturity, and type; indications as tovalues from dealers in securities; and general market conditions.Generally, debt securities are categorized in Level 2 of the fair valuehierarchy; however, to the extent the valuations include significantunobservable inputs, the securities would be categorized in Level 3.
5. Short-term debt securities with original or remaining maturities of 60days or less may be valued at amortized cost, provided that amortizedcost represents the fair value of such securities.
6. Repurchase agreements are valued at cost.
7. In the event that price quotations or valuations are not readilyavailable, are not reflective of market value, or a significant event hasbeen recognized in relation to a security or class of securities, thesecurities are valued in good faith by the Committee in accordancewith valuation procedures approved by the Board. The effect of fairvalue pricing is that securities may not be priced on the basis ofquotations from the primary market in which they are traded and theactual price realized from the sale of a security may differ materially
Notes to Financial Statements | 27
from the fair value price. Valuing these securities at fair value isintended to cause the Fund’s NAV to be more reliable than itotherwise would be.
Fair value methods used by the Manager include, but are not limitedto, obtaining market quotations from secondary pricing services,broker-dealers, other pricing services, or widely used quotation systems.General factors considered in determining the fair value of securitiesinclude fundamental analytical data, the nature and duration of anyrestrictions on disposition of the securities, evaluation of credit quality,and an evaluation of the forces that influenced the market in which thesecurities are purchased and sold. Level 2 securities include equitysecurities that are valued using market inputs and other observablefactors deemed by the Manager to appropriately reflect fair value.
B. Fair value measurements – Fair value is defined as the price that would bereceived to sell an asset or paid to transfer a liability in an orderlytransaction between market participants at the measurement date. Thethree-level valuation hierarchy disclosed in the Portfolio of Investmentsis based upon the transparency of inputs to the valuation of an asset orliability as of the measurement date. The three levels are defined asfollows:
Level 1 – inputs to the valuation methodology are quoted prices(unadjusted) in active markets for identical securities.
Level 2 – inputs to the valuation methodology are other significantobservable inputs, including quoted prices for similar securities, inputsthat are observable for the securities, either directly or indirectly, andmarket-corroborated inputs such as market indexes.
Level 3 – inputs to the valuation methodology are unobservable andsignificant to the fair value measurement, including the Manager’s ownassumptions in determining the fair value.
The inputs or methodologies used for valuing securities are notnecessarily an indication of the risks associated with investing in thosesecurities.
28 | USAA Emerging Markets Fund
The valuation of securities falling in the Level 3 category are primarilysupported by last discounted quoted price. However, these securities areincluded in the Level 3 category due to limited market transparencyand/or a lack of corroboration to support the quoted prices.
The methods used may include valuation models that rely on significantassumptions and/or unobservable inputs to determine the fair valuemeasurement for the securities. A market-based approach may beemployed using related or comparable securities, recent transactions,market multiples, book values and other relevant information or anincome-based approach may be employed whereby estimated future cashflows are discounted to determine the fair value. In some cases discountsmay be applied due to market liquidity limitations.
The valuation methodology applied to certain Level 3 securities changedduring the period. Securities that were previously valued at last directquoted price are now being valued using valuation models as a result ofrecent relevant company information.
Refer to the Portfolio of Investments for a reconciliation of investmentsin which significant unobservable inputs (Level 3) were used in determiningvalue.
C. Federal taxes – The Fund’s policy is to comply with the requirements ofthe Internal Revenue Code of 1986, as amended, applicable to regulatedinvestment companies and to distribute substantially all of its taxableincome and net capital gains, if any, to its shareholders. Therefore, nofederal income tax provision is required.
For the six-month period ended November 30, 2017, the Fund did notincur any income tax, interest, or penalties, and has recorded no liabilityfor net unrecognized tax benefits relating to uncertain income taxpositions. On an ongoing basis, the Manager will monitor the Fund’s taxbasis to determine if adjustments to this conclusion are necessary. Thestatute of limitations on the Fund’s tax return filings generally remain openfor the three preceding fiscal reporting year ends and remain subject toexamination by the Internal Revenue Service and state taxing authorities.
Notes to Financial Statements | 29
D. Foreign taxation – Foreign income and capital gains on some foreignsecurities may be subject to foreign taxes, which are reflected as areduction to such income and realized gains. The Fund records a liabilitybased on unrealized gains to provide for potential foreign taxes payableupon the sale of these securities. Foreign taxes have been provided for inaccordance with the Fund’s understanding of the applicable countries’prevailing tax rules and rates.
E. Investments in securities – Securities transactions are accounted for onthe date the securities are purchased or sold (trade date). Gains or lossesfrom sales of investment securities are computed on the identified costbasis. Dividend income, less foreign taxes, if any, is recorded on the ex-dividend date. If the ex-dividend date has passed, certain dividends fromforeign securities are recorded upon notification. Interest income isrecorded daily on the accrual basis. Premiums and discounts on short-term securities are amortized on a straight-line basis over the life of therespective securities.
F. Foreign currency translations – The Fund’s assets may be invested in thesecurities of foreign issuers and may be traded in foreign currency. Sincethe Fund’s accounting records are maintained in U.S. dollars, foreigncurrency amounts are translated into U.S. dollars on the following bases:
1. Purchases and sales of securities, income, and expenses at theexchange rate obtained from an independent pricing service on therespective dates of such transactions.
2. Market value of securities, other assets, and liabilities at the exchangerate obtained from an independent pricing service on a daily basis.
The Fund does not isolate that portion of the results of operationsresulting from changes in foreign exchange rates on investments from thefluctuations arising from changes in market prices of securities held.Such fluctuations are included with the net realized and unrealized gainor loss from investments.
Separately, net realized foreign currency gains/losses may arise from salesof foreign currency, currency gains/losses realized between the trade and
30 | USAA Emerging Markets Fund
settlement dates on security transactions, and from the differencebetween amounts of dividends, interest, and foreign withholding taxesrecorded on the Fund’s books and the U.S. dollar equivalent of theamounts received. At the end of the Fund’s fiscal year, net realizedforeign currency gains/losses are reclassified from accumulated netrealized gains/losses to accumulated undistributed net investment incomeon the Statement of Assets and Liabilities, as such amounts are treatedas ordinary income/loss for federal income tax purposes. Net unrealizedforeign currency exchange gains/losses arise from changes in the value ofassets and liabilities, other than investments in securities, resulting fromchanges in the exchange rate.
G. Expenses paid indirectly – A portion of the brokerage commissions thatthe Fund pays may be recaptured as a credit that is tracked and used bythe custodian to directly reduce expenses paid by the Fund. In addition,through arrangements with the Fund’s custodian and other banksutilized by the Fund for cash management purposes, realized credits, ifany, generated from cash balances in the Fund’s bank accounts may beused to directly reduce the Fund’s expenses. For the six-month periodended November 30, 2017, brokerage commission recapture creditsreduced the expenses of the Fund Shares, Institutional Shares andAdviser Shares by $1,000, $1,000, and less than $500, respectively. Forthe six-month period ended November 30, 2017, there were no custodianand other bank credits.
H. Redemption fees – Adviser Shares held in the Fund less than 60 days aresubject to a redemption fee equal to 1.00% of the proceeds of theredeemed or exchanged shares. All redemption fees paid will beaccounted for by the Fund as an addition to paid in capital. EffectiveOctober 1, 2017, the Adviser Shares no longer charge redemptions fees.For the six-month period ended November 30, 2017, the Adviser Sharesdid not charge any redemption fees.
I. Indemnifications – Under the Trust’s organizational documents, its officersand trustees are indemnified against certain liabilities arising out of theperformance of their duties to the Trust. In addition, in the normal course
Notes to Financial Statements | 31
of business, the Trust enters into contracts that contain a variety ofrepresentations and warranties that provide general indemnifications. TheTrust’s maximum exposure under these arrangements is unknown, as thiswould involve future claims that may be made against the Trust that havenot yet occurred. However, the Trust expects the risk of loss to be remote.
J. Use of estimates – The preparation of financial statements in conformitywith U.S. generally accepted accounting principles requires managementto make estimates and assumptions that may affect the reported amountsin the financial statements.
(2) LINE OF CREDITThe Fund participates, along with other funds of the Trust and USAA ETFTrust (together, the Trusts), in a joint, short-term, revolving, committed loanagreement of $500 million with USAA Capital Corporation (CAPCO), anaffiliate of the Manager. The purpose of the agreement is to providetemporary or emergency cash needs, including redemption requests thatmight otherwise require the untimely disposition of securities. Subject toavailability (including usage of the facility by other funds of the Trusts), theFund may borrow from CAPCO an amount up to 5% of the Fund’s totalassets at an interest rate based on the London Interbank Offered Rate(LIBOR), plus 100.0 basis points.
The Trusts are also assessed facility fees by CAPCO in the amount of 13.0basis points of the amount of the committed loan agreement. Prior toSeptember 30, 2017, the maximum annual facility fee was 12.0 basis pointsof the amount of the committed loan agreement. The facility fees areallocated among the funds of the Trusts based on their respective average netassets for the period.
The Trusts may request an optional increase of the committed loanagreement from $500 million up to $750 million. If the Trusts increase thecommitted loan agreement, the assessed facility fee on the amount of theadditional commitment will be 14.0 basis points.
For the six-month period ended November 30, 2017, the Fund paid CAPCOfacility fees of less than $4,000, which represents 1.3% of the total fees paid
32 | USAA Emerging Markets Fund
to CAPCO by the funds of the Trusts. The Fund had no borrowings underthis agreement during the six-month period ended November 30, 2017.
(3) DISTRIBUTIONSThe tax basis of distributions and any accumulated undistributed netinvestment income will be determined as of the Fund’s tax year-end ofMay 31, 2018, in accordance with applicable federal tax law.
Distributions of net investment income and realized gains from securitytransactions not offset by capital losses are made annually in the succeedingfiscal year or as otherwise required to avoid the payment of federal income tax.
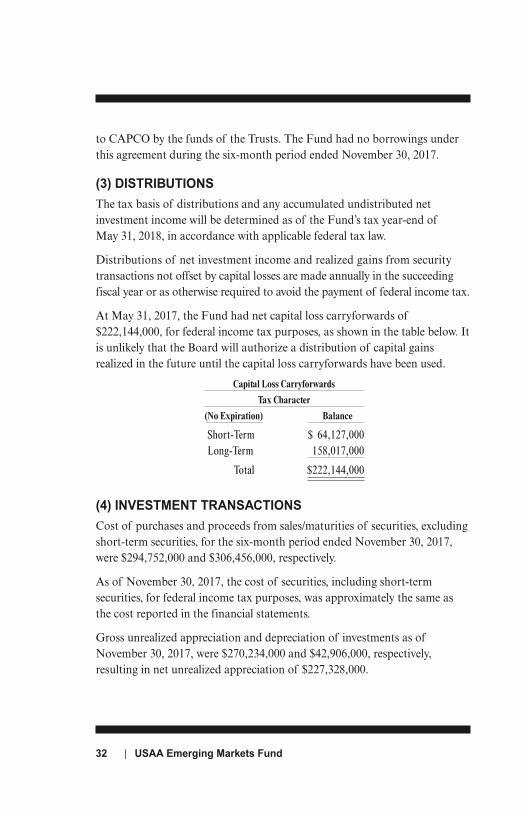
At May 31, 2017, the Fund had net capital loss carryforwards of$222,144,000, for federal income tax purposes, as shown in the table below. Itis unlikely that the Board will authorize a distribution of capital gainsrealized in the future until the capital loss carryforwards have been used.
Capital Loss Carryforwards
Tax Character
(No Expiration) Balance Short-Term $ 64,127,000Long-Term 158,017,000
Total $222,144,000
(4) INVESTMENT TRANSACTIONSCost of purchases and proceeds from sales/maturities of securities, excludingshort-term securities, for the six-month period ended November 30, 2017,were $294,752,000 and $306,456,000, respectively.
As of November 30, 2017, the cost of securities, including short-termsecurities, for federal income tax purposes, was approximately the same asthe cost reported in the financial statements.
Gross unrealized appreciation and depreciation of investments as ofNovember 30, 2017, were $270,234,000 and $42,906,000, respectively,resulting in net unrealized appreciation of $227,328,000.
Notes to Financial Statements | 33
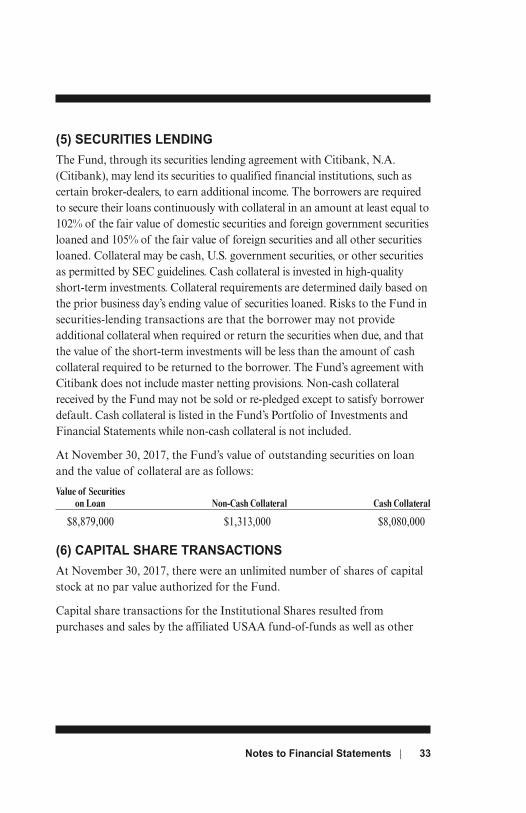
(5) SECURITIES LENDINGThe Fund, through its securities lending agreement with Citibank, N.A.(Citibank), may lend its securities to qualified financial institutions, such ascertain broker-dealers, to earn additional income. The borrowers are requiredto secure their loans continuously with collateral in an amount at least equal to102% of the fair value of domestic securities and foreign government securitiesloaned and 105% of the fair value of foreign securities and all other securitiesloaned. Collateral may be cash, U.S. government securities, or other securitiesas permitted by SEC guidelines. Cash collateral is invested in high-qualityshort-term investments. Collateral requirements are determined daily based onthe prior business day’s ending value of securities loaned. Risks to the Fund insecurities-lending transactions are that the borrower may not provideadditional collateral when required or return the securities when due, and thatthe value of the short-term investments will be less than the amount of cashcollateral required to be returned to the borrower. The Fund’s agreement withCitibank does not include master netting provisions. Non-cash collateralreceived by the Fund may not be sold or re-pledged except to satisfy borrowerdefault. Cash collateral is listed in the Fund’s Portfolio of Investments andFinancial Statements while non-cash collateral is not included.
At November 30, 2017, the Fund’s value of outstanding securities on loanand the value of collateral are as follows:
Value of Securities on Loan Non-Cash Collateral Cash Collateral
$8,879,000 $1,313,000 $8,080,000
(6) CAPITAL SHARE TRANSACTIONSAt November 30, 2017, there were an unlimited number of shares of capitalstock at no par value authorized for the Fund.
Capital share transactions for the Institutional Shares resulted frompurchases and sales by the affiliated USAA fund-of-funds as well as other
34 | USAA Emerging Markets Fund
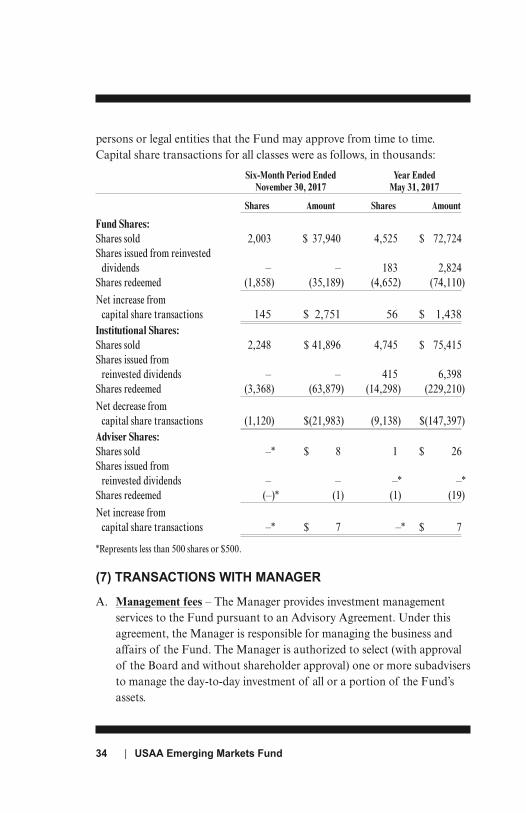
persons or legal entities that the Fund may approve from time to time.Capital share transactions for all classes were as follows, in thousands:
Six-Month Period Ended Year Ended November 30, 2017 May 31, 2017
Shares Amount Shares Amount
Fund Shares:Shares sold 2,003 $ 37,940 4,525 $ 72,724Shares issued from reinvested
dividends – – 183 2,824Shares redeemed (1,858) (35,189) (4,652) (74,110)Net increase from
capital share transactions 145 $ 2,751 56 $ 1,438Institutional Shares:Shares sold 2,248 $ 41,896 4,745 $ 75,415Shares issued from
reinvested dividends – – 415 6,398Shares redeemed (3,368) (63,879) (14,298) (229,210)Net decrease from
capital share transactions (1,120) $(21,983) (9,138) $(147,397)Adviser Shares:Shares sold –* $ 8 1 $ 26Shares issued from
reinvested dividends – – –* –*Shares redeemed (–)* (1) (1) (19)Net increase from
capital share transactions –* $ 7 –* $ 7
*Represents less than 500 shares or $500.
(7) TRANSACTIONS WITH MANAGER
A. Management fees – The Manager provides investment managementservices to the Fund pursuant to an Advisory Agreement. Under thisagreement, the Manager is responsible for managing the business andaffairs of the Fund. The Manager is authorized to select (with approvalof the Board and without shareholder approval) one or more subadvisersto manage the day-to-day investment of all or a portion of the Fund’sassets.
Notes to Financial Statements | 35
The Manager monitors each subadviser’s performance throughquantitative and qualitative analysis and periodically reports to theBoard as to whether each subadviser’s agreement should be renewed,terminated, or modified. The Manager is also responsible for determiningthe asset allocation for the subadviser(s). The allocation for eachsubadviser could range from 0% to 100% of the Fund’s assets, and theManager could change the allocations without shareholder approval.
The investment management fee for the Fund is comprised of a base feeand a performance adjustment. The Fund’s base fee is accrued daily andpaid monthly at an annualized rate of 1.00% of the Fund’s average netassets.
The performance adjustment is calculated separately for each share classon a monthly basis by comparing each class’ performance over theperformance period to that of the Lipper Emerging Markets FundsIndex.
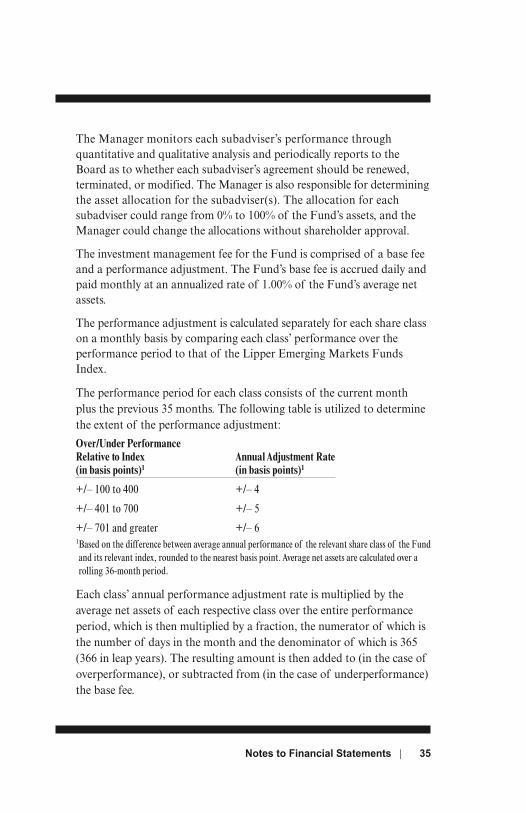
The performance period for each class consists of the current monthplus the previous 35 months. The following table is utilized to determinethe extent of the performance adjustment:Over/Under PerformanceRelative to Index Annual Adjustment Rate(in basis points)1 (in basis points)1
+/– 100 to 400 +/– 4
+/– 401 to 700 +/– 5
+/– 701 and greater +/– 61Based on the difference between average annual performance of the relevant share class of the Fundand its relevant index, rounded to the nearest basis point. Average net assets are calculated over arolling 36-month period.
Each class’ annual performance adjustment rate is multiplied by theaverage net assets of each respective class over the entire performanceperiod, which is then multiplied by a fraction, the numerator of which isthe number of days in the month and the denominator of which is 365(366 in leap years). The resulting amount is then added to (in the case ofoverperformance), or subtracted from (in the case of underperformance)the base fee.
36 | USAA Emerging Markets Fund
Under the performance fee arrangement, each class will pay a positiveperformance fee adjustment for a performance period whenever the classoutperforms the Lipper Emerging Markets Funds Index over thatperiod, even if the class had overall negative returns during theperformance period.
For the six-month period ended November 30, 2017, the Fund incurredtotal management fees, paid or payable to the Manager, of $5,058,000,which included a performance adjustment for the Fund Shares,Institutional Shares, and Adviser Shares of $(54,000), $(61,000), and$(1,000), respectively. For the Fund Shares, Institutional Shares, andAdviser Shares, the performance adjustments were (0.03)%, (0.02)%, and(0.03)%, respectively.
B. Subadvisory arrangement(s) – The Manager entered into InvestmentSubadvisory Agreements with Brandes Investment Partners, L.P.(Brandes), Lazard Asset Management LLC (Lazard), and VictoryCapital Management Inc. (Victory Capital), under which Brandes,Lazard, and Victory Capital each direct the investment and reinvestmentof a portion of the Fund’s assets (as allocated from time to time by theManager).
The Manager (not the Fund) pays Brandes a subadvisory fee in theannual amount of 0.75% for assets up to $300 million; 0.70% for assetsover $300 million up to $600 million; and 0.60% for assets over $600million on the portion of the Fund’s average net assets that Brandesmanages. For the six-month period ended November 30, 2017, theManager incurred subadvisory fees with respect to the Fund, paid orpayable to Brandes, of $580,000.
The Manager (not the Fund) pays Lazard a subadvisory fee in theannual amount of 0.75% for assets up to $200 million; 0.70% for assetsover $200 million up to $400 million; 0.65% for assets over $400 millionup to $600 million; and 0.60% for assets over $600 million on the portionof the Fund’s average net assets that Lazard manages. For the six-monthperiod ended November 30, 2017, the Manager incurred subadvisoryfees with respect to the Fund, paid or payable to Lazard, of $2,449,000.
Notes to Financial Statements | 37
The Manager (not the Fund) pays Victory Capital a subadvisory fee inthe annual amount of 0.85% for assets up to $50 million; 0.75% forassets over $50 million up to $150 million; and 0.70% for assets over$150 million on the portion of the Fund’s average net assets that VictoryCapital manages. For the six-month period ended November 30, 2017,the Manager incurred subadvisory fees with respect to the Fund, paid orpayable to Victory Capital, of $638,000.
C. Administration and servicing fees – The Manager provides certainadministration and servicing functions for the Fund. For such services,the Manager receives a fee accrued daily and paid monthly at anannualized rate of 0.15% of average net assets of the Fund Shares andAdviser Shares, and 0.10% of average net assets of the InstitutionalShares. For the six-month period ended November 30, 2017, the FundShares, Institutional Shares, and Adviser Shares incurred administrationand servicing fees, paid or payable to the Manager, of $303,000,$312,000, and $4,000, respectively.
In addition to the services provided under its Administration andServicing Agreement with the Fund, the Manager also provides certaincompliance and legal services for the benefit of the Fund. The Board hasapproved the reimbursement of a portion of these expenses incurred bythe Manager. For the six-month period ended November 30, 2017, theFund reimbursed the Manager $12,000 for these compliance and legalservices. These expenses are included in the professional fees on theFund’s Statement of Operations.
D. Expense limitation – The Manager agreed, through September 30, 2018,to limit the total annual operating expenses of the Adviser Shares to1.75% of its average net assets, excluding extraordinary expenses andbefore reductions of any expenses paid indirectly, and to reimburse theAdviser Shares for all expenses in excess of that amount. This expenselimitation arrangement may not be changed or terminated throughSeptember 30, 2018, without approval of the Board, and may be changedor terminated by the Manager at any time after that date. Prior toOctober 1, 2017, the Adviser Shares’ expense limitation was 1.65% of itsaverage net assets. For the six-month period ended November 30, 2017,
38 | USAA Emerging Markets Fund
the Adviser Shares incurred reimbursable expenses of $7,000, of whichless than $500 was receivable from manager.
E. Transfer agent’s fees – USAA Transfer Agency Company, d/b/a USAAShareholder Account Services (SAS), an affiliate of the Manager, providestransfer agent services to the Fund Shares and Adviser Shares based on anannual charge of $23 per shareholder account plus out-of-pocket expenses.SAS pays a portion of these fees to certain intermediaries for theadministration and servicing of accounts that are held with suchintermediaries. Transfer agent’s fees for Institutional Shares are paidmonthly based on a fee accrued daily at an annualized rate of 0.10% ofthe Institutional Shares’ average net assets, plus out-of-pocket expenses. Forthe six-month period ended November 30, 2017, the Fund Shares,Institutional Shares, and Adviser Shares incurred transfer agent’s fees, paidor payable to SAS, of $477,000, $312,000, and less than $500, respectively.
F. Distribution and service (12b-1) fees – The Fund has adopted a planpursuant to Rule 12b-1 under the 1940 Act with respect to the AdviserShares. Under the plan, the Adviser Shares pay fees to USAAInvestment Management Company (IMCO), the distributor, fordistribution and shareholder services. IMCO pays all or a portion ofsuch fees to intermediaries that make the Adviser Shares available forinvestment by their customers. The fee is accrued daily and paid monthlyat an annual rate of 0.25% of the Adviser Shares’ average net assets.Adviser Shares are offered and sold without imposition of an initial salescharge or a contingent deferred sales charge. For the six-month periodended November 30, 2017, the Adviser Shares incurred distribution andservice (12b-1) fees of $7,000.
G. Underwriting services – IMCO provides exclusive underwriting anddistribution of the Fund’s shares on a continuing best-efforts basis andreceives no fee or other compensation for these services, but may receive12b-1 fees as described above, with respect to Adviser Shares.
(8) TRANSACTIONS WITH AFFILIATESThe Fund offers its Institutional Shares for investment by other USAAFunds and is one of 19 USAA mutual funds in which the affiliated USAA
Notes to Financial Statements | 39
fund-of-funds invest. The USAA fund-of-funds do not invest in theunderlying funds for the purpose of exercising management or control. As ofNovember 30, 2017, the USAA fund-of-funds owned the followingpercentages of the total outstanding shares of the Fund:
Affiliated USAA Fund Ownership %Cornerstone Conservative 0.3Cornerstone Equity 1.5Target Retirement Income 0.6Target Retirement 2020 0.7Target Retirement 2030 1.2Target Retirement 2040 2.0Target Retirement 2050 1.3Target Retirement 2060 0.1
The Manager is indirectly wholly owned by United Services AutomobileAssociation (USAA), a large, diversified financial services institution. AtNovember 30, 2017, USAA and its affiliates owned 271,000 Adviser Shares,which represents 97.7% of the Adviser Shares outstanding and 0.5% of theFund’s total outstanding shares.
Certain trustees and officers of the Fund are also directors, officers, and/oremployees of the Manager. None of the affiliated trustees or Fund officersreceived any compensation from the Fund.
(9) UPCOMING REGULATORY MATTERSIn October 2016, the U.S. Securities and Exchange Commission (SEC)issued Final Rule Release No. 33-10231, Investment Company ReportingModernization. In part, the rules require the filing of new forms N-PORTand N-CEN, and amend Regulation S-X to require standardized, enhanceddisclosure about derivatives in investment company financial statements, aswell as other amendments.
In October 2016, the SEC issued Final Rule Release No. 33-10233,Investment Company Liquidity Risk Management Programs. This rulerequires funds to establish a liquidity risk management program andenhances disclosures regarding funds’ liquidity.
In October 2016, the SEC issued Final Rule Release No. 33-10234,Investment Company Swing Pricing. This rule permits certain funds to useswing pricing during periods of heavy redemptions and requires certaindisclosures regarding the use of swing pricing in forms filed with the SEC.
The Manager continues to evaluate the impact these rules and amendmentswill have on the financial statements and other disclosures. The compliancedate for new forms N-PORT and N-CEN is June 1, 2018 (with filing ofForm N-PORT beginning April 30, 2019), with other staggered compliancedates extending through April 30, 2019. The Fund is expected to complywith the June 1, 2018 compliance date for new forms N-PORT and N-CEN.
40 | USAA Emerging Markets Fund
Notes to Financial Statements | 41
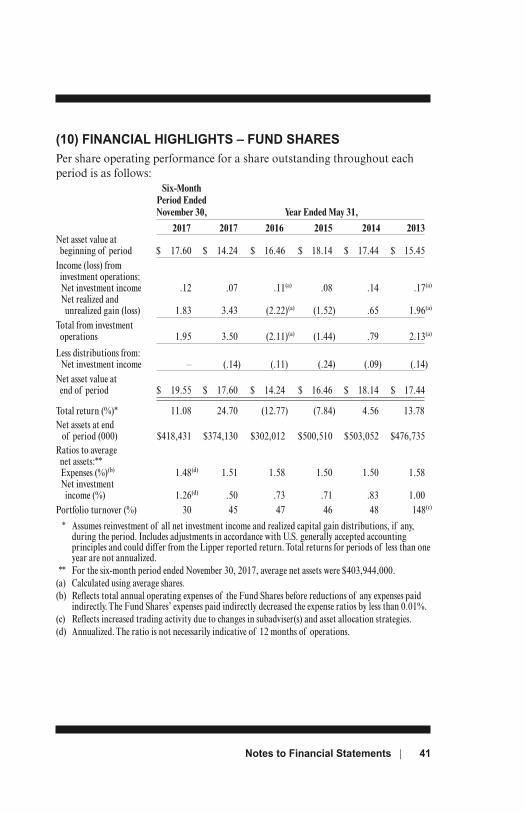
(10) FINANCIAL HIGHLIGHTS – FUND SHARESPer share operating performance for a share outstanding throughout eachperiod is as follows: Six-Month Period Ended November 30, Year Ended May 31,
2017 2017 2016 2015 2014 2013Net asset value at
beginning of period $ 17.60 $ 14.24 $ 16.46 $ 18.14 $ 17.44 $ 15.45 Income (loss) from
investment operations:Net investment income .12 .07 .11(a) .08 .14 .17(a)
Net realized and unrealized gain (loss) 1.83 3.43 (2.22)(a) (1.52) .65 1.96(a)
Total from investment
operations 1.95 3.50 (2.11)(a) (1.44) .79 2.13(a)
Less distributions from:Net investment income – (.14) (.11) (.24) (.09) (.14)
Net asset value at end of period $ 19.55 $ 17.60 $ 14.24 $ 16.46 $ 18.14 $ 17.44
Total return (%)* 11.08 24.70 (12.77) (7.84) 4.56 13.78Net assets at end
of period (000) $418,431 $374,130 $302,012 $500,510 $503,052 $476,735Ratios to average
net assets:**Expenses (%)(b) 1.48(d) 1.51 1.58 1.50 1.50 1.58Net investment
income (%) 1.26(d) .50 .73 .71 .83 1.00Portfolio turnover (%) 30 45 47 46 48 148(c)
* Assumes reinvestment of all net investment income and realized capital gain distributions, if any,during the period. Includes adjustments in accordance with U.S. generally accepted accountingprinciples and could differ from the Lipper reported return. Total returns for periods of less than oneyear are not annualized.
** For the six-month period ended November 30, 2017, average net assets were $403,944,000.(a) Calculated using average shares.(b) Reflects total annual operating expenses of the Fund Shares before reductions of any expenses paid
indirectly. The Fund Shares’ expenses paid indirectly decreased the expense ratios by less than 0.01%.(c) Reflects increased trading activity due to changes in subadviser(s) and asset allocation strategies.(d) Annualized. The ratio is not necessarily indicative of 12 months of operations.
42 | USAA Emerging Markets Fund
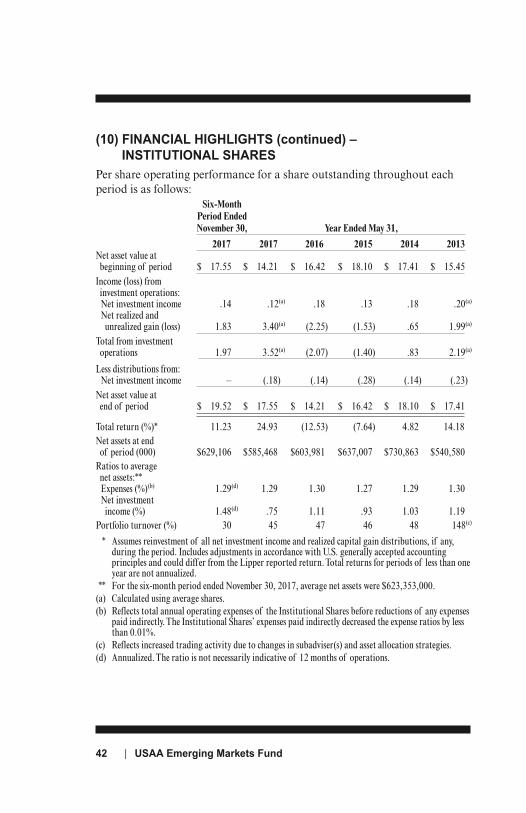
(10) FINANCIAL HIGHLIGHTS (continued) –INSTITUTIONAL SHARES
Per share operating performance for a share outstanding throughout eachperiod is as follows: Six-Month Period Ended November 30, Year Ended May 31,
2017 2017 2016 2015 2014 2013Net asset value at
beginning of period $ 17.55 $ 14.21 $ 16.42 $ 18.10 $ 17.41 $ 15.45 Income (loss) from
investment operations:Net investment income .14 .12(a) .18 .13 .18 .20(a)
Net realized and unrealized gain (loss) 1.83 3.40(a) (2.25) (1.53) .65 1.99(a)
Total from investment
operations 1.97 3.52(a) (2.07) (1.40) .83 2.19(a)
Less distributions from:Net investment income – (.18) (.14) (.28) (.14) (.23)
Net asset value at end of period $ 19.52 $ 17.55 $ 14.21 $ 16.42 $ 18.10 $ 17.41
Total return (%)* 11.23 24.93 (12.53) (7.64) 4.82 14.18Net assets at end
of period (000) $629,106 $585,468 $603,981 $637,007 $730,863 $540,580Ratios to average
net assets:**Expenses (%)(b) 1.29(d) 1.29 1.30 1.27 1.29 1.30Net investment
income (%) 1.48(d) .75 1.11 .93 1.03 1.19Portfolio turnover (%) 30 45 47 46 48 148(c)
* Assumes reinvestment of all net investment income and realized capital gain distributions, if any,during the period. Includes adjustments in accordance with U.S. generally accepted accountingprinciples and could differ from the Lipper reported return. Total returns for periods of less than oneyear are not annualized.
** For the six-month period ended November 30, 2017, average net assets were $623,353,000.(a) Calculated using average shares.(b) Reflects total annual operating expenses of the Institutional Shares before reductions of any expenses
paid indirectly. The Institutional Shares’ expenses paid indirectly decreased the expense ratios by lessthan 0.01%.
(c) Reflects increased trading activity due to changes in subadviser(s) and asset allocation strategies.(d) Annualized. The ratio is not necessarily indicative of 12 months of operations.
Notes to Financial Statements | 43
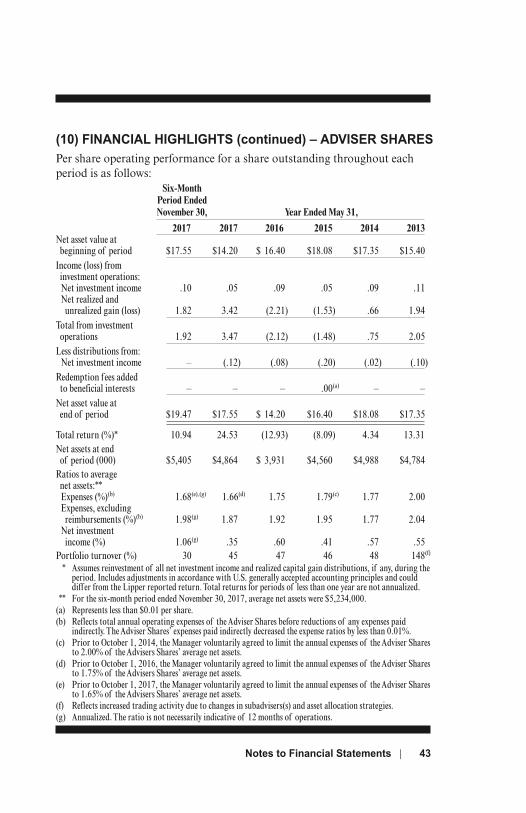
(10) FINANCIAL HIGHLIGHTS (continued) – ADVISER SHARESPer share operating performance for a share outstanding throughout eachperiod is as follows: Six-Month Period Ended November 30, Year Ended May 31,
2017 2017 2016 2015 2014 2013Net asset value at
beginning of period $17.55 $14.20 $ 16.40 $18.08 $17.35 $15.40 Income (loss) from
investment operations:Net investment income .10 .05 .09 .05 .09 .11Net realized and
unrealized gain (loss) 1.82 3.42 (2.21) (1.53) .66 1.94 Total from investment
operations 1.92 3.47 (2.12) (1.48) .75 2.05 Less distributions from:
Net investment income – (.12) (.08) (.20) (.02) (.10) Redemption fees added
to beneficial interests – – – .00(a) – – Net asset value at
end of period $19.47 $17.55 $ 14.20 $16.40 $18.08 $17.35 Total return (%)* 10.94 24.53 (12.93) (8.09) 4.34 13.31Net assets at end
of period (000) $5,405 $4,864 $ 3,931 $4,560 $4,988 $4,784Ratios to average
net assets:**Expenses (%)(b) 1.68(e),(g) 1.66(d) 1.75 1.79(c) 1.77 2.00Expenses, excluding
reimbursements (%)(b) 1.98(g) 1.87 1.92 1.95 1.77 2.04Net investment
income (%) 1.06(g) .35 .60 .41 .57 .55Portfolio turnover (%) 30 45 47 46 48 148(f)
* Assumes reinvestment of all net investment income and realized capital gain distributions, if any, during theperiod. Includes adjustments in accordance with U.S. generally accepted accounting principles and coulddiffer from the Lipper reported return. Total returns for periods of less than one year are not annualized.
** For the six-month period ended November 30, 2017, average net assets were $5,234,000.(a) Represents less than $0.01 per share.(b) Reflects total annual operating expenses of the Adviser Shares before reductions of any expenses paid
indirectly. The Adviser Shares’ expenses paid indirectly decreased the expense ratios by less than 0.01%.(c) Prior to October 1, 2014, the Manager voluntarily agreed to limit the annual expenses of the Adviser Shares
to 2.00% of the Advisers Shares’ average net assets.(d) Prior to October 1, 2016, the Manager voluntarily agreed to limit the annual expenses of the Adviser Shares
to 1.75% of the Advisers Shares’ average net assets.(e) Prior to October 1, 2017, the Manager voluntarily agreed to limit the annual expenses of the Adviser Shares
to 1.65% of the Advisers Shares’ average net assets.(f) Reflects increased trading activity due to changes in subadvisers(s) and asset allocation strategies.(g) Annualized. The ratio is not necessarily indicative of 12 months of operations.
44 | USAA Emerging Markets Fund
EXPENSE EXAMPLENovember 30, 2017 (unaudited)
EXAMPLEAs a shareholder of the Fund, you incur two types of costs: direct costs, such aswire fees, redemption fees, and low balance fees; and indirect costs, includingmanagement fees, transfer agency fees, distribution and service (12b-1) fees, andother Fund operating expenses. This example is intended to help you understandyour indirect costs, also referred to as “ongoing costs” (in dollars), of investing inthe Fund and to compare these costs with the ongoing costs of investing in othermutual funds.
The example is based on an investment of $1,000 invested at the beginningof the period and held for the entire six-month period of June 1, 2017,through November 30, 2017.
ACTUAL EXPENSESThe line labeled “actual” under each share class in the table providesinformation about actual account values and actual expenses. You may use theinformation in this line, together with the amount you invested at the beginningof the period, to estimate the expenses that you paid over the period. Simplydivide your account value by $1,000 (for example, an $8,600 account valuedivided by $1,000 = 8.6), then multiply the result by the number for your shareclass in the “actual” line under the heading “Expenses Paid During Period” toestimate the expenses you paid on your account during this period.
HYPOTHETICAL EXAMPLE FOR COMPARISON PURPOSESThe line labeled “hypothetical” under each share class in the table providesinformation about hypothetical account values and hypothetical expensesbased on the Fund’s actual expense ratios for each class and an assumed rateof return of 5% per year before expenses, which is not the Fund’s actual return.The hypothetical account values and expenses may not be used to estimate theactual ending account balance or expenses you paid for the period. You may
Expense Example | 45
use this information to compare the ongoing costs of investing in the Fundand other funds. To do so, compare this 5% hypothetical example with the 5%hypothetical examples that appear in the shareholder reports of other funds.
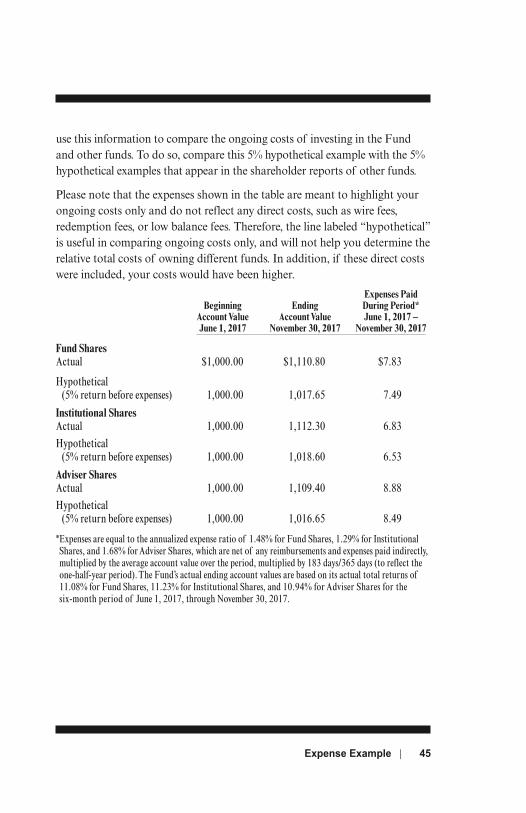
Please note that the expenses shown in the table are meant to highlight yourongoing costs only and do not reflect any direct costs, such as wire fees,redemption fees, or low balance fees. Therefore, the line labeled “hypothetical”is useful in comparing ongoing costs only, and will not help you determine therelative total costs of owning different funds. In addition, if these direct costswere included, your costs would have been higher. Expenses Paid Beginning Ending During Period* Account Value Account Value June 1, 2017 – June 1, 2017 November 30, 2017 November 30, 2017
Fund Shares Actual $1,000.00 $1,110.80 $7.83
Hypothetical (5% return before expenses) 1,000.00 1,017.65 7.49
Institutional Shares Actual 1,000.00 1,112.30 6.83Hypothetical
(5% return before expenses) 1,000.00 1,018.60 6.53
Adviser Shares Actual 1,000.00 1,109.40 8.88Hypothetical
(5% return before expenses) 1,000.00 1,016.65 8.49
*Expenses are equal to the annualized expense ratio of 1.48% for Fund Shares, 1.29% for InstitutionalShares, and 1.68% for Adviser Shares, which are net of any reimbursements and expenses paid indirectly,multiplied by the average account value over the period, multiplied by 183 days/365 days (to reflect theone-half-year period). The Fund’s actual ending account values are based on its actual total returns of11.08% for Fund Shares, 11.23% for Institutional Shares, and 10.94% for Adviser Shares for thesix-month period of June 1, 2017, through November 30, 2017.
Trustees Daniel S. McNamaraRobert L. Mason, Ph.D.Jefferson C. BoyceDawn M. HawleyPaul L. McNamaraRichard Y. Newton IIIBarbara B. Ostdiek, Ph.D. Michael F. Reimherr
Administrator and USAA Asset Management CompanyInvestment Adviser P.O. Box 659453
San Antonio, Texas 78265-9825
Underwriter and USAA Investment Management CompanyDistributor P.O. Box 659453
San Antonio, Texas 78265-9825
Transfer Agent USAA Shareholder Account Services9800 Fredericksburg RoadSan Antonio, Texas 78288
Custodian and State Street Bank and Trust CompanyAccounting Agent P.O. Box 1713
Boston, Massachusetts 02105
Independent Ernst & Young LLPRegistered Public 100 West Houston St., Suite 1700Accounting Firm San Antonio, Texas 78205
Mutual Fund Under “My Accounts” onSelf-Service 24/7 usaa.com select your mutual fundat usaa.com account and either click the link orOr call select ‘I want to...’ and select(800) 531-USAA (8722) the desired action.(210) 531-8722
Copies of the Manager’s proxy voting policies and procedures, approved by the Trust’s Board ofTrustees for use in voting proxies on behalf of the Fund, are available without charge (i) by calling(800) 531-USAA (8722) or (210) 531-8722; (ii) at usaa.com; and (iii) in summary within theStatement of Additional Information on the SEC’s website at http://www.sec.gov. Informationregarding how the Fund voted proxies relating to portfolio securities during the most recent 12-monthperiod ended June 30 is available without charge (i) at usaa.com; and (ii) on the SEC’s website athttp://www.sec.gov.
The Fund files its complete schedule of portfolio holdings with the SEC for the first and thirdquarters of each fiscal year on Form N-Q. These Forms N-Q are available at no charge (i) by calling(800) 531-USAA (8722) or (210) 531-8722; (ii) at usaa.com; and (iii) on the SEC’s website athttp://www.sec.gov. These Forms N-Q also may be reviewed and copied at the SEC’s PublicRef erence Room in Washington, D.C. Information on the operation of the Public Ref erence Roommay be obtained by calling (800) 732-0330.
25559-0118 ©2018, USAA. All rights reserved.