Embed Size (px)
Citation preview

1
SEMIANNUAL FINANCIAL REPORT OF THE DIASORIN GROUP AT JUNE 30, 2015
DiaSorin S.p.A. Via Crescentino (no building No.) - 13040 Saluggia (VC) Tax I. D. and Vercelli Company Register n. 13144290155

2
CONTENTS BOARD OF DIRECTORS, BOARD OF STATUTORY AUDITORS AND INDEPENDENT AUDITORS ....... 3
THE GROUP ................................................................................................................................................................. 4
CONSOLIDATED FINANCIAL HIGHLIGHTS .................................................................................................... 10
INTERIM REPORT ON OPERATIONS ................................................................................................................. 11
REVIEW OF THE GROUP’S OPERATING PERFORMANCE AND FINANCIAL POSITION ..................... 13 OPERATING PERFORMANCE IN THE SECOND QUARTER OF 2015 ............................................................ 13 OPERATING PERFORMANCE IN THE FIRST HALF OF 2015.......................................................................... 22 STATEMENT OF FINANCIAL POSITION OF THE GROUP AT JUNE 30, 2015 .............................................. 30 ANALYSIS OF CONSOLIDATED CASH FLOWS ............................................................................................... 32 OTHER INFORMATION ........................................................................................................................................ 33
TRANSACTIONS WITH RELATED PARTIES ..................................................................................................... 34
SIGNIFICANT EVENTS OCCURRING AFTER JUNE 30, 2015 AND BUSINESS OUTLOOK ...................... 35
CONDENSED SEMIANNUAL CONSOLIDATED FINANCIAL STATEMENTS AT JUNE 30, 2015 ............ 36 CONSOLIDATED INCOME STATEMENT........................................................................................................... 37 COMPREHENSIVE INCOME STATEMENT ........................................................................................................ 38 CONSOLIDATED STATEMENT OF FINANCIAL POSITION ............................................................................ 39 CONSOLIDATED STATEMENT OF CASH FLOWS ........................................................................................... 41 STATEMENT OF CHANGES IN CONSOLIDATED SHAREHOLDERS’ EQUITY ........................................... 42 NOTES TO THE CONDENSED SEMIANNUAL CONSOLIDATED FINANCIAL STATEMENT AT JUNE 30, 2015 ........................................................................................................................................................................... 43
ANNEX I: THE COMPANIES OF THE DIASORIN GROUP AT JUNE 30, 2015 ............................................. 66
CERTIFICATION OF THE CONDENSED SEMIANNUAL CONSOLIDATED FINANCIAL STATEMENTS
PURSUANT TO ARTICLE 81-TER OF CONSOB REGULATION NO. 11971 OF MAY 14, 1999, AS
AMENDED................................................................................................................................................................... 68
3
BOARD OF DIRECTORS, BOARD OF STATUTORY AUDITORS AND INDEPENDENT AUDITORS B o a r d o f D i r e c t o r s (elected on April 22, 2013) Chairman Gustavo Denegri Deputy Chairman Michele Denegri Chief Executive Officer Carlo Rosa (1) Directors Antonio Boniolo Chen Menachem Even Enrico Mario Amo Giuseppe Alessandria (2) (3) Franco Moscetti (2) Maria Paola Landini (2) Roberta Somati (2) Eva Desana Stefano Altara (4) Ezio Garibaldi B o a r d o f S t a t u t o r y A u d i t o r s Chairman Roberto Bracchetti Statutory Auditors Andrea Caretti Ottavia Alfano Alternates Bruno Marchina Maria Carla Bottini I n d e p e n d e n t A u d i t o r s Deloitte & Touche S.p.A.
COMMITTEES Control and Risks Committee Franco Moscetti (Chairman) Enrico Mario Amo Roberta Somati Compensation Committee Giuseppe Alessandria (Chairman) Roberta Somati Michele Denegri
Nominating Committee Franco Moscetti (Chairman) Giuseppe Alessandria Michele Denegri Related-party Committee Franco Moscetti (Coordinator) Giuseppe Alessandria Roberta Somati
(1) General Manager (2) Independent Director (3) Lead Independent Director (4) Director Stefano Altara was appointed by the Shareholders’ Meeting on April 23, 2014.
4
THE GROUP DiaSorin is an Italian multinational Group and a global leader in the market for in vitro diagnostics. DiaSorin is listed on the MTA (automated stock market) in the FTSE Italia Mid Cap Index, organized and managed by Borsa Italiana S.p.A.
For over 40 years the Group has been developing, producing and commercializing diagnostic tests for a wide range of clinical areas.
DiaSorin tests are designed for hospital and private testing laboratories in the market of immunodiagnostics and molecular diagnostics.
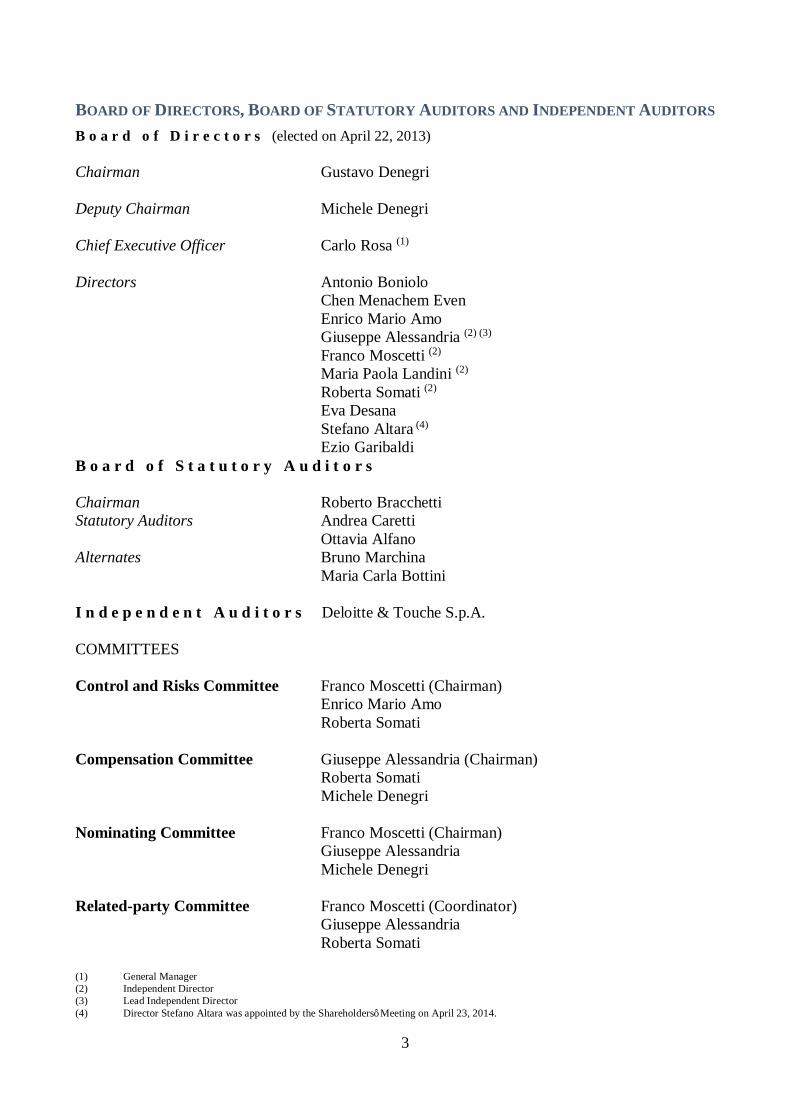
IMMUNODIAGNOSTICS In this segment, DiaSorin develops, produces and markets immunoreagent kits based on 3 different detection techniques.
Chemiluminescence / CLIA Colorimetry / ELISA Radioimmunometry / RIA
DEVELOPMENT: early 1990s DEVELOPMENT: 1980s DEVELOPMENT: 1960s
SIGNAL: generated by markers marked with chemiluminescent molecules.
SIGNAL: generated by colorimetric markers.
SIGNAL: generated by radioactive markers.
TECHNOLOGY: It can be adapted to products and
instruments with features offering a high level of usage flexibility in terms of menus and the performance speed of the test. It is used to develop products in
proprietary formats in the area of closed systems (cartridges capable of working only on the system developed by the particular company).
TECHNOLOGY: It can perform diagnostic tests with
the use of minimally sophisticated instrumentation; It can automate some of the manual
operations performed by laboratory staff.
TECHNOLOGY: It is employed for some products
capable of providing results that cannot be delivered by other technologies; It is used for tests that have to be carried
out manually by experienced technicians.
PROCESSING TIMES: 30-45 minutes
PROCESSING TIMES: 3-4 hours PROCESSING TIMES: >4 hours
DiaSorin supplies its customers with instruments that make it possible to carry out the diagnostic investigation automatically through the use of reagents.
CLIA ELISA

5
DiaSorin produces reagents that are biological components whose purpose is detecting the presence of specific elements (virus, hormones, etc.) in patient’s blood sample. These reagents are high-tech diagnostic products with a high level of specificity that can detect the presence, also in small quantity, of the element to be searched in the patient’s sample.
Through its constant commitment aimed at enriching its offering, DiaSorin exceeded the target of 114 immunodiagnostic products available on CLIA technology, out of which 31 specialty tests, dedicated to the most clinical areas tested in laboratory.
This result enabled DiaSorin to become the Company with the broadest test menu on CLIA technology worldwide, confirming its vocation as the Diagnostics Specialist.
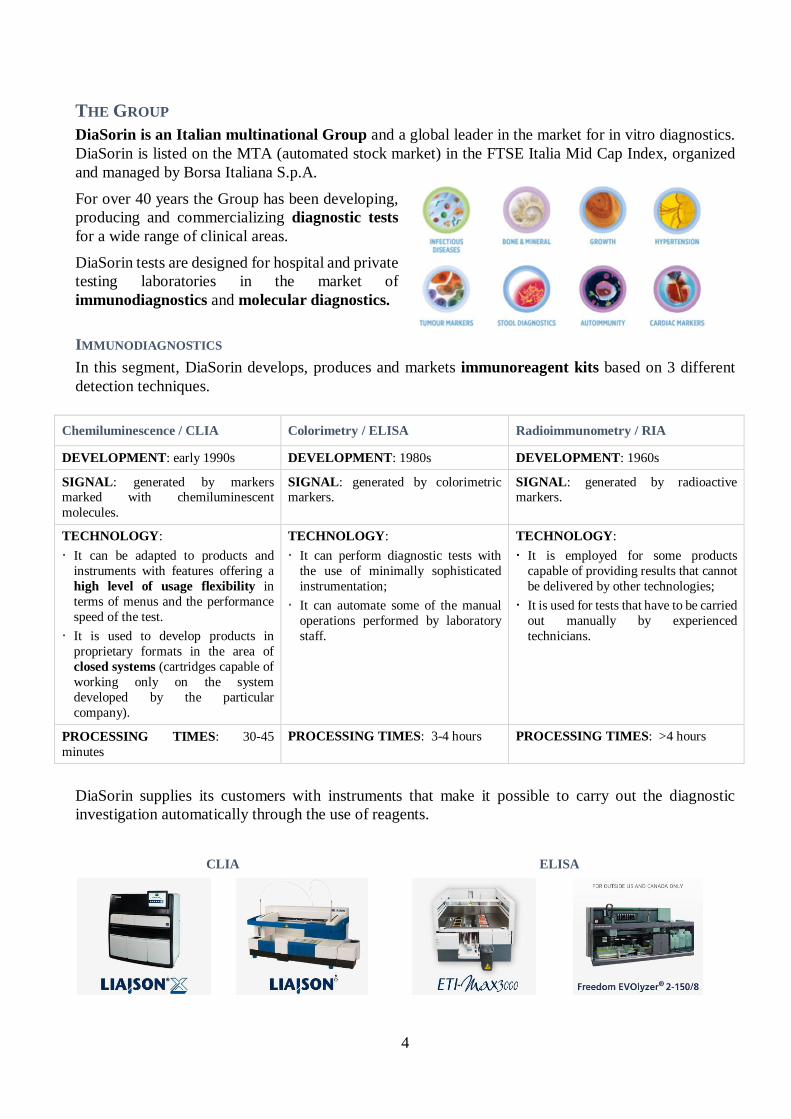
MOLECULAR DIAGNOSTICS DiaSorin considers molecular diagnostics a strategic technological project for its own business and invests in Research and Development in this area to develop high-reliable and excellent products. In this segment DiaSorin provides end laboratory with an automated solution to implement the three phases required to deliver the final diagnostic result.
DiaSorin supplies its customers with instruments for nucleic acid extraction from different biological samples (LIAISON IXT and BULLET Pro) and to diagnose and monitor Onco-Haematology parameters and several infectious diseases (LIAISON IAM) through the use of its reagents.
6
EXTRACTION AMPLIFICATION AND
DIAGNOSTIC PROCESS
Bullet Pro®
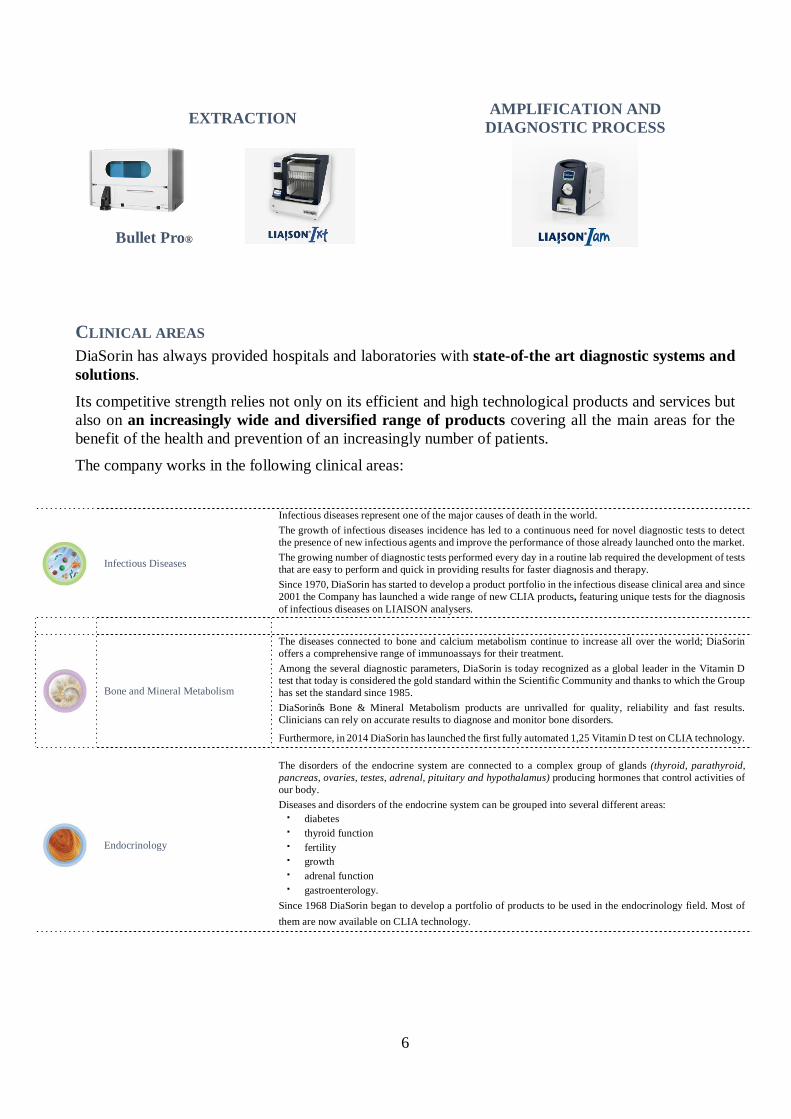
CLINICAL AREAS DiaSorin has always provided hospitals and laboratories with state-of-the art diagnostic systems and solutions.
Its competitive strength relies not only on its efficient and high technological products and services but also on an increasingly wide and diversified range of products covering all the main areas for the benefit of the health and prevention of an increasingly number of patients.
The company works in the following clinical areas:
Infectious Diseases
Infectious diseases represent one of the major causes of death in the world. The growth of infectious diseases incidence has led to a continuous need for novel diagnostic tests to detect the presence of new infectious agents and improve the performance of those already launched onto the market. The growing number of diagnostic tests performed every day in a routine lab required the development of tests that are easy to perform and quick in providing results for faster diagnosis and therapy. Since 1970, DiaSorin has started to develop a product portfolio in the infectious disease clinical area and since 2001 the Company has launched a wide range of new CLIA products, featuring unique tests for the diagnosis of infectious diseases on LIAISON analysers.
Bone and Mineral Metabolism
The diseases connected to bone and calcium metabolism continue to increase all over the world; DiaSorin offers a comprehensive range of immunoassays for their treatment. Among the several diagnostic parameters, DiaSorin is today recognized as a global leader in the Vitamin D test that today is considered the gold standard within the Scientific Community and thanks to which the Group has set the standard since 1985. DiaSorin’s Bone & Mineral Metabolism products are unrivalled for quality, reliability and fast results. Clinicians can rely on accurate results to diagnose and monitor bone disorders.
Furthermore, in 2014 DiaSorin has launched the first fully automated 1,25 Vitamin D test on CLIA technology.
Endocrinology
The disorders of the endocrine system are connected to a complex group of glands (thyroid, parathyroid, pancreas, ovaries, testes, adrenal, pituitary and hypothalamus) producing hormones that control activities of our body. Diseases and disorders of the endocrine system can be grouped into several different areas: diabetes thyroid function fertility growth adrenal function gastroenterology.
Since 1968 DiaSorin began to develop a portfolio of products to be used in the endocrinology field. Most of them are now available on CLIA technology.

7
Hypertension
According to WHO and to the American Heart Association, Hypertension is one of the major risk factors for cardiovascular diseases. Today 1 billion people worldwide have high blood pressure and this number is expected to increase to 1.56 billion people by the year 2025, equal to 25% of the adult population. Hypertension is prevalent in developing as well as in developed countries. DiaSorin offers a unique fully automated panel for the diagnosis of a form of hypertension (Primary Aldosteronism), through two key tests (Aldosterone and Renin) on CLIA technology.
Oncology
Every year about 10 million people are diagnosed with cancer resulting in over 6 million deaths. Cancer is considered the second most common cause of death in industrialized countries. Tumour markers are biological substances produced by the tumour cells, generally found in very low concentrations in normal individuals. Tumour cells can be measured in blood and other body fluids. DiaSorin offers important products to be used in diagnostic monitoring of these markers for screening, diagnosis and monitoring the disease’s progression.
Gastrointestinal Infections
Gastrointestinal infections affect mainly newborns/children, or elderly populations and immunocompromised patients and can be potentially serious.
Diagnosis of gastrointestinal infections is largely performed through laboratory tests used for culture or antigen detection from stool specimens.
Today DiaSorin offers the most complete and fully automated menu for the diagnosis of the most recurrent infections (Clostridium Difficile Toxins A & B, Clostridium Difficile GDH, Helicobacter Pylori, EHEC E. Coli, Adenovirus and Rotavirus).
Lastly, DiaSorin has recently launched the first completely automated test for Calprotectin inflammatory levels.
Autoimmunity
Autoimmune diseases are one of the top 10 leading causes of death in female children and women in all age groups up to 64 years of age.
Researchers have identified 80-100 different autoimmune diseases and suspect at least 40 additional diseases of having an autoimmune basis. These diseases can be chronic and life-threatening as a hyperactive immune system attacks normal tissues as if they were foreign organisms.
DiaSorin, through its experience and commitment to research, is a leading company in this growing market, with a complete line of immunodiagnostic specialty tests (rheumatology, gastroenterology, diagnosis of thrombosis and vasculitis).
Cardiac and brain damages
Acute myocardial infarction and resulting complications are among the primary causes of mortality in the western world. Modern biochemical markers play a consolidated role in the diagnosis and even in the risk stratification of patients suffering from ischemic myocardial disease
During the last decade the analysis of Neurobiochemical markers for brain damage has attracted increasing attention in a variety of Central Nervous System disorders. These markers are expected to be useful tools for diagnosis, monitoring or prognosis of brain damaged patients.
DiaSorin outstrips its competitors in both clinical areas, thanks to a full range of products available on CLIA technology.
8
A GLOBAL PRESENCE
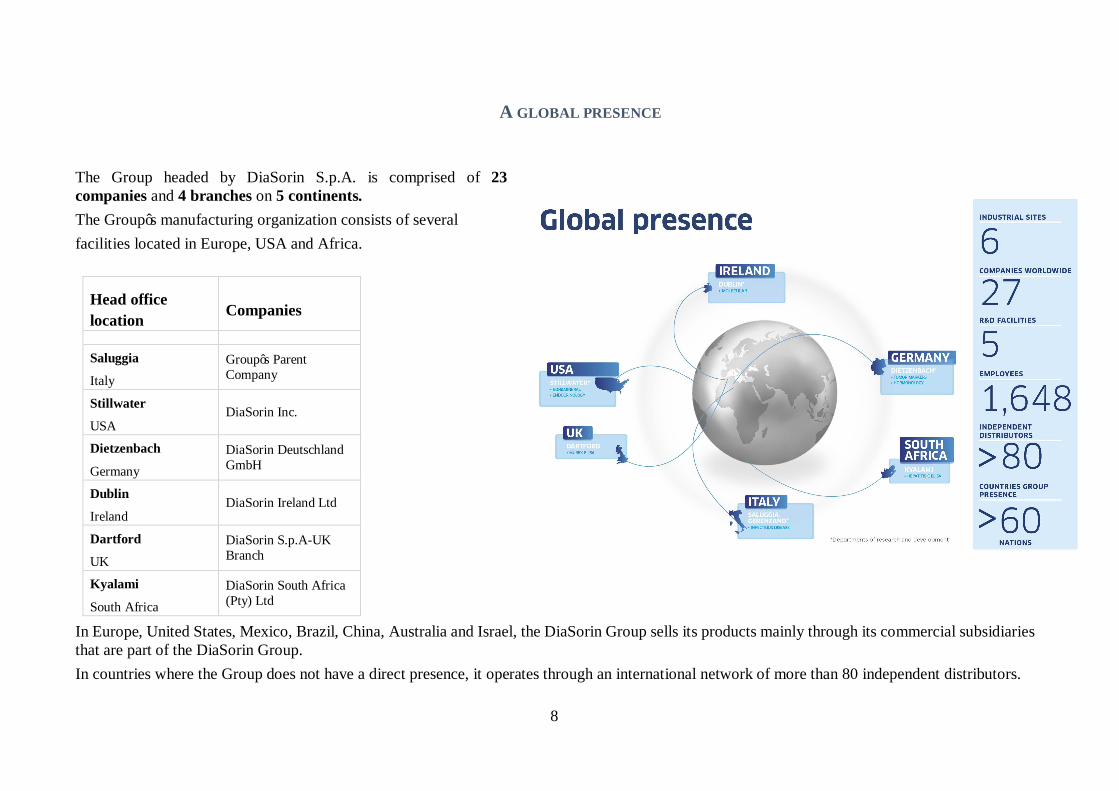
The Group headed by DiaSorin S.p.A. is comprised of 23 companies and 4 branches on 5 continents. The Group’s manufacturing organization consists of several facilities located in Europe, USA and Africa.
Head office location Companies Saluggia
Italy Group’s Parent Company
Stillwater
USA DiaSorin Inc.
Dietzenbach
Germany DiaSorin Deutschland GmbH
Dublin
Ireland DiaSorin Ireland Ltd
Dartford
UK DiaSorin S.p.A-UK Branch
Kyalami
South Africa DiaSorin South Africa (Pty) Ltd
In Europe, United States, Mexico, Brazil, China, Australia and Israel, the DiaSorin Group sells its products mainly through its commercial subsidiaries that are part of the DiaSorin Group. In countries where the Group does not have a direct presence, it operates through an international network of more than 80 independent distributors.

9
STRUCTURE OF THE DIASORIN GROUP AT JUNE 30, 2015

10
CONSOLIDATED FINANCIAL HIGHLIGHTS
Income statement (in thousands of euros)
2nd quarter 2015 *
2nd quarter 2014 * 1st half 2015 1st half 2014
Net revenues 127,500 110,856 245,144 216,771 Gross profit 87,263 74,157 166,334 145,911 EBITDA (1) 48,317 39,490 91,398 78,077 Operating result (EBIT) 40,041 32,040 75,077 63,388 Net profit for the period 26,208 20,271 48,821 39,973 Statement of financial position (in thousands of euros) 6/30/2015 12/31/2014
Capital invested in non-current assets 218,183 214,741 Net invested capital 335,443 317,231 Net financial position 195,971 166,342 Shareholders’ equity 531,414 483,573 Statement of cash flows (in thousands of euros)
2nd quarter 2015 *
2nd quarter 2014 * 1st half 2015 1st half 2014
Net cash flow for the period** (54,421) (21,732) (3,229) (16,393) Free cash flow (2) 12,652 11,557 39,314 39,100 Capital expenditures 8,883 6,704 16,880 15,141 Number of employees 1,648 1,628
* Unaudited data. ** Including investments amounting to 30 million euros in bank term deposit opened in the period. (1) Looking at the data on the Table, the Board of Directors defines EBITDA as the “operating result (EBIT)” before amortization of intangibles and depreciation of property, plant and equipment. (2) Free cash flow is the cash flow from operating activities, counting utilizations for capital expenditures but before interest payments and acquisitions of companies and business operations.
11
INTERIM REPORT ON OPERATIONS Foreword These condensed Semiannual Financial Statements were prepared in accordance with international accounting principles (International Accounting Standards – IAS and International Financial Reporting Standards – IFRS) and the corresponding interpretations (Standing Interpretations Committee – SIC and International Financial Reporting Interpretations Committee – IFRIC) published by the International Accounting Standards Boards (IASB). More specifically, it is being presented in condensed form, in accordance with the international accounting principle that governs interim financial reporting (IAS 34), as adopted by the European Union, and complies with the requirements of Article 154-ter, Sections 2 and 3, of Legislative Decree No. 58 of February 24, 1998. The accounting principles applied to prepare this consolidated semiannual report are consistent with those used for the annual consolidated financial statements at December 31, 2014, except as otherwise stated in the Notes to the Semiannual Consolidated Financial Statements – paragraph new accounting principles. Key events in the first half of 2015 In the first six months of 2015, DiaSorin launched 5 new tests on LIAISON XL, outside the United States:
• Calprotectin: the first test for the identification of inflammatory bowel disease on stool samples (test belonging to the Stool testing panel);
• Bordetella pertussis IgA and IgG: 2 tests representing the first fully automated solution on the market, which allows a fast and correct diagnosis of the Bordetella pertussis infection;
• BRAHMS PCT II GEN: test developed in agreement with BRAHMS GmbH for the diagnosis of sepsis (or septicaemia) through the quantitative determination of Procalcitonin (PTC);
• Campylobacter: test completing the CLIA panel of bacterial gastrointestinal infections in stool samples (test belonging to the Stool testing panel).
In the first six months of 2015, DiaSorin entered into a new commercial agreement for sales of Vitamin D test on LIAISON XL with Quest Diagnostics, one of the leading diagnostic laboratories of the United States, succeeding in stabilising the Vitamin D business in the U.S.
On May 12, the Group presented its new 2015-2017 industrial plan to the financial community. The foreign exchange market
In the first half of 2015, the average exchange rate of the euro lost value against almost all currencies used by the Group compared with the same period in 2014. Particularly, the euro lost value against the U.S. dollar (ca. -19 percentage points), the Chinese yuan (-18 percentage points), the Australian dollar (-5 percentage points) and the South African rand (over -9 percentage points). In this context worth mentioning is the Brazilian real that depreciated by 5 percentage points vis-à vis the euro.
In the second quarter of 2015, the average exchange rate of the euro versus the U.S. dollar was down 19 percentage points. The euro depreciated also against the South African rand (over -7 percentage
12
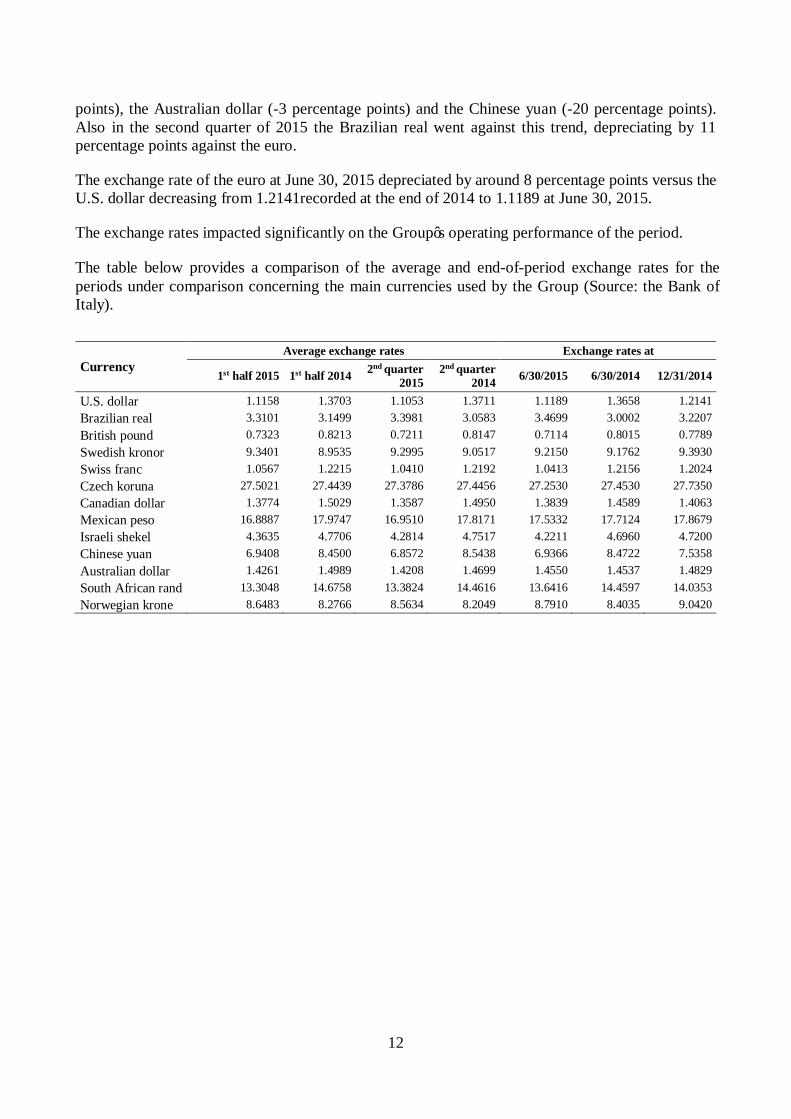
points), the Australian dollar (-3 percentage points) and the Chinese yuan (-20 percentage points). Also in the second quarter of 2015 the Brazilian real went against this trend, depreciating by 11 percentage points against the euro.
The exchange rate of the euro at June 30, 2015 depreciated by around 8 percentage points versus the U.S. dollar decreasing from 1.2141recorded at the end of 2014 to 1.1189 at June 30, 2015.
The exchange rates impacted significantly on the Group’s operating performance of the period.
The table below provides a comparison of the average and end-of-period exchange rates for the periods under comparison concerning the main currencies used by the Group (Source: the Bank of Italy).
Currency Average exchange rates Exchange rates at
1st half 2015 1st half 2014 2nd quarter 2015
2nd quarter 2014 6/30/2015 6/30/2014 12/31/2014
U.S. dollar 1.1158 1.3703 1.1053 1.3711 1.1189 1.3658 1.2141 Brazilian real 3.3101 3.1499 3.3981 3.0583 3.4699 3.0002 3.2207 British pound 0.7323 0.8213 0.7211 0.8147 0.7114 0.8015 0.7789 Swedish kronor 9.3401 8.9535 9.2995 9.0517 9.2150 9.1762 9.3930 Swiss franc 1.0567 1.2215 1.0410 1.2192 1.0413 1.2156 1.2024 Czech koruna 27.5021 27.4439 27.3786 27.4456 27.2530 27.4530 27.7350 Canadian dollar 1.3774 1.5029 1.3587 1.4950 1.3839 1.4589 1.4063 Mexican peso 16.8887 17.9747 16.9510 17.8171 17.5332 17.7124 17.8679 Israeli shekel 4.3635 4.7706 4.2814 4.7517 4.2211 4.6960 4.7200 Chinese yuan 6.9408 8.4500 6.8572 8.5438 6.9366 8.4722 7.5358 Australian dollar 1.4261 1.4989 1.4208 1.4699 1.4550 1.4537 1.4829 South African rand 13.3048 14.6758 13.3824 14.4616 13.6416 14.4597 14.0353 Norwegian krone 8.6483 8.2766 8.5634 8.2049 8.7910 8.4035 9.0420

13
REVIEW OF THE GROUP’S OPERATING PERFORMANCE AND FINANCIAL POSITION OPERATING PERFORMANCE IN THE SECOND QUARTER OF 2015
In the second quarter of 2015, the DiaSorin Group’s revenues totalled 127,500 thousand euros (110,856 thousand euros in the second quarter of 2014) up by 15% or 16,644 thousand euros (about +6% at constant exchange rate) compared with the same period of 2014. The difference between the two growth rates is due to the strong appreciation of the US dollar and the Chinese yuan vis-à-vis the euro.
Also the second quarter of 2015 reported an upward trend in CLIA sales, net of Vitamin D, with an increase of 25.5% (18.5% at constant exchange rates) driven also by the good performance of novel 1,25 Vitamin D test, Infectious Diseases and Prenatal Screening.
In line with expectations, Vitamin D sales recorded a 14.7% increase (+0.5% at constant exchange rates), after several quarter of decline, also due to the new agreement underwritten with Quest in the United States.
The abovementioned results contrasted with the physiological decline of the contribution provided by RIA and ELISA technologies, which are more dated and work on open systems.
The gross profit totalled 87,263 thousand euros, up 17.7% compared with 74,157 thousand euros in the second quarter of 2014. The ratio of gross profit to revenues was equal to 68.4% (66.9% in 2014). The increase was mainly due to higher revenues and to the different geographic and product mix of sales recorded in the quarters under comparison.
Operating expenses amounted to 45,289 thousand euros, with an increase of 4,043 thousand euros compared with the second quarter of 2014 (+9.8%) and equal to 35.5% of revenues compared with 37.2% of revenues in the second quarter of 2014. This change was negatively impacted by the exchange rates: operating expenses would be equal to approximately 42.9 million euros at constant exchange rates, up 3.9 percentage points, mainly due to higher sales and marketing expenses, costs for technical assistance (to support the growing number of the installed base) as well as general and administrative expenses.
In the second quarter of 2015, EBITDA amounted to 48,317 thousand euros (39,490 thousand euros in the second quarter of 2014), equal to 37.9% of revenues, compared with 35.6% in 2014. The increase equal to 8,827 thousand euros or 22.4%, benefits from an increasing gross profit, a lower incidence of operating costs and the abovementioned positive effect of the exchange rates.
EBIT amounted to 40,041 thousand euros (32,040 thousand euros in the second quarter of 2014), equal to 31.4% of revenues, up by 2.5 percentage points compared with the second quarter of 2014.
In the second quarter of 2015, net financial expenses totalled 375 thousand euros compared with net financial expenses of 77 thousand euros in the second quarter of 2014 mainly related to the exchange rate fluctuations.
In the second quarter of 2015, income taxes totalled 13,458 thousand euros (11,692 thousand euros in 2014). The tax rate decreased to 33.9% from 36.6% in the second quarter of 2014, mainly due to lower amount of non-deductible taxes withheld on dividends the Group’s Parent Company received

14
from foreign subsidiaries in the periods under comparison and a lower tax rate in Italy following the introduction of regulatory amendments to help economic recovery.
The net profit amounted to 26,208 thousand euros, up by 29.3% or 5,937 thousand euros compared with the second quarter of the previous year. The net profit was equal to 20.6% of revenues in the second quarter of 2015 (18.3% in the second quarter of 2014).

15
CONSOLIDATED INCOME STATEMENT
(in thousands of euros) 2nd quarter 2015 *
as a% of revenues
2nd quarter 2014 *
as a% of revenues
Sales and service revenues 127,500 100.0% 110,856 100.0%
Cost of sales (40,237) 31.6% (36,699) 33.1%
Gross profit 87,263 68.4% 74,157 66.9%
Sales and marketing expenses (24,825) 19.5% (22,305) 20.1%
Research and development costs (6,623) 5.2% (6,440) 5.8%
General and administrative expenses (13,841) 10.9% (12,501) 11.3%
Total operating expenses (45,289) 35.5% (41,246) 37.2%
Other operating income (expense) (1,933) 1.5% (871) 0.8%
non- recurring amount - - (762) 0.7%
EBIT 40,041 31.4% 32,040 28.9%
Net financial income (expense) (375) 0.3% (77) 0.1%
Profit before taxes 39,666 31.1% 31,963 28.8%
Income taxes (13,458) 10.6% (11,692) 10.5%
Net profit 26,208 20.6% 20,271 18.3%
EBITDA (1) 48,317 37.9% 39,490 35.6%
* Unaudited data. (1) The Company defines EBITDA as the “result from operations” before amortization of intangibles and depreciation of property, plant and equipment. EBITDA, which the Company uses to monitor and assess the Group’s operating performance, are not recognized as an accounting tool in the IFRSs and, consequently, should not be viewed as an alternative gauge to assess the Group’s operating performance. Because the composition of EBITDA is not governed by the reference accounting principles, the computation criterion used by the Group could be different from the criterion used by other operators and/or groups and, consequently, may not be comparable.

16
Net Revenues In the second quarter of 2015, revenues totalled 127,500 thousand euros (110,856 thousand euros in the second quarter of 2014), up by 15% compared with the same period of 2014 (+6% at constant exchange rates). The quarter was positively impacted by a positive exchange rate effect equal to 10 million euros, mainly due to the appreciation of the US dollar and the Chinese yuan vis-à-vis the euro.
Breakdown of revenues by geographic region
The table below provides a breakdown by geographic region of destination of the consolidated revenues of the DiaSorin Group in the second quarter of 2015 and in the second quarter of 2014.
(in thousands of euros) 2nd quarter 2015 2nd quarter 2014 % Change at
current exchange rates
% Change at constant exchange
rates Europe and Africa 59,661 55,850 6.8% 5.4% North America 33,467 25,180 32.9% 6.7% Asia Pacific 24,655 19,547 26.1% 11.0% Central and South America 9,717 10,279 -5.5% -2.5% Total 127,500 110,856 15.0% 6.0%

17
Europe and Africa
Europe and Africa sales region generated revenue for a year-over-year growth rate of 6.8 percentage points (+5.4% at constant exchange rates), totalling 59,661 thousand euros. In detail:
i) Growth of 4.1% in sales generated in Italy (+0.6% in the local market)* driven by the good performance of Vitamin D and the sales of CLIA reagents;
ii) Growth of 7.4% in the German subsidiary’s sales (+0,3% in the local market)* driven by the good performance of 1,25 Vitamin D and Stool testing line;
iii) Shrinking sales, equal to -5.1%, in the French market (-3.4% in the local market)* due exclusively to the negative effect deriving from the decline in Vitamin D sale following the healthcare reform (occurred in 2014) that has cut the number of tests approved for reimbursement. Net of Vitamin D, sales increased by 9.1 percentage points compared with the second quarter of 2014;
iv) growth in all the countries of the area where the Group operates, including markets served through distributors, that recorded an increase of 2.4%, despite socio-political tension in Russia that led to lower sales in this market.
North America
In the second quarter of 2015, the North America sales region reported revenues of 33,467 thousand euros, up by 6.7% compared with the same period of 2014 (in local currency). This trend is the net result of:
i) constant growth in sales of CLIA products, net of Vitamin D, with a gain of 40 percentage points, also due to the agreement signed with LabCorp concerning mainly Infectious Diseases and Prenatal Screening tests;
ii) better performance of Vitamin D sales (+4.8%) that were positively impacted by the new agreement signed with Quest laboratories.
Asia Pacific
In the second quarter of 2015, revenues of the Asia Pacific sales region amounted to 24,655 thousand euros, up 26.1% at current exchange rates (11% at constant exchange rates) compared with the second quarter of 2014. Specifically:
* Source: EDMA latest data available

18
i) growth of 36.4 percentage points in local currency recorded in the Chinese market, resulting from the performance of CLIA products and the steady success of LIAISON XL automated platform;
ii) shrinking sales in local currency (-6.7%) carried out in the Australian market, as a result of the decline in Vitamin D sales that were partly offset by the upward trend in CLIA reagents, together with the good performance of 1,25 Vitamin D and Hepatitis panel. Net of Vitamin D, sales grew by 22.7%;
iii) increase in revenues generated through distributors in markets where the Group does not have a direct presence (+4.9% at current exchange rates).
Central and South America
In the second quarter of 2015, the Latin American sales region recorded revenues of 9,717 thousand euros, down 5.5 percentage points (-2.5% at constant exchange rates) compared with 10,279 thousand euros in the same period of 2014. This is the net result of:
i) lower sales in the Brazilian market (-11.9% in local currency), due to the overall economic crisis affecting the country as well as to disruptions of some important local distributors;
ii) 2.8% decrease in local currency in the Mexican subsidiary’s sales, following lower sales of instruments and the contraction in Murex products. Worth mentioning is the upward trend in in sales of reagent (Hepatitis, Infectious Diseases and Endocrinology) that led to higher CLIA sales;
iii) sales increased by 20.2% compared with the second quarter of 2014 in the area served through distributors, despite the socio-political instability in Venezuela that hindered the development of sales in this area.
Breakdown of revenues by technology
The tables that follow show the percentage of the Group’s consolidated revenues contributed by each technology in the second quarter of 2015 and 2014.
% of revenues contributed 2nd quarter 2015 2nd quarter 2014
CLIA TESTS 74.7% 70.7%
ELISA TESTS 12.2% 14.7%
INSTRUMENTS SALES AND OTHER REVENUES 10.9% 11.6%
RIA TESTS 1.4% 2.2%
MOLECULAR DIAGNOSTICS 0.8% 0.8%
Total 100.0% 100.0%

19
In the second quarter of 2015, the percentage of total revenues provided by CLIA products increased by 4 percentage points, as a result of both sales of CLIA tests, net of Vitamin D, and Vitamin D sales. Unlike the previous quarters, Vitamin D recorded a positive trend thanks to the agreement underwritten with Quest in the U.S. and to the favourable exchange rates. Lastly, the data in the table reflect the steady physiological decline of the contribution provided by the RIA and ELISA technologies, both functioning on open systems.
20
Operating performance
In the second quarter of 2015, the gross profit totalled 87,263 thousand euros, up by 17.7 percentage points compared with 2014, mainly as a result of higher sales and a different geographic and product mix of the quarters under comparison.
Operating expenses amounted to 45,289 thousand euros, up by 9.8 percentage points compared with the same quarter of 2014. The foreign exchange market negatively impacted this item for about 2.4 million euros: net of this effect, the increase would be equal to 3.9%. The ratio of operating expenses to total revenues decreased from 37.2% to 35.5%.
Research and development costs increased to 6,623 thousand euros (6,440 thousand euros in the second quarter of 2014) and refer mainly to activities concerning the development of new products that will be launched soon. The ratio of research and development costs to revenues amounted to 5.2 percentage points (5.8% in 2014).
In the second quarter of 2015, sales and marketing expenses totalled 24,825 thousand euros, up by 2,520 thousand euros compared with 2014. This item includes costs incurred to support the launch of new products and expenses related to the technical support for instruments at customers’ facilities.
General and administrative expenses amounted to 13,841 thousand euros, up 10.7% compared with the second quarter of 2014. Their ratio to total revenues decreased from 11.3% in the second quarter of 2014 to 10.9 percentage points in the second quarter of 2015, as a result of negative translation effect and higher labour costs, including costs incurred for the 2014 stock option plan (310 thousand euros in the second quarter of 2015, compared with 43 thousand euros in 2014).
Other operating expenses equal to 1,933 thousand euros (871 thousand euros in the second quarter of 2014), include 1,380 thousand euros in additions to the allowances for doubtful accounts, mainly related to some customers of the Brazilian subsidiary suffering from a significant financial stress. Furthermore, the item includes 491 thousand euros in tax expenses (393 thousand euros in 2014) and a negative translation adjustment of 18 thousand euros on commercial items (a positive translation adjustment of 330 thousand euros in 2014), arising from the exchange rates fluctuation in the quarters under comparison.
In the second quarter of 2015, EBITDA amounted to 48,317 thousand euros (39,490 thousand euros in 2014), up by 8,827 thousand euros or 22.4% and equal to 37.9% of revenues (35.6% in the second quarter of 2014). Excluding the impact of the exchange rates from the quarters under comparison, EBITDA would be equal to 36.2 percentage points of revenues (ca.35.6% of revenues in the second quarter of 2014). In the second quarter of 2015, EBIT totalled 40,041 thousand euros, equal to 31.4% of revenues (28.9% in 2014).

21
Financial income and expense
In the second quarter of 2015, net financial expense totalled 375 thousand euros compared with net financial expense of 77 thousand euros in the same period in 2014. The collection of interests accrued on past-due positions amounted to 590 thousand euros in the second quarter of 2015 (71 thousand euros in the second quarter of 2014) and interests accrued on financial balances totalled 161 thousand euros (239 thousand euros in the same period of 2014). The currency translation effect, which was negative by 415 thousand euros (positive by 428 thousand euros in the second quarter of 2014), related mainly to the Euro exchange rate of subsidiaries’ financial balances that use currencies different from the Group’s Parent Company currency. Interests and other financial expense included 216 thousand euros in factoring transaction fees (300 thousand euros in the same period of 2014).
Profit before taxes and net profit
The second quarter of 2015 ended with a result before taxes of 39,666 thousand euros, which generated a tax liability of 13,458 thousand euros, up from the same period last year, when the result before taxes and the corresponding tax liability amounted to 31,963 thousand euros and 11,692 thousand euros, respectively. The tax rate decreased from 36.6% in the second quarter of 2014 to 33.9% in the second quarter of 2015, due mainly to lower amount of non-deductible taxes withheld on dividends the Group’s Parent Company received from foreign subsidiaries and to a lower tax rate in Italy following the introduction of regulatory amendments to help economic recovery. The net profit for the second quarter of 2015 totalled 26,208 thousand euros, equal to 20.6%, of revenues, compared with a net profit of 20,271 thousand euros (equal to 18.3% of revenues) in the same period of 2014.
22
OPERATING PERFORMANCE IN THE FIRST HALF OF 2015 In the first half of 2015, the DiaSorin Group reported revenues of 245,144 thousand euros (216,771 thousand euros in the first six months of 2014). Revenues increased by 13.1% (+5% at constant exchange rates) compared with 2014. The exchange rate fluctuations had a positive impact of 17.5 million euros on the Group’s revenues during the first six months of 2015.
The first half of 2015 was characterized by the outstanding performance of CLIA products, net of Vitamin D, up by 22.4% (16.4% at constant exchange rates) that offset the downward trend in sales of reagents used on more dated RIA and ELISA technologies. Vitamin D sales decreased in line with expectations (+8.9% at current exchange rates, -4.2% at constant exchange rates); lastly, instrument sales grew by 13.4% (5.5% at constant exchange rates).
The gross profit totalled 166,334 thousand euros in the first six months of 2015, compared with 145,911 thousand euros in the same period in 2014. The ratio of gross profit to revenues was equal to 67.9% (67.3% in 2014). The increase is the net result of higher sales and different geographic and product mix during the periods under comparison.
Operating expenses amounted to 88,385 thousand euros, up by 7,662 thousand euros compared with the first half of 2014 (+9.5%). This change was negatively impacted by the exchange rate fluctuations: operating expenses amounted to approximately 83.7 million euros at constant exchange rates, up 3.7 percentage points. This is the net result of higher sales and marketing expenses, costs for technical assistance to support the growing number of the installed base as well as general and administrative expenses.
In the first half of 2015, EBITDA amounted to 91,398 thousand euros (78,077 thousand euros in 2014) up 17.1% or 13,321 thousand euros. EBITDA incidence to revenues increased from 36% in 2014 to 37.3% in 2015, following the lower incidence of operating expenses, gross profit and the exchange rate impact.
EBIT amounted to 75,077 thousand euros (63,388 thousand euros in the first half of 2014), equal to 30.6% of revenues, up by 1.4 percentage points compared with 2014.
In the first half of 2015, net financial expenses totalled 1,240 thousand euros, compared with net financial expenses of 536 thousand euros in the first half of 2014, due the currency translation effect, which was negative by 925 thousand euros (positive by 530 thousand euros in the first half of 2014), as a result of the exchange rate fluctuations.
Income taxes totalled 25,016 thousand euros (22,879 thousand euros in 2014), the tax rate decreased to 33.9% from 36.4% in 2014 due mainly to lower amount of non-deductible taxes withheld on dividends the Group’s Parent Company received from foreign subsidiaries and a lower tax rate in Italy following the introduction of regulatory amendments to help economic recovery.
The net profit for the first six months of 2015 amounted to 48,821 thousand euros, up by 8,848 thousand euros or 22.1% compared with the same period of 2014. The net profit was equal to 19.9% of revenues (18.4% of revenues in the first half of 2014).
23
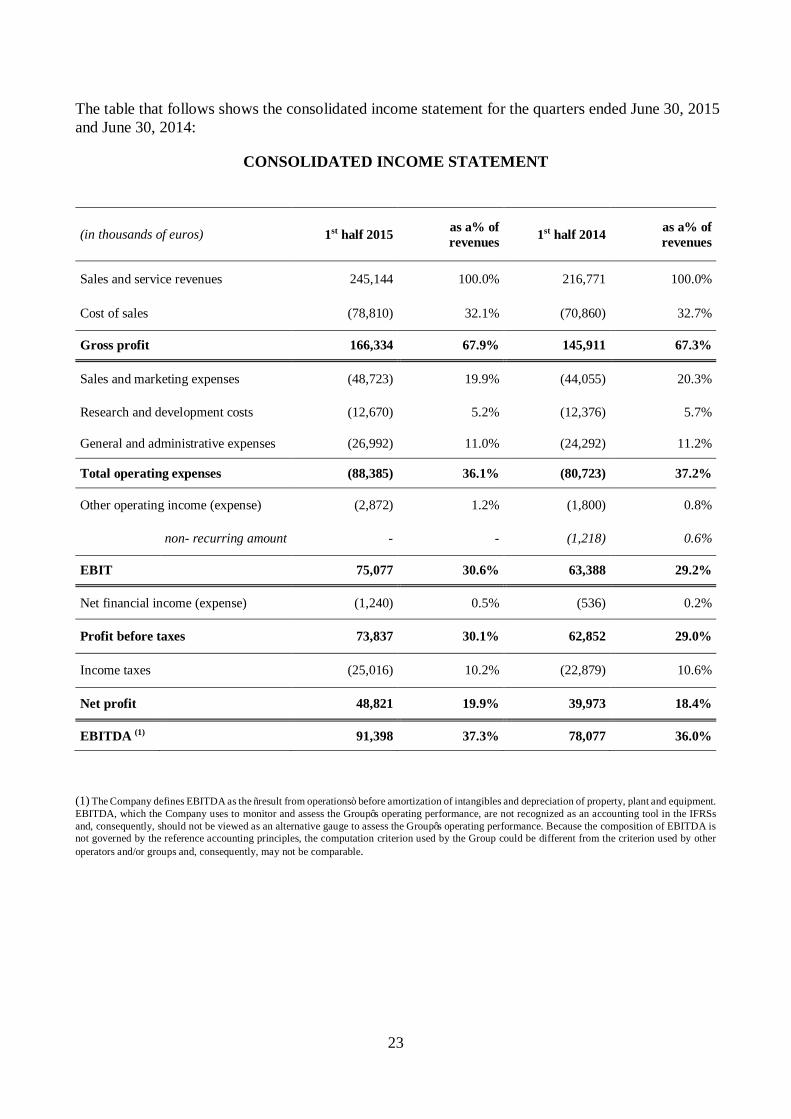
The table that follows shows the consolidated income statement for the quarters ended June 30, 2015 and June 30, 2014:
CONSOLIDATED INCOME STATEMENT
(in thousands of euros) 1st half 2015 as a% of revenues 1st half 2014 as a% of
revenues
Sales and service revenues 245,144 100.0% 216,771 100.0%
Cost of sales (78,810) 32.1% (70,860) 32.7%
Gross profit 166,334 67.9% 145,911 67.3%
Sales and marketing expenses (48,723) 19.9% (44,055) 20.3%
Research and development costs (12,670) 5.2% (12,376) 5.7%
General and administrative expenses (26,992) 11.0% (24,292) 11.2%
Total operating expenses (88,385) 36.1% (80,723) 37.2%
Other operating income (expense) (2,872) 1.2% (1,800) 0.8%
non- recurring amount - - (1,218) 0.6%
EBIT 75,077 30.6% 63,388 29.2%
Net financial income (expense) (1,240) 0.5% (536) 0.2%
Profit before taxes 73,837 30.1% 62,852 29.0%
Income taxes (25,016) 10.2% (22,879) 10.6%
Net profit 48,821 19.9% 39,973 18.4%
EBITDA (1) 91,398 37.3% 78,077 36.0%
(1) The Company defines EBITDA as the “result from operations” before amortization of intangibles and depreciation of property, plant and equipment. EBITDA, which the Company uses to monitor and assess the Group’s operating performance, are not recognized as an accounting tool in the IFRSs and, consequently, should not be viewed as an alternative gauge to assess the Group’s operating performance. Because the composition of EBITDA is not governed by the reference accounting principles, the computation criterion used by the Group could be different from the criterion used by other operators and/or groups and, consequently, may not be comparable.

24
Net revenues
In the first half of 2015, the DiaSorin Group generated revenues equal to 245,144 thousand euros (216,771 thousand euros in the first half of 2014). Net revenues increased by 13.1% (+5% at constant exchange rates) compared with 2014. The exchange rate fluctuations had a positive impact of 17.5 million euros on the Group’s revenues during the first six months of 2015. The main elements that impacted on the Group’s revenues by technology are provided below:
i) growth of 22.4% (16.4% at constant exchange rates) in CLIA technology product line, net of Vitamin D, following both the success of LIAISON XL platform and new products launched on the market, particularly 1,25 Vitamin D and Stool Testing panel;
ii) Vitamin D sales (up 8.9% at current exchange rates, but down 4.2 percentage points at constant exchange rates), reflecting the price erosion on test, partially offset by the growth in volumes driven by the new agreement signed with Quest in the U.S. The contraction in sale volumes in France were affected by the healthcare reform and a general downturn in the Brazilian and Australian markets compared with the first half of 2014;
iii) Growth of 13.4% (ca. 5.5% at constant exchange rates) in instrument and consumable sales,
occurring mainly in the Asian market;
iv) growth in the installed base: in the first six months of 2015, 272 new instruments have been placed, extending the overall number of installed instruments to 6,144 units. LIAISON XL new placements amounted to 354, out of which 27 units in the validation phase at customers’ facilities.
Breakdown of revenues by geographic region
The table below provides a breakdown by geographic region of destination of the consolidated revenues of the DiaSorin Group for the periods under comparison.
(in thousands of euros) 1st half 2015 1st half 2014 % Change at
current exchange rates
% Change at constant exchange
rates Europe and Africa 117,832 111,724 5.5% 4.3% North America 62,844 49,536 26.9% 3.3% Asia Pacific 45,002 34,360 31.0% 17.5% Central and South America 19,466 21,151 -8.0% -7.8% Total 245,144 216,771 13.1% 5.0%

25
Europe and Africa
Europe and Africa sales region generated sales equal to 117,832 thousand euros, up 5.5 percentage points compared with the first half of 2014. Specifically:
i) growth in revenue in the Italian market (+3.5%) in a stable local market (+0.6%)*, driven by Vitamin D and the upward trend of some CLIA products (particularly Hepatitis, Endocrinology, PCT and Stool testing);
ii) growth of 7.9 percentage points recorded in the German market (local market up by 0.3%)*, due to CLIA products and specifically to 1,25 Vitamin D, Stool testing and to the steady growth in Vitamin D sales;
iii) sales slowdown in the French market (-5.6%) entirely due to the Vitamin D performance. Net of these sales, this market increased by 10.3 percentage points compared with 2014 (Vitamin D recorded -30.2% in the local market)*. Sales of CLIA reagents increased by 19.6 percentage points compared with the first half of 2014, with the exception of Vitamin D;
iv) growth in all the countries of the area where the Group operates, with the sole exception of markets served through distributors' network that recorded a 6.8 percentage point decrease due to the socio-political tension in Russia.
North America
In the first half of 2015, the North America sales region reported revenues of 62,844 thousand euros, up by 3.3% in local currency compared with the same period last year. This change reflects two opposing phenomena:
i) strong performance of CLIA ex Vitamin D specialties, with a gain of 45.3 percentage points, due to Infectious Diseases and Prenatal Screening that were strongly impacted by the
* Source: EDMA latest data available

26
agreement signed with LabCorp. Worth mentioning is the strong performance of 1,25 Vitamin D test;
ii) Vitamin D sales (-2.1%) were impacted by lower sales price and the price reduction granted to LabCorp at the beginning of the second quarter 2014, that was partially offset by the new agreement with Quest.
Asia Pacific
In the first half of 2015, revenues of the Asia Pacific sales region amounted to 45,002 thousand euros, up by 31% (+17.5% at constant exchange rates) compared with the same period last year. This is the net result of:
i) Strong performance in the Chinese market, with a growth of 26 percentage points in local currency for all CLIA products;
ii) lower sales in the Australian market (-6.4% in Australian dollars) due to lo lower Vitamin D sales, that were partially offset by other CLIA sales. Net of Vitamin D, sales grew by 22.6% in the Australian market;
iii) increasing sales generated through distributors in markets where the Group does not have a direct presence (+27.3% at current exchange rates) mainly due to Iran, Pakistan and Iraq.
Central and South America
The Latin American sales region recorded revenues of 19,466 thousand euros in the first half of 2015, down by 8% (-7.8% at constant exchange rates) compared with 21,151 thousand euros in the same period of 2014. This change is mainly attributable to:
i) negative performance of the Brazilian subsidiary (-17.4% in local currency) due to the overall macroeconomic crisis affecting the country and to disruptions in some important local distributors;
ii) lower sales in the Mexican market (-2.3% in local currency) compared with the first half of 2014 which was characterized by a great number of instruments sales to support the business development of blood banks. Good performance of CLIA product, particularly in Hepatitis clinical area;
iii) positive performance of distributors’ network in countries where the Group does not have a direct presence (+11.7% compared with the first half of 2014).

27
Breakdown of revenues by technology
The tables that follow show the percentage of the Group’s consolidated revenues contributed by each technology in the first half of 2015 and 2014.
% of revenues contributed 1st half 2015 1st half 2014
CLIA TESTS 73.4% 70.8% ELISA TESTS 12.4% 14.3% INSTRUMENTS SALES AND OTHER REVENUES 11.7% 11.6% RIA TESTS 1.7% 2.6% MOLECULAR DIAGNOSTICS 0.8% 0.7%
Total 100.0% 100.0%

28
Operating performance The gross profit totalled 166,334 thousand euros in the first six months of 2015, compared with 145,911 thousand euros in the same period in 2014; the ratio of gross profit to revenues increased to 67.9% compared with 2014, mainly as a result of higher sales and a different geographic and product mix of the periods under comparison. Operating expenses totalled 88,385 thousand euros, up 9.5 percentage points compared with the first half of 2014: their ratio to total revenues decreased from 37.2% in the first half of 2014 to 36.1% in the first half of 2015.
Research and development costs, equal to 12,670 thousand euros, are in line with costs incurred in 2014: their ratio to total revenues was equal to 5.2 percentage points, compared with 5.7 percentage points in the first half of 2014.
General and administrative expenses amounted to 26,992 thousand euros: their ratio to total revenues equal to 11.0 percentage points (in line with the first half of 2014).
Other operating expenses equal to 2,872 thousand euros (1,800 thousand euros in the first half of 2014) include 927 thousand euros in tax charges (788 thousand euros in the first six months of 2014), 1,583 thousand euros in additions to the allowances for doubtful account, mainly related to some customers of the Brazilian subsidiary suffering from a significant financial stress.
In the first six months of 2015, EBITDA amounted to 91,398 thousand euros, equal to 37.3% of revenues (36% in the first six months of 2014), up 1.3 percentage points. Excluding the impact of the exchange rates from the periods under comparison, EBITDA would be equal to 36.1 percentage points of revenues (36% of revenues in 2014).
In the first six months of 2015, EBIT totalled 75,077 thousand euros, equal to 30.6% of revenues and up by 1.4 percentage points compared with the same period of 2014.
Financial income and expense
In the first half of 2015, net financial expense totalled 1,240 thousand euro, compared with net financial expense of 536 thousand euros in the same period of 2014. The collection of interests accrued on past-due positions amounted to 819 thousand euros in the first half of 2015 (231 thousand euros in the first half of 2014) and interests accrued on financial balances totalled 361 thousand euros (395 thousand euros in the same period of 2014). The currency translation effect on other financial balances, which was negative by 925 thousand euros (positive by 530 thousand euros in the first half of 2014) included 363 thousand euros in income from changes in subsidiaries’ financial balances that use currencies different from the Group’s Parent Company currency (476 thousand euros in the first half of 2014) and a loss of 1,288 thousand euros for the closure of financial instruments. Interests and other financial expense for the period included 459 thousand euros in factoring transaction fees (637 thousand euros in the first half of 2014).

29
Profit before taxes and net profit The first half of 2015 ended with a result before taxes of 73,837 thousand euros, which generated a tax liability of 25,016 thousand euros, up from the same period last year, when the result before taxes and the corresponding tax liability amounted to 62,852 thousand euros and 22,879 thousand euros, respectively. The tax rate decreased from 36.4% in the first half of 2014 to 33.9% in 2015, due mainly to lower amount of non-deductible taxes withheld on dividends the Group’s Parent Company received from foreign subsidiaries and a lower tax rate in Italy following the introduction of regulatory amendments to help economic recovery. The consolidated net profit for the first six months of 2014 totalled 48,821 thousand euros, equal to 19.9% of revenues, compared with a net profit of 39,973 thousand euros (equal to 18.4% of revenues) in the same period of 2014.

30
STATEMENT OF FINANCIAL POSITION OF THE GROUP AT JUNE 30, 2015 A condensed statement of financial position of the Group at June 30, 2015 is provided below: (in thousands of euros) 6/30/2015 12/31/2014 Intangible assets 116,562 116,950 Property, plant and equipment 76,054 72,207 Other non-current assets 25,567 25,584 Net working capital 156,071 142,281 Other non-current liabilities (38,811) (39,791) Net invested capital 335,443 317,231 Net financial position 195,971 166,342 Shareholders’ equity 531,414 483,573
Non-current assets increased to 218,183 thousand euros at June 30, 2015 from 214,741 thousand euros at December 31, 2014 as a results of investments carried out in the first half of 2015 and the euro depreciation. A breakdown of net working capital is provided below: (in thousands of euros) 6/30/2015 12/31/2014 Change Trade receivables 112,582 109,521 3,061 Ending inventories 106,803 101,320 5,483 Trade payables (39,628) (39,311) (317) Other current assets/liabilities (1) (23,686) (29,249) 5,563 Net working capital 156,071 142,281 13,790
(1) Other current assets/liabilities is defined as the algebraic sum of receivables and payables other than financial and commercial items. Net working capital increased by 13,790 thousand euros in the first half of 2015 (including a currency effect of about 3 million euros) following a growth in inventories and in trade receivables, as well as lower other operating expenses. The increase of 5,483 thousand euros in ending inventories compared with December 31, 2014 (out of which 2 million euros relating to the exchange rate), is due to the growth in manufacturing volumes to support higher revenues. Trade receivables increased by 3,061 thousand euros compared with December 31, 2014 mainly due to exchange rate fluctuations and increasing revenues in the period. Other current assets/liabilities decreased by 5,563 thousand euros resulting from a decrease in payables to employees.

31
A condensed net financial position schedule is shown below: (in thousands of euros) 6/30/2015 12/31/2014
Cash and cash equivalents 141,626 144,855 Liquid assets (a) 141,626 144,855
Other current financial assets (b) 57,259 24,963
Current bank debt (2,808) (3,007) Other current financial liabilities - (259) Current indebtedness (c) (2,808) (3,266)
Net current financial assets (d)=(a)+(b)+(c) 196,077 166,552
Non-current bank debt (106) (210) Non-current indebtedness (e) (106) (210)
Net financial position (g)=(d)+(e) 195,971 166,342
At June 30, 2015 the net consolidated financial position was positive by 195,971 thousand euros, for an increase of 29,629 thousand euros compared with December 31, 2014, as a result of the strong cash flow generated from operating activities in the first six months of 2015 and the sale of treasury shares due to the exercise of some tranches of the 2010 Stock Option Plan. Shareholders’ equity, which totalled 531,414 thousand euros at June 30, 2015 (483,573 thousand euros at December 31, 2014) includes treasury shares valued at 26,968 thousand euros.

32
ANALYSIS OF CONSOLIDATED CASH FLOWS
A complete consolidated statement of cash flows is included in the financial statement schedules. A review of the main statement items and of the changes that occurred compared with the corresponding period in 2014, is provided below: (in thousands of euros) 1st half
2015 1st half
2014 2nd quarter
2015 2nd quarter
2014
Cash and cash equivalents at beginning of period 144,855 105,110 196,047 110,449
Net cash from operating activities 55,751 52,870 21,469 18,162
Cash used for investing activities (16,234) (14,231) (8,481) (6,912)
Cash used for financing activities (11,303) (33,274) (35,966) (32,982)
Acquisitions of subsidiaries and business operations (1,443) - (1,443) -
Change in net cash before investments in financial assets 26,771 5,365 (24,421) (21,732)
Investments in financial assets (30,000) (21,758) (30,000) -
Change in net cash (3,229) (16,393) (54,421) (21,732)
Cash and cash equivalents at end of period 141,626 88,717 141,626 88,717
The cash flow from operating activities amounted to 21,469 thousand euros in the second quarter of 2015, compared with 18,162 thousand euros in the second quarter of 2014. The cash generation from operating activities was higher than in 2014, as this item was offset by a greater absorption of the working capital. Tax payments totalled 21,164 thousand euros in the second quarter of 2015 (19,149 thousand euros in the second quarter of 2014), consisting mainly of the Group’s Parent company’s and US subsidiary’s income taxes. Investing activities absorbed cash totalling 8,481 thousand euros, compared with 6,912 thousand euros in the second quarter of 2014.
Net cash used for financing activities amounted to 35,966 thousand euros (32,982 thousand euros in the same period in 2014), including a dividend payment of 32,936 thousand euros in May 2015 (29,919 thousand euros in 2014).
Investments in subsidiaries concern capital contributions following the incorporation of DiaSorin Poland subsidiary, that was not yet operational at June 30, 2015.
In the second quarter of 2015 the Group’s Parent Company opened a term deposit exceeding three months, amounting to 30 million euros.

33
The cash flow from operating activities amounted to 55,751 thousand euros in the first six months of 2015, as against 52,870 thousand euros in the first half of 2014. The cash generation from operating activities was higher compared with the first half of 2014, as it was offset by dynamics in working capital that recorded a downward trend following the payments of amounts owed to employees for the functional reorganization of some company areas in Italy that occurred at the end of 2014. It should be noted that the first half of 2014 profited from the collection of past-due positions the Spanish subsidiary owed by public entities. Tax payments totalled 23,749 thousand euros (21,905 thousand euros in the first half of 2014), consisting mainly of the Group’s Parent company’s and the U.S. and German subsidiaries’ income taxes.
Net cash used in investing activities totalled 16,234 thousand euros, compared with 14,231 thousand euros in the first half of 2014. Capital expenditures for medical equipment amounted to 10,861 thousand euros, up from 10,299 thousand euros in the first six months of 2014. In addition, development costs of 840 thousand euros were capitalized in the first half of 2015, as against development costs of 359 thousand euros in the same period in 2014.
The free cash flow amounted to 39,314 thousand euros compared with 39,100 thousand euros in the first half of 2014.
The net cash used in financing activities totalled 11,303 thousand euros in the first six months of 2015 (33,274 thousand euros in the same period in 2014). It was used mainly for dividend payment amounting to 32,936 thousand euros in the first six months of 2015 (29,919 thousand euros in 2014), offset by 16,922 thousand euros for the sale of treasure shares following the exercise of some tranches of the 2010 Stock Option Plan. The first half of 2015 recorded positive translation adjustment of 4,818 thousand euros on liquid assets at June 30, 2015, resulting from the revaluation of the currencies in which the Group operates vis-à-vis the euro, particularly with regard to the US dollar.
In the first half of 2015, investments in financing assets included a term deposit of 30 million euros opened by the Group’s Parent company as against 21,758 thousand euros (USD 30 million) in investments in term deposits the U.S. subsidiary opened in the first half of 2014.
At June 30, 2015, available liquid assets held by the Group totalled 141,626 thousand euros, with a decrease of 3,229 thousand euros compared with December 31, 2014. OTHER INFORMATION
The Group had 1,648 employees at June 30, 2015 (1,620 employees at December 31,2014).

34
TRANSACTIONS WITH RELATED PARTIES In the normal course of business, DiaSorin S.p.A. engages on a regular basis in commercial and financial transactions with its subsidiaries, which are also Group companies. These transactions, which are part of the Group’s regular operations and are executed on standard market terms, consist of the supply of goods and services, including administrative, information technology, personnel management, technical support and consulting services, which produce receivables and payables at the end of the year, and financing and cash management transactions, which produce income and expenses. These transactions are eliminated in the consolidation process and, consequently, are not discussed in this section of this Report.
The Group awards additional benefits to several eligible employees of DiaSorin S.p.A. and other Group companies through a stock option plan. The costs incurred in connection with this plan totalled 620 thousand euros in the first six months of 2015 (153 thousand euros in 2014).
The compensation payable to the key management and strategic management is consistent with standard market terms for compensation offered to employees with a similar status.

35
SIGNIFICANT EVENTS OCCURRING AFTER JUNE 30, 2015 AND BUSINESS OUTLOOK On July, 20, DiaSorin and Beckman Coulter Diagnostics signed a distribution partnership agreement for the commercialization in China of DiaSorin Hepatitis B, C and HIV tests on LIAISON XL LAS connected to Beckman Coulter’s leading automation solutions, the Power Express and Power Processor automated sample processing system. In view of the Group’s operating performance after June 30, 2015 and taking into account possible evolutions of the global macroeconomic scenario and the diagnostic sector in particular, management believes that in 2015 DiaSorin will succeed in reporting:
• Revenues: growth between 4% and 5% at constant exchange rates compared with 2014;
• EBITDA: growth between 4% and 5% at constant exchange rates compared with 2014;
• LIAISON/LIAISON XL installed base: ca. 550.

36
CONDENSED SEMIANNUAL CONSOLIDATED FINANCIAL STATEMENTS AT JUNE 30, 2015

37
CONSOLIDATED INCOME STATEMENT
(in thousands of euros) notes 1st half 2015 1st half 2014
Sales and service revenues (1) 245,144 216,771
Cost of sales (2) (78,810) (70,860)
Gross profit 166,334 145,911
Sales and marketing expenses (3) (48,723) (44,055)
Research and development costs (4) (12,670) (12,376)
General and administrative expenses (5) (26,992) (24,292)
Other operating income (expenses) (6) (2,872) (1,800)
non-recurring amount - (1,218)
EBIT 75,077 63,388
Net financial income/ (expense) (7) (1,240) (536)
Profit before taxes 73,837 62,852
Income taxes (8) (25,016) (22,879)
Net profit for the period 48,821 39,973
Broken down as follows:
- amount attributable to Parent Company’s shareholders 48,821 39,973
- amount attributable to minority interests - -
Earnings per share (basic) (9) 0.89 0.73
Earnings per share (diluted) (9) 0.89 0.73

38
COMPREHENSIVE INCOME STATEMENT
(in thousands of euros) 1st half 2015 1st half 2014
Net profit for the period (A) 48,821 39,973 Other comprehensive gains/(losses) that will not be reclassified subsequently to gain/(loss) of the period:
Gains/(losses) on remeasurement of defined benefit plans 187 (215) Total other comprehensive gains/(losses) that will not be reclassified subsequently to gain/(loss) of the period (B1) 187 (215)
Other comprehensive gains/(losses) that will be reclassified subsequently to gain/loss of the period:
Gains/(losses) on exchange differences on translating foreign operations 14,581 2,662 Gains/(losses) on net investment hedge - 97 Total other comprehensive gains/(losses) that will be reclassified subsequently to gain/(loss) of the period (B2) 14,581 2,759
TOTAL OTHER COMPREHENSIVE GAINS/(LOSSES), NET OF TAX (B1) +(B2) =(B) 14,768 2,544
TOTAL COMPREHENSIVE GAINS/(LOSSES) (A)+(B) 63,589 42,517 Including: -amount attributable to Parent Company’s shareholders 63,571 42,525 -amount attributable to minority interests 18 (8)

39
CONSOLIDATED STATEMENT OF FINANCIAL POSITION (continued)
(in thousands of euros) notes 6/30/2015 12/31/2014
ASSETS
Non-current assets
Property, plant and equipment (10) 76,054 72,207 Goodwill (11) 68,969 67,703 Other intangibles (11) 47,593 49,247 Equity investments (12) 1,785 506 Deferred-tax assets (13) 21,705 22,194 Other non-current assets (14) 2,077 2,884 Total non-current assets 218,183 214,741
Current assets
Inventories (15) 106,803 101,320 Trade receivables (16) 112,582 109,521 Other current assets (17) 11,392 10,291 Other current financial assets (18) 57,259 24,963 Cash and cash equivalents (18) 141,626 144,855 Total current assets 429,662 390,950
TOTAL ASSETS 647,845 605,691

40
CONSOLIDATED STATEMENT OF FINANCIAL POSITION
(in thousands of euros) notes 6/30/2015 12/31/2014
LIABILITIES AND SHAREHOLDERS’ EQUITY
Shareholders’ equity
Share capital (19) 55,948 55,948 Treasury shares (19) (26,968) (44,045) Additional paid-in capital (19) 18,155 18,155 Statutory reserve (19) 11,190 11,190 Other reserves and retained earnings (19) 424,046 358,047 Net profit for the period attributable to shareholders of the Parent Company 48,821 84,074 Shareholders’ equity attributable to shareholders of the Parent Company 531,192 483,369
Other reserves and retained earnings attributable to minority interests 222 204 Shareholders’ equity attributable to minority interests 222 204
Total Shareholders’ equity 531,414 483,573
Non-current liabilities
Long-term borrowings (20) 106 210 Provisions for employee severance indemnities and other employee benefits (21) 32,002 32,106 Deferred-tax liabilities (13) 3,074 3,008 Other non-current liabilities (22) 3,735 4,677 Total non-current liabilities 38,917 40,001
Current liabilities
Trade payables (23) 39,628 39,311 Other current liabilities (24) 27,011 30,573 Income taxes payable (25) 8,067 8,967 Current portion of long-term debt (20) 2,808 3,007 Other financial liabilities (20) - 259 Total current liabilities 77,514 82,117
Total liabilities 116,431 122,118
TOTAL LIABILITIES AND SHAREHOLDERS’ EQUITY 647,845 605,691

41
CONSOLIDATED STATEMENT OF CASH FLOWS
(in thousands of euros) 1st half 2015 1st half 2014
Cash flow from operating activities Net profit for the period 48,821 39,973 Adjustment for: - Income taxes 25,016 22,879 - Depreciation and amortization 16,321 14,689 - Financial expense/ (income) 1,240 536 - Additions to/ (Utilizations of) provisions for risk 698 541 - (Gains)/Losses on sales of non-current assets 61 3 - Additions to/ (Reversals of) provisions for employee severance indemnities 396 400 - Changes in shareholders’ equity reserves: - Stock option reserve 620 153 - Cumulative translation adjustment from operating activities 38 25 - Change in other non current-assets/liabilities (512) (959) Cash flow from operating activities before changes in working capital 92,699 78,240 (Increase)/Decrease in receivables included in working capital (1,893) 1,974 (Increase)/Decrease in inventories (3,298) (3,347) Increase/(Decrease) in trade payables (76) 325 Increase)/Decrease in other current items (8,135) (1,956) Cash from operating activities 79,297 75,236 Income taxes paid (23,749) (21,905) Interest received (paid) 203 (461) Net cash from operating activities 55,751 52,870 Investments in intangibles (1,690) (1,277) Investments in property, plant and equipment (15,190) (13,864) Investments in subsidiaries (112) (128) Divestments of property, plant and equipment 758 1,038
Cash used in regular investing activities (16,234) (14,231)
Acquisitions of subsidiaries and business operations (1,443) -
Cash used in investing activities (17,677) (14,231) (Redemptions)/Collections of loans and other liabilities (107) (3,720) (Issuance)/Repayments of term deposit (30,000) (21,758) (Purchase)/Sale of treasury shares 16,922 - Dividends distribution (32,936) (29,919) Foreign exchange translation differences 4,818 365
Cash used in financing activities (41,303) (55,032) Change in net cash and cash equivalents (3,229) (16,393)
CASH AND CASH EQUIVALENTS AT BEGINNING OF PERIOD 144,855 105,110
CASH AND CASH EQUIVALENTS AT END OF PERIOD 141,626 88,717
42
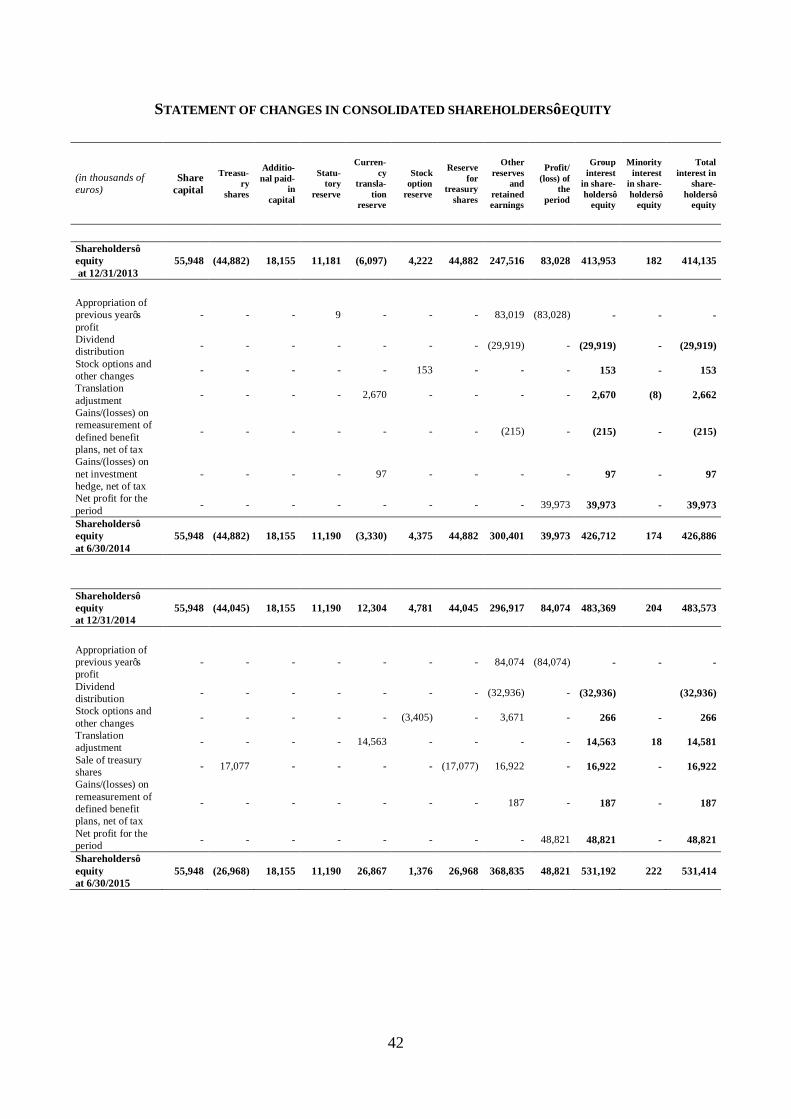
STATEMENT OF CHANGES IN CONSOLIDATED SHAREHOLDERS’ EQUITY
(in thousands of euros)
Share capital
Treasu-ry
shares
Additio-nal paid-
in capital
Statu-tory
reserve
Curren-cy
transla-tion
reserve
Stock option
reserve
Reserve for
treasury shares
Other reserves
and retained earnings
Profit/ (loss) of
the period
Group interest
in share-holders’
equity
Minority interest
in share-holders’
equity
Total interest in
share-holders’
equity
Shareholders’ equity at 12/31/2013
55,948 (44,882) 18,155 11,181 (6,097) 4,222 44,882 247,516 83,028 413,953 182 414,135
Appropriation of previous year’s profit
- - - 9 - - - 83,019 (83,028) - - -
Dividend distribution - - - - - - - (29,919) - (29,919) - (29,919)
Stock options and other changes - - - - - 153 - - - 153 - 153
Translation adjustment - - - - 2,670 - - - - 2,670 (8) 2,662
Gains/(losses) on remeasurement of defined benefit plans, net of tax
- - - - - - - (215) - (215) - (215)
Gains/(losses) on net investment hedge, net of tax
- - - - 97 - - - - 97 - 97
Net profit for the period - - - - - - - - 39,973 39,973 - 39,973
Shareholders’ equity at 6/30/2014
55,948 (44,882) 18,155 11,190 (3,330) 4,375 44,882 300,401 39,973 426,712 174 426,886
Shareholders’ equity at 12/31/2014
55,948 (44,045) 18,155 11,190 12,304 4,781 44,045 296,917 84,074 483,369 204 483,573
Appropriation of previous year’s profit
- - - - - - - 84,074 (84,074) - - -
Dividend distribution - - - - - - - (32,936) - (32,936) (32,936)
Stock options and other changes - - - - - (3,405) - 3,671 - 266 - 266
Translation adjustment - - - - 14,563 - - - - 14,563 18 14,581
Sale of treasury shares - 17,077 - - - - (17,077) 16,922 - 16,922 - 16,922
Gains/(losses) on remeasurement of defined benefit plans, net of tax
- - - - - - - 187 - 187 - 187
Net profit for the period - - - - - - - - 48,821 48,821 - 48,821
Shareholders’ equity at 6/30/2015
55,948 (26,968) 18,155 11,190 26,867 1,376 26,968 368,835 48,821 531,192 222 531,414

43
NOTES TO THE CONDENSED SEMIANNUAL CONSOLIDATED FINANCIAL STATEMENT AT JUNE 30, 2015
GENERAL INFORMATION AND SCOPE OF CONSOLIDATION General information The DiaSorin Group is specialized in the development, manufacture and distribution of immunodiagnostics and molecular diagnostics tests. The Group’s Parent Company, DiaSorin S.p.A., is in Via Crescentino (no building No.), Saluggia (VC). Principles for the preparation of the condensed semiannual consolidated financial statements These condensed semiannual consolidated financial statements were prepared in compliance with the International Financial Reporting Standards (“IFRSs”), as issued by the International Accounting Standards Board (“IASB”) and adopted by the European Union. The designation IFRSs also includes the International Accounting Standards (“IASs”) that are still in effect and all of the interpretations of the International Financial Reporting Interpretations Committee (“IFRIC”). This semiannual report was prepared in accordance with the requirements of the relevant international accounting standard (IAS 34 - Interim Financial Reporting). These notes provide information in summary form, in order to avoid duplicating information published previously, as required by IAS 34. Specifically, these notes discuss only those components of the income statement and balance sheet the composition or change in amount of which require comment (due to the amount involved or the type of transaction or because an unusual transaction is involved) in order to understand the Group’s operating performance, financial performance and financial position. Consequently, these condensed semiannual consolidated financial statements do not provide all of the disclosure required in the annual financial statements and should be read in conjunction with the annual financial statements prepared for the year ended December 31, 2014. When preparing interim financial statements, management is required to develop estimates and assumptions that affect the amounts shown for revenues, expenses, assets and liabilities in the financial statements and the disclosures provided with regard to contingent assets and liabilities on the date of the interim financial statements. If such estimates and assumptions, which were based on management’s best projections, should differ from actual events, they will be modified appropriately when the relevant events produce the abovementioned differences. As a rule, certain valuation processes, particularly the more complex processes such as determining whether the value of non-current assets has been impaired, are carried out fully only in connection with the preparation of the annual financial statements, when all the necessary information is available, except when there are impairment indicators that require an immediate evaluation of any impairment losses that may have occurred.
44
The process of preparing the condensed semiannual consolidated financial statements included developing the actuarial valuation required to compute the provisions for employees benefits and value the stock option plan. The income tax liability is recognized using the best estimate of the weighted average tax rate projected for the entire year. In this Consolidated Semiannual Report, all amounts are in thousands of euros unless otherwise stated. Financial statement presentation formats The financial statements are presented in accordance with the following formats:
- in the income statement, costs are broken down by function. This income statement format, also known as a “cost of sales” income statement, is more representative of the Group’s business than a presentation with expenses broken down by nature because it is consistent with internal reporting and business management methods and with international practice in the diagnostic industry;
- in the statement of financial position, current and non-current assets liabilities are shown separately;
- the statement of cash flows is presented in accordance with the indirect method. Scope of consolidation These condensed semiannual consolidated financial statements include the financial statements of DiaSorin S.p.A., the Group’s Parent Company, and those of its subsidiaries. Subsidiaries are those companies over which the Group exercises control pursuant to IFRS 10, that is when the Group is exposed, or has right, to variable returns from its involvement with the subsidiary and, meanwhile, has the ability to affect those returns through its power over the subsidiary. Subsidiaries are consolidated line by line from the date the Group obtains control until the moment when control ceases to exist. Dormant subsidiaries and subsidiaries that generate an insignificant volume of business are not consolidated. Their impact on the Group’s total assets and liabilities, financial position and bottom-line result is not material. The Group has neither subsidiaries with significant minority interest, nor unconsolidated structured entities and it is not subject to significant restrictions concerning interest in subsidiaries. No change in scope of consolidation occurred during the first six months of 2015.

45
The following table lists the direct and indirect interest of DiaSorin S.p.A. as of June 30, 2015 and December 31, 2014:
Company Head office location
At June 30, 2015 At December 31, 2014
% interest held by the Group
% minority interest
% interest held by the Group
% minority interest
Direct interest DiaSorin S.A/N.V. Belgium 100% - 100% - DiaSorin Ltda Brazil 100% - 100% - DiaSorin S.A. France 100% - 100% - DiaSorin Iberia S.A. Spain 100% - 100% - DiaSorin Ltd UK 100% - 100% - DiaSorin Inc. USA 100% - 100% -
DiaSorin Mexico S.A de C.V. Mexico 100% - 100% - DiaSorin Deutschland GmbH Germany 100% - 100% - DiaSorin AB Sweden 100% - 100% - DiaSorin Ltd Israel 100% - 100% - DiaSorin Austria GmbH Austria 100% - 100% - DiaSorin Czech s.r.o. Czech Republic 100% - 100% - DiaSorin Diagnostics Ireland Limited Ireland 100% - 100% -
DiaSorin South Africa (PTY) Ltd South Africa 100% - 100% -
DiaSorin Australia (Pty) Ltd Australia 100% - 100% - DiaSorin Ltd China 80% 20% 80% 20% DiaSorin Switzerland AG Switzerland 100% - 100% -
Indirect interest 100% - 100% -
DiaSorin Canada Inc Canada 100% - 100% - DiaSorin Ireland Limited Ireland 100% - 100% -
DiaSorin I.N.UK Limited Ireland 100% - 100% -
A list of the subsidiaries, complete with information about head office locations and the percentage interest held by the Group, is provided in Annex I. New accounting principles
On 20 May 2013, the IASB issued the IFRIC Interpretation 21 ‐ Levies, an interpretation of IAS 37 ‐ Provisions, Contingent Liabilities and Contingent Assets. IFRIC 21 addresses when an entity should recognize a liability to pay levies imposed by government, other than taxes that are within the scope of other standards (i.e. IAS 12 – Income Taxes). IAS 37 sets out criteria for the recognition of a liability, one of which is the requirement for the entity to have a present obligation as a result of a past event (known as an obligating event). The interpretation clarifies that the obligating event that gives rise to a liability to pay a levy is the activity described in the relevant legislation that triggers the payment of the levy. The principle shall be applied retrospectively for the financial years starting at the latest from 17 June 2014 or later.

46
Accounting principles and amendments not yet applicable and not adopted early by the Group
On November 21, 2013, the IASB issued narrow scope amendments to IAS 19 – Employee Benefits entitled “Defined Benefit Plans: Employee Contributions”. The amendments are intended to simplify the accounting treatment for contributions to defined benefit plans from employees or third parties. Amendments shall be applied at the latest from 1 February 2015 or later.
On December 12, 2013 the IASB issued the Annual Improvements to IFRSs 2010–2012 Cycle and Annual Improvements to IFRSs 2011–2013 Cycle. The most important topics addressed in these amendments are, among others, the definition of vesting conditions in IFRS 2 – Share based payment, the disclosure on judgment used in the aggregation of operating segments in IFRS 8 – Operating Segments, the identification and disclosure of a related party transaction that arises when a management entity provides key management personnel service to a reporting entity in IAS 24 – Related Party disclosures, the extension of the exclusion from the scope of IFRS 3 – Business Combinations to all types of joint arrangements ( as required by IFRS 11- Joint arrangements) and to clarify the application of certain exceptions in IFRS 13 – Fair value Measurement. Amendments shall be applied at the latest from 1 February 2015 or later.
At the date of these financial statements, the competent bodies of the European Union have not yet completed the approval process required for the adoption of the following accounting principles and amendments:
Ø On May 6, 2014, the IASB issued amendments to IFRS 11 – Joint arrangements: Accounting for acquisitions of interests in joint operations, clarifying the accounting for acquisitions of an interest in a joint operation that constitutes a business. The amendments are effective, retrospectively, for annual periods beginning on or after 1 January 2016 with earlier application permitted.
Ø On May 12, 2014, the IASB issued an amendment to IAS 16 Property, Plant and Equipment and to IAS 38 Intangible Assets – “Clarification of acceptable methods of depreciation and amortization”. Amendments to IAS 16 establish that a revenue-based amortization method is inappropriate. The IASB has clarified that revenue generated by an activity that includes the use of an asset generally reflects factors other than the consumption of the economic benefits embodied in the asset. Amendments to IAS 38 introduce a rebuttable presumption to clarify that a revenue-based amortization method is inappropriate for the same reasons established by the amendments as required by IAS 16. This presumption, however, can be rebutted in certain limited circumstances. These amendments are effective for annual periods beginning from January 1, 2016, with early application permitted.
Ø On May 28, 2014, the IASB issued “IFRS 15 Revenue from contracts with customers" that will supersede IAS 18 Revenue and IAS 11 Construction Contracts, as well as the interpretations of IFRIC 13 Customer Loyalty Programs, IFRIC 15 Agreements for the Construction of Real Estate, IFRIC 18 Transfers of Assets from Customers and SIC 31 Revenues-Barter Transactions Involving Advertising Services. The new revenue model will apply to all contracts with customers except for those within the scope of IAS/IFRS concerning leases, insurance contracts and financial instruments. The core principle of the revenue recognition standard is delivered as follows:
o identify the contract with the customer; o identify the performance obligations in the contract; o determine the transaction price;
47
o allocate the transaction price to the performance obligations in the contracts; o recognize revenue when (or as) the entity satisfies a performance obligation.
These amendments are effective for annual periods beginning from January 1, 2018, with early application permitted.
Ø On July 24, 2014, the IASB issued the final version of IFRS 9- Financial Instruments, bringing together the Classification and measurement, Impairment and Hedge accounting phases of the IASB’s project to replace IAS 39. The new principle replaces the previous versions of IFRS 9 and is effective for annual periods beginning on or after 1 January 2018.
Ø On August 12, 2014, the IASB issued amendments to IAS 27 - Equity Method in Separate Financial Statements. The amendments reinstate the equity method as an accounting option for investments in subsidiaries, joint ventures and associates in an entity's separate financial statements. The amendments are effective for annual periods beginning on or after 1 January 2016, with earlier application being permitted.
Ø On September 11, 2014, the IASB issued amendments to IFRS 10 and IAS 28 Sales or Contribution of Assets between an Investor and its Associate or Joint Venture. The amendments set out that on a sale/ contribution of assets or subsidiary to a joint venture or associate the extent of any gain or loss recognized in the transferor/transferring company depends on whether the transferred/conferred assets or subsidiary constitute a business. The amendments are effective for annual periods beginning on or after 1 January 2016, with earlier application being permitted
Ø On September 25, 2014, the IASB issued “Annual Improvements to IFRSs: 2012-2014 Cycle”, a series of amendments to the following four standards: IAS 19 (to clarify that the high quality corporate bonds used in estimating the discount rate for post-employment benefits should be denominated in the same currency as the benefits to be paid), IFRS 5 (to provide specific guidance for cases in which an entity reclassifies an asset or a disposal group from held for sale to held for distribution or vice versa and cases in which held-for-distribution accounting is discontinued) IFRS 7 (to add additional guidance to clarify whether a servicing contract is continuing involvement in a transferred asset for the purpose of determining the disclosures required) and IAS 34 (to clarify that certain disclosures, if they are not included in the notes to interim financial statements, may be disclosed “elsewhere in the interim financial report” ). The amendments are effective for annual periods beginning on or after 1 January 2016.
Ø On December 18, 2014 the IASB issued amendments to IAS 1 - Disclosure Initiative to clarify perceived impediments to preparers exercising their judgment in presenting their financial reports. Specifically, the amendments concern how line items can be aggregated or disaggregated in the statement of financial position and in the notes on the basis of their materiality. Lastly, the amendments give guidance on use of subtotals in the financial statements tables. The amendments are effective for annual periods beginning on or after 1 January 2016.
The Group will comply with these new standards, amendments and interpretations based on their relevant effective dates, when endorsed by the European Union.

48
Other information Information about significant events occurring after June 30, 2015, the Group’s business outlook and its transactions with related parties is provided in separate sections of this Semiannual Report. The table below shows the exchange rates used to translate amounts reported by companies that operate outside the euro zone:
Currency Average exchange rates Exchange rates at
1st half 2015 1st half 2014 2nd quarter 2015
2nd quarter 2014 6/30/2015 6/30/2014 12/31/2014
U.S. dollar 1.1158 1.3703 1.1053 1.3711 1.1189 1.3658 1.2141 Brazilian real 3.3101 3.1499 3.3981 3.0583 3.4699 3.0002 3.2207 British pound 0.7323 0.8213 0.7211 0.8147 0.7114 0.8015 0.7789 Swedish kronor 9.3401 8.9535 9.2995 9.0517 9.2150 9.1762 9.3930 Swiss franc 1.0567 1.2215 1.0410 1.2192 1.0413 1.2156 1.2024 Czech koruna 27.5021 27.4439 27.3786 27.4456 27.2530 27.4530 27.7350 Canadian dollar 1.3774 1.5029 1.3587 1.4950 1.3839 1.4589 1.4063 Mexican peso 16.8887 17.9747 16.9510 17.8171 17.5332 17.7124 17.8679 Israeli shekel 4.3635 4.7706 4.2814 4.7517 4.2211 4.6960 4.7200 Chinese yuan 6.9408 8.4500 6.8572 8.5438 6.9366 8.4722 7.5358 Australian dollar 1.4261 1.4989 1.4208 1.4699 1.4550 1.4537 1.4829 South African rand 13.3048 14.6758 13.3824 14.4616 13.6416 14.4597 14.0353 Norwegian krone 8.6483 8.2766 8.5634 8.2049 8.7910 8.4035 9.0420

49
ANALYSIS OF FINANCIAL RISKS The financial risks to which the Group is exposed include market risks and, to a lesser extent, credit risk and liquidity risk. The table below lists material assets and liabilities in accordance with the requirements of IAS 39. 6/30/2015 12/31/2014
(in thousands of euros) Notes Carrying value Receivables Held for
trading Carrying
value Receivables Held for trading
Trade receivables (16) 112,582 112,582 - 109,521 109,521 - Other current financial assets (18) 57,259 57,259 - 24,963 24,963 - Cash and cash equivalents (18) 141,626 141,626 - 144,855 144,855 -
Total current financial assets 311,467 311,467 - 279,339 279,339 -
Total financial assets 311,467 311,467 - 279,339 279,339 -
6/30/2015 12/31/2014
(in thousands of euros) Notes Carrying value
Liabilities at
amortized cost
Held for trading
Carrying value
Liabilities at amortized
cost
Held for trading
Long-term borrowings (20) 106 106 - 210 210 -
Total non-current financial liabilities 106 106 - 210 210 - Trade payables (23) 39,628 39,628 - 39,311 39,311 -
Current portion of long-term debt (20) 2,808 2,808 - 3,007 3,007 -
Other current financial liabilities (20) - - - 259 - 259
Total current financial liabilities 42,436 42,436 - 42,577 42,318 259
Total financial liabilities 42,542 42,542 - 42,787 42,528 259
Risks related to fluctuations in foreign exchange and interest rates The Group is exposed to market risk deriving from currency fluctuations as it operates in an international framework in which transactions are made in different currencies, and interest rates. Because the Group did not establish hedges specifically for this purpose, it is exposed to the interest rate risk in connection with variable-rate financial liabilities. As of June 30, 2015, borrowings totalled 2,914 thousand euros. Assuming a fluctuation of 2 percentage points in interest rates on medium- and long-term borrowings, the resulting impact on the financial expense recognized in the income statement would not be significant. The same analysis was performed for the receivables assigned without recourse to the factoring company, which totalled 17,812 thousand euros in the first six months of 2015. This computation was made because the factoring company charges a variable fee tied in part to the Euribor. An increase of 2 percentage points would result in an increase in financial expense of 0.4 million euros. The Group’s exposure to currency risk arises both in connection with the geographical distribution of the Group’s industrial activities compared to the markets in which it sells its products, and in relation to the use of external borrowing denominated in foreign currencies.

50
As to borrowings denominated in foreign currencies, a fluctuation of 5 percentage points in exchange rates would have an impact of 0.6 million euros on the exchange differences recognized in the income statement.
Some Group subsidiaries are located in countries that are not members of the European Monetary Union. Since the Group’s reporting currency is the euro, the income statements of these companies are translated into euros at the average exchange rate for the year. Consequently, even if revenues and margins were to remain equal when stated in the local currency, fluctuations in exchange rates could have an impact on the euro amount of revenues, expenses and operating results due to the translation into the consolidation currency. An analysis of the changes affecting the main currencies used by the Group has shown that a 5% change in the exchange rates of all of the currencies used by the Group would have an impact on the income statement of about 1 million euros.
The euro amount attributed to assets and liabilities of consolidated companies that use reporting currencies different from the euro could vary as a result of changes in exchange rates. As required by the accounting principles adopted by DiaSorin, these changes are recognized directly in equity by posting them to the currency translation reserve. A 5% change in all foreign exchange rates would have an impact of about 9 million euros on the currency translation reserve.
The Group monitors any significant exposures to the foreign exchange translation risk. However, no hedges had been established against such exposures as of June 30, 2015. This is because the potential impact of the foreign exchange translation risk on the Group’s equity is not significant. Credit risk The Group’s receivables present a low level of risk since most of these receivables are owed by public institutions, for which the risk of non-collection is not significant. At June 30, 2015, past-due trade receivables were equal to about 16% of revenues. These receivables were held mainly by the Group’s Parent Company and the Brazilian and Spanish subsidiaries which sell a very high percentage of their products to the local National Health Service. About 54% of these receivables was more than 120 days past due. These past-due receivables were covered by an allowance for doubtful accounts amounting to 9,991 thousand euros. In addition, in order to bridge the gap between contractual payment terms and actual collection times, the Group assigns its receivables to factors without recourse. Liquidity risk A prudent cash management strategy includes maintaining sufficient cash or readily available assets and credit lines, to meet immediate liquidity needs. Cash flows, funding requirements and liquidity levels are monitored centrally to ensure promptly and effectively the availability of financial resources and invest appropriately any excess liquidity. Management believes that the funds and credit lines currently available, when combined with the resources generated by operating and financing activities, will enable the Group to meet the obligations resulting from its capital investment programs, working capital requirements and the need to repay its indebtedness upon maturity.

51
Commercial risk The DiaSorin Group is subject to the commercial risk, particularly with regard to the Vitamin D segment, caused by increased competition and the market entry of such competitors as Siemens, Abbott and Roche. The strategy of protecting major customers by extending long-term contracts, the acknowledged extremely high quality of DiaSorin Vitamin D tests, the ability of doubling the hourly rate of determinations offered by the LIAISON XL, and growing demand in countries where dosage is still not very frequent ensure that DiaSorin will continue to play a leading role in the future of this market

52
OPERATING SEGMENTS In accordance with IFRS 8, the Group designated the geographic regions where it operates as its operating segments. The Group’s organization and internal management structure and its reporting system are segmented as follows: Italy and U.K. Branch, Europe (Germany, France, Belgium and the Netherlands, Spain and Portugal, Ireland, Austria, Great Britain, Scandinavia, Czech Republic, Switzerland), North America (United States and Canada) and Rest of the World (Brazil, Mexico, Israel, China, Australia and South Africa). The Group is characterized by an organization of its commercial structure by geographic regions, which was adopted to accommodate the Group’s geographic expansion and strategic initiatives. The logic of this new organization reflects the destination of the Group’s sales, dividing the sales areas into four regions: Europe and Africa, North America, Central and South America, Asia Pacific and China. As a result, the communication of the financial data of the DiaSorin Group to the financial markets and the investing public is being changed to show revenue data aligned with its organization by regions. The tables on the following pages show the Group’s operating and financial data broken down by geographic region. A listing of revenues by customer location is provided in the table included in the corresponding Note that shows a breakdown of sales and service revenues by geographic region. The table that follows shows no unallocated common costs. This is because each country (hence, each segment) has a complete organization (commercial, technical support and administrative) capable of operating independently. In addition, the Italy segment charges quarterly the other segments for costs the Corporate division faces at the central level for assets in favour of the Group’s companies. Eliminations refer primarily to inter-segment margins that are eliminated at consolidation. Specifically, the elimination of the margin earned by the Italy segment through the sale of equipment to other segments is carried out both at the result and investment levels. The margin generated by products sold by the manufacturing locations to the commercial branches but not yet sold to outsiders is eliminated only at the result level. Segment assets include all operating items (non-current assets, receivables and inventory) but not tax-related items (deferred-tax assets) and financial assets, which are shown at the Group level. The same approach was used for segment liabilities, which include operating items (mainly trade payables and amounts owed to employees) but do not include financial and tax liabilities or shareholders’ equity, which are shown at the Group level.
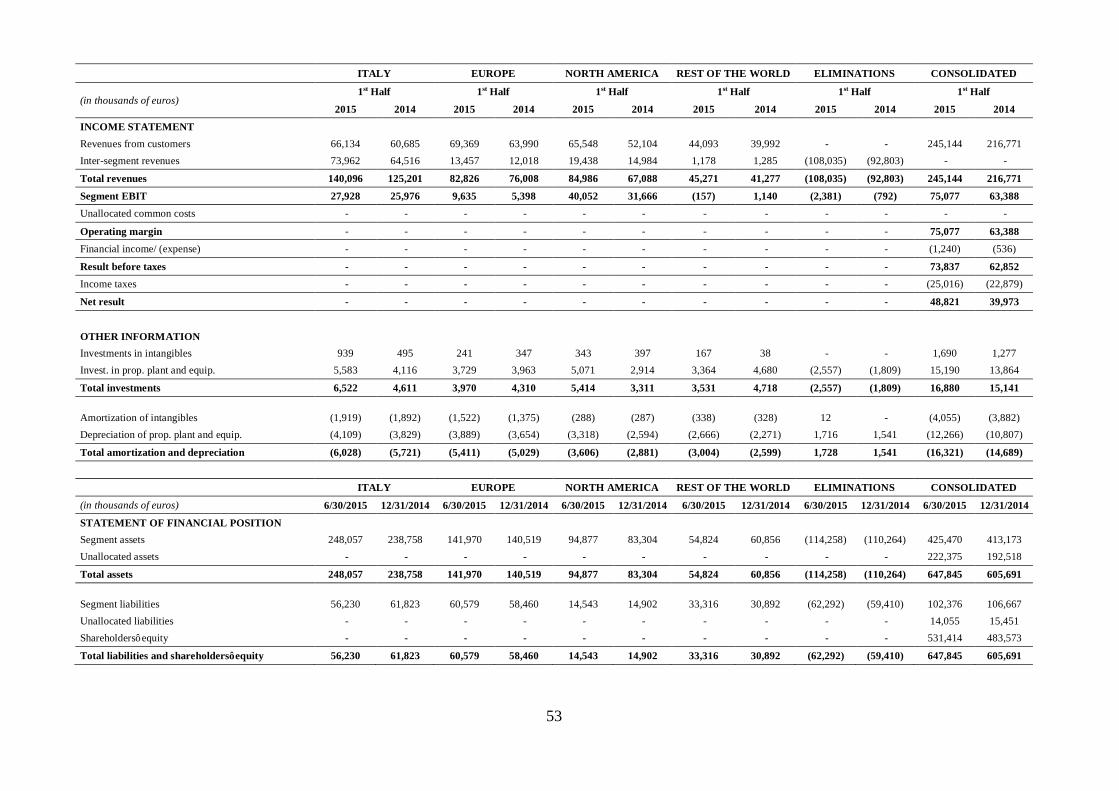
53
ITALY EUROPE NORTH AMERICA REST OF THE WORLD ELIMINATIONS CONSOLIDATED
(in thousands of euros) 1st Half 1st Half 1st Half 1st Half 1st Half 1st Half
2015 2014 2015 2014 2015 2014 2015 2014 2015 2014 2015 2014
INCOME STATEMENT Revenues from customers 66,134 60,685 69,369 63,990 65,548 52,104 44,093 39,992 - - 245,144 216,771 Inter-segment revenues 73,962 64,516 13,457 12,018 19,438 14,984 1,178 1,285 (108,035) (92,803) - -
Total revenues 140,096 125,201 82,826 76,008 84,986 67,088 45,271 41,277 (108,035) (92,803) 245,144 216,771
Segment EBIT 27,928 25,976 9,635 5,398 40,052 31,666 (157) 1,140 (2,381) (792) 75,077 63,388 Unallocated common costs - - - - - - - - - - - -
Operating margin - - - - - - - - - - 75,077 63,388 Financial income/ (expense) - - - - - - - - - - (1,240) (536)
Result before taxes - - - - - - - - - - 73,837 62,852 Income taxes - - - - - - - - - - (25,016) (22,879)
Net result - - - - - - - - - - 48,821 39,973
OTHER INFORMATION Investments in intangibles 939 495 241 347 343 397 167 38 - - 1,690 1,277 Invest. in prop. plant and equip. 5,583 4,116 3,729 3,963 5,071 2,914 3,364 4,680 (2,557) (1,809) 15,190 13,864
Total investments 6,522 4,611 3,970 4,310 5,414 3,311 3,531 4,718 (2,557) (1,809) 16,880 15,141 Amortization of intangibles (1,919) (1,892) (1,522) (1,375) (288) (287) (338) (328) 12 - (4,055) (3,882) Depreciation of prop. plant and equip. (4,109) (3,829) (3,889) (3,654) (3,318) (2,594) (2,666) (2,271) 1,716 1,541 (12,266) (10,807)
Total amortization and depreciation (6,028) (5,721) (5,411) (5,029) (3,606) (2,881) (3,004) (2,599) 1,728 1,541 (16,321) (14,689)
ITALY EUROPE NORTH AMERICA REST OF THE WORLD ELIMINATIONS CONSOLIDATED
(in thousands of euros) 6/30/2015 12/31/2014 6/30/2015 12/31/2014 6/30/2015 12/31/2014 6/30/2015 12/31/2014 6/30/2015 12/31/2014 6/30/2015 12/31/2014
STATEMENT OF FINANCIAL POSITION Segment assets 248,057 238,758 141,970 140,519 94,877 83,304 54,824 60,856 (114,258) (110,264) 425,470 413,173 Unallocated assets - - - - - - - - - - 222,375 192,518
Total assets 248,057 238,758 141,970 140,519 94,877 83,304 54,824 60,856 (114,258) (110,264) 647,845 605,691 Segment liabilities 56,230 61,823 60,579 58,460 14,543 14,902 33,316 30,892 (62,292) (59,410) 102,376 106,667 Unallocated liabilities - - - - - - - - - - 14,055 15,451 Shareholders’ equity - - - - - - - - - - 531,414 483,573
Total liabilities and shareholders’ equity 56,230 61,823 60,579 58,460 14,543 14,902 33,316 30,892 (62,292) (59,410) 647,845 605,691

54
EUROPE AND AFRICA NORTH AMERICA ASIA PACIFIC CENTRAL AND SOUTH AMERICA CONSOLIDATED
(in thousands of euros) 1st Half 1st Half 1st Half 1st Half 1st Half
2015 2014 2015 2014 2015 2014 2015 2014 2015 2014
INCOME STATEMENT
Revenues from customers 117,832 111,724 62,844 49,536 45,002 34,360 19,466 21,151 245,144 216,771

55
DESCRIPTION AND MAIN CHANGES
Consolidated income statement 1. Net revenues In the first six months of 2015, net revenues, which are generated mainly through the sale of diagnostic kits, totalled 245,144 thousand euros, up by 13.1% compared with the first six months of 2014. In the first six months of 2015, net revenues include 4,429 thousand euros for equipment rentals and technical support (3,726 thousand euros in the same period of 2014). 2. Cost of sales Cost of sales totalled 78,810 thousand euros compared with 70,860 thousand euros in the first half of 2014. The cost of sales includes 3,827 thousand euros in royalty expense (3,193 thousand euros in the same period of 2014) and costs incurred to distribute products to end customers equal to 4,271 thousand euros (4,389 thousand euros in the first six months of 2014). The cost of sales also includes the depreciation of medical equipment held by customers, which amounted to 8,750 thousand euros (Euro 7.677 thousand euros in the same period of 2014). 3. Sales and marketing expenses Sales and marketing expenses totalled 48,723 thousand euros in the first six months of 2015 as against 44,055 thousand euros in the first six months of 2014. This item consists mainly of marketing costs incurred to promote and distribute DiaSorin products, costs attributable to the direct and indirect sales force and the cost of the technical support offered together with the Group-owned equipment provided to customers under gratuitous loan contracts. 4. Research and development costs The research and development costs incurred during the first half of 2015, which totalled 12,670 thousand euros (12,376 thousand euros in the first half of 2014), include all of the research and development outlays that were not capitalized (7,327 thousand euros compared with 7,261 thousand euros in the first half of 2014), the costs incurred to register the products offered for sale and meet quality requirements totalling 4,278 thousand euros (4,075 thousand euros in the first six months of 2014) and the amortization of capitalized development costs equal to 1,065 thousand euros (1,040 thousand euros in the first half of 2014). In the first six months of 2015, the Group capitalized new development costs amounting to 840 thousand euros compared with 359 thousand euros in the same period of 2014. 5. General and administrative expenses General and administrative expenses, which include expenses incurred for corporate management activities, Group administration, finance and control, information technology, corporate organization and insurance increased to 26,992 thousand euros in the first half of 2015 from 24,292 thousand euros in the same period of 2014.

56
6. Other operating income (expense) Net other operating expense totalled 2,872 thousand euros (1,800 thousand euros in the first half of 2014). This item reflects other income from operations that cannot be allocated to specific functional areas (such as gains and losses on asset sales, government grants, insurance settlements, reversals of unused provisions, additions to provisions for risks, incidental taxes and fees, out-of-period income and charges). Specifically, this item includes 927 thousand euros in tax charges (788 thousand euros in the first six months of 2014), and 1,547 thousand euros in additions to the allowance for doubtful accounts and provisions for risks and charges (886 thousand euros in the first six months of 2014). 7. Financial expense/ (income) The table below provides a breakdown of financial income and expense:
(in thousands of euros) 1st half 2015 1st half 2014
Fees on factoring transactions (459) (637) Interest and other financial expenses (440) (583) Interest and other financial expenses (280) (314)
Share of the profit/(loss) of equity method investee (316) (159)
Interest and other financial income 1,180 627 Translation differences and fair value measurement of financial instruments (925) 530 Net financial income (expense) (1,240) (536)
Financial income includes 819 thousand euros in interests accrued on the collection of past-due positions owed by public institutes during the first half of 2015 (231 thousand euros in 2014). The currency translation effect includes 363 thousand euros in income from changes in subsidiaries’ financial balances that use currencies different from the Group’s Parent Company currency (476 thousand euros in the first half of 2014) and a loss of 1,288 thousand euros for the closure of financial instruments. 8. Income taxes The income tax expense recognized in the income statement for the first six months of 2015 amounted to 25,016 thousand euros (22,879 thousand euros in the same period of 2014). The tax burden decreased to 33.9% from 36.4% in the first half of 2014, as a result of lower amount of non-deductible taxes withheld on dividends the Group’s Parent Company received from foreign subsidiaries (11,217 thousand euros in 2015 compared with 21,397 thousand euros in 2014) and, lastly, a lower tax rate in Italy following the introduction of regulatory amendments to help economic recovery. 9. Earnings per share Basic earnings per share, amounted to 0.89 euros in the first half of 2015 (0.73 euros in the same period of 2014); diluted earnings per share totalled 0.89 euros in the first half of 2015, compared with 0.73 euros in the first half of 2014. Basic earnings per shares were computed by dividing the net profit attributable to the shareholders by the weighted average number of shares outstanding during the year (54,816,655 at June 30, 2015 and 54,398,257 at June 30, 2014).

57
The dilutive effect of stock option plans granted by DiaSorin S.p.A, determined by excluding tranches assigned to a price higher than the average price of the ordinary shares in 2015, is not relevant. Consolidated statement of financial position 10. Property, plant and equipment The table below shows the changes that occurred in this account as of June 30, 2015:
(in thousands of euros) At
December 31, 2014
Additions Depreciation Divestments Translation differences
Reclassifications and other
changes
At June
30, 2015
Land 2,345 - - - 22 - 2,367 Buildings 4,576 114 (281) - 164 9 4,582 Plant and machinery 8,981 440 (965) (2) 177 2,676 11,307 Manufacturing and distribution equipment 42,504 12,615 (10,299) (794) 1,318 60 45,404 Other assets 7,190 432 (721) (22) 298 (17) 7,160 Construction in progress and advances 6,611 1,589 - (1) 79 (3,044) 5,234
Total property, plant and equipment 72,207 15,190 (12,266) (819) 2,058 (316) 76,054
Additions to manufacturing and distribution equipment include purchases of medical equipment amounting to 10,861 thousand euros, up from 10,299 thousand euros at June 30, 2014. Depreciation for the period totalled 8,750 thousand euros in the first six months of 2015 as against 7,677 thousand euros in the same period in 2014.
11. Goodwill and other intangible assets A breakdown of intangible assets as of June 30, 2015 is as follows:
(in thousands of euros) At
December 31, 2014
Additions Depreciation Translation differences
Reclassifications and other
changes
At June 30, 2015
Goodwill 67,703 - - 1,266 - 68,969 Development costs 13,825 840 (1,065) 276 - 13,876 Concessions, licenses and trademarks 26,175 682 (1,719) 95 281 25,514 Industrial patents and intellectual property rights 9,028 164 (1,239) 19 35 8,007 Advances and other intangibles 219 4 (32) 5 - 196
Total intangible assets 116,950 1,690 (4,055) 1,661 316 116,562
Goodwill amounted to 68,969 thousand euros at June 30, 2015. The upward trend compared with December 31, 2014 reflects the translation effect on the goodwill allocated to the DiaSorin U.S.A., DiaSorin Brazil, and DiaSorin South Africa CGUs, for an amount equal to 1,266 thousand euros.

58
12. Equity investments Equity investments totalled 1,785 thousand euros at June 30, 2015 (506 thousand euros at December 31, 2014). A breakdown of equity investments is provided below:
(in thousands of euros) At December
31, 2014
Additions
Share of the profit/(loss) of
investees accounted for
using the equity method
Translation differences
At June 30, 2015
Equity investment valued using the equity method DiaSorin Trivitron Healthcare Private Limited 479 112 (316) 40 315 Equity investment valued at cost DiaSorin Poland sp. z o.o. - 1,443 - - 1,443 DiaSorin Deutschland Unterstuetzungskasse GmbH 26 - - - 26 Consorzio Sobedia 1 - - - 1
Total equity investments 506 1,555 (316) 40 1,785
DiaSorin Poland was established on February 26, 2015; the company is located in Warsaw. The entire equity investment is held by the Group's Parent company and valued at cost as of June 30, 2015, since the company is not yet operational. Equity investments are valued at cost and they are not consolidated because they are not operational. Their impact on the Group’s total assets and liabilities, financial position and bottom-line result is not material. Moreover, the valuation of these investments by the equity method would not have an effect materially different from that produced by the cost approach. 13. Deferred-tax assets and deferred-tax liabilities Deferred-tax assets amounted to 21,705 thousand euros (22,194 thousand euros at December 31, 2014). They relate to consolidated companies that have deferred-tax assets in excess of deferred-tax liabilities and to consolidation adjustments. Deferred-tax liabilities, which totalled 3,074 thousand euros (3,008 thousand euros at December 31, 2014) relate to consolidated companies that have deferred-tax liabilities in excess of deferred-tax assets. They are shown on the liabilities side of the statement of financial position. The balance reflects the net deferred-tax assets computed on the consolidation adjustments (mainly from the elimination of unrealized gains on intra-Group transactions) and on temporary differences between the asset and liabilities amounts used to prepare the quarterly report and the corresponding amounts used by the consolidated companies for tax purposes. Deferred-tax assets were recognized in the financial statements when their future use was deemed to be probable. The same approach was used to recognize the benefit provided by the use of tax loss carry forwards, most of which, under current laws, can be brought forward indefinitely. Based on the multi-year plans prepared by the Group’s management, the Group is expected to generate sufficient taxable income in future years to allow for the full recovery of the abovementioned amounts. An analysis of deferred-tax assets, net of offsettable deferred-tax liabilities, is provided below:

59
(in thousands of euros) 6/30/2015 12/31/2014 Deferred-tax assets 21,705 22,194 Deferred-tax liabilities (3,074) (3,008) Total net deferred-tax assets 18,631 19,186
14. Other non-current assets Other non-current assets amounted to 2,077 thousand euros at June 30, 2015 (2,884 thousand euros at December 31, 2014). They consist mainly of trade receivable from the Brazilian subsidiary due beyond 12 months. 15. Inventories
A breakdown of inventories, which totalled 106,803 thousand euros is provided below:
(in thousands of euros)
6/30/2015 12/31/2014
Gross amount
Provisions for write-
downs
Net amount
Gross amount
Provisions for write-
downs
Net amount
Raw materials and supplies 32,006 (2,074) 29,932 30,202 (1,804) 28,398 Semi-finished goods 41,648 (2,747) 38,901 40,834 (2,758) 38,076 Finished goods 39,789 (1,819) 37,970 36,426 (1,580) 34,846 Total 113,443 (6,640) 106,803 107,462 (6,142) 101,320
The increase of 5,483 thousand euros in ending inventories compared with December 31, 2014 (out of which 2 million euros related to the exchange rate effect), is due to the increase in manufacturing volumes to support growing revenues. The table below shows the changes that occurred in the provisions for inventory write-downs: (in thousands of euros) 6/30/2015 12/31/2014 Opening balance 6,142 5,971 Additions for the period 897 2,105 Utilizations/Reversals for the period (602) (2,242) Translation differences and other changes 203 308 Ending balance 6,640 6,142
16. Trade receivables Trade receivables totalled 112,582 thousand euros at June 30, 2015 (109,521 thousand euros at December 31, 2014). The table that follows shows the changes that occurred in the allowance for doubtful accounts, which amounted to 9,991 thousand euros, compared with December 31, 2014: (in thousands of euros) 6/30/2015 12/31/2014 Opening balance 8,882 8,100 Additions for the period 1,583 1,507 Utilizations/Reversals for the period (277) (791) Translation differences and other changes (197) 66 Ending balance 9,991 8,882
60
In order to bridge the gap between contractual payment terms and actual collection times, the Group uses factoring transactions to assign its receivables without recourse. In the first six months of 2015, the receivables assigned by the Group’s Parent Company amounted to 17,812 thousand euros (21,638 thousand euros in the same period of the previous year). 17. Other current assets Other current assets amounted to 11,392 thousand euros (10,291 thousand euros at December 31, 2014). They consist of accrued income and prepaid expenses (3,220 thousand euros) for insurance, interest, rentals and government grants, tax credits for tax prepayments and for foreign taxes withheld (4,819 thousand euros). 18. Cash and current financial assets
Cash and cash equivalents amounted to 141,626 thousand euros. They consist of balances in banks accounts and short-term bank deposits. At December 31, 2014 this item totalled 144,855 thousand euros. More detailed information is provided in the Statement of Cash Flows above. Current financial assets amounted to 57,259 thousand euros at June 30, 2015 (24,963 thousand euros at December 31, 2014) and include short-term cash investments that do not qualify as cash equivalents, as defined in Paragraph 7 of IAS 7, because the overall term of the securities involved was longer than three months at the date of purchase. In particular, other current financial assets include term deposits exceeding three months opened by the Group Parent Company in the first six months of 2015 (30 million euros) and the U.S. subsidiary (USD 30 million). No penalties will be applied in case of prematurely closure and interests will not be paid. 19. Shareholders’ equity Share capital At June 30, 2015, the fully paid-in share capital consisted of 55,948,257 million common shares, par value of 1 euro each. No changes occurred compared with December 31, 2014. Treasury shares At June 30, 2015, treasury shares amounted to 26,968 thousand euros. The decrease of 17,077 thousand euros compared with December 31, 2014 is due to the exercise of some tranches of the 2010 stock option Plan by the Group’s Parent company employees and its subsidiaries. Additional paid-in capital This reserve amounted to 18,155 thousand euros at June 30, 2015 and no changes occurred compared with December 31, 2014. Statutory reserve This reserve amounted to 11,190 thousand euros at June 30, 2015 and no changes occurred compared with December 31, 2014.

61
Other reserves and retained earnings
A breakdown of other reserves and retained earnings is as follows: (in thousands of euros) 6/30/2015 12/31/2014 Change Currency translation reserve 26,903 12,322 14,581 Reserve for treasury shares 26,968 44,045 (17,077) Stock option reserve 1,376 4,781 (3,405) Gains/(losses) on remeasurement of defined benefit plans (7,350) (7,537) 187 Retained earnings 379,002 307,271 71,731 IFRS transition reserve (2,973) (2,973) - Other reserves 342 342 - Total Other reserves and retained earnings 424,268 358,251 66,017 of which minority interest 222 204 18
Currency translation reserve The translation adjustments reserve includes the exchange differences arising from the translation of equity of consolidated subsidiaries, whose financial statements are denominated in foreign currencies, at the exchange rate in effect at the end of the year. This reserve increased by 14,581 thousand euros, due mainly to changes in the exchange rates of the US dollar vis-à-vis the euro. It also reflects the adjustment made to the value of the goodwill allocated to CGUs with reporting currencies different from the euro (1,266 thousand euros). Reserve for treasury shares At June 30, 2015, the reserve for treasury shares amounted to 26,968 thousand euros. This reserve was established pursuant to law (Article 2357 ter of the Italian Civil Code) due to purchases of treasury shares made during 2011. The change of 17,077 thousand euros compared with December 31, 2014 is due to the exercise of some tranches of the 2010 stock option Plan. Stock option reserve The balance in the stock option reserve, which amounted to 1,376 thousand euros refers to the stock option plans in effect at June 30, 2015. The changes in the reserve that occurred at June 30, 2015 included both an increase due to the recognition of the overall cost of the stock option Plans (620 thousand euros) that was posted and recognized in the income statement as a labour costs included in general and administrative expenses, and a decrease of 4,025 thousand euros as a result of the options exercised throughout 2015. Gains/(losses) on remeasurement of defined benefit plans At June 30, 2015 this item, negative by 7,350 thousand euros, includes net gains of the period related to the actuarial assessment of the Group’s defined-benefit plans amounting to 187 thousand euros, net of tax effect (71 thousand euros). Retained earnings The change in retained earnings, equal to 71,731 thousand euros compared with December 31, 2014, is due to:
• the appropriation of the consolidated net profit earned by the Group in 2014 (84,074 thousand euros);
• the dividend distribution to the shareholders, amounting to 32,936 thousand euros, and approved in the Shareholders’ Meeting held on April 22, 2015 (equal to 0.60 euros per share);

62
• the exercise of some tranches of the 2010 Stock Option Plan, which resulted in a positive change of 20,593 thousand euros and in the sale of treasure shares.
IFRS transition reserve The IFRS transition reserve was established on January 1, 2005, upon first-time adoption of the IFRSs as an offset to the adjustments recognized to make the financial statements prepared in accordance with Italian accounting principles consistent with IFRS requirements, net of the applicable tax effect (as required by and in accordance with IFRS 1). This reserve has not changed since it was first established. Other reserves This item includes the consolidation reserve equal to 904 thousand euros, net of the discounted repurchase price of the Chinese subsidiary’s minority interest together with the put option right granted to the minority shareholder amounting to 562 thousand euros. 20. Borrowings and other financial liabilities Borrowings and other financial liabilities include a long-term portion totalling 106 thousand euros and a current portion amounting to 2,808 thousand euros. A breakdown of long-term borrowings is as follows (values in thousands):
Lender Currency Current portion Non-current portion
Amount due after 5 years Total
Santander BRL 9,000 - - 9,000 Amount is € 2,594 - 2,594 IMI MIUR € 213 106 - 319 Finance leases € 1 - - 1 Total owed to financial institutions 2,808 106 - 2,914
The table below lists the changes that occurred in the facilities outstanding as of June 30, 2015 compared with December 31, 2014 (amounts in thousands of euros):
Lender At December 31, 2014 Repayments
Currency translation differences
Amortized cost effect
At June 30, 2015
Santander 2,795 - (201) - 2,594 IMI MIUR 418 (107) - 8 319 Finance leases 4 - (3) - 1 Total owed to financial institutions 3,217 (107) (204) 8 2,914
The following amount of 107 thousand euros was repaid to IMI-MIUR in the first half of 2015. There were no changes in contract terms compared with December 31, 2014 and DiaSorin was in compliance with all of the operating and financial covenants of the existing loan agreements.

63
21. Provisions for employee severance indemnities and other employee benefits The balance in this account reflects all of the Group pension plan obligations, other post-employment benefits and benefits payable to employees when certain requirements are met. Group companies provide post-employment benefits to their employees by contributing to external funds and by funding defined- contribution and/or defined-benefit plans. The manner in which these benefits are provided varies depending on the applicable statutory, tax-related and economic conditions in the countries where Group companies operate. As a rule, benefits are based on each employee’s level of compensation and years of service. Defined-contribution plans Certain Group companies pay contributions to private funds or insurance companies pursuant to a statutory or contractual obligation or on a voluntary basis. With the payment of these contributions, the companies in question absolve all of their obligations. The liability for contributions payable is included under other current liabilities. The cost attributable to each year, which accrues based on the services provided by employees, is recognized as a labour cost of the relevant organizational unit. Defined-benefit plans The Group’s pension plans that qualify as defined-benefit plans include the provisions for employee severance indemnities in Italy, the Alecta system in Sweden and the U-Kasse pension plan and Direct Covenant system in Germany. The liability owed under these plans is recognized at its actuarial value using the projected unit credit method; actuarial gains and losses resulting from the determination of these liabilities are credited or charged to equity in the statement of comprehensive income in the period in which they arise. Other benefits The Group also provides its employees with additional long-term benefits, which are paid when employees reach a predetermined length of service. In these cases, the value of the liability recognized in the financial statements reflects the probability that these benefits will be paid and the length of time for which they will be paid. The liability owed under this plan is recognized at its actuarial value using the projected unit credit method. Actuarial gains and losses resulting from the determination of these items are recognized in the income statement.

64
The table that follows lists the Group’s main employee benefit plans that are currently in effect:
(in thousands of euros) 6/30/2015 12/31/2014 Change Employee benefits provided in: - Italy 5,638 6,144 (506) - Germany 22,815 22,471 344 - Sweden 3,042 3,003 39 - other countries 507 488 19 Total employee benefits 32,002 32,106 (104) Broken down as follows: - Defined-benefit plans:
provision for employee severance indemnities 4,389 4,793 (404)
other defined-benefit plans 25,857 25,474 383 30,246 30,267 (21)
- Other long-term benefits 1,756 1,839 (83)
Total employee benefits 32,002 32,106 (104) The table below shows the main changes that occurred in the Group’s employee benefit plans in the first six months of 2015 (amounts in thousands of euros):
(in thousands of euros) Defined-benefit plans Other benefits Total employee
benefits Balance at 12/31/2014 30,267 1,839 32,106 Financial expense/(income) 279 1 280 Actuarial losses/(gains) recognized in income statement - (61) (61) Actuarial losses/(gains) recognized directly in equity (258) - (258) Current service cost 394 63 457 Benefits paid (494) (87) (581) Translation differences and other changes 58 1 59 Balance at 6/30/2015 30,246 1,756 32,002
22. Other non-current liabilities Other non-current liabilities of 3,735 thousand euros at June 30, 2015 (4,677 thousand euros at December 31, 2014) include provisions for risks and charges established in connection with pending or contingent legal disputes and for supplemental severance benefits owed to sales agents.
The table below lists the various provisions for risks and charges: (in thousands of euros) 6/30/2015 12/31/2014 Opening balance 3,679 3,858 Additions for the period 152 876 Utilizations/Reversals for the period (1,055) (1,065) Translation differences and other changes (23) 10 Ending balance 2,753 3,679

65
23. Trade payables Trade payables totalled 39,628 thousand euros at June 30, 2015 (39,311 thousand euros at December 31, 2014) and include amounts owed to external suppliers for the purchase of goods and services. There are no amounts due after one year. 24. Other current liabilities Other current liabilities of 27,011 thousand euros at June 30, 2015 (30,573 thousand euros at December 31, 2014) consist mainly of amounts owed to employees for additional monthly payments to be paid (17,596 thousand euros), contributions payable to social security and health benefit institutions (2,110 thousand euros) and accruals and deferred charges (2,788 thousand euros). 25. Income taxes payable The balance of 8,067 thousand euros at June 30, 2015 (8,967 thousand euros at December 31, 2014) represents the amounts owed to the revenue administration for the income tax liability for the period and for other taxes and fees. 26. Commitments and contingent liabilities Significant commitments and contractual obligations Significant contractual obligations include the agreements executed by DiaSorin S.p.A., the Group’s Parent Company, and Stratec in connection with the development and production of the new chemiluminescent diagnostic system (LIAISON XL). The supply contract signed by DiaSorin and Stratec calls for the latter to manufacture and supply exclusively to DiaSorin the LIAISON XL analyser. The Group has agreed to purchase a minimum number of systems. However, the projected commitment is deemed to be significantly lower than the normal level of capital investment that would be required for current or future equipment production. As a result, net invested capital is not expected to undergo significant structural changes in the future as a result of this commitment. Contingent liabilities The DiaSorin Group operates globally. As a result, it is exposed to the risks that arise from the complex laws and regulations that apply to its commercial and manufacturing activities. The Group believes that, overall, the amounts set aside for pending legal disputes in the corresponding provision for risks are adequate. 27. Entries resulting from atypical and/or unusual transactions As required by Consob Communication No. DEM/6064296 of July 28, 2006, the Company declares that, in the first half of 2015, the Group did not execute atypical and/or unusual transactions, as defined in the abovementioned Communication, according to which atypical and/or unusual transactions are transactions that, because of their significance/material amount, type of counterpart, subject of the transaction, method of determining the transfer price and timing of the event (proximity to the end of a reporting period), could create doubts with regard to: the fairness/completeness of the financial statement disclosures, the existence of a conflict of interest, the safety of the corporate assets and the protection of minority shareholders.

66
ANNEX I: THE COMPANIES OF THE DIASORIN GROUP AT JUNE 30, 2015
Head office location Currency Share
capital (*)
Par value per share
or partnership
interest
% interest
held directly
Number of shares or
partnership interests held
Equity investments consolidated line by line
DiaSorin S.A/N.V. Bruxelles (Belgium) EUR 1,674,000 6,696 99.99% 249
DiaSorin Ltda Sao Paulo (Brazil) BRL 30,380,977 1 99.99% 30,380,976
DiaSorin S.A. Antony (France) EUR 960,000 15.3 99.99% 62,492
DiaSorin Iberia S.A. Madrid (Spain) EUR 1,453,687 6.01 99.99% 241,877
DiaSorin Ltd Oldbury (UK) GBP 500 1 100.00% 500
DiaSorin Inc. Stillwater USA USD 1 0.01 100.00% 100
DiaSorin Canada Inc Mississauga (Canada)
CAD 200,000 N/A - 100 Class A common shares
DiaSorin Mexico S.A de C.V. Mexico City (Mexico)
MXP 63,768,473 1 99.99% 49,999
DiaSorin Deutschland GmbH Dietzenbach (Germany) EUR 275,000 275,000 100.00% 1
DiaSorin AB Solna (Sweden) SEK 5,000,000 100 100.00% 50,000
DiaSorin Ltd Rosh Haayin (Israel) ILS 100 1 100.00% 100
DiaSorin Austria GmbH Wien (Austria) EUR 35,000 35,000 100.00% 1
DiaSorin Czech s.r.o. Prague (Czech Republic)
CZK 200,000 200,000 100.00% 1
DiaSorin Diagnostics Ireland Limited Dublin (Ireland) EUR 3,923 0.01 100.00% 392,282
DiaSorin Ireland Limited Dublin (Ireland) EUR 163,202 1.20 - 136,002
DiaSorin I.N.UK Limited Dublin (Ireland) EUR 7,826,072 0.01 - 782,607,110
DiaSorin South Africa (Pty) Ltd Johannesburg South Africa ZAR 101 1 100.00% 101
DiaSorin Australia (Pty) Ltd Sydney (Australia) AUD 3,300,000 33,000 100.00% 100
DiaSorin Ltd Shanghai (China) RMB 1,211,417 1 80.00% 96,000
DiaSorin Switzerland AG Risch (Switzerland) CHF 100,000 100 100.00% 1,000
(*) Amounts stated in the local currency.

67
Company Head office location Currency Share capital
(*)
Par value per share
or partnership
interest
% interest
held directly
Number of shares or partnership interests
held
Equity investment valued using the equity method DiaSorin Trivitron Healthcare Private Limited Chennai
(India) INR 212,295,610 10 - 10,827,076
Equity investment valued at cost DiaSorin Poland sp. z o.o. Warsaw
(Poland) PLN 500,000 50 100.00% 100
DiaSorin Deutschland Unterstuetzungskasse GmbH
Dietzenbach (Germany) EUR 25,565 1 - 1
Consorzio Sobedia Saluggia (Italy) EUR 5,000 N/A 20.00% 1
(*) Amounts stated in the local currency.

68
CERTIFICATION OF THE CONDENSED SEMIANNUAL CONSOLIDATED FINANCIAL STATEMENTS PURSUANT TO ARTICLE 81-TER OF CONSOB REGULATION NO. 11971 OF MAY 14, 1999, AS AMENDED We, the undersigned, Carlo Rosa, in my capacity as Chief Executive Officer, and Luigi De Angelis, in my capacity as Corporate Accounting Document Officer of DiaSorin S.p.A, attest that, insofar as the provisions of Article 154-bis, Sections 3 and 4, of Legislative Decree No. 58 of February 24, 1998 are concerned, the administrative and accounting procedures applied during the first half of 2015 to prepare the condensed semiannual consolidated financial statement were: a) adequate in light of the Company’s characteristics; and
b) were applied effectively. Moreover, we attest that the condensed semiannual consolidated financial statements: a) were prepared in accordance with the applicable international accounting principles, as adopted
by the European Union pursuant to Regulation (CE) No. 1606/2002 of the European Parliament and Council dated July 19, 2002;
b) correspond to the Company’s books of accounts and bookkeeping entries; c) are suitable for the purpose of providing a truthful and fair representation of the statement of
financial position, operating performance and cash flow of the issuer and of the companies included in the scope of consolidation.
To the best of our knowledge, the interim Report on Operations provides a reliable analysis of significant events that occurred during the first half of the year and of their impact on the condensed semiannual financial statements, together with a description of the main risks and uncertainties for the remaining six months of the year. The interim Report on Operations also provides a reliable analysis of information concerning transactions with related parties. Saluggia, July 30, 2015 Signed: Carlo Rosa Luigi De Angelis Chief Executive Officer Corporate Accounting Document Officer

69

70