Embed Size (px)
Citation preview
ORIGINAL ARTICLE
Semi-targeted metabolomic approaches to validate potentialmarkers of health for micronutrients: analytical perspectives
Marie-Laure Bayle • Suzan Wopereis •
Jildau Bouwman • Ben van Ommen •
Augustin Scalbert • Estelle Pujos-Guillot
Received: 17 December 2011 / Accepted: 12 March 2012
� Springer Science+Business Media, LLC 2012
Abstract Recommended dietary allowances for micronu-
trients fluctuate noticeably within European Union coun-
tries. The Network of Excellence EURRECA (EURopean
micronutrient RECommendations Aligned) aims at har-
monising micronutrient intake recommendations through
population groups. The lack of proper markers of status for
some micronutrients limits progress in this area: metabolo-
mics could help identifying such new markers. We devel-
oped an original metabolomic strategy in order to monitor
the largest fraction of a list of[270 metabolites known to be
influenced by the micronutrients of interest. To improve the
coverage of these metabolites in plasma, a multi platform
approach was performed using both liquid and gas chroma-
tography coupled to mass spectrometry. A sample prepara-
tion protocol based on a three-step plasma fractionation has
been set up, using both liquid and solid phase extractions.
Four fractions were obtained containing respectively polar
metabolites, neutral lipids, free fatty acids and polar lipids.
Recoveries were determined using spiked plasma samples,
and the advantages and drawbacks of the fractionation
method compared to a commonly used single preparation
step method were investigated in terms of metabolites
detection and robustness. Fractionation improved coverage
of the endogenous metabolome more than twice in terms of
extracted features, allowing to identify 90 metabolites.
Keywords Mass spectrometry � Plasma � Metabolomics �GC–MS � UPLC � QTOF � Fractionation
1 Introduction
Nutritional recommendations are established to guide
public health policy makers for an optimal diet composi-
tion to maintain good health. Large discrepancies exist in
European Union between intake level recommendations for
the different population groups, especially for micronutri-
ents. The Network of Excellence EURRECA (EURopean
micronutrient RECommendations Aligned, http://www.eur
reca.org) supported by the EU 6th framework programme
aims at assessing disparities between countries (Pijls et al.
2009; Doets et al. 2008; Ashwell et al. 2008). Both popu-
lation variability and differences in the interpretation of
scientific evidence could explain these discrepancies
(Dhonukshe-Rutten et al. 2010). One of the objectives of
Eurreca was to investigate the influence of individuality
and if recommendations could be addressed to population
subgroups expressing different phenotypes and genotypes
(Pijls et al. 2009). Metabolomics offers new possibilities
better describe the phenotype of individuals and in this way
facilitate subgroup definition. Responses on nutrient
interventions can be studied at the basis of the underlying
M.-L. Bayle � E. Pujos-Guillot (&)
Platform of Metabolism Exploration,
Human Nutrition Department, UMR 1019,
INRA, 63122 Saint-Genes-Champanelle, France
e-mail: [email protected]
S. Wopereis � J. Bouwman � B. van Ommen
Department of Biosciences, TNO-Quality of Life,
P.O. Box 360, 4700 AJ Zeist, The Netherlands
A. Scalbert
Micronutrients, Metabolism and Health,
Human Nutrition Department, UMR 1019,
INRA, 63122 Saint-Genes-Champanelle, France
A. Scalbert
Nutrition and Metabolism Section, Biomarkers Group,
International Agency for Research on Cancer (IARC),
150 Cours Albert Thomas, 69372 Lyon Cedex 08, France
123
Metabolomics
DOI 10.1007/s11306-012-0419-3
processes, thereby facilitating predicting the combined
effect of complex nutrient supplementation.
Metabolomics has been defined as the measurement of
multivariate metabolic response of a cellular system
(Nicholson and Wilson 2003). Although not yet a techni-
cally mature approach, metabolomics has been more
commonly used (Kell 2004), and applied to various
domains including nutrition (Zeisel et al. 2005; Wishart
2008; Van Ommen and Stierum 2002; Scalbert et al. 2009;
Gibney et al. 2005). With the help of metabolomics sci-
entific research is now moving towards personalised
medicine (Van der Greef et al. 2006) and personalised
nutrition (Van Ommen et al. 2008). The volume of meta-
bolic information collected in metabolomics studies allows
the construction of a ‘‘chemical space’’ (Dobson 2004;
Lipinski and Hopkins 2004), overlapping with a ‘‘health
space’’ in which individuals can be localized and move
according to age, disease and diet (Van Ommen et al.
2008).
Metabolomics allows capturing much of this chemical
information. Two complementary approaches can be dis-
tinguished: global metabolic fingerprinting where the limit
for collecting semi-quantitative information is the analyti-
cal equipment used, and quantitative metabolite profiling
similar to the classical multi-residue analytical methods
(Dettmer et al. 2007).Various approaches have been
developed, depending on how extensive the metabolome
coverage is and if quantification is considered (Fiehn
2002). This study focused on metabolic fingerprinting and
the comparison of metabolic profiles dependent of the
micronutrient status. Various techniques have been used
for metabolic fingerprinting, and more particularly NMR
spectroscopy, mass spectrometry coupled to liquid chro-
matography or gas chromatography, capillary electropho-
resis and vibrational spectroscopy (Dunn et al. 2005).
Advantages and drawbacks have been discussed (Wishart
2008), and mass spectrometry has been quite often
favoured for its sensitivity. Coupled to chromatography, it
reduces the amount of sample matrix and co-eluting com-
pounds that interfere in the ionisation source and therefore
increases the number of detected molecules and features.
Resulting data are processed with extraction and alignment
softwares such as XCMS (Smith et al. 2006), MarkerLynx
(Waters) or MZmine (Katajamaa et al. 2006) and can be
normalised with internal standards or regressions based on
pooled samples injected throughout the sequence (Van der
Kloet et al. 2009). Multivariate statistical analyses are
applied to the set of data to highlight differentiating fea-
tures, such as ions for mass spectrometry spectra. Identi-
fication is now performed using high resolution instruments
as the Orbitrap mass spectrometer (Hu et al. 2005) and
databases such as HMDB (Wishart et al. 2007), KEGG
(Kyoto Encyclopedia of Genes and Genome) or MassBank
(Horai et al. 2010). Special care must be given to the terms
employed to describe a differentiating metabolite before it
can be named without any doubt as a biomarker in the
identification process (Chen et al. 2008; Kind and Fiehn
2007), as several qualification steps are required (Koulman
et al. 2009).
To increase the throughput of mass spectrometry anal-
yses, direct injection (Dettmer et al. 2007) or short chro-
matographic runs (Boccard et al. 2007) have been used.
However, one of the drawbacks of these methods is that ion
suppression due to electrospray ionisation is more readily
to occur, increasing the limit of the detection and hindering
ionization of some metabolites (King et al. 2000). The use
of a relatively long chromatographic run reduces compe-
tition for ionisation of co-eluted metabolites and improves
reproducibility and detection capabilities (Issaq et al. 2008;
Guy et al. 2008).
To maximize metabolite coverage in biological experi-
ments using metabolomic approach, it has been advised to
use a multi-platform approach combining different mass
spectrometers, different ionization modes and different
chromatographic methods, each method being adapted to
particular classes of metabolites (Nordstrom et al. 2008;
Halket et al. 2005). Sana et al. (2008) increased by 34 %
the number of detected features from erythrocytes by
combining APCI and ESI. Buscher et al. (2009) further
investigated this point by studying the detection of 91
metabolites by LC–MS, GC–MS and CE–MS, with 75
compounds having distinct molecular weights. They found
that the broadest coverage is obtained with LC–MS with 64
compounds detected, and therefore advised to use LC as
principal technique.
In the present work, we study analytical coverage of a
pre-defined list of plasma metabolites of interest for char-
acterizing micronutrient status. As the Eurreca project is
dedicated to the study of micronutrient metabolism, the
method development was based on a set of metabolites
considered to play a role in the control of the status of a
few selected micronutrients. Three micronutrients (sele-
nium, folate, vitamin B12) were prioritised and their met-
abolic networks built using the Wikipathway editing tool
(the micronutrient networks are published on the micro-
nutrient portal of wikipathways http://wikipathways.org/
index.php/Portal:Micronutrient). These micronutrient-net-
works contained four levels of micronutrient related bio-
markers: (1) markers of exposure to the micronutrient; (2)
markers of target function/biological response; (3) health
parameters related to micronutrient function and (4) dis-
ease parameters related to micronutrient dysfunction. Fur-
thermore, connections to other micronutrients were added
to these networks (Van Ommen et al. 2008). All metabo-
lites being part of these pathways were gathered in a
‘‘wishlist’’, i.e. the list of metabolites that need to be
M. Bayle et al.
123
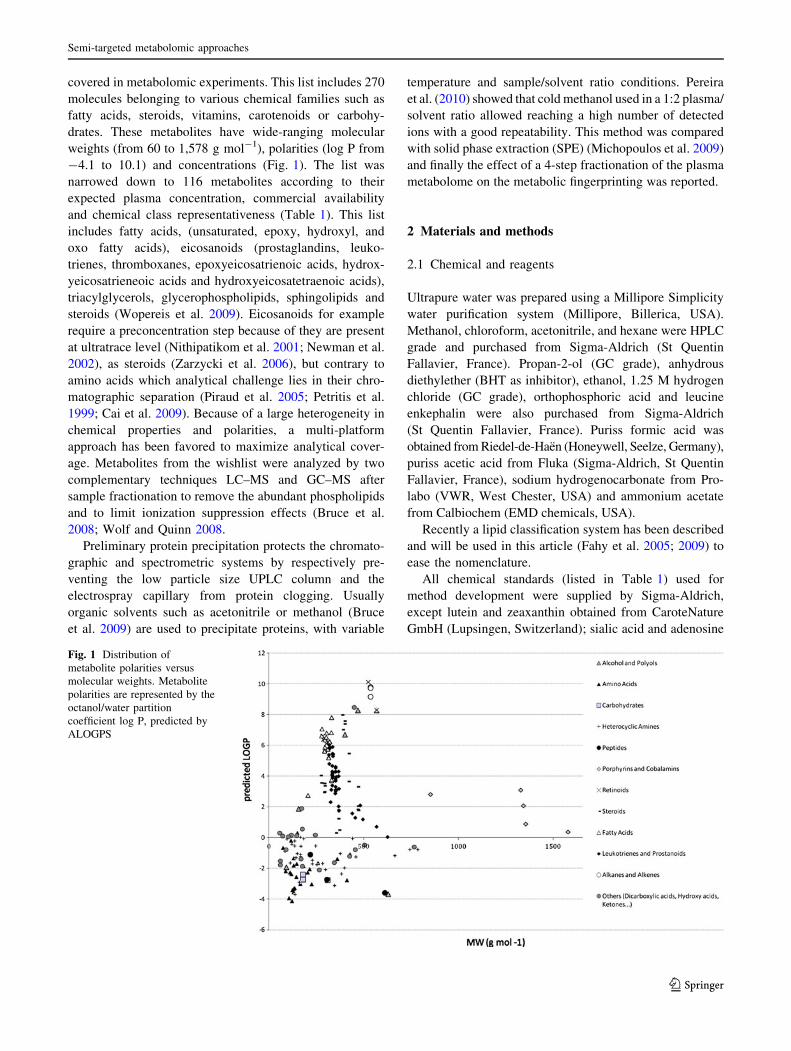
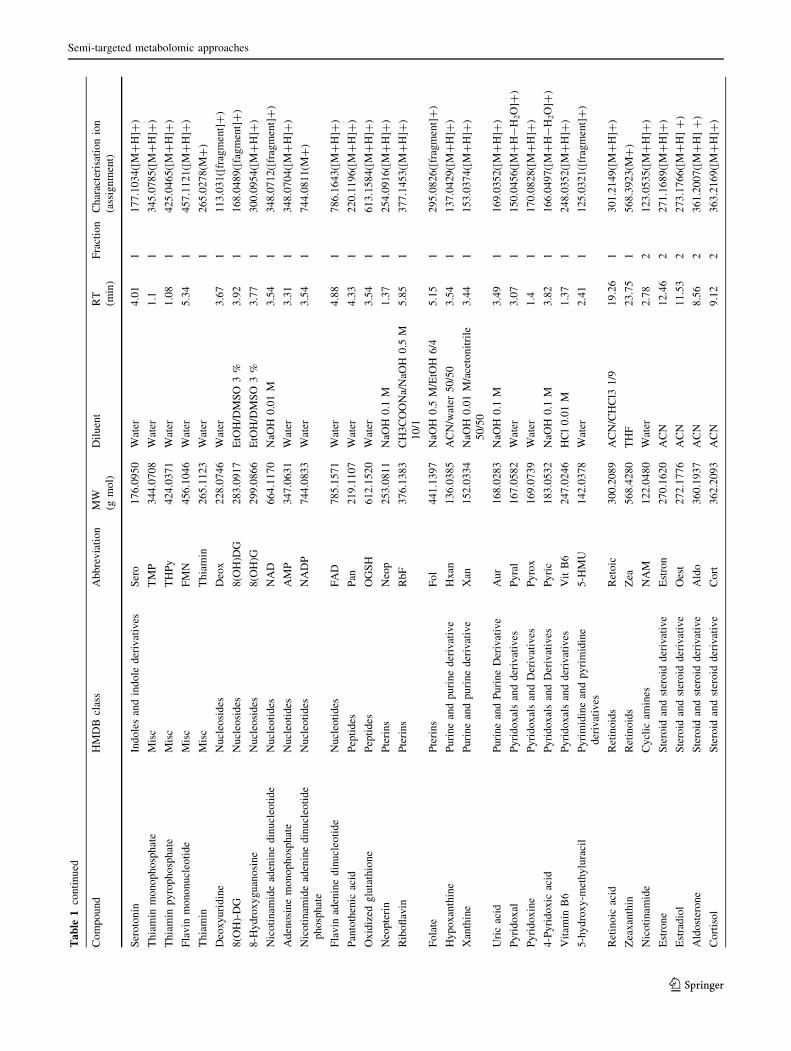
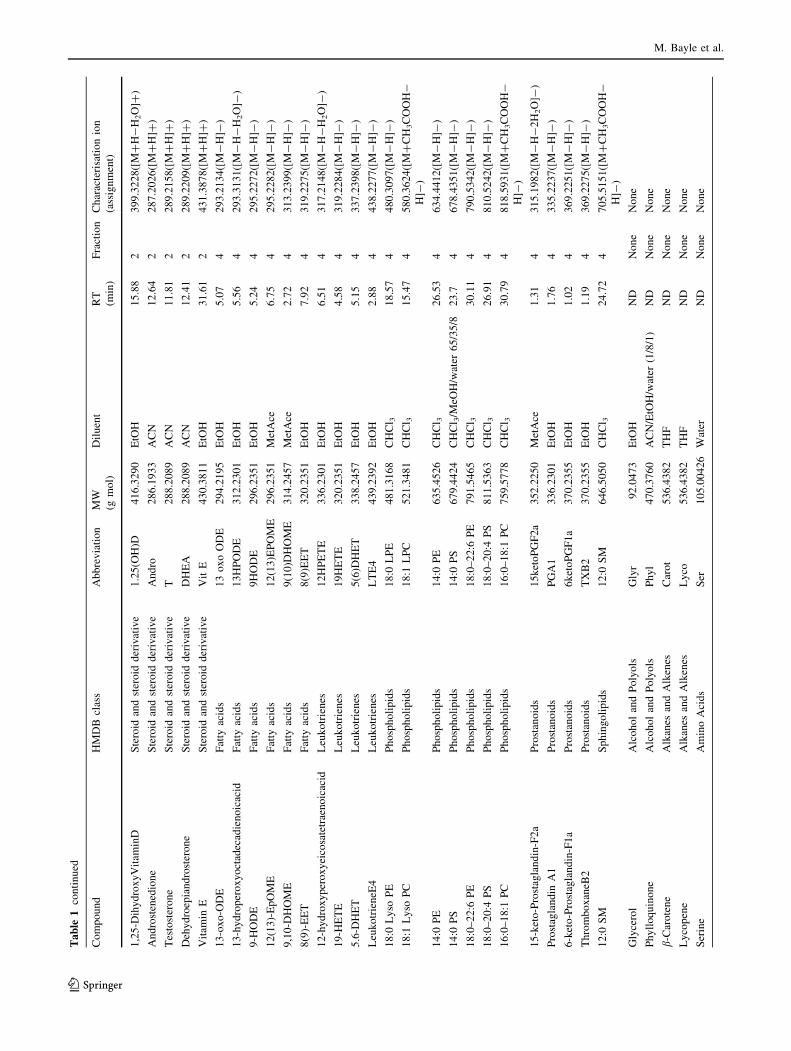
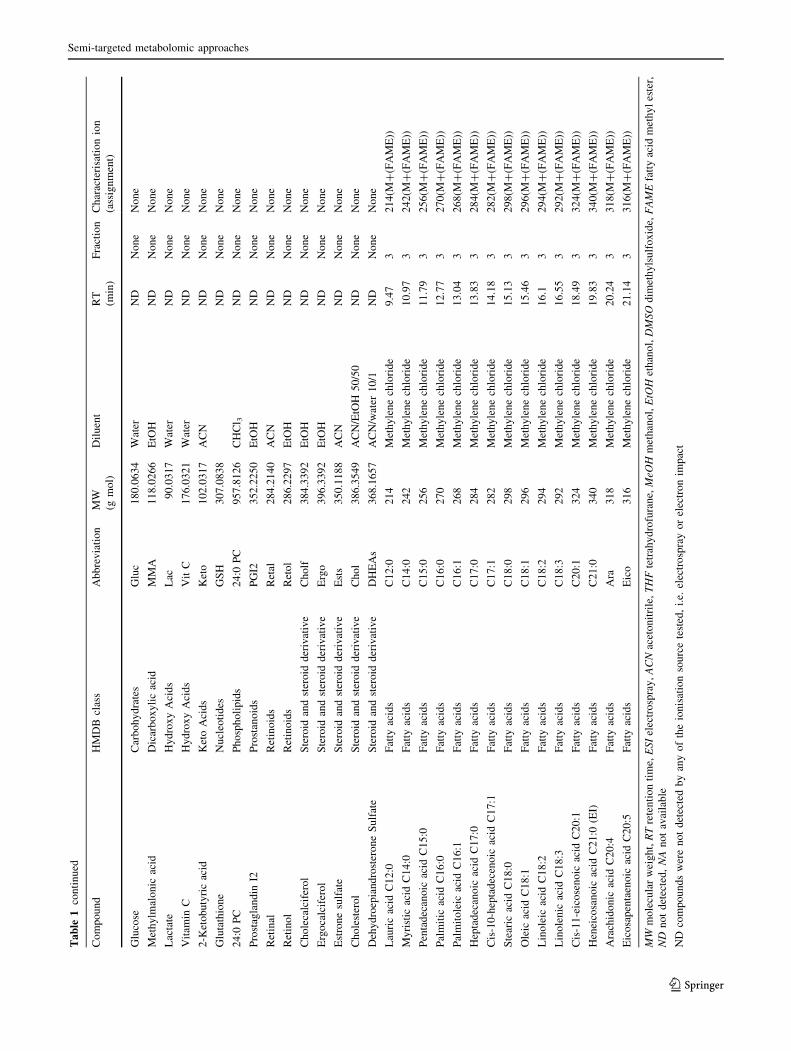
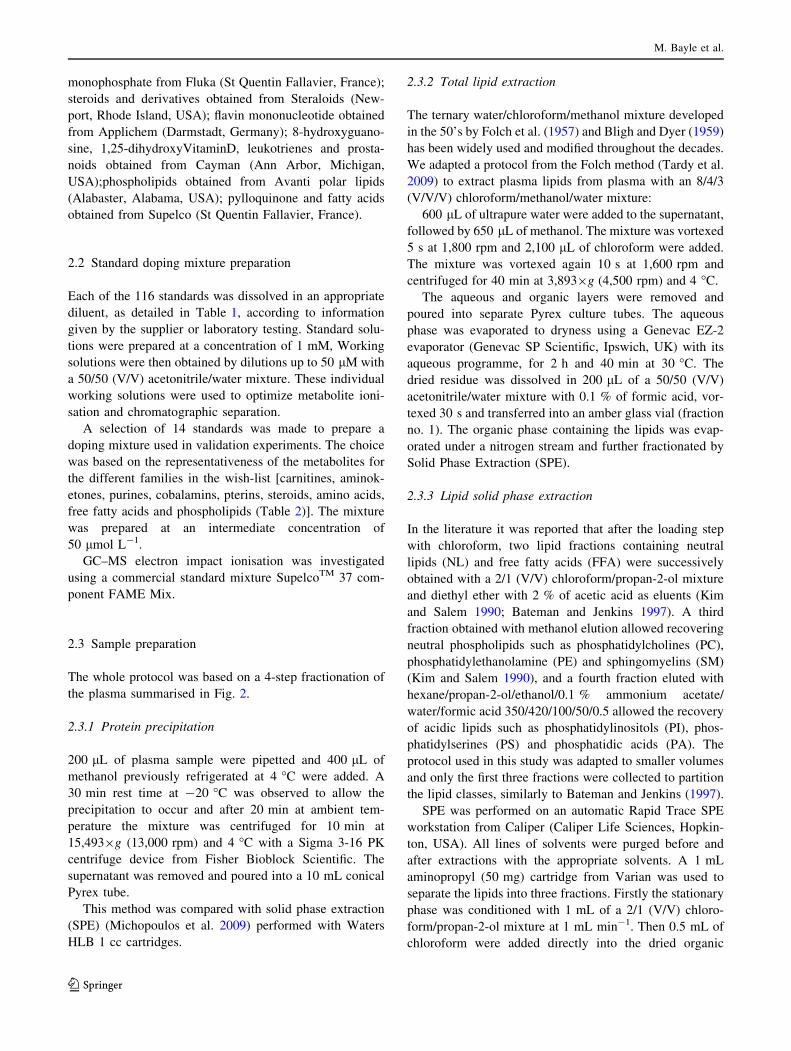
covered in metabolomic experiments. This list includes 270
molecules belonging to various chemical families such as
fatty acids, steroids, vitamins, carotenoids or carbohy-
drates. These metabolites have wide-ranging molecular
weights (from 60 to 1,578 g mol-1), polarities (log P from
-4.1 to 10.1) and concentrations (Fig. 1). The list was
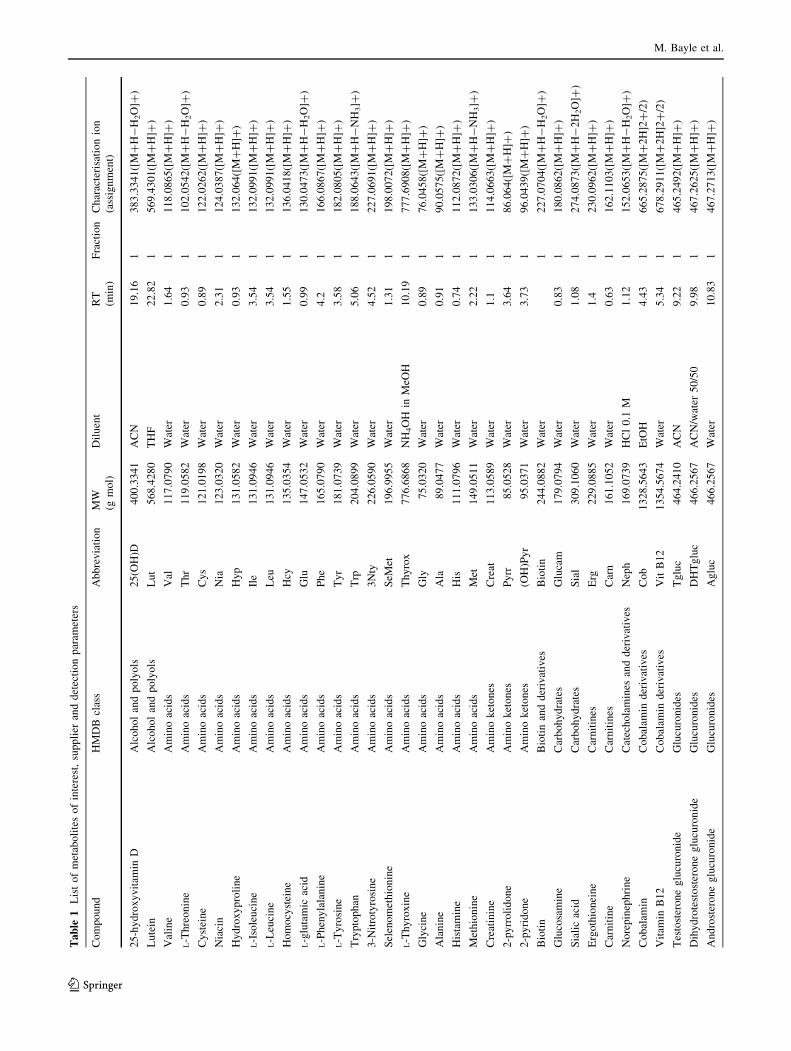
narrowed down to 116 metabolites according to their
expected plasma concentration, commercial availability
and chemical class representativeness (Table 1). This list
includes fatty acids, (unsaturated, epoxy, hydroxyl, and
oxo fatty acids), eicosanoids (prostaglandins, leuko-
trienes, thromboxanes, epoxyeicosatrienoic acids, hydrox-
yeicosatrieneoic acids and hydroxyeicosatetraenoic acids),
triacylglycerols, glycerophospholipids, sphingolipids and
steroids (Wopereis et al. 2009). Eicosanoids for example
require a preconcentration step because of they are present
at ultratrace level (Nithipatikom et al. 2001; Newman et al.
2002), as steroids (Zarzycki et al. 2006), but contrary to
amino acids which analytical challenge lies in their chro-
matographic separation (Piraud et al. 2005; Petritis et al.
1999; Cai et al. 2009). Because of a large heterogeneity in
chemical properties and polarities, a multi-platform
approach has been favored to maximize analytical cover-
age. Metabolites from the wishlist were analyzed by two
complementary techniques LC–MS and GC–MS after
sample fractionation to remove the abundant phospholipids
and to limit ionization suppression effects (Bruce et al.
2008; Wolf and Quinn 2008.
Preliminary protein precipitation protects the chromato-
graphic and spectrometric systems by respectively pre-
venting the low particle size UPLC column and the
electrospray capillary from protein clogging. Usually
organic solvents such as acetonitrile or methanol (Bruce
et al. 2009) are used to precipitate proteins, with variable
temperature and sample/solvent ratio conditions. Pereira
et al. (2010) showed that cold methanol used in a 1:2 plasma/
solvent ratio allowed reaching a high number of detected
ions with a good repeatability. This method was compared
with solid phase extraction (SPE) (Michopoulos et al. 2009)
and finally the effect of a 4-step fractionation of the plasma
metabolome on the metabolic fingerprinting was reported.
2 Materials and methods
2.1 Chemical and reagents
Ultrapure water was prepared using a Millipore Simplicity
water purification system (Millipore, Billerica, USA).
Methanol, chloroform, acetonitrile, and hexane were HPLC
grade and purchased from Sigma-Aldrich (St Quentin
Fallavier, France). Propan-2-ol (GC grade), anhydrous
diethylether (BHT as inhibitor), ethanol, 1.25 M hydrogen
chloride (GC grade), orthophosphoric acid and leucine
enkephalin were also purchased from Sigma-Aldrich
(St Quentin Fallavier, France). Puriss formic acid was
obtained from Riedel-de-Haen (Honeywell, Seelze, Germany),
puriss acetic acid from Fluka (Sigma-Aldrich, St Quentin
Fallavier, France), sodium hydrogenocarbonate from Pro-
labo (VWR, West Chester, USA) and ammonium acetate
from Calbiochem (EMD chemicals, USA).
Recently a lipid classification system has been described
and will be used in this article (Fahy et al. 2005; 2009) to
ease the nomenclature.
All chemical standards (listed in Table 1) used for
method development were supplied by Sigma-Aldrich,
except lutein and zeaxanthin obtained from CaroteNature
GmbH (Lupsingen, Switzerland); sialic acid and adenosine
Fig. 1 Distribution of
metabolite polarities versus
molecular weights. Metabolite
polarities are represented by the
octanol/water partition
coefficient log P, predicted by
ALOGPS
Semi-targeted metabolomic approaches
123
Ta
ble
1L
ist
of
met
abo
lite
so
fin
tere
st,
sup
pli
eran
dd
etec
tio
np
aram
eter
s
Co
mp
ou
nd
HM
DB
clas
sA
bb
rev
iati
on
MW
(gm
ol)
Dil
uen
tR
T
(min
)
Fra
ctio
nC
har
acte
risa
tio
nio
n
(ass
ign
men
t)
25
-hy
dro
xy
vit
amin
DA
lco
ho
lan
dp
oly
ols
25
(OH
)D4
00
.33
41
AC
N1
9.1
61
38
3.3
34
1([
M?
H-
H2O
]?)
Lu
tein
Alc
oh
ol
and
po
lyo
lsL
ut
56
8.4
28
0T
HF
22
.82
15
69
.43
01
([M
?H
]?)
Val
ine
Am
ino
acid
sV
al1
17
.07
90
Wat
er1
.64
11
18
.08
65
([M
?H
]?)
L-T
hre
on
ine
Am
ino
acid
sT
hr
11
9.0
58
2W
ater
0.9
31
10
2.0
54
2([
M?
H-
H2O
]?)
Cy
stei
ne
Am
ino
acid
sC
ys
12
1.0
19
8W
ater
0.8
91
12
2.0
26
2([
M?
H]?
)
Nia
cin
Am
ino
acid
sN
ia1
23
.03
20
Wat
er2
.31
11
24
.03
87
([M
?H
]?)
Hy
dro
xy
pro
lin
eA
min
oac
ids
Hy
p1
31
.05
82
Wat
er0
.93
11
32
.06
4([
M?
H]?
)
L-I
sole
uci
ne
Am
ino
acid
sIl
e1
31
.09
46
Wat
er3
.54
11
32
.09
91
([M
?H
]?)
L-L
euci
ne
Am
ino
acid
sL
eu1
31
.09
46
Wat
er3
.54
11
32
.09
91
([M
?H
]?)
Ho
mo
cyst
ein
eA
min
oac
ids
Hcy
13
5.0
35
4W
ater
1.5
51
13
6.0
41
8([
M?
H]?
)
L-g
luta
mic
acid
Am
ino
acid
sG
lu1
47
.05
32
Wat
er0
.99
11
30
.04
73
([M
?H
-H
2O
]?)
L-P
hen
yla
lan
ine
Am
ino
acid
sP
he
16
5.0
79
0W
ater
4.2
11
66
.08
67
([M
?H
]?)
L-T
yro
sin
eA
min
oac
ids
Ty
r1
81
.07
39
Wat
er3
.58
11
82
.08
05
([M
?H
]?)
Try
pto
ph
anA
min
oac
ids
Trp
20
4.0
89
9W
ater
5.0
61
18
8.0
64
3([
M?
H-
NH
3]?
)
3-N
itro
tyro
sin
eA
min
oac
ids
3N
ty2
26
.05
90
Wat
er4
.52
12
27
.06
91
([M
?H
]?)
Sel
eno
met
hio
nin
eA
min
oac
ids
SeM
et1
96
.99
55
Wat
er1
.31
11
98
.00
72
([M
?H
]?)
L-T
hy
rox
ine
Am
ino
acid
sT
hy
rox
77
6.6
86
8N
H4O
Hin
MeO
H1
0.1
91
77
7.6
90
8([
M?
H]?
)
Gly
cin
eA
min
oac
ids
Gly
75
.03
20
Wat
er0
.89
17
6.0
45
8([
M?
H]?
)
Ala
nin
eA
min
oac
ids
Ala
89
.04
77
Wat
er0
.91
19
0.0
57
5([
M?
H]?
)
His
tam
ine
Am
ino
acid
sH
is1
11
.07
96
Wat
er0
.74
11
12
.08
72
([M
?H
]?)
Met
hio
nin
eA
min
oac
ids
Met
14
9.0
51
1W
ater
2.2
21
13
3.0
30
6([
M?
H-
NH
3]?
)
Cre
atin
ine
Am
ino
ket
on
esC
reat
11
3.0
58
9W
ater
1.1
11
14
.06
63
([M
?H
]?)
2-p
yrr
oli
do
ne
Am
ino
ket
on
esP
yrr
85
.05
28
Wat
er3
.64
18
6.0
64
([M
?H
]?)
2-p
yri
do
ne
Am
ino
ket
on
es(O
H)P
yr
95
.03
71
Wat
er3
.73
19
6.0
43
9([
M?
H]?
)
Bio
tin
Bio
tin
and
der
ivat
ives
Bio
tin
24
4.0
88
2W
ater
12
27
.07
04
([M
?H
-H
2O
]?)
Glu
cosa
min
eC
arb
oh
yd
rate
sG
luca
m1
79
.07
94
Wat
er0
.83
11
80
.08
62
([M
?H
]?)
Sia
lic
acid
Car
bo
hy
dra
tes
Sia
l3
09
.10
60
Wat
er1
.08
12
74
.08
73
([M
?H
-2
H2O
]?)
Erg
oth
ion
ein
eC
arn
itin
esE
rg2
29
.08
85
Wat
er1
.41
23
0.0
96
2([
M?
H]?
)
Car
nit
ine
Car
nit
ines
Car
n1
61
.10
52
Wat
er0
.63
11
62
.11
03
([M
?H
]?)
No
rep
inep
hri
ne
Cat
ech
ola
min
esan
dd
eriv
ativ
esN
eph
16
9.0
73
9H
Cl
0.1
M1
.12
11
52
.06
53
([M
?H
-H
2O
]?)
Co
bal
amin
Co
bal
amin
der
ivat
ives
Co
b1
32
8.5
64
3E
tOH
4.4
31
66
5.2
87
5([
M?
2H
]2?
/2)
Vit
amin
B1
2C
ob
alam
ind
eriv
ativ
esV
itB
12
13
54
.56
74
Wat
er5
.34
16
78
.29
11
([M
?2
H]2
?/2
)
Tes
tost
ero
ne
glu
curo
nid
eG
lucu
ron
ides
Tg
luc
46
4.2
41
0A
CN
9.2
21
46
5.2
49
2([
M?
H]?
)
Dih
yd
rote
sto
ster
on
eg
lucu
ron
ide
Glu
curo
nid
esD
HT
glu
c4
66
.25
67
AC
N/w
ater
50
/50
9.9
81
46
7.2
62
5([
M?
H]?
)
An
dro
ster
on
eg
lucu
ron
ide
Glu
curo
nid
esA
glu
c4
66
.25
67
Wat
er1
0.8
31
46
7.2
71
3([
M?
H]?
)
M. Bayle et al.
123
Ta
ble
1co
nti
nu
ed
Co
mp
ou
nd
HM
DB
clas
sA
bb
rev
iati
on
MW
(gm
ol)
Dil
uen
tR
T
(min
)
Fra
ctio
nC
har
acte
risa
tio
nio
n
(ass
ign
men
t)
Ser
oto
nin
Ind
ole
san
din
do
led
eriv
ativ
esS
ero
17
6.0
95
0W
ater
4.0
11
17
7.1
03
4([
M?
H]?
)
Th
iam
inm
on
op
ho
sph
ate
Mis
cT
MP
34
4.0
70
8W
ater
1.1
13
45
.07
85
([M
?H
]?)
Th
iam
inp
yro
ph
osp
hat
eM
isc
TH
Py
42
4.0
37
1W
ater
1.0
81
42
5.0
46
5([
M?
H]?
)
Fla
vin
mo
no
nu
cleo
tid
eM
isc
FM
N4
56
.10
46
Wat
er5
.34
14
57
.11
21
([M
?H
]?)
Th
iam
inM
isc
Th
iam
in2
65
.11
23
Wat
er1
26
5.0
27
8(M
?)
Deo
xy
uri
din
eN
ucl
eosi
des
Deo
x2
28
.07
46
Wat
er3
.67
11
13
.03
1([
frag
men
t]?
)
8(O
H)-
DG
Nu
cleo
sid
es8
(OH
)DG
28
3.0
91
7E
tOH
/DM
SO
3%
3.9
21
16
8.0
48
9([
fag
men
t]?
)
8-H
yd
rox
yg
uan
osi
ne
Nu
cleo
sid
es8
(OH
)G2
99
.08
66
EtO
H/D
MS
O3
%3
.77
13
00
.09
54
([M
?H
]?)
Nic
oti
nam
ide
aden
ine
din
ucl
eoti
de
Nu
cleo
tid
esN
AD
66
4.1
17
0N
aOH
0.0
1M
3.5
41
34
8.0
71
2([
frag
men
t]?
)
Ad
eno
sin
em
on
op
ho
sph
ate
Nu
cleo
tid
esA
MP
34
7.0
63
1W
ater
3.3
11
34
8.0
70
4([
M?
H]?
)
Nic
oti
nam
ide
aden
ine
din
ucl
eoti
de
ph
osp
hat
e
Nu
cleo
tid
esN
AD
P7
44
.08
33
Wat
er3
.54
17
44
.08
11
(M?
)
Fla
vin
aden
ine
din
ucl
eoti
de
Nu
cleo
tid
esF
AD
78
5.1
57
1W
ater
4.8
81
78
6.1
64
3([
M?
H]?
)
Pan
toth
enic
acid
Pep
tid
esP
an2
19
.11
07
Wat
er4
.33
12
20
.11
96
([M
?H
]?)
Ox
idiz
edg
luta
thio
ne
Pep
tid
esO
GS
H6
12
.15
20
Wat
er3
.54
16
13
.15
84
([M
?H
]?)
Neo
pte
rin
Pte
rin
sN
eop
25
3.0
81
1N
aOH
0.1
M1
.37
12
54
.09
16
([M
?H
]?)
Rib
ofl
avin
Pte
rin
sR
bF
37
6.1
38
3C
H3
CO
ON
a/N
aOH
0.5
M
10
/1
5.8
51
37
7.1
45
3([
M?
H]?
)
Fo
late
Pte
rin
sF
ol
44
1.1
39
7N
aOH
0.5
M/E
tOH
6/4
5.1
51
29
5.0
82
6([
frag
men
t]?
)
Hy
po
xan
thin
eP
uri
ne
and
pu
rin
ed
eriv
ativ
eH
xan
13
6.0
38
5A
CN
/wat
er5
0/5
03
.54
11
37
.04
29
([M
?H
]?)
Xan
thin
eP
uri
ne
and
pu
rin
ed
eriv
ativ
eX
an1
52
.03
34
NaO
H0
.01
M/a
ceto
nit
rile
50
/50
3.4
41
15
3.0
37
4([
M?
H]?
)
Uri
cac
idP
uri
ne
and
Pu
rin
eD
eriv
ativ
eA
ur
16
8.0
28
3N
aOH
0.1
M3
.49
11
69
.03
52
([M
?H
]?)
Py
rid
ox
alP
yri
do
xal
san
dd
eriv
ativ
esP
yra
l1
67
.05
82
Wat
er3
.07
11
50
.04
56
([M
?H
-H
2O
]?)
Py
rid
ox
ine
Py
rid
ox
als
and
Der
ivat
ives
Py
rox
16
9.0
73
9W
ater
1.4
11
70
.08
28
([M
?H
]?)
4-P
yri
do
xic
acid
Py
rid
ox
als
and
Der
ivat
ives
Py
ric
18
3.0
53
2N
aOH
0.1
M3
.82
11
66
.04
97
([M
?H
-H
2O
]?)
Vit
amin
B6
Py
rid
ox
als
and
der
ivat
ives
Vit
B6
24
7.0
24
6H
Cl
0.0
1M
1.3
71
24
8.0
35
2([
M?
H]?
)
5-h
yd
rox
y-m
eth
ylu
raci
lP
yri
mid
ine
and
py
rim
idin
e
der
ivat
ives
5-H
MU
14
2.0
37
8W
ater
2.4
11
12
5.0
32
1([
frag
men
t]?
)
Ret
ino
icac
idR
etin
oid
sR
eto
ic3
00
.20
89
AC
N/C
HC
l31
/91
9.2
61
30
1.2
14
9([
M?
H]?
)
Zea
xan
thin
Ret
ino
ids
Zea
56
8.4
28
0T
HF
23
.75
15
68
.39
23
(M?
)
Nic
oti
nam
ide
Cy
clic
amin
esN
AM
12
2.0
48
0W
ater
2.7
82
12
3.0
53
5([
M?
H]?
)
Est
ron
eS
tero
idan
dst
ero
idd
eriv
ativ
eE
stro
n2
70
.16
20
AC
N1
2.4
62
27
1.1
68
9([
M?
H]?
)
Est
rad
iol
Ste
roid
and
ster
oid
der
ivat
ive
Oes
t2
72
.17
76
AC
N1
1.5
32
27
3.1
76
6([
M?
H]
?)
Ald
ost
ero
ne
Ste
roid
and
ster
oid
der
ivat
ive
Ald
o3
60
.19
37
AC
N8
.56
23
61
.20
07
([M
?H
]?
)
Co
rtis
ol
Ste
roid
and
ster
oid
der
ivat
ive
Co
rt3
62
.20
93
AC
N9
.12
23
63
.21
69
([M
?H
]?)
Semi-targeted metabolomic approaches
123
Ta
ble
1co
nti
nu
ed
Co
mp
ou
nd
HM
DB
clas
sA
bb
rev
iati
on
MW
(gm
ol)
Dil
uen
tR
T
(min
)
Fra
ctio
nC
har
acte
risa
tio
nio
n
(ass
ign
men
t)
1,2
5-D
ihy
dro
xy
Vit
amin
DS
tero
idan
dst
ero
idd
eriv
ativ
e1
.25
(OH
)D4
16
.32
90
EtO
H1
5.8
82
39
9.3
22
8([
M?
H-
H2O
]?)
An
dro
sten
edio
ne
Ste
roid
and
ster
oid
der
ivat
ive
An
dro
28
6.1
93
3A
CN
12
.64
22
87
.20
26
([M
?H
]?)
Tes
tost
ero
ne
Ste
roid
and
ster
oid
der
ivat
ive
T2
88
.20
89
AC
N1
1.8
12
28
9.2
15
8([
M?
H]?
)
Deh
yd
roep
ian
dro
ster
on
eS
tero
idan
dst
ero
idd
eriv
ativ
eD
HE
A2
88
.20
89
AC
N1
2.4
12
28
9.2
20
9([
M?
H]?
)
Vit
amin
ES
tero
idan
dst
ero
idd
eriv
ativ
eV
itE
43
0.3
81
1E
tOH
31
.61
24
31
.38
78
([M
?H
]?)
13
-ox
o-O
DE
Fat
tyac
ids
13
ox
oO
DE
29
4.2
19
5E
tOH
5.0
74
29
3.2
13
4([
M-
H]-
)
13
-hy
dro
per
ox
yo
ctad
ecad
ien
oic
acid
Fat
tyac
ids
13
HP
OD
E3
12
.23
01
EtO
H5
.56
42
93
.31
31
([M
-H
-H
2O
]-)
9-H
OD
EF
atty
acid
s9
HO
DE
29
6.2
35
1E
tOH
5.2
44
29
5.2
27
2([
M-
H]-
)
12
(13
)-E
pO
ME
Fat
tyac
ids
12
(13
)EP
OM
E2
96
.23
51
Met
Ace
6.7
54
29
5.2
28
2([
M-
H]-
)
9,1
0-D
HO
ME
Fat
tyac
ids
9(1
0)D
HO
ME
31
4.2
45
7M
etA
ce2
.72
43
13
.23
99
([M
-H
]-)
8(9
)-E
ET
Fat
tyac
ids
8(9
)EE
T3
20
.23
51
EtO
H7
.92
43
19
.22
75
([M
-H
]-)
12
-hy
dro
xy
per
ox
yei
cosa
tetr
aen
oic
acid
Leu
ko
trie
nes
12
HP
ET
E3
36
.23
01
EtO
H6
.51
43
17
.21
48
([M
-H
-H
2O
]-)
19
-HE
TE
Leu
ko
trie
nes
19
HE
TE
32
0.2
35
1E
tOH
4.5
84
31
9.2
28
4([
M-
H]-
)
5.6
-DH
ET
Leu
ko
trie
nes
5(6
)DH
ET
33
8.2
45
7E
tOH
5.1
54
33
7.2
39
8([
M-
H]-
)
Leu
ko
trie
neE
4L
euk
otr
ien
esL
TE
44
39
.23
92
EtO
H2
.88
44
38
.22
77
([M
-H
]-)
18
:0L
yso
PE
Ph
osp
ho
lip
ids
18
:0L
PE
48
1.3
16
8C
HC
l 31
8.5
74
48
0.3
09
7([
M-
H]-
)
18
:1L
yso
PC
Ph
osp
ho
lip
ids
18
:1L
PC
52
1.3
48
1C
HC
l 31
5.4
74
58
0.3
62
4([
M?
CH
3C
OO
H-
H]-
)
14
:0P
EP
ho
sph
oli
pid
s1
4:0
PE
63
5.4
52
6C
HC
l 32
6.5
34
63
4.4
41
2([
M-
H]-
)
14
:0P
SP
ho
sph
oli
pid
s1
4:0
PS
67
9.4
42
4C
HC
l 3/M
eOH
/wat
er6
5/3
5/8
23
.74
67
8.4
35
1([
M-
H]-
)
18
:0–
22
:6P
EP
ho
sph
oli
pid
s1
8:0
–2
2:6
PE
79
1.5
46
5C
HC
l 33
0.1
14
79
0.5
34
2([
M-
H]-
)
18
:0–
20
:4P
SP
ho
sph
oli
pid
s1
8:0
–2
0:4
PS
81
1.5
36
3C
HC
l 32
6.9
14
81
0.5
24
2([
M-
H]-
)
16
:0–
18
:1P
CP
ho
sph
oli
pid
s1
6:0
–1
8:1
PC
75
9.5
77
8C
HC
l 33
0.7
94
81
8.5
93
1([
M?
CH
3C
OO
H-
H]-
)
15
-ket
o-P
rost
agla
nd
in-F
2a
Pro
stan
oid
s1
5k
eto
PG
F2
a3
52
.22
50
Met
Ace
1.3
14
31
5.1
98
2([
M-
H-
2H
2O
]-)
Pro
stag
lan
din
A1
Pro
stan
oid
sP
GA
13
36
.23
01
EtO
H1
.76
43
35
.22
37
([M
-H
]-)
6-k
eto
-Pro
stag
lan
din
-F1
aP
rost
ano
ids
6k
eto
PG
F1
a3
70
.23
55
EtO
H1
.02
43
69
.22
51
([M
-H
]-)
Th
rom
bo
xan
eB2
Pro
stan
oid
sT
XB
23
70
.23
55
EtO
H1
.19
43
69
.22
75
([M
-H
]-)
12
:0S
MS
ph
ing
oli
pid
s1
2:0
SM
64
6.5
05
0C
HC
l 32
4.7
24
70
5.5
15
1([
M?
CH
3C
OO
H-
H]-
)
Gly
cero
lA
lco
ho
lan
dP
oly
ols
Gly
r9
2.0
47
3E
tOH
ND
No
ne
No
ne
Ph
yll
oq
uin
on
eA
lco
ho
lan
dP
oly
ols
Ph
yl
47
0.3
76
0A
CN
/EtO
H/w
ater
(1/8
/1)
ND
No
ne
No
ne
b-C
aro
ten
eA
lkan
esan
dA
lken
esC
aro
t5
36
.43
82
TH
FN
DN
on
eN
on
e
Ly
cop
ene
Alk
anes
and
Alk
enes
Ly
co5
36
.43
82
TH
FN
DN
on
eN
on
e
Ser
ine
Am
ino
Aci
ds
Ser
10
5.0
04
26
Wat
erN
DN
on
eN
on
e
M. Bayle et al.
123
Ta
ble
1co
nti
nu
ed
Co
mp
ou
nd
HM
DB
clas
sA
bb
rev
iati
on
MW
(gm
ol)
Dil
uen
tR
T
(min
)
Fra
ctio
nC
har
acte
risa
tio
nio
n
(ass
ign
men
t)
Glu
cose
Car
bo
hy
dra
tes
Glu
c1
80
.06
34
Wat
erN
DN
on
eN
on
e
Met
hy
lmal
on
icac
idD
icar
bo
xy
lic
acid
MM
A1
18
.02
66
EtO
HN
DN
on
eN
on
e
Lac
tate
Hy
dro
xy
Aci
ds
Lac
90
.03
17
Wat
erN
DN
on
eN
on
e
Vit
amin
CH
yd
rox
yA
cid
sV
itC
17
6.0
32
1W
ater
ND
No
ne
No
ne
2-K
eto
bu
tyri
cac
idK
eto
Aci
ds
Ket
o1
02
.03
17
AC
NN
DN
on
eN
on
e
Glu
tath
ion
eN
ucl
eoti
des
GS
H3
07
.08
38
ND
No
ne
No
ne
24
:0P
CP
ho
sph
oli
pid
s2
4:0
PC
95
7.8
12
6C
HC
l 3N
DN
on
eN
on
e
Pro
stag
lan
din
I2P
rost
ano
ids
PG
I23
52
.22
50
EtO
HN
DN
on
eN
on
e
Ret
inal
Ret
ino
ids
Ret
al2
84
.21
40
AC
NN
DN
on
eN
on
e
Ret
ino
lR
etin
oid
sR
eto
l2
86
.22
97
EtO
HN
DN
on
eN
on
e
Ch
ole
calc
ifer
ol
Ste
roid
and
ster
oid
der
ivat
ive
Ch
olf
38
4.3
39
2E
tOH
ND
No
ne
No
ne
Erg
oca
lcif
ero
lS
tero
idan
dst
ero
idd
eriv
ativ
eE
rgo
39
6.3
39
2E
tOH
ND
No
ne
No
ne
Est
ron
esu
lfat
eS
tero
idan
dst
ero
idd
eriv
ativ
eE
sts
35
0.1
18
8A
CN
ND
No
ne
No
ne
Ch
ole
ster
ol
Ste
roid
and
ster
oid
der
ivat
ive
Ch
ol
38
6.3
54
9A
CN
/EtO
H5
0/5
0N
DN
on
eN
on
e
Deh
yd
roep
ian
dro
ster
on
eS
ulf
ate
Ste
roid
and
ster
oid
der
ivat
ive
DH
EA
s3
68
.16
57
AC
N/w
ater
10
/1N
DN
on
eN
on
e
Lau
ric
acid
C1
2:0
Fat
tyac
ids
C1
2:0
21
4M
eth
yle
ne
chlo
rid
e9
.47
32
14
(M?
(FA
ME
))
My
rist
icac
idC
14
:0F
atty
acid
sC
14
:02
42
Met
hy
len
ech
lori
de
10
.97
32
42
(M?
(FA
ME
))
Pen
tad
ecan
oic
acid
C1
5:0
Fat
tyac
ids
C1
5:0
25
6M
eth
yle
ne
chlo
rid
e1
1.7
93
25
6(M
?(F
AM
E))
Pal
mit
icac
idC
16
:0F
atty
acid
sC
16
:02
70
Met
hy
len
ech
lori
de
12
.77
32
70
(M?
(FA
ME
))
Pal
mit
ole
icac
idC
16
:1F
atty
acid
sC
16
:12
68
Met
hy
len
ech
lori
de
13
.04
32
68
(M?
(FA
ME
))
Hep
tad
ecan
oic
acid
C1
7:0
Fat
tyac
ids
C1
7:0
28
4M
eth
yle
ne
chlo
rid
e1
3.8
33
28
4(M
?(F
AM
E))
Cis
-10
-hep
tad
ecen
oic
acid
C1
7:1
Fat
tyac
ids
C1
7:1
28
2M
eth
yle
ne
chlo
rid
e1
4.1
83
28
2(M
?(F
AM
E))
Ste
aric
acid
C1
8:0
Fat
tyac
ids
C1
8:0
29
8M
eth
yle
ne
chlo
rid
e1
5.1
33
29
8(M
?(F
AM
E))
Ole
icac
idC
18
:1F
atty
acid
sC
18
:12
96
Met
hy
len
ech
lori
de
15
.46
32
96
(M?
(FA
ME
))
Lin
ole
icac
idC
18
:2F
atty
acid
sC
18
:22
94
Met
hy
len
ech
lori
de
16
.13
29
4(M
?(F
AM
E))
Lin
ole
nic
acid
C1
8:3
Fat
tyac
ids
C1
8:3
29
2M
eth
yle
ne
chlo
rid
e1
6.5
53
29
2(M
?(F
AM
E))
Cis
-11
-eic
ose
no
icac
idC
20
:1F
atty
acid
sC
20
:13
24
Met
hy
len
ech
lori
de
18
.49
33
24
(M?
(FA
ME
))
Hen
eico
san
oic
acid
C2
1:0
(EI)
Fat
tyac
ids
C2
1:0
34
0M
eth
yle
ne
chlo
rid
e1
9.8
33
34
0(M
?(F
AM
E))
Ara
chid
on
icac
idC
20
:4F
atty
acid
sA
ra3
18
Met
hy
len
ech
lori
de
20
.24
33
18
(M?
(FA
ME
))
Eic
osa
pen
taen
oic
acid
C2
0:5
Fat
tyac
ids
Eic
o3
16
Met
hy
len
ech
lori
de
21
.14
33
16
(M?
(FA
ME
))
MW
mo
lecu
lar
wei
gh
t,R
Tre
ten
tio
nti
me,
ES
Iel
ectr
osp
ray
,A
CN
acet
on
itri
le,
TH
Fte
trah
yd
rofu
ran
e,M
eOH
met
han
ol,
EtO
Het
han
ol,
DM
SO
dim
eth
yls
ulf
ox
ide,
FA
ME
fatt
yac
idm
eth
yl
este
r,
ND
no
td
etec
ted
,N
An
ot
avai
lab
le
ND
com
po
un
ds
wer
en
ot
det
ecte
db
yan
yo
fth
eio
nis
atio
nso
urc
ete
sted
,i.
e.el
ectr
osp
ray
or
elec
tro
nim
pac
t
Semi-targeted metabolomic approaches
123
monophosphate from Fluka (St Quentin Fallavier, France);
steroids and derivatives obtained from Steraloids (New-
port, Rhode Island, USA); flavin mononucleotide obtained
from Applichem (Darmstadt, Germany); 8-hydroxyguano-
sine, 1,25-dihydroxyVitaminD, leukotrienes and prosta-
noids obtained from Cayman (Ann Arbor, Michigan,
USA);phospholipids obtained from Avanti polar lipids
(Alabaster, Alabama, USA); pylloquinone and fatty acids
obtained from Supelco (St Quentin Fallavier, France).
2.2 Standard doping mixture preparation
Each of the 116 standards was dissolved in an appropriate
diluent, as detailed in Table 1, according to information
given by the supplier or laboratory testing. Standard solu-
tions were prepared at a concentration of 1 mM, Working
solutions were then obtained by dilutions up to 50 lM with
a 50/50 (V/V) acetonitrile/water mixture. These individual
working solutions were used to optimize metabolite ioni-
sation and chromatographic separation.
A selection of 14 standards was made to prepare a
doping mixture used in validation experiments. The choice
was based on the representativeness of the metabolites for
the different families in the wish-list [carnitines, aminok-
etones, purines, cobalamins, pterins, steroids, amino acids,
free fatty acids and phospholipids (Table 2)]. The mixture
was prepared at an intermediate concentration of
50 lmol L-1.
GC–MS electron impact ionisation was investigated
using a commercial standard mixture SupelcoTM 37 com-
ponent FAME Mix.
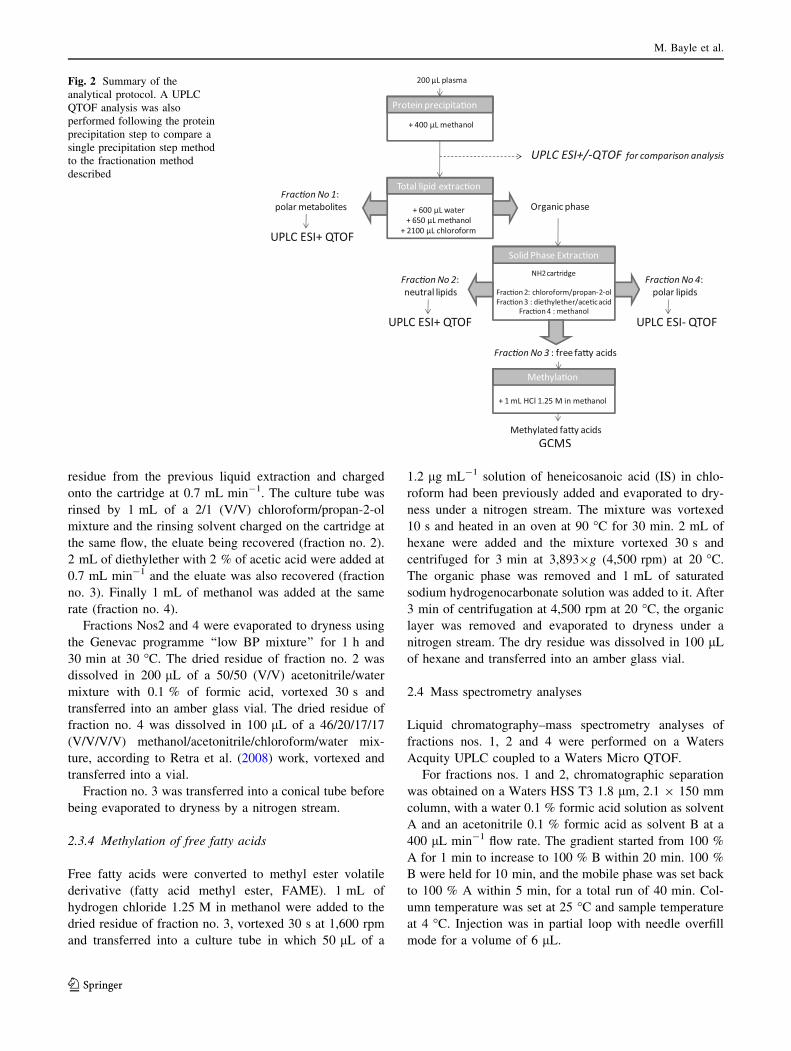
2.3 Sample preparation
The whole protocol was based on a 4-step fractionation of
the plasma summarised in Fig. 2.
2.3.1 Protein precipitation
200 lL of plasma sample were pipetted and 400 lL of
methanol previously refrigerated at 4 �C were added. A
30 min rest time at -20 �C was observed to allow the
precipitation to occur and after 20 min at ambient tem-
perature the mixture was centrifuged for 10 min at
15,4939g (13,000 rpm) and 4 �C with a Sigma 3-16 PK
centrifuge device from Fisher Bioblock Scientific. The
supernatant was removed and poured into a 10 mL conical
Pyrex tube.
This method was compared with solid phase extraction
(SPE) (Michopoulos et al. 2009) performed with Waters
HLB 1 cc cartridges.
2.3.2 Total lipid extraction
The ternary water/chloroform/methanol mixture developed
in the 50’s by Folch et al. (1957) and Bligh and Dyer (1959)
has been widely used and modified throughout the decades.
We adapted a protocol from the Folch method (Tardy et al.
2009) to extract plasma lipids from plasma with an 8/4/3
(V/V/V) chloroform/methanol/water mixture:
600 lL of ultrapure water were added to the supernatant,
followed by 650 lL of methanol. The mixture was vortexed
5 s at 1,800 rpm and 2,100 lL of chloroform were added.
The mixture was vortexed again 10 s at 1,600 rpm and
centrifuged for 40 min at 3,8939g (4,500 rpm) and 4 �C.
The aqueous and organic layers were removed and
poured into separate Pyrex culture tubes. The aqueous
phase was evaporated to dryness using a Genevac EZ-2
evaporator (Genevac SP Scientific, Ipswich, UK) with its
aqueous programme, for 2 h and 40 min at 30 �C. The
dried residue was dissolved in 200 lL of a 50/50 (V/V)
acetonitrile/water mixture with 0.1 % of formic acid, vor-
texed 30 s and transferred into an amber glass vial (fraction
no. 1). The organic phase containing the lipids was evap-
orated under a nitrogen stream and further fractionated by
Solid Phase Extraction (SPE).
2.3.3 Lipid solid phase extraction
In the literature it was reported that after the loading step
with chloroform, two lipid fractions containing neutral
lipids (NL) and free fatty acids (FFA) were successively
obtained with a 2/1 (V/V) chloroform/propan-2-ol mixture
and diethyl ether with 2 % of acetic acid as eluents (Kim
and Salem 1990; Bateman and Jenkins 1997). A third
fraction obtained with methanol elution allowed recovering
neutral phospholipids such as phosphatidylcholines (PC),
phosphatidylethanolamine (PE) and sphingomyelins (SM)
(Kim and Salem 1990), and a fourth fraction eluted with
hexane/propan-2-ol/ethanol/0.1 % ammonium acetate/
water/formic acid 350/420/100/50/0.5 allowed the recovery
of acidic lipids such as phosphatidylinositols (PI), phos-
phatidylserines (PS) and phosphatidic acids (PA). The
protocol used in this study was adapted to smaller volumes
and only the first three fractions were collected to partition
the lipid classes, similarly to Bateman and Jenkins (1997).
SPE was performed on an automatic Rapid Trace SPE
workstation from Caliper (Caliper Life Sciences, Hopkin-
ton, USA). All lines of solvents were purged before and
after extractions with the appropriate solvents. A 1 mL
aminopropyl (50 mg) cartridge from Varian was used to
separate the lipids into three fractions. Firstly the stationary
phase was conditioned with 1 mL of a 2/1 (V/V) chloro-
form/propan-2-ol mixture at 1 mL min-1. Then 0.5 mL of
chloroform were added directly into the dried organic
M. Bayle et al.
123
Ta
ble
2V
alid
atio
nst
ud
yo
nth
e1
4st
and
ard
mix
ture
Yie
lds
Det
ecti
on
par
amet
ers
14
stan
dar
d
mix
ture
Pre
cip
itat
ion
To
tal
lip
idex
trac
tio
nS
oli
dp
has
eex
trac
tio
nG
lob
al
yie
ld
Elu
tio
n
Fra
ctio
n
Ch
oic
e
M/z
@R
T(m
in)
RS
D
RT
(%)
RS
D
m/z
(%)
RS
D
abu
nd
ance
(%)
Fra
ctio
nn
o.
1O
rgan
icp
has
eF
ract
ion
no
.2
Fra
ctio
nn
o.
3F
ract
ion
no
.4
Car
n9
3±
49
2±
58
6±
41
16
2.1
09
@1
.19
0.1
0.0
11
0
Th
Py
48
±1
32
26
±3
51
09
±1
71
42
5.0
45
@1
.30
0.9
0.0
19
Cre
at8
4±
29
4±
47
9±
41
11
4.0
63
@1
.30
20
.03
13
Hcy
70
±2
09
6±
19
67
±2
61
13
6.0
46
@1
.30
0.1
0.0
21
8
Hx
an8
5±
58
9±
47
5±
41
13
7.0
42
@1
.70
30
.02
12
Ph
e1
08
±1
77
4±
11
81
±1
21
16
6.0
85
@4
.51
0.2
0.0
32
2
Fo
l1
06
±1
29
3±
11
99
±1
61
29
5.0
91
@5
.45
0.1
0.0
51
0
vit
B1
21
00
±4
96
±3
96
±4
16
78
.27
7@
5.6
51
0.0
12
Ald
o8
9±
22
3±
04
3±
21
21
±8
19
±2
11
±0
46
±1
32
36
1.1
96
@8
.89
0.2
0.0
74
Tes
to9
2±
12
2±
11
02
±5
78
±3
27
±2
4±
17
3±
92
28
9.2
08
@1
2.1
40
.20
.10
8
ara
13
0±
20
14
9±
33
86
±1
51
66
±1
83
79
@1
9.7
00
.03
09
eico
10
0±
19
12
9±
25
91
±9
11
7±
12
37
9@
20
.89
0.0
30
10
12
:0S
M5
8±
82
03
±1
51
29
±1
11
51
±2
34
50
6.3
19
@1
5.9
70
.07
0.0
41
1
18
:1L
PC
10
1±
29
10
4±
23
91
±1
79
6±
25
47
05
.50
4@
24
.72
0.5
0.0
37
Th
e1
4st
and
ard
mix
ture
was
spik
edin
wat
ersa
mp
les
and
the
frac
tio
nat
ion
pro
toco
lap
pli
ed.
Th
eta
ble
sho
ws
the
extr
acti
on
yie
lds
of
each
anal
yti
cal
step
(mea
nv
alu
e%
±C
V,
n=
3),
the
calc
ula
tio
nb
ein
gex
pla
ined
inth
esu
pp
lem
enta
ryd
ata.
Fra
ctio
nn
o.
1an
do
rgan
icp
has
efr
acti
on
resu
ltfr
om
the
tota
lli
pid
extr
acti
on
step
.F
ract
ion
no
s.2
,3
and
4re
sult
fro
mth
eso
lid
ph
ase
extr
acti
on
step
.F
ract
ion
no
.1
and
org
anic
ph
ase
frac
tio
nre
sult
fro
mth
eto
tal
lip
idex
trac
tio
nst
ep.
Fra
ctio
nn
os.
2,
3an
d4
resu
ltfr
om
the
soli
dp
has
eex
trac
tio
nst
ep.
Ap
lasm
asa
mp
lew
as
spik
edw
ith
the
14
stan
dar
dm
ixtu
reto
asse
ssth
est
abil
ity
of
the
met
ho
d,
Rel
ativ
est
and
ard
dev
iati
on
(RS
Ds)
calc
ula
tio
no
fre
ten
tio
nti
mes
(RT
),m
/zra
tio
san
dab
un
dan
ces
(n=
10
)ar
esh
ow
n
inth
eta
ble
Semi-targeted metabolomic approaches
123
residue from the previous liquid extraction and charged
onto the cartridge at 0.7 mL min-1. The culture tube was
rinsed by 1 mL of a 2/1 (V/V) chloroform/propan-2-ol
mixture and the rinsing solvent charged on the cartridge at
the same flow, the eluate being recovered (fraction no. 2).
2 mL of diethylether with 2 % of acetic acid were added at
0.7 mL min-1 and the eluate was also recovered (fraction
no. 3). Finally 1 mL of methanol was added at the same
rate (fraction no. 4).
Fractions Nos2 and 4 were evaporated to dryness using
the Genevac programme ‘‘low BP mixture’’ for 1 h and
30 min at 30 �C. The dried residue of fraction no. 2 was
dissolved in 200 lL of a 50/50 (V/V) acetonitrile/water
mixture with 0.1 % of formic acid, vortexed 30 s and
transferred into an amber glass vial. The dried residue of
fraction no. 4 was dissolved in 100 lL of a 46/20/17/17
(V/V/V/V) methanol/acetonitrile/chloroform/water mix-
ture, according to Retra et al. (2008) work, vortexed and
transferred into a vial.
Fraction no. 3 was transferred into a conical tube before
being evaporated to dryness by a nitrogen stream.
2.3.4 Methylation of free fatty acids
Free fatty acids were converted to methyl ester volatile
derivative (fatty acid methyl ester, FAME). 1 mL of
hydrogen chloride 1.25 M in methanol were added to the
dried residue of fraction no. 3, vortexed 30 s at 1,600 rpm
and transferred into a culture tube in which 50 lL of a
1.2 lg mL-1 solution of heneicosanoic acid (IS) in chlo-
roform had been previously added and evaporated to dry-
ness under a nitrogen stream. The mixture was vortexed
10 s and heated in an oven at 90 �C for 30 min. 2 mL of
hexane were added and the mixture vortexed 30 s and
centrifuged for 3 min at 3,8939g (4,500 rpm) at 20 �C.
The organic phase was removed and 1 mL of saturated
sodium hydrogenocarbonate solution was added to it. After
3 min of centrifugation at 4,500 rpm at 20 �C, the organic
layer was removed and evaporated to dryness under a
nitrogen stream. The dry residue was dissolved in 100 lL
of hexane and transferred into an amber glass vial.
2.4 Mass spectrometry analyses
Liquid chromatography–mass spectrometry analyses of
fractions nos. 1, 2 and 4 were performed on a Waters
Acquity UPLC coupled to a Waters Micro QTOF.
For fractions nos. 1 and 2, chromatographic separation
was obtained on a Waters HSS T3 1.8 lm, 2.1 9 150 mm
column, with a water 0.1 % formic acid solution as solvent
A and an acetonitrile 0.1 % formic acid as solvent B at a
400 lL min-1 flow rate. The gradient started from 100 %
A for 1 min to increase to 100 % B within 20 min. 100 %
B were held for 10 min, and the mobile phase was set back
to 100 % A within 5 min, for a total run of 40 min. Col-
umn temperature was set at 25 �C and sample temperature
at 4 �C. Injection was in partial loop with needle overfill
mode for a volume of 6 lL.
Fig. 2 Summary of the
analytical protocol. A UPLC
QTOF analysis was also
performed following the protein
precipitation step to compare a
single precipitation step method
to the fractionation method
described
M. Bayle et al.
123
For fraction no. 4, the same column, temperatures and
injection parameters were used but the mobile phase was
changed to water with ammonium acetate 2.5 mM as sol-
vent A and a 60/40 (V/V) methanol/acetonitrile mixture
with ammonium acetate 2.5 mM as solvent B. The sepa-
ration conditions for fraction no. 4 were adapted from
Retra et al. work (2008). The gradient started with 35 % A
for 1 min to increase to 100 % B within 25 min. 100 % B
were held for 10 min, and the mobile phase was set back to
35 % A within 5 min.
The mass spectrometer was calibrated with a 0.1 %
orthophosphoric acid solution prior to analyses and leucine
enkephalin was used as reference lock mass for both
positive (556.2771 m/z) and negative (554.2615 m/z)
modes. Leucine enkephalin was infused with a Waters
600 multisolvent delivery system at a flow rate of 50 lL/
min. Samples were acquired in continuum scan mode, from
70 to 1,000 m/z. The ion source was an electrospray with
capillary voltage set at 3,000 V (2,500 V for negative
mode) and sample cone at 30 V. Collision energy was set
at 5 V. The source temperature was set at 120 �C and the
desolvation temperature at 330 �C. Fractions nos. 1 and 2
were analysed in positive mode and fraction no. 4 in
negative mode.
Gas chromatography–mass spectrometry analyses of
fraction no. 3 were performed on an Agilent 7890A GC
coupled to an Agilent 5975C MS (single quadrupole) with
an Agilent 7683B autosampler. Chromatographic separa-
tion was obtained on a J&W Scientific DBWAX
30 m 9 0.25 mm 9 0.25 lm column. Injection and aux-
iliary temperatures were set at 250 �C, the oven gradient
started from 60 �C for 1 min, increased to 200 �C at
15 �C min-1 and to 250 �C at 3 �C min-1. 250 �C were
held for 15 min, for a total run of 42 min. Helium was used
as carrier gas at a constant flow of 1 mL min-1. Mass
spectrometer acquisitions were made in scan mode, from
50 to 600 m/z with 70 eV of electronic impact ionisation
energy.
2.5 Data pre-processing
UPLC-QTOF sample files that were acquired in continuum
mode were centroided simultaneously to accurate mass
correction using the Waters Masslynx accurate mass
measure tool. Then raw files were converted to NetCDF
files by Waters Databrige. GC–MS raw sample files were
converted to NetCDF files by Metalign (http://www.meta
lign.wur.nl/UK/). Both UPLC-QTOF and GC–MS NetCDF
files were extracted with XCMS opensource R package
using the following parameters. Firstly data were retrieved
using the xcmsSet command with the following arguments:
matched filter method, fwhm at 12 and snthresh at 5 for
UPLC-QTOF files and respectively 8 and 4 for GC–MS
files. Then data were aligned with the group command and
the following arguments: bw at 5, minfrac at 0.1 and
mzwid at 0.2. Retention times were corrected with the
retcor command and the symmetric family argument. Data
were aligned again with the group command and the same
arguments, and missing data were filled with the fillpeaks
command. A 3-dimension table was obtained gathering
retention times, mass over charge ratios and abundances.
GC–MS spectra were processed by an automated mass
spectral deconvolution and identification system (AMDIS),
and identified using the NIST library.
2.6 Normalization of the features
Variations between and within sample sequences were
noticed. A normalization method based on the injection of
pooled plasma sample along sequences (Van der Kloet et al.
2009) was used. This normalization was found to be efficient
as each ion abundance is corrected separately from the
others: calculation of an amplification factor allowed cor-
recting variations for sequence blocks and a regression curve
modeling allowed correcting variations within sequence.
3 Results and discussion
3.1 Metabolite ionisation
QTOF electrospray ionisation has been studied and opti-
mised for the 116 standard compounds and their spectrum
acquired (Table 1 shows their diagnostic ion). 78 % were
detected in positive mode and 61 % in negative mode,
57 % being detected in both modes. Out of these com-
pounds PGI2, Estrone sulfate and GSH were found to be
unstable, PGI2 being converted into PGA1, and Estrone
sulfate into estrone. In total, 83 % of the wishlist metab-
olites tested was detected in either one of the two modes.
3.2 Sample preparation
3.2.1 Protein precipitation
The alternative SPE method gives good recovery yields for
apolar compounds (c.g. 90 % for testosterone or 80 % for
vitamin B12) but polar compounds (carn, creat, ThPy,
Hxan, Phe) are eliminated in the rinsing fraction. Conse-
quently proteins precipitation with cold methanol was
preferred.
3.2.2 Total lipid extraction
Polar metabolites, eluting first, are mainly recovered in the
aqueous fraction whereas lipids are mainly recovered in the
Semi-targeted metabolomic approaches
123
organic phase. Up to 78 % LPCs (calculated for LPC 16:0)
were removed from the aqueous phase (Table 2).
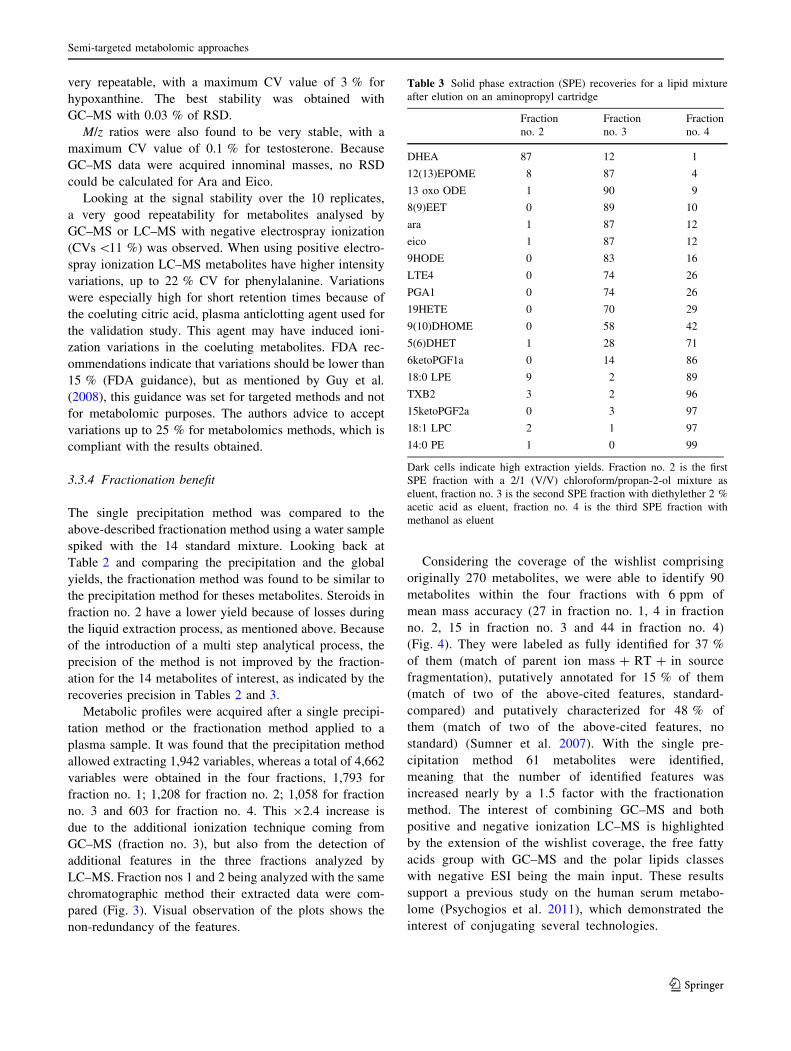
3.2.3 Solid phase extraction
Polar phospholipids were, as expected, eluted with meth-
anol in the last fraction (18:0 LPE, 18:1 LPC, Table 2).
Within the first fraction a neutral steroid (DHEA) was
detected, whereas in the second fraction the free fatty acids
were recovered (ara, eico). 14 saturated FAME (Table 1)
were identified from the second SPE fraction thanks to
their molecular ion and the characteristic Mac Lafferty ion
(www.lipidlibrary.aocs.org). Monoenoic and dienoic
FAME were also identified thanks to their molecular ion
and the loss of methoxyl group.
Eicosanoids were detected with UPLC-QTOF either in
the diethylether fraction or the methanol fraction, or both.
Once the SPE protocol was defined, an additional
experiment was carried out to investigate the necessity of
the extraction of total lipids prior to the SPE. The results
(not shown) indicate that lipid signals, especially steroids,
were decreased when SPE was used as a single extraction
step. In that case, it may be explain by an insufficient
purification, leading to ionisation competition in the mass
spectrometer.
3.3 Validation
Validation of a metabolomic analytical method is chal-
lenging due to the large amount of detected features
sometimes unknown. Validation was limited to some
known metabolites to evaluate matrix effects, extraction
yields and method stability, or repeatability. Overall
extracted features variations were also compared.
3.3.1 Study of matrix effects
Matrix effects often induce dramatic errors in quantification
methods that vary depending on metabolite structure and
coeluting substances (Buscher et al. 2009). Matrix can
interfere with metabolite ionisation by either enhancing or
suppressing it, or creates an offset by addition of a coeluting
mass (Matuszewski et al. 2003). To investigate the plasma
matrix effect of the developed method, plasma or water
samples were spiked with the 14 standard mixture. A cali-
bration curve was built with and without the plasma matrix,
using five concentration levels from 10 to 100 lmol -
L-1 and their slopes was compared. Signal enhancement
was mainly seen in electronic impact for GC–MS. This was
attributed to GC injection system, the liner being known to
adsorb molecules on its active sites (silanols or metal ions)
(Poole 2007). Signal suppression occurs mainly with elec-
trospray, certainly due to ionization competition. It was
especially visible in the first minutes of the chromatogram
for fraction no. 1 due to coelution with citric acid used as
plasma anticlotting agent. For some metabolites ionized by
electrospray a signal enhancement was observed, the ioni-
zation competition being in favor of the targeted metabolite.
For a quantitative method, the use of an internal stan-
dard whose structure would match the one of the com-
pound of interest would overcome these matrix effects. In
our case as this method was dedicated to untargeted anal-
yses, no existing internal standards would be suitable for
the matrix correction of such diverse compounds and we
decided to correct it using our normalization procedure.
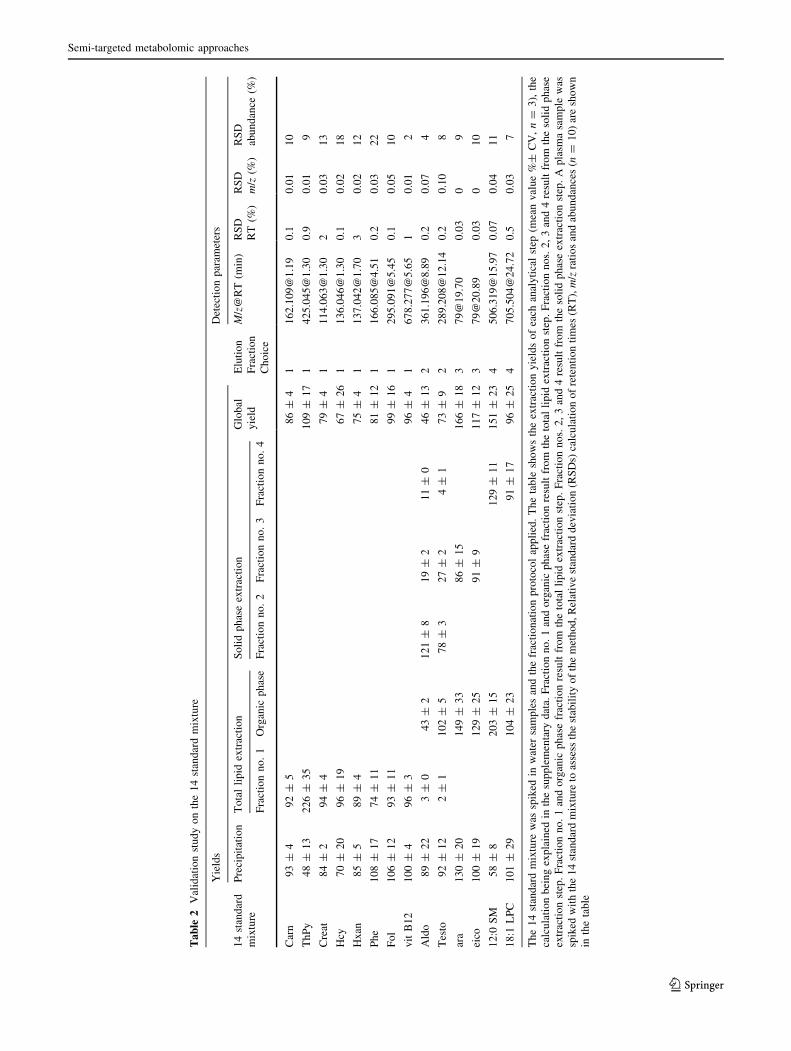
3.3.2 Determination of the extraction yields
Each analytical step was evaluated by the triplicate analysis
of spiked water samples. To allow the calculation of the
precipitation and extraction yields of all compounds the
same QTOF detection method was used. Precipitation and
extraction yields for the 14 selected metabolites are pre-
sented in Table 2. Yields were found to be above 80 % for
9 metabolites over 14. Four are between 60 and 80 % and
only one has a yield of 46 % (aldosterone). For this com-
pound the critical step is the total lipid extraction, as its
yield is 43 %. It is worth noticing that for this metabolite
and the other steroid investigated (testosterone), SPE seems
to be less selective as approximately 20 % are recovered in
fraction no. 3 instead of fraction no. 2. For all metabolites
the total lipid extraction separates the molecules without
losses. The recoveries are at least as good as the one
obtained for the precipitation step, with the exception of
aldosterone, as mentioned above. Precipitation yields are
mainly above 80 % excepted for homocysteine, at 70 %
but with an uncertainty of 20 %, and for thiamin pyro-
phosphate and 12:0 SM with respectively 48 and 58 %. For
these two compounds, the recoveries are low for the pre-
cipitation step and high for the liquid extraction step, due to
low but repeatable abundances of the two metabolites in
the precipitation extract. For 12:0 SM it might be due to a
chromatographic effect, as the dilution solvent used for the
recovery experiments was a mixture of water and aceto-
nitrile, in which 12:0 SM is not well dissolved.
3.3.3 Method stability
Ten replicates of plasma samples were spiked with the 14
metabolites mixtures. They were fractionated according to
the above-described protocol and analysed by UPLC-
QTOF (Fraction nos. 1, 2, 4) and GC–MS (fraction no. 3).
Datafiles were extracted with XCMS file by file to get
abundances, m/z ratios and retention times for each sample
file. RSDs were calculated for each of these three dimen-
sions for every ion (Table 2). UPLC retention times were
M. Bayle et al.
123
very repeatable, with a maximum CV value of 3 % for
hypoxanthine. The best stability was obtained with
GC–MS with 0.03 % of RSD.
M/z ratios were also found to be very stable, with a
maximum CV value of 0.1 % for testosterone. Because
GC–MS data were acquired innominal masses, no RSD
could be calculated for Ara and Eico.
Looking at the signal stability over the 10 replicates,
a very good repeatability for metabolites analysed by
GC–MS or LC–MS with negative electrospray ionization
(CVs \11 %) was observed. When using positive electro-
spray ionization LC–MS metabolites have higher intensity
variations, up to 22 % CV for phenylalanine. Variations
were especially high for short retention times because of
the coeluting citric acid, plasma anticlotting agent used for
the validation study. This agent may have induced ioni-
zation variations in the coeluting metabolites. FDA rec-
ommendations indicate that variations should be lower than
15 % (FDA guidance), but as mentioned by Guy et al.
(2008), this guidance was set for targeted methods and not
for metabolomic purposes. The authors advice to accept
variations up to 25 % for metabolomics methods, which is
compliant with the results obtained.
3.3.4 Fractionation benefit
The single precipitation method was compared to the
above-described fractionation method using a water sample
spiked with the 14 standard mixture. Looking back at
Table 2 and comparing the precipitation and the global
yields, the fractionation method was found to be similar to
the precipitation method for theses metabolites. Steroids in
fraction no. 2 have a lower yield because of losses during
the liquid extraction process, as mentioned above. Because
of the introduction of a multi step analytical process, the
precision of the method is not improved by the fraction-
ation for the 14 metabolites of interest, as indicated by the
recoveries precision in Tables 2 and 3.
Metabolic profiles were acquired after a single precipi-
tation method or the fractionation method applied to a
plasma sample. It was found that the precipitation method
allowed extracting 1,942 variables, whereas a total of 4,662
variables were obtained in the four fractions, 1,793 for
fraction no. 1; 1,208 for fraction no. 2; 1,058 for fraction
no. 3 and 603 for fraction no. 4. This 92.4 increase is
due to the additional ionization technique coming from
GC–MS (fraction no. 3), but also from the detection of
additional features in the three fractions analyzed by
LC–MS. Fraction nos 1 and 2 being analyzed with the same
chromatographic method their extracted data were com-
pared (Fig. 3). Visual observation of the plots shows the
non-redundancy of the features.
Considering the coverage of the wishlist comprising
originally 270 metabolites, we were able to identify 90
metabolites within the four fractions with 6 ppm of
mean mass accuracy (27 in fraction no. 1, 4 in fraction
no. 2, 15 in fraction no. 3 and 44 in fraction no. 4)
(Fig. 4). They were labeled as fully identified for 37 %
of them (match of parent ion mass ? RT ? in source
fragmentation), putatively annotated for 15 % of them
(match of two of the above-cited features, standard-
compared) and putatively characterized for 48 % of
them (match of two of the above-cited features, no
standard) (Sumner et al. 2007). With the single pre-
cipitation method 61 metabolites were identified,
meaning that the number of identified features was
increased nearly by a 1.5 factor with the fractionation
method. The interest of combining GC–MS and both
positive and negative ionization LC–MS is highlighted
by the extension of the wishlist coverage, the free fatty
acids group with GC–MS and the polar lipids classes
with negative ESI being the main input. These results
support a previous study on the human serum metabo-
lome (Psychogios et al. 2011), which demonstrated the
interest of conjugating several technologies.
Table 3 Solid phase extraction (SPE) recoveries for a lipid mixture
after elution on an aminopropyl cartridge
Fraction
no. 2
Fraction
no. 3
Fraction
no. 4
DHEA 87 12 1
12(13)EPOME 8 87 4
13 oxo ODE 1 90 9
8(9)EET 0 89 10
ara 1 87 12
eico 1 87 12
9HODE 0 83 16
LTE4 0 74 26
PGA1 0 74 26
19HETE 0 70 29
9(10)DHOME 0 58 42
5(6)DHET 1 28 71
6ketoPGF1a 0 14 86
18:0 LPE 9 2 89
TXB2 3 2 96
15ketoPGF2a 0 3 97
18:1 LPC 2 1 97
14:0 PE 1 0 99
Dark cells indicate high extraction yields. Fraction no. 2 is the first
SPE fraction with a 2/1 (V/V) chloroform/propan-2-ol mixture as
eluent, fraction no. 3 is the second SPE fraction with diethylether 2 %
acetic acid as eluent, fraction no. 4 is the third SPE fraction with
methanol as eluent
Semi-targeted metabolomic approaches
123
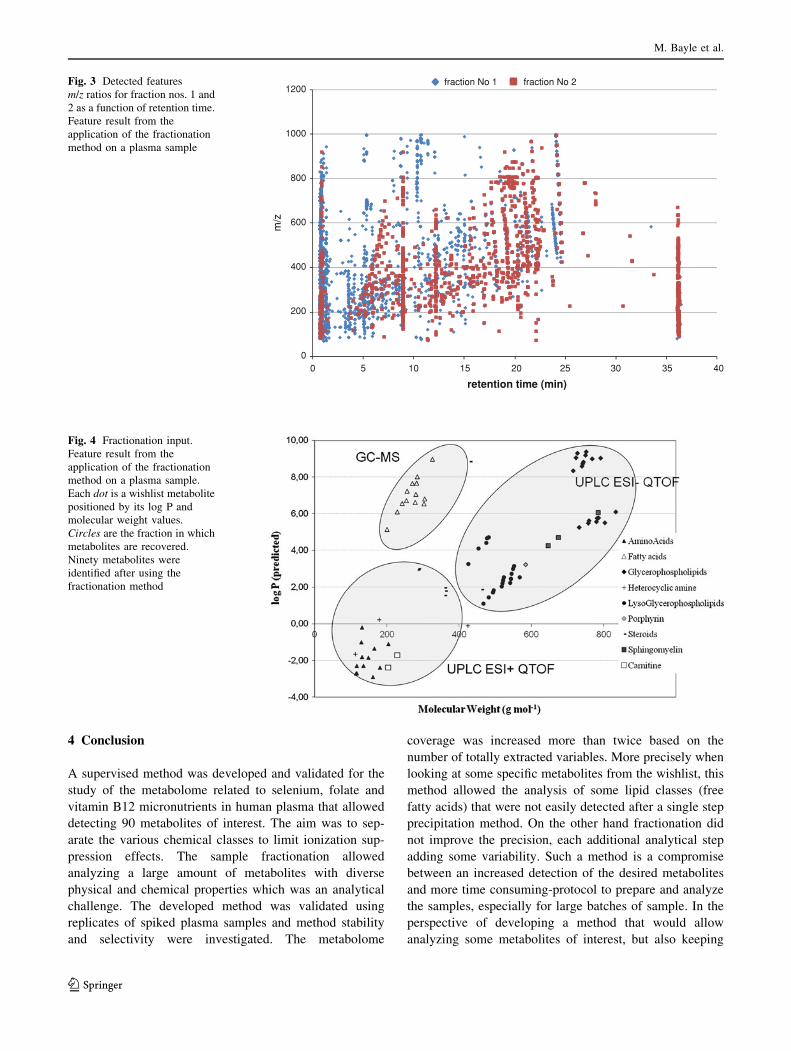
4 Conclusion
A supervised method was developed and validated for the
study of the metabolome related to selenium, folate and
vitamin B12 micronutrients in human plasma that allowed
detecting 90 metabolites of interest. The aim was to sep-
arate the various chemical classes to limit ionization sup-
pression effects. The sample fractionation allowed
analyzing a large amount of metabolites with diverse
physical and chemical properties which was an analytical
challenge. The developed method was validated using
replicates of spiked plasma samples and method stability
and selectivity were investigated. The metabolome
coverage was increased more than twice based on the
number of totally extracted variables. More precisely when
looking at some specific metabolites from the wishlist, this
method allowed the analysis of some lipid classes (free
fatty acids) that were not easily detected after a single step
precipitation method. On the other hand fractionation did
not improve the precision, each additional analytical step
adding some variability. Such a method is a compromise
between an increased detection of the desired metabolites
and more time consuming-protocol to prepare and analyze
the samples, especially for large batches of sample. In the
perspective of developing a method that would allow
analyzing some metabolites of interest, but also keeping
0
200
400
600
800
1000
1200
0 5 10 15 20 25 30 35 40
m/z
retention time (min)
fraction No 1 fraction No 2Fig. 3 Detected features
m/z ratios for fraction nos. 1 and
2 as a function of retention time.
Feature result from the
application of the fractionation
method on a plasma sample
Fig. 4 Fractionation input.
Feature result from the
application of the fractionation
method on a plasma sample.
Each dot is a wishlist metabolite
positioned by its log P and
molecular weight values.
Circles are the fraction in which
metabolites are recovered.
Ninety metabolites were
identified after using the
fractionation method
M. Bayle et al.
123
the opportunity to discover new features resulting from a
metabolic change, the present work shows the interest of
having a supervised approach.
Acknowledgments This research was undertaken as an activity of
the EURRECA Network of Excellence (www.eurreca.org), funded by
the European Commission Contract Number FP6 036196-2 (FOOD).
References
Ashwell, M., Lambert, J. P., Alles, M. S., Branca, F., Bucchini, L.,
Brzozowska, A., et al. (2008). How we will produce the
evidence-based EURRECA toolkit to support nutrition and food
policy. European Journal of Nutrition, 47(Suppl 1), 2–16.
Bateman, H. G., & Jenkins, T. C. (1997). Method for extraction and
separation by solid phase extraction of neutral lipid, free fatty
acids, and polar lipid from mixed microbial cultures. Journal ofAgricultural and Food Chemistry, 45(1), 132–134.
Bligh, E. G., & Dyer, W. J. (1959). A rapid method of total lipid
extraction and purification. Canadian Journal of Biochemistryand Physiology, 37(8), 911–917.
Boccard, J., Grata, E., Thiocone, A., Gauvrit, J.-Y., Lanteri, P.,
Carrupt, P.-A., et al. (2007). Multivariate data analysis of rapid
LC-TOF/MS experiments from Arabidopsis thaliana stressed by
wounding. Chemometrics and Intelligent Laboratory Systems,86(2), 189–197.
Bruce, S. J., Jonsson, P., Antti, H., Cloarec, O., Trygg, J., Marklund,
S. L., et al. (2008). Evaluation of a protocol for metabolic
profiling studies on human blood plasma by combined ultra-
performance liquid chromatography/mass spectrometry: From
extraction to data analysis. Analytical Biochemistry, 372(2),
237–249.
Bruce, S. J., Tavazzi, I., Parisod, V., Rezzi, S., Kochhar, S., & Guy, P.
A. (2009). Investigation of human blood plasma sample
preparation for performing metabolomics using ultrahigh per-
formance liquid chromatography/mass spectrometry. AnalyticalChemistry, 81(9), 3285–3296.
Buscher, J. M., Czernik, D., Ewald, J. C., Sauer, U., & Zamboni, N.
(2009). Cross-platform comparison of methods for quantitative
metabolomics of primary metabolism. Analytical Chemistry,81(6), 2135–2143.
Cai, X., Zou, L., Dong, J., Zhao, L., Wang, Y., Xu, Q., et al. (2009).
Analysis of highly polar metabolites in human plasma by ultra-
performance hydrophilic interaction liquid chromatography
coupled with quadrupole-time of flight mass spectrometry.
Analytica Chimica Acta, 650(1), 10–15.
Chen, J., Zhao, X., Fritsche, J., Yin, P., Schmitt-Kopplin, P., Wang,
W., et al. (2008). Practical approach for the identification and
isomer elucidation of biomarkers detected in a metabolomic
study for the discovery of individuals at risk for diabetes by
integrating the chromatographic and mass spectrometric infor-
mation. Analytical Chemistry, 80(4), 1280–1289.
Dettmer, K., Aronov, P. A., & Hammock, B. D. (2007). Mass
spectrometry-based metabolomics. Mass Spectrometry Reviews,26(1), 51–78.
Dhonukshe-Rutten, R. A. M., Timotijevic, L., Cavelaars, A. E. J. M., Raats,
M. M., de Wit, L. S., et al. (2010). European micronutrient
recommendations aligned: Ageneral framework developed by EUR-
RECA. European Journal of Clinical Nutrition, 64(S2): S2–S10.
Dobson, C. M. (2004). Chemical space and biology. Nature,
432(7019), 824–828.
Doets, E. L., de Wit, L. S., Dhonukshe-Rutten, R. A. M., Cavelaars,
A. E. J. M., Raats, M. M., Timotijevic, L., et al. (2008). Current
micronutrient recommendations in Europe: Towards understand-
ing their differences and similarities. European Journal ofNutrition, 47(1), 17–40.
Dunn, W. B., Bailey, N. J. C., & Johnson, H. E. (2005). Measuring the
metabolome: Current analytical technologies. Analyst, 130(5),
606–625.
Fahy, E., Subramaniam, S., Brown, H. A., Glass, C. K., Merrill, A.
H. J., Murphy, R. C., et al. (2005). A comprehensive classification
system for lipids. Journal of Lipid Research, 46(5), 839–862.
Fahy, E., Subramaniam, S., Murphy, R. C., Nishijima, M., Raetz, C.
R. H., Shimizu, T., et al. (2009). Update of the LIPID MAPS
comprehensive classification system for lipids. Journal of LipidResearch, 50, S9–S14.
Fiehn, O. (2002). Metabolomics: The link between genotypes and
phenotypes. Plant Molecular Biology, 48(1–2), 155–171.
Folch, J., Lees, M., & Stanley, G. H. S. (1957). A simple method forthe isolation and purification of total lipids from animal tissues.
Journal of Biological Chemistry, 226(1), 497–509.
Gibney, M. J., Walsh, M., Brennan, L., Roche, H. M., German, B., &
van Ommen, B. (2005). Metabolomics in human nutrition:
Opportunities and challenges. American Journal of ClinicalNutrition, 82(3), 497–503.
Guy, P. A., Tavazzi, I., Bruce, S. J., Ramadan, Z., & Kochhar, S.
(2008). Global metabolic profiling analysis on human urine by
UPLC-TOFMS: Issues and method validation in nutritional
metabolomics. Journal of Chromatography B. Analytical Tech-nologies in the Biomedical and Life Sciences, 871(2), 253–260.
Halket, J. M., Waterman, D., Przyborowska, A. M., Patel, R. K. P.,
Fraser, P. D., & Bramley, P. M. (2005). Chemical derivatization
and mass spectral libraries in metabolic profiling by GC–MS and
LC/MS/MS. Journal of Experimental Botany, 56(410), 219–243.
Horai, H., Arita, M., Kanaya, S., Nihei, Y., Ikeda, T., Suwa, K., et al.
(2010). MassBank: A public repository for sharing mass spectral
data for life sciences. Journal of Mass Spectrometry, 45(7),
703–714.
Hu, Q., Noll, R. J., Li, H., Makarov, A., Hardman, M., & Cooks, R. G.
(2005). The Orbitrap: A new mass spectrometer. Journal of MassSpectrometry, 40(4), 430–443.
Issaq, H. J., Abbott, E., & Veenstra, T. D. (2008). Utility of separation
science in metabolomic studies. Journal of Separation Science,31(11), 1936–1947.
Katajamaa, M., Miettinen, J., & Oresic, M. (2006). MZmine: Toolbox
for processing and visualization of mass spectrometry based
molecular profile data. Bioinformatics, 22(5), 634–636.
Kell, D. B. (2004). Metabolomics and systems biology: Making sense
of the soup. Current Opinion in Microbiology, 7(3), 296–307.
Kim, H., & Salem, N. J. (1990). Separation of lipid classes by solid
phase extraction [published erratum appears in Journal of Lipid
Research 1993; 34(1):166]. Journal of Lipid Research, 31(12),
2285–2289.
Kind, T., & Fiehn, O. (2007). Seven golden rules for heuristic filtering
of molecular formulas obtained by accurate mass spectrometry.
BMC Bioinformatics, 8, 105–124.
King, R., Bonfiglio, R., Fernandez-Metzler, C., Miller-Stein, C., &
Olah, T. (2000). Mechanistic investigation of ionization sup-
pression in electrospray ionization. Journal of The AmericanSociety for Mass Spectrometry, 11(11), 942–950.
Koulman, A., Lane, G. A., Harrison, S. J., & Volmer, D. A. (2009).
From differentiating metabolites to biomarkers. Analytical andBioanalytical Chemistry, 394(3), 663–670.
Lipinski, C., & Hopkins, A. (2004). Navigating chemical space for
biology and medicine. Nature, 432(7019), 855–861.
Matuszewski, B. K., Constanzer, M. L., & Chavez-Eng, C. M. (2003).
Strategies for the assessment of matrix effect in quantitative
bioanalytical methods based on HPLC–MS/MS. AnalyticalChemistry, 75(13), 3019–3030.
Semi-targeted metabolomic approaches
123

Michopoulos, F., Lai, L., Gika, H., Theodoridis, G., & Wilson, I.
(2009). UPLC–MS-based analysis of human plasma for meta-
bolomics using solvent precipitation or solid phase extraction.
Journal of Proteome Research, 8(4), 2114–2121.
Newman, J. W., Watanabe, T., & Hammock, B. D. (2002). The
simultaneous quantification of cytochrome P450 dependent
linoleate and arachidonate metabolites in urine by HPLC–MS/
MS. Journal of Lipid Research, 43(9), 1563–1578.
Nicholson, J. K., & Wilson, I. D. (2003). Understanding ‘global’
systems biology: Metabolomics and the continuum of metabo-
lism. Nature Reviews Drug Discovery, 2(8), 668–676.
Nithipatikom, K., Grall, A. J., Holmes, B. B., Harder, D. R., Falck, J.
R., & Campbell, W. B. (2001). Liquid chromatographic–
electrospray ionization–mass spectrometric analysis of cyto-
chrome P450 metabolites of arachidonic acid. AnalyticalBiochemistry, 298(2), 327–336.
Nordstrom, A., Want, E., Northen, T., Lehtio, J., & Siuzdak, G.
(2008). Multiple ionization mass spectrometry strategy used to
reveal the complexity of metabolomics. Analytical Chemistry,80(2), 421–429.
Pereira, H., Martin, J.-F., Joly, C., Sebedio, J.-L., & Pujos-Guillot, E.
(2010). Development and validation of a UPLC/MS method for a
nutritional metabolomic study of human plasma. Metabolomics,6(2), 216–218.
Petritis, K. N., Chaimbault, P., Elfakir, C., & Dreux, M. (1999). Ion-
pair reversed-phase liquid chromatography for determination of
polar underivatized amino acids using perfluorinated carboxylic
acids as ion pairing agent. Journal of Chromatography A,833(2), 147–155.
Pijls, L., Ashwell, M., & Lambert, J. (2009). EURRECA: A network
of excellence to align European micronutrient recommendations.
Food Chemistry, 113(3), 748–753.
Piraud, M., Vianey-Saban, C., Petritis, K., Elfakir, C., Steghens, J.-P.,
& Bouchu, D. (2005). Ion-pairing reversed-phase liquid
chromatography/electrospray ionization mass spectrometric
analysis of 76 underivatized amino acids of biological interest:
A new tool for the diagnosis of inherited disorders of amino acid
metabolism. Rapid Communications in Mass Spectrometry,19(12), 1587–1602.
Poole, C. F. (2007). Matrix-induced response enhancement in
pesticide residue analysis by gaschromatography. Journal ofChromatography A, 1158, 241–250.
Psychogios, N., Hau, D. D., Peng, J., Guo, A. C., Mandal, R., Bouatra,
S., et al. (2011). The human serum metabolome. PLoS ONE, 6,
e16957.
Retra, K., Bleijerveld, O. B., van Gestel, R. A., Tielens, A. G., van
Hellemond, J. J., & Brouwers, J. F. (2008). A simple and
universal method for the separation and identification of
phospholipid molecular species. Rapid Communications in MassSpectrometry, 22(12), 1853–1862.
Sana, T. R., Waddell, K., & Fischer, S. M. (2008). A sample
extraction and chromatographic strategy for increasing LC/MS
detection coverage of the erythrocyte metabolome. Journal of
Chromatography B. Analytical Technologies in the Biomedicaland Life Sciences, 871(2), 314–321.
Scalbert, A., Brennan, L., Fiehn, O., Hankemeier, T., Kristal, B. S.,
van Ommen, B., et al. (2009). Mass-spectrometry-based meta-
bolomics in nutrition? Current limitations and recommendations.
Metabolomics, 5(4), 435–458.
Smith, C. A., Want, E. J., O’Maille, G., Abagyan, R., & Siuzdak, G.
(2006). XCMS: Processing mass spectrometry data for metab-
olite profiling using nonlinear peak alignment, matching, and
identification. Analytical Chemistry, 78(3), 779–787.
Sumner, L., Amberg, A., Barrett, D., Beale, M., Beger, R., Daykin,
C., et al. (2007). Proposed minimum reporting standards for
chemical analysis. Metabolomics, 3, 211–221.
Tardy, A.-L., Lambert-Porcheron, S., Malpuech-Brugere, C., Girau-
det, C., Rigaudiere, J.-P., Laillet, B., et al. (2009). Dairy and
industrial sources of trans fat do not impair peripheral insulin
sensitivity in overweight women. American Journal of ClinicalNutrition, 90(1), 88–94.
Van der Greef, J., Hankemeier, T., & McBurney, R. N. (2006).
Metabolomics-based systems biology and personalized medi-
cine: Moving towards n = 1 clinical trials? Pharmacogenomics,7(7), 1087–1094.
Van der Kloet, F. M., Bobeldijk, I., Verheij, E. R., & Jellema, R. H.
(2009). Analytical error reduction using single point calibration
for accurate and precise metabolomic phenotyping. Journal ofProteome Research, 8(11), 5132–5141.
Van Ommen, B., Fairweather-Tait, S., Freidig, A., Kardinaal, A.,
Scalbert, A., & Wopereis, S. (2008). A network biology model of
micronutrient related health. British Journal of Nutrition, 99,
S72–S80.
Van Ommen, B., & Stierum, R. (2002). Nutrigenomics: Exploiting
systems biology in the nutrition and health arena. CurrentOpinion in Biotechnology, 13(5), 517–521.
Wishart, D. S. (2008). Metabolomics: Applications to food science
and nutrition research. Trends in Food Science & Technology,19(9), 482–493.
Wishart, D. S., Tzur, D., Knox, C., Eisner, R., Guo, A. C., Young, N.,
et al. (2007). HMDB: The human metabolome database. NucleicAcids Research, 35, D521–D526.
Wolf, C., & Quinn, P. J. (2008). Lipidomics: Practical aspects and
applications. Progress in Lipid Research, 47(1), 15–36.
Wopereis, S., Rubingh, C. M., van Erk, M. J., Verheij, E. R., van
Vliet, T., Cnubben, N. H. P., et al. (2009). Metabolic profiling of
the response to an oral glucose tolerance test detects subtle
metabolic changes. PLoS ONE, 4(2), e4525.
Zarzycki, P. K., Kulhanek, K. M., Smith, R., & Clifton, V. L. (2006).
Determination of steroids in human plasma using temperature-
dependent inclusion chromatography for metabolomic investi-
gations. Journal of Chromatography A, 1104(1–2), 203–208.
Zeisel, S. H., Freake, H. C., Bauman, D. E., Bier, D. M., Burrin, D.
G., German, J. B., et al. (2005). The nutritional phenotype in the
age of metabolomics. Journal of Nutrition, 135(7), 1613–1616.
M. Bayle et al.
123