Embed Size (px)
Citation preview
Semi-Automated Processing and Routing Within IndoorStructures For Emergency Response Applications
Jianfei Liu and Kyle Lyons and Kalpathi Subramanian and William Ribarsky
The University of North Carolina at CharlotteCharlotte Visualization Center, Department of Computer Science
9201 University City Blvd, Charlotte, North Carolina, USA
ABSTRACT
In this work, we propose new automation tools to process 2D building geometry data for effective communicationand timely response to critical events in commercial buildings. Given the scale and complexity of commercialbuildings, robust and visually rich tools are needed during an emergency. Our data processing pipeline consists ofthree major components, (1) adjacency graph construction, representing spatial relationships within a building(between hallways, offices, stairways, elevators), (2) identification of elements involved in evacuation routes(hallways, stairways), (3) 3D building network construction, by connecting the oor elements via stairways andelevators. We have used these tools to process a cluster of five academic buildings. Our automation tools (despitesome needed manual processing) show a significant advantage over manual processing (a few minutes vs. 2-4hours). Designed as a client-server model, our system supports analytical capabilities to determine dynamicrouting within a building under constraints(parts of the building blocked during emergencies, for instance).Visualization capabilities are provided for easy interaction with the system, on both desktop (command post)stations as well as mobile hand-held devices, simulating a command post-responder scenario.
Keywords: automation, GIS, building network, emergency response, visual analytics
1. INTRODUCTION
Effective management of natural and man-made disasters are becoming increasingly important in order to preventor minimize loss of life and property. Emergency management, as currently defined consists of four phases:mitigation, preparedness, response and recovery. Of these mitigation and preparedness refer to activities priorto an emergency, while response and recovery are activities during or after the event. The use of GeographicInformation Systems(GIS) is currently the technological tool of choice in managing large-scale disasters.10 GISsystems centrally contain spatial and other attribute data that are relevant to an event and can be used byemergency responders for timely decision making. The extent to which these systems are used depends on alarge number of factors, and most importantly, on available resources at the county level.
Traditional GIS based decision support systems have significant limitations;19 spatial data is in 3D, while mostexisting systems do not have full support for 3D geometry structures, attributes and textures, and navigationcapabilities. Ideally, the rich capabilities of graphics and visualization systems is yet to be translated intotoday’s GIS systems. A very recent work by Lee et al.12 on using triangle structures based on voronoi diagramsexemplifies this need. Here the authors propose this structure as a basis for efficient spatial queries, as well as ameans to explore what-if style scenarios, in terms of locating infrastructure and other resources for emergencymanagement. A good discussion of significant impediments to using GIS is presented by Zerger et. al.17 foremergency management, including limitations in spatial data accuracy and quality, limited numerical and real-time modeling capabilities.
Further author information: (Send correspondence to Kalpathi Subramanian)Kalpathi Subramanian: E-mail: [email protected], Tel: 1 704-687-8579Jianfei Liu: E-mail: [email protected] Lyons: E-mail: [email protected] Ribarsky: E-mail: [email protected]
In this work, our focus is on emergency management issues and constraints that relate to interiors of com-mercial buildings. Earlier work on this has focused on the larger problem of such environments to the rest ofthe transportation network.11,13 Buildings, also classified as micro-spatial environments, present some uniquechallenges in emergency management, including (1) evacuation of large buildings via limited paths throughstairways/elevators, and (2) communication such as GPS is not reliable, presenting challenges to emergencyresponders. Additionally, emergency responders need to have a good understanding of the building geometryfor fast and effective response. Given that there are hundreds of thousands of buildings, there is a need to buildnew infrastructure that can provide emergency responders with new tools for both effective communication andresponse.
We present new tools to automatically process building data (from their original 2D CAD files) into a 3Dgraph representation. There are 4 steps to this process:
1. Data Acquisition/Preprocessing. This step starts with the raw CAD files, georeferences the data to abase map, and does some cleansing to ensure data accuracy and consistency.
2. Adjacency Graph. In this step, spatial adjacency relationships are derived from the raw polygon datain the CAD files, resulting in a 2D graph for each floor of the building. Hallways, stairways elevators andentrances may need to be manually identified, depending on whether the input file contains this information.
3. Centerline Extraction. A distance transform based algorithm is used to automatically extract thecenterline (medial axis) of the hallway polygons, that typically make up the evacuation routes of thebuilding. Some postprocessing is necessary to complete this process.
4. Building Graph Construction. The adjacency graph and extracted centerline are used to determinethe rooms adjacent to the centerline and build a 2D network (also a graph representation) for each floor.These 2D networks are then combined with the stairways, elevators and building entrances, resulting inthe 3D building network.
We demonstrate both visualization and analysis tools using our 3D building network on two academic build-ings, containing three and four floors respectively. We present results and the advantage of our new automationtools in reducing the time needed to build a 3D building network, by comparison to traditional manual process-ing. It is to be noted that current GIS systems such as ArcGIS lack the capability to maintain and representtrue 3D building networks, and at best provide limited 3D viewing tools.
2. METHODS
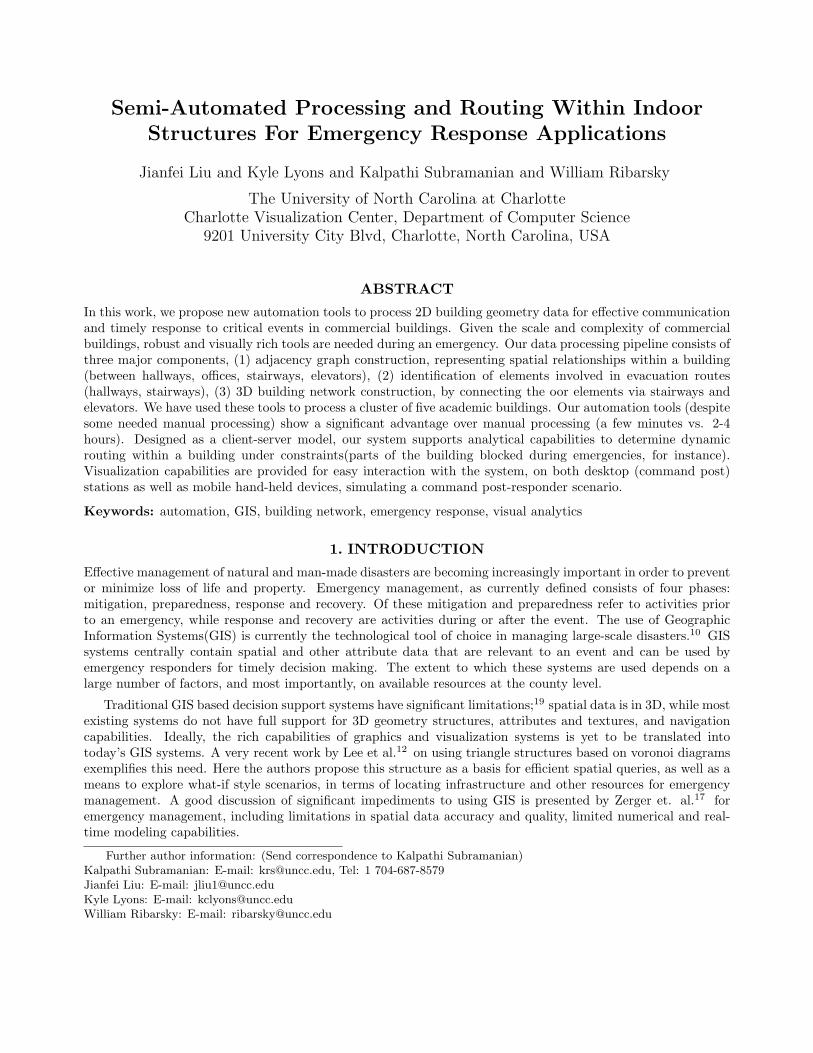
Fig. 1 shows the framework for constructing the 3D building network, starting from the building CAD files. Aftersome preprocessing, the adjacency relationships between different polygon elements in each floor is determinedand represented as a 2D graph. Elements relevant to determining evacuation routes such as hallways, stair-ways, elevators and entrances are interactively identified. Next, centerlines of hallway polygons are extracted.Using the adjacency graph, all rooms adjacent to the hallway are connected to the nearest centerline point,resulting in a 2D network for each floor. Finally, the 2D networks from each floor are linked by the stairways,elevators and the building entrances, resulting in a 3D building network. All processed data is maintained in aPostgreSQL/PostGIS database.1,2
2.1 Data Acquisition and Preprocessing
Data acquisition begins with the CAD building files that will ultimately be incorporated into our PostGISdatabase. These drawing files are are read by ArcGIS(ESRI) software. Since these files contain data in 2D (eachfloor is on a separate file), and miss information on the connections between the floors(staircase, elevators),some manual processing is needed to prepare the data for 3D processing and graph construction. Additionally,elimination of data errors and consistency checking is necessary to avoid problems down the line.
Since the CAD files contain no spatial reference information, they must first be geo-referenced to a base mapso as to line up with other datasets. We use the Spatial Adjustment tools in ArcGIS to define control points
Figure 1. The process of constructing 3D building network.
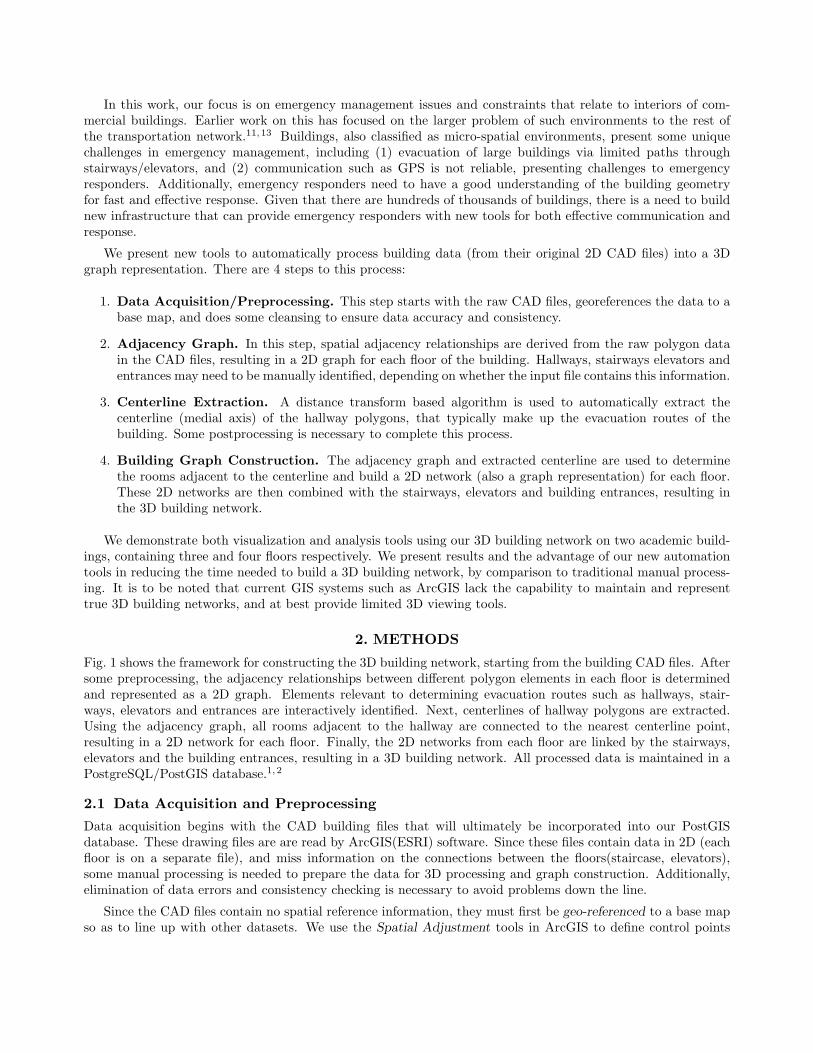
Figure 2. Adjacency Graph construction. A floor of a building is illustrated with a hallway polygon selected (light red).The automatically selected adjacent rooms and hallway polygon are illustrated (dark orange polygons). Building stairwaysare shown in green, and entrance to the building is in light red(next to the stairway, middle left)
on the base map and point them to the same areas on the CAD building file. These are usually corners ofthe building or other defining features that will allow the algorithm to line up the data correctly with minimaldistortion. Using a building footprint file or a rectified orthophoto allows a georeference to a coordinate system(in our case, NAD1983) and “spatially enable” our data.
Once georeferenced, ArcGIS is used to read the files in their native format and convert to Shapefile format.Four shapefiles are produced for each CAD file, based on geometry type: point, line, multipatch, and polygon.Currently we only use the polygon data, which contain rooms, stairways and elevators. Next, all unneededdata are removed, and the files are “cleansed”. A tag in the attribute table of the shapefile identifies the room,stairway, and elevator polygons. These are labeled as RM$, and a simple SQL query is used to select and insertthem into their own separate file.
The “cleaned” files are uploaded into a central PostgreSQL with PostGIS database. This database serves asthe central data server for the application, and allows updates to be propagated down the line to any devicereading from it. We use the database as the input source for the 3D building network construction, visualization,and other analysis tasks of the building.
2.2 Adjacency Graph Construction
Construction of the 3D building network requires knowledge of the spatial relationships between the elements thatmake up each floor and the links between the floors. However, the input database contains simply a collectionof polygons that represent these elements at each floor. Thus we begin by analyzing the spatial relationshipsbetween the polygonal elements. For the sake of spatial analysis, we consider all polygonal elements to be rooms,except for hallways, stairways, and elevators. The goal is to recover and represent the relationship between
these elements in an adjacency graph, where nodes represent polygonal elements and edges connect neighboringpolygons.
Once the input polygonal data is read from the PostGIS database, each polygon’s vertex ordering is checked,so as to be in counter-clockwise order, ensuring consistent orientation. Duplicate vertices, if any, are removed.Then the polygons (which may be concave) are converted into triangles using the Delaunay triangulation,3 tosimplify geometry analysis. An interactive tool is also provided to specify polygons, if the triangulation fails.
Let Tik(vk
1 ,vk2 ,v
k3) define triangle k within polygon i, with vertices vk
n, n ∈ (1, 3). Similarly, a polygonis represented as Pk(vk
1 ,vk2 , . . . ,v
kn). Suppose the current polygon Pi(vi
1,vi2, . . . ,v
in) is being processed to
determine its spatial relationship with polygon Pj(vj1,v
j2, . . . ,v
jm). There are two steps to constructing the
adjacency graph.
• Triangle-Polygon Relationship. In the first stage, each boundary vertex vjk of polygon j is evaluated
as inside or outside of triangle Tik(vk
1 ,vk2 ,v
k3) in polygon i. For computational efficiency, we circumscribe
each triangle, with oik as the center and ri
k as the radius. A boundary point is inside a triangle if√‖oi
k − vjk‖2 < ri
k + α (1)
where α is a constant value.
If all boundary points of polygon j fail Eq. 1, it can be safely removed. Otherwise, it could be adjacent topolygon i and is retained.
• External Triangle-Triangle Relationship. In the second stage, the triangles of polygon j are analyzedfor adjacency. Following the same strategy, circumcircles are constructed for each triangle of polygon j.Adjacency relationship is similarly defined between two triangles Ti
k and Tjk as,√
‖oik − oj
k‖2 < rik + rj
k + β (2)
where β is a constant value. Based on Eq. 2, the accuracy of the neighborhood relationship betweentwo polygons can be further improved by reducing β, resulting in identifying additional pairs of adjacenttriangle pairs.
Fig. 2 illustrates an example output from our method. Here we see a hallway polygon (in light red) thathas been selected. The neighboring polygons (in deep orange) that were identified are displayed, including anadjacent hallway polygon.
2.3 Identification of Hallways, Stairways, Elevators, Entrances
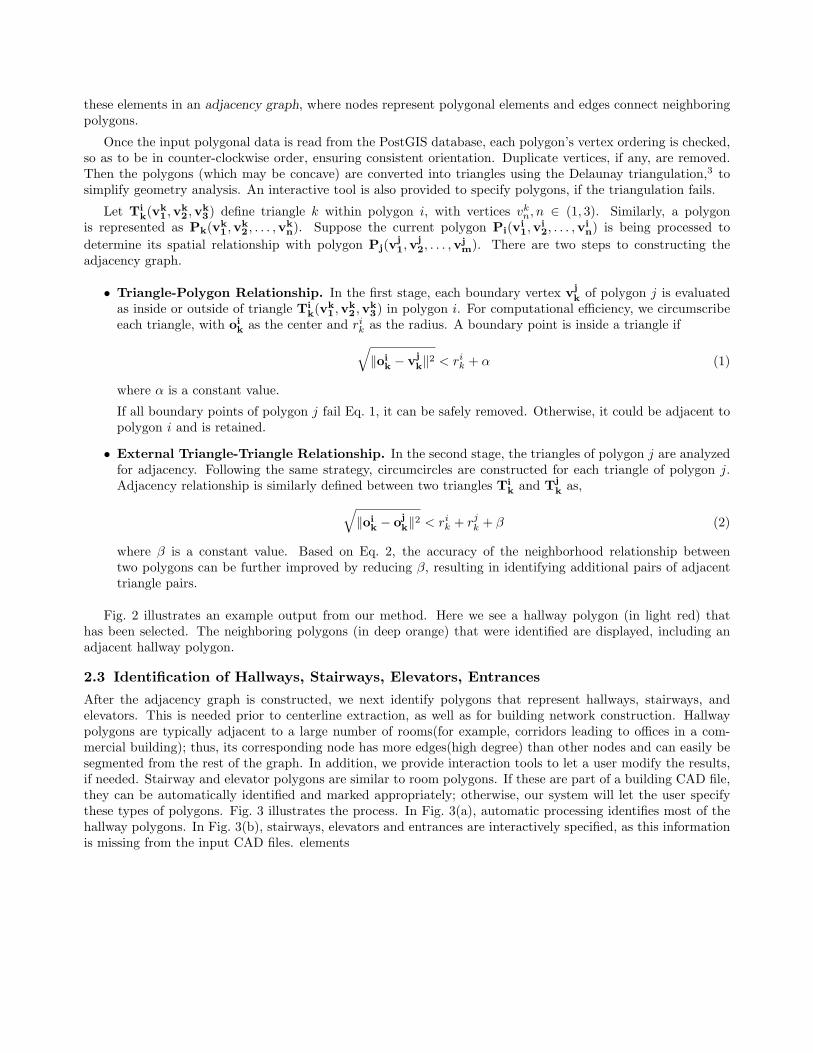
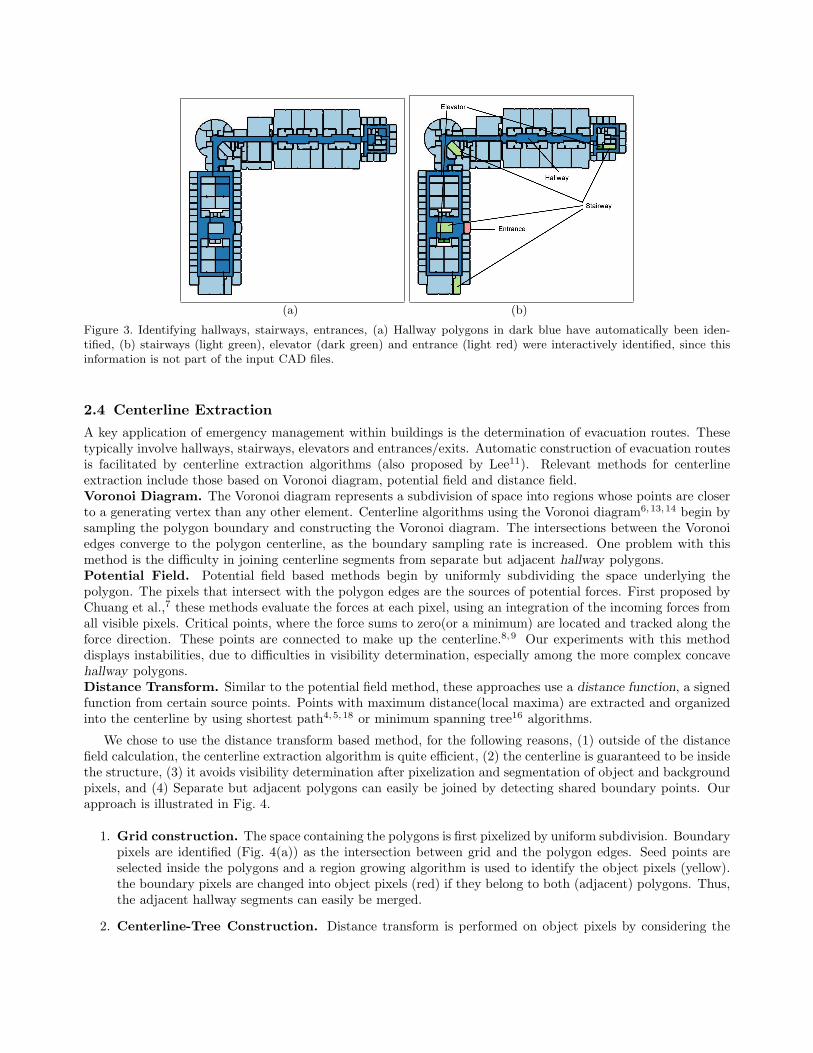
After the adjacency graph is constructed, we next identify polygons that represent hallways, stairways, andelevators. This is needed prior to centerline extraction, as well as for building network construction. Hallwaypolygons are typically adjacent to a large number of rooms(for example, corridors leading to offices in a com-mercial building); thus, its corresponding node has more edges(high degree) than other nodes and can easily besegmented from the rest of the graph. In addition, we provide interaction tools to let a user modify the results,if needed. Stairway and elevator polygons are similar to room polygons. If these are part of a building CAD file,they can be automatically identified and marked appropriately; otherwise, our system will let the user specifythese types of polygons. Fig. 3 illustrates the process. In Fig. 3(a), automatic processing identifies most of thehallway polygons. In Fig. 3(b), stairways, elevators and entrances are interactively specified, as this informationis missing from the input CAD files. elements
(a) (b)
Figure 3. Identifying hallways, stairways, entrances, (a) Hallway polygons in dark blue have automatically been iden-tified, (b) stairways (light green), elevator (dark green) and entrance (light red) were interactively identified, since thisinformation is not part of the input CAD files.
2.4 Centerline Extraction
A key application of emergency management within buildings is the determination of evacuation routes. Thesetypically involve hallways, stairways, elevators and entrances/exits. Automatic construction of evacuation routesis facilitated by centerline extraction algorithms (also proposed by Lee11). Relevant methods for centerlineextraction include those based on Voronoi diagram, potential field and distance field.Voronoi Diagram. The Voronoi diagram represents a subdivision of space into regions whose points are closerto a generating vertex than any other element. Centerline algorithms using the Voronoi diagram6,13,14 begin bysampling the polygon boundary and constructing the Voronoi diagram. The intersections between the Voronoiedges converge to the polygon centerline, as the boundary sampling rate is increased. One problem with thismethod is the difficulty in joining centerline segments from separate but adjacent hallway polygons.Potential Field. Potential field based methods begin by uniformly subdividing the space underlying thepolygon. The pixels that intersect with the polygon edges are the sources of potential forces. First proposed byChuang et al.,7 these methods evaluate the forces at each pixel, using an integration of the incoming forces fromall visible pixels. Critical points, where the force sums to zero(or a minimum) are located and tracked along theforce direction. These points are connected to make up the centerline.8,9 Our experiments with this methoddisplays instabilities, due to difficulties in visibility determination, especially among the more complex concavehallway polygons.Distance Transform. Similar to the potential field method, these approaches use a distance function, a signedfunction from certain source points. Points with maximum distance(local maxima) are extracted and organizedinto the centerline by using shortest path4,5, 18 or minimum spanning tree16 algorithms.
We chose to use the distance transform based method, for the following reasons, (1) outside of the distancefield calculation, the centerline extraction algorithm is quite efficient, (2) the centerline is guaranteed to be insidethe structure, (3) it avoids visibility determination after pixelization and segmentation of object and backgroundpixels, and (4) Separate but adjacent polygons can easily be joined by detecting shared boundary points. Ourapproach is illustrated in Fig. 4.
1. Grid construction. The space containing the polygons is first pixelized by uniform subdivision. Boundarypixels are identified (Fig. 4(a)) as the intersection between grid and the polygon edges. Seed points areselected inside the polygons and a region growing algorithm is used to identify the object pixels (yellow).the boundary pixels are changed into object pixels (red) if they belong to both (adjacent) polygons. Thus,the adjacent hallway segments can easily be merged.
2. Centerline-Tree Construction. Distance transform is performed on object pixels by considering the
(a) (b) (c)
(d) (e) (f)
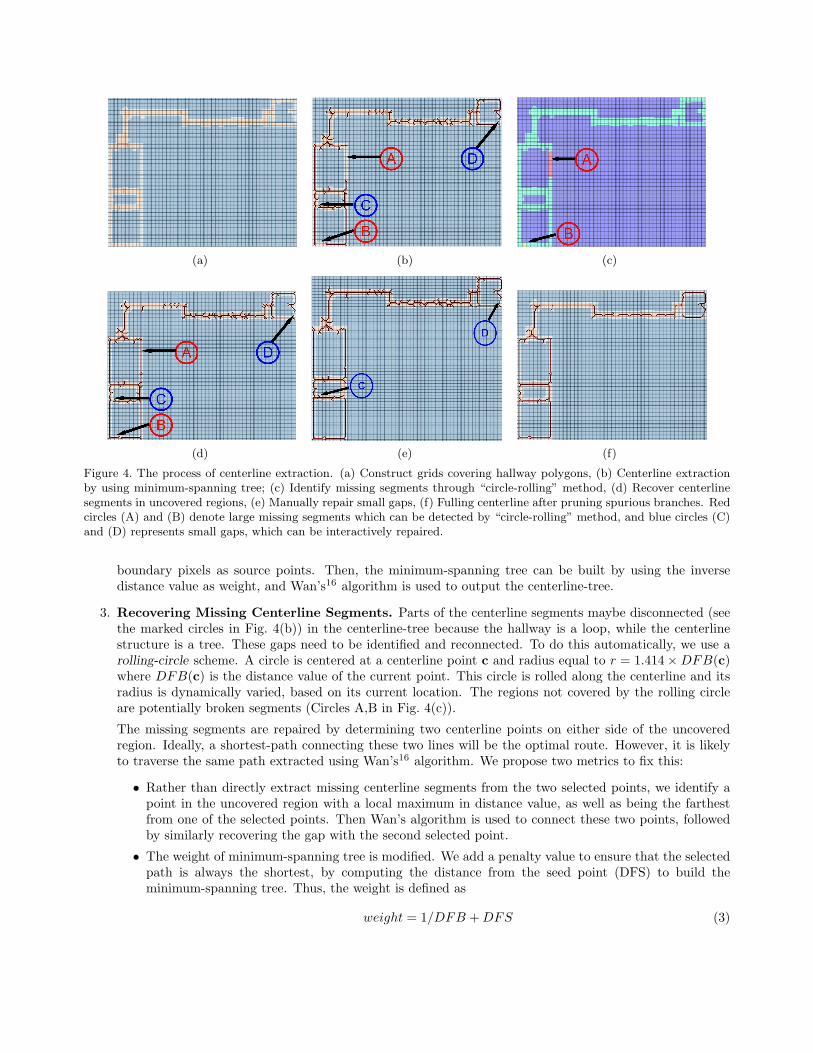
Figure 4. The process of centerline extraction. (a) Construct grids covering hallway polygons, (b) Centerline extractionby using minimum-spanning tree; (c) Identify missing segments through “circle-rolling” method, (d) Recover centerlinesegments in uncovered regions, (e) Manually repair small gaps, (f) Fulling centerline after pruning spurious branches. Redcircles (A) and (B) denote large missing segments which can be detected by “circle-rolling” method, and blue circles (C)and (D) represents small gaps, which can be interactively repaired.
boundary pixels as source points. Then, the minimum-spanning tree can be built by using the inversedistance value as weight, and Wan’s16 algorithm is used to output the centerline-tree.
3. Recovering Missing Centerline Segments. Parts of the centerline segments maybe disconnected (seethe marked circles in Fig. 4(b)) in the centerline-tree because the hallway is a loop, while the centerlinestructure is a tree. These gaps need to be identified and reconnected. To do this automatically, we use arolling-circle scheme. A circle is centered at a centerline point c and radius equal to r = 1.414×DFB(c)where DFB(c) is the distance value of the current point. This circle is rolled along the centerline and itsradius is dynamically varied, based on its current location. The regions not covered by the rolling circleare potentially broken segments (Circles A,B in Fig. 4(c)).
The missing segments are repaired by determining two centerline points on either side of the uncoveredregion. Ideally, a shortest-path connecting these two lines will be the optimal route. However, it is likelyto traverse the same path extracted using Wan’s16 algorithm. We propose two metrics to fix this:
• Rather than directly extract missing centerline segments from the two selected points, we identify apoint in the uncovered region with a local maximum in distance value, as well as being the farthestfrom one of the selected points. Then Wan’s algorithm is used to connect these two points, followedby similarly recovering the gap with the second selected point.
• The weight of minimum-spanning tree is modified. We add a penalty value to ensure that the selectedpath is always the shortest, by computing the distance from the seed point (DFS) to build theminimum-spanning tree. Thus, the weight is defined as
weight = 1/DFB +DFS (3)
(a) (b)
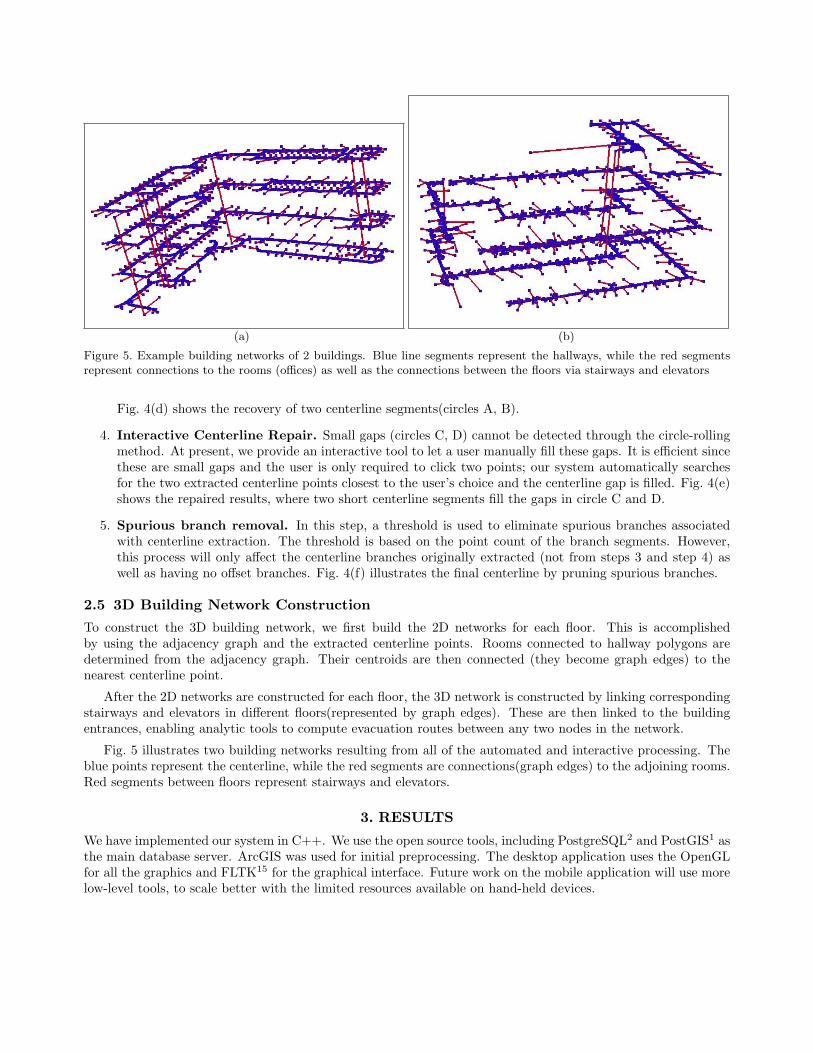
Figure 5. Example building networks of 2 buildings. Blue line segments represent the hallways, while the red segmentsrepresent connections to the rooms (offices) as well as the connections between the floors via stairways and elevators
Fig. 4(d) shows the recovery of two centerline segments(circles A, B).
4. Interactive Centerline Repair. Small gaps (circles C, D) cannot be detected through the circle-rollingmethod. At present, we provide an interactive tool to let a user manually fill these gaps. It is efficient sincethese are small gaps and the user is only required to click two points; our system automatically searchesfor the two extracted centerline points closest to the user’s choice and the centerline gap is filled. Fig. 4(e)shows the repaired results, where two short centerline segments fill the gaps in circle C and D.
5. Spurious branch removal. In this step, a threshold is used to eliminate spurious branches associatedwith centerline extraction. The threshold is based on the point count of the branch segments. However,this process will only affect the centerline branches originally extracted (not from steps 3 and step 4) aswell as having no offset branches. Fig. 4(f) illustrates the final centerline by pruning spurious branches.
2.5 3D Building Network Construction
To construct the 3D building network, we first build the 2D networks for each floor. This is accomplishedby using the adjacency graph and the extracted centerline points. Rooms connected to hallway polygons aredetermined from the adjacency graph. Their centroids are then connected (they become graph edges) to thenearest centerline point.
After the 2D networks are constructed for each floor, the 3D network is constructed by linking correspondingstairways and elevators in different floors(represented by graph edges). These are then linked to the buildingentrances, enabling analytic tools to compute evacuation routes between any two nodes in the network.
Fig. 5 illustrates two building networks resulting from all of the automated and interactive processing. Theblue points represent the centerline, while the red segments are connections(graph edges) to the adjoining rooms.Red segments between floors represent stairways and elevators.
3. RESULTS
We have implemented our system in C++. We use the open source tools, including PostgreSQL2 and PostGIS1 asthe main database server. ArcGIS was used for initial preprocessing. The desktop application uses the OpenGLfor all the graphics and FLTK15 for the graphical interface. Future work on the mobile application will use morelow-level tools, to scale better with the limited resources available on hand-held devices.
(a) (b)
(c) (d)
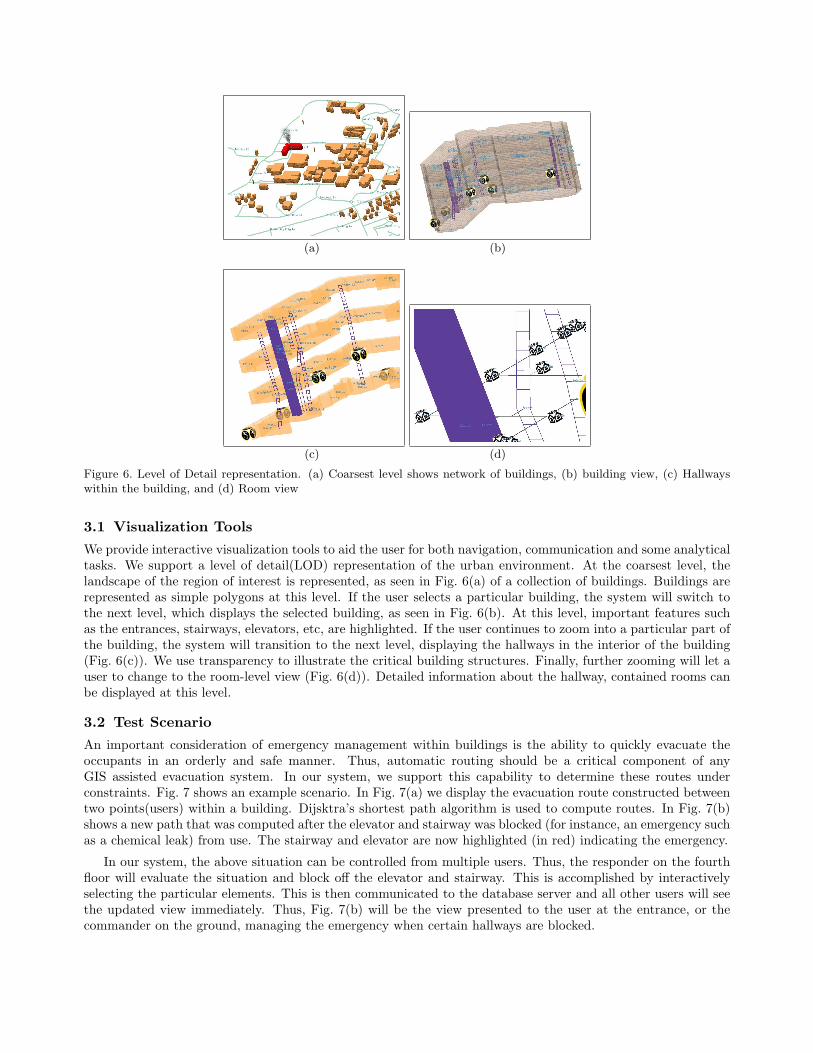
Figure 6. Level of Detail representation. (a) Coarsest level shows network of buildings, (b) building view, (c) Hallwayswithin the building, and (d) Room view
3.1 Visualization Tools
We provide interactive visualization tools to aid the user for both navigation, communication and some analyticaltasks. We support a level of detail(LOD) representation of the urban environment. At the coarsest level, thelandscape of the region of interest is represented, as seen in Fig. 6(a) of a collection of buildings. Buildings arerepresented as simple polygons at this level. If the user selects a particular building, the system will switch tothe next level, which displays the selected building, as seen in Fig. 6(b). At this level, important features suchas the entrances, stairways, elevators, etc, are highlighted. If the user continues to zoom into a particular part ofthe building, the system will transition to the next level, displaying the hallways in the interior of the building(Fig. 6(c)). We use transparency to illustrate the critical building structures. Finally, further zooming will let auser to change to the room-level view (Fig. 6(d)). Detailed information about the hallway, contained rooms canbe displayed at this level.
3.2 Test Scenario
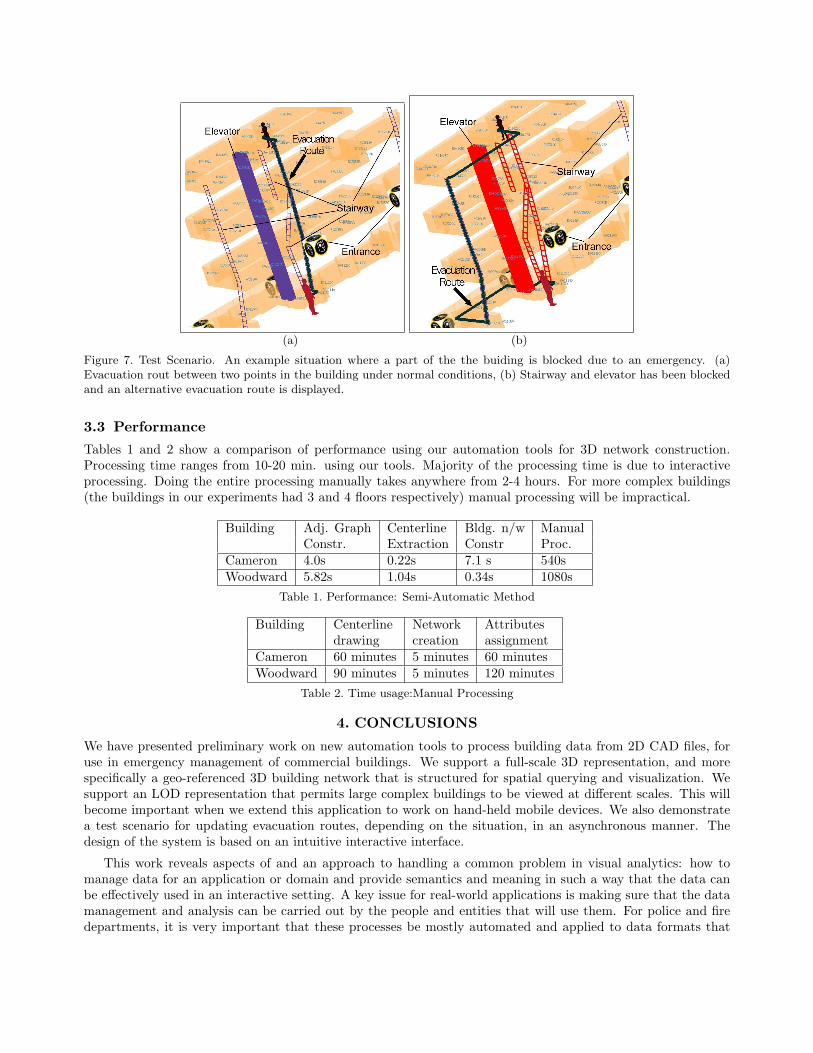
An important consideration of emergency management within buildings is the ability to quickly evacuate theoccupants in an orderly and safe manner. Thus, automatic routing should be a critical component of anyGIS assisted evacuation system. In our system, we support this capability to determine these routes underconstraints. Fig. 7 shows an example scenario. In Fig. 7(a) we display the evacuation route constructed betweentwo points(users) within a building. Dijsktra’s shortest path algorithm is used to compute routes. In Fig. 7(b)shows a new path that was computed after the elevator and stairway was blocked (for instance, an emergency suchas a chemical leak) from use. The stairway and elevator are now highlighted (in red) indicating the emergency.
In our system, the above situation can be controlled from multiple users. Thus, the responder on the fourthfloor will evaluate the situation and block off the elevator and stairway. This is accomplished by interactivelyselecting the particular elements. This is then communicated to the database server and all other users will seethe updated view immediately. Thus, Fig. 7(b) will be the view presented to the user at the entrance, or thecommander on the ground, managing the emergency when certain hallways are blocked.
(a) (b)
Figure 7. Test Scenario. An example situation where a part of the the buiding is blocked due to an emergency. (a)Evacuation rout between two points in the building under normal conditions, (b) Stairway and elevator has been blockedand an alternative evacuation route is displayed.
3.3 Performance
Tables 1 and 2 show a comparison of performance using our automation tools for 3D network construction.Processing time ranges from 10-20 min. using our tools. Majority of the processing time is due to interactiveprocessing. Doing the entire processing manually takes anywhere from 2-4 hours. For more complex buildings(the buildings in our experiments had 3 and 4 floors respectively) manual processing will be impractical.
Building Adj. Graph Centerline Bldg. n/w ManualConstr. Extraction Constr Proc.
Cameron 4.0s 0.22s 7.1 s 540sWoodward 5.82s 1.04s 0.34s 1080s
Table 1. Performance: Semi-Automatic Method
Building Centerline Network Attributesdrawing creation assignment
Cameron 60 minutes 5 minutes 60 minutesWoodward 90 minutes 5 minutes 120 minutes
Table 2. Time usage:Manual Processing
4. CONCLUSIONS
We have presented preliminary work on new automation tools to process building data from 2D CAD files, foruse in emergency management of commercial buildings. We support a full-scale 3D representation, and morespecifically a geo-referenced 3D building network that is structured for spatial querying and visualization. Wesupport an LOD representation that permits large complex buildings to be viewed at different scales. This willbecome important when we extend this application to work on hand-held mobile devices. We also demonstratea test scenario for updating evacuation routes, depending on the situation, in an asynchronous manner. Thedesign of the system is based on an intuitive interactive interface.
This work reveals aspects of and an approach to handling a common problem in visual analytics: how tomanage data for an application or domain and provide semantics and meaning in such a way that the data canbe effectively used in an interactive setting. A key issue for real-world applications is making sure that the datamanagement and analysis can be carried out by the people and entities that will use them. For police and firedepartments, it is very important that these processes be mostly automated and applied to data formats that
they have access to. Otherwise too many person-hours or expensive specialized tools will be needed, and thevisual analytics approach will never be used at scale. In our approach, we strive to automate as much as possible,keeping in mind that the problem cannot be completely automated, so it is important to have interactive tools tofinish the job quickly. In addition, standard CAD formats and GIS approaches are used, which have the addedadvantage that other GIS data can be merged with the building data and the whole system can be contributedto and perhaps even maintained by a city GIS and planning department. Finally, the data management andanalysis issues addressed here also elucidate issues of interest in the FODAVA (Foundations of Data and VisualAnalytics) efforts.
5. ACKNOWLEDGEMENTS
This work is supported by a grant from the National Institute of Justice, NIJ-2007-DE-BX-K010, under theauspices of the Department of Justice.
REFERENCES[1] Postgis. Refractions Research, http://postgis.refractions.net.[2] Postgresql. http://www.postgresql.org.[3] M. Berg, O. Cheong, M. Kreveld, and M. Overmars. Computational Geometry: Algorithms and Applications.
Springer-Verlag, third edition, 2008.[4] I. Bitter, A. Kaufman, and M. Sato. Penalized-distance volumetri skeleton algorithm. IEEE Transactions
on Visualization and Computer Graphics, 7(3):195–206, 2001.[5] I. Bitter, M. Sato, , M. Bender, K.McDonnel, A. Kaufman, and M. Wan. Ceaser: A smooth, accurate and
robust centerline-extraction algorithm. In Proceedings of IEEE Visualization 2000, pages 45–52, Oct. 2000.[6] J. Brandt and V. Alazi. Continuous skeleton computation by voronoi diagram. CVGIP: Image Understand-
ing, 55:329–338, 1992.[7] J. Chuang, C. Tsai, and M. Kuo. Skeletonization of three-dimensional object using generalized potential
field. IEEE Transactions on Pattern Analysis and Machine Intelligence, 22(11):1241–1251, 2000.[8] N. Cornea, D. Silver, and P. Min. Curve-skeleton properties, applications, and algorithms. IEEE Transac-
tions on Visualization and Computer Graphics, 13(3):530–548, 2007.[9] N. Cornea, D. Silver, X. Yuan, and R. Balasubramanian. Computing hierarchical curve-skeletons of 3d
objects. Visual Computer, 21(11):945–955, 2005.[10] A. E. Gunes and J. Kovel. Using GIS in emergency management operations. Journal of Urban Planning
and Development, 126(3):136–149, Sept. 2000.[11] M.-P. Kwan and J. Lee. Emergency response after 9/11: the potential of real-time 3D GIS for quick
emergency response in micro-spatial environments. Computers, Environment and Urban Systems, 29(2):93–113, 2005.
[12] I. Lee and K. Lee. A generic triangle-based data structure of the complete set of higher order voronoidiagrams for emergency management. Computers, Environment and Urban Systems, 33(2):90–99, 2009.
[13] J. Lee. A spatial access-oriented implementation of a 3-D GIS topological data model for urban entities.GeoInformatica, 8(3):237–264, 2004.
[14] R. Ogniewicz and M. Ilg. Voronoi skeletons: theory and applications. In IEEE Conference on ComputerVision and Pattern Recognition, pages 63–69, 1992.
[15] B. Spitzak. The fast light toolkit. http://www.fltk.org.[16] M. Wan, Z. Liang, I. Bitter, and A. Kaufman. Automatic centerline extraction for virtual colonoscopy.
IEEE Transactions on Medical Imaging, 21(12):1450–1460, 2002.[17] A. Zerger and D. I. Smith. Impediments to using GIS for real-time disaster decision support. Computers,
Environment and Urban Systems, 27(2):123–141, 2003.[18] Y. Zhou and A. W. Toga. Efficient skeletonization of volumetric objects. IEEE Transactions on Visualization
and Computer Graphics, 5(3):196–209, 1999.[19] S. Zlatanaova, A. Rahman, and M. Pilouk. Trends in 3d GIS development. Journal of Geospatial Engineer-
ing, 4(2):1–10, 2002.