Embed Size (px)
Citation preview
O C T O B E R 3 1 , 2 0 1 9
Semi-Annual Shareholder ReportStrategy Shares US Market Rotation Strategy ETF (HUSE)Strategy Shares EcoLogical Strategy ETF (HECO)Strategy Shares Nasdaq 7 Handl™ Index ETF (HNDL)
strategyshares
Beginning on January 1, 2021, as permitted by regulations adopted by the Securities and Exchange Commission, paper copies of the Strategy Shares' shareholder reports will no longer be sent by mail, unless you specifically request paper copies of the reports from your financial intermediary, such as a broker-dealer or bank. Instead, the reports will be made available on http://strategysharesetfs.com, and you will be notified by mail each time a report is posted and provided with a website link to access the report.If you already elected to receive shareholder reports electronically, you will not be affected by this change; and you need not take any action. You may elect to receive shareholder reports and other communications from your financial intermediary electronically by notifying your financial intermediary directly.You may elect to receive all future reports in paper free of charge. You can contact your financial intermediary to request that you continue to receive paper copies of your reports. Your election to receive reports in paper will apply to all funds held with your financial intermediary.


TABLE OF CONTENTS Page
Expense Examples . . . . . . . . . . . . . . . . . . . . . . . . . . . . . . . . . . . . . . . . . . . . . . . . . . . . . . . . . . . . 1
Portfolios of Investments
Strategy Shares US Market Rotation Strategy ETF (HUSE). . . . . . . . . . . . . . . . . . . . . . . . . . . 2
Strategy Shares EcoLogical Strategy ETF (HECO). . . . . . . . . . . . . . . . . . . . . . . . . . . . . . . . . . 3
Strategy Shares Nasdaq 7 Handl™ Index ETF (HNDL) . . . . . . . . . . . . . . . . . . . . . . . . . . . . . . . 4
Statements of Assets and Liabilities . . . . . . . . . . . . . . . . . . . . . . . . . . . . . . . . . . . . . . . . . . . . . . 5
Statements of Operations . . . . . . . . . . . . . . . . . . . . . . . . . . . . . . . . . . . . . . . . . . . . . . . . . . . . . . 6
Statements of Changes in Net Assets . . . . . . . . . . . . . . . . . . . . . . . . . . . . . . . . . . . . . . . . . . . . . 7
Financial Highlights . . . . . . . . . . . . . . . . . . . . . . . . . . . . . . . . . . . . . . . . . . . . . . . . . . . . . . . . . . . 10
Notes to Financial Statements . . . . . . . . . . . . . . . . . . . . . . . . . . . . . . . . . . . . . . . . . . . . . . . . . . . 12
strategyshares

[THIS PAGE INTENTIONALLY LEFT BLANK]
Semi-Annual Shareholder Report | 1
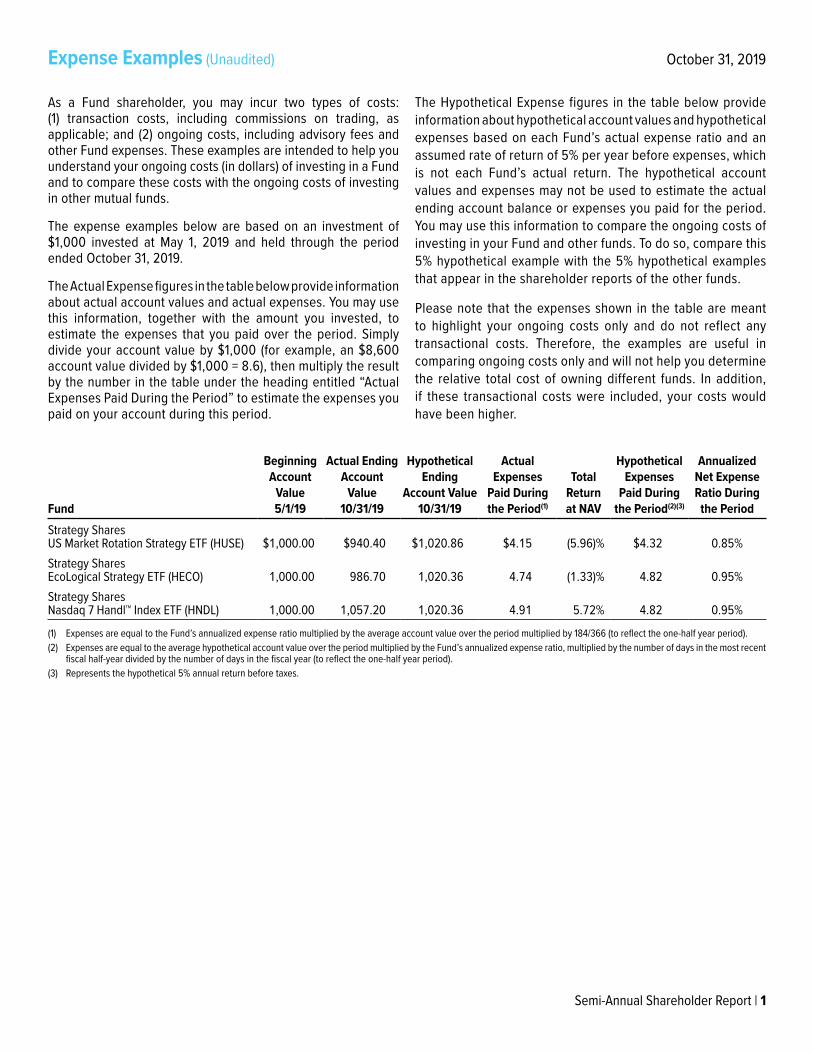
As a Fund shareholder, you may incur two types of costs: (1) transaction costs, including commissions on trading, as applicable; and (2) ongoing costs, including advisory fees and other Fund expenses. These examples are intended to help you understand your ongoing costs (in dollars) of investing in a Fund and to compare these costs with the ongoing costs of investing in other mutual funds.
The expense examples below are based on an investment of $1,000 invested at May 1, 2019 and held through the period ended October 31, 2019.
The Actual Expense figures in the table below provide information about actual account values and actual expenses. You may use this information, together with the amount you invested, to estimate the expenses that you paid over the period. Simply divide your account value by $1,000 (for example, an $8,600 account value divided by $1,000 = 8.6), then multiply the result by the number in the table under the heading entitled “Actual Expenses Paid During the Period” to estimate the expenses you paid on your account during this period.
The Hypothetical Expense figures in the table below provide information about hypothetical account values and hypothetical expenses based on each Fund’s actual expense ratio and an assumed rate of return of 5% per year before expenses, which is not each Fund’s actual return. The hypothetical account values and expenses may not be used to estimate the actual ending account balance or expenses you paid for the period. You may use this information to compare the ongoing costs of investing in your Fund and other funds. To do so, compare this 5% hypothetical example with the 5% hypothetical examples that appear in the shareholder reports of the other funds.
Please note that the expenses shown in the table are meant to highlight your ongoing costs only and do not reflect any transactional costs. Therefore, the examples are useful in comparing ongoing costs only and will not help you determine the relative total cost of owning different funds. In addition, if these transactional costs were included, your costs would have been higher.
Expense Examples (Unaudited) October 31, 2019
Fund
Beginning Account
Value 5/1/19
Actual Ending Account
Value 10/31/19
Hypothetical Ending
Account Value 10/31/19
Actual Expenses
Paid During the Period(1)
Total Return at NAV
Hypothetical Expenses
Paid During the Period(2)(3)
Annualized Net Expense Ratio During
the PeriodStrategy Shares US Market Rotation Strategy ETF (HUSE) $1,000.00 $940.40 $1,020.86 $4.15 (5.96)% $4.32 0.85%Strategy Shares EcoLogical Strategy ETF (HECO) 1,000.00 986.70 1,020.36 4.74 (1.33)% 4.82 0.95%Strategy Shares Nasdaq 7 Handl™ Index ETF (HNDL) 1,000.00 1,057.20 1,020.36 4.91 5.72% 4.82 0.95%
(1) Expenses are equal to the Fund’s annualized expense ratio multiplied by the average account value over the period multiplied by 184/366 (to reflect the one-half year period).(2) Expenses are equal to the average hypothetical account value over the period multiplied by the Fund’s annualized expense ratio, multiplied by the number of days in the most recent
fiscal half-year divided by the number of days in the fiscal year (to reflect the one-half year period).(3) Represents the hypothetical 5% annual return before taxes.

(See notes which are an integral part of the Financial Statements)2 | Semi-Annual Shareholder Report
Strategy Shares US Market Rotation Strategy ETF (HUSE) October 31, 2019 (Unaudited)
Portfolio of Investments Summary Table
Percentage of Fair ValueCommunication Services 6.8%Consumer Staples 1.8%Energy 2.2%Financials 1.8%Health Care 5.4%Industrials 6.5%Information Technology 3.5%Utilities 1.3%Exchange-Traded Funds 70.7%Total 100.0%
Portfolio holdings and allocations are subject to change. As of October 31, 2019, percentages in the table above are based on total investments. Such total investments may differ from the percentages set forth in the following Portfolio of Investments which are computed using the Fund’s total net assets.
Shares Fair Value Common Stocks — 23.4% Communication Services — 5.5% 644 Charter Communications, Inc., Class A † $301,302 5,749 T-Mobile US, Inc. † 475,211 1,386 Walt Disney Co. 180,069 5,257 Zayo Group Holdings, Inc. † 179,474 1,136,056Consumer Staples — 1.4% 3,756 Sysco Corp. 299,992 Energy — 1.7% 2,875 Cheniere Energy, Inc. † 176,956 14,537 Energy Transfer, LP 183,021 359,977Financials — 1.4% 2,367 Assurant, Inc. 298,408Health Care — 4.4% 1,431 Amgen, Inc. 305,161 2,910 Celgene Corp. † 314,367 4,578 CVS Health Corp. 303,933 923,461Industrials — 5.1% 10,869 Arconic, Inc. 298,572 3,169 Jacobs Engineering Group, Inc. 296,555 562 TransDigm Group, Inc. 295,769 1,343 WABCO Holdings, Inc. † 180,795 1,071,691Information Technology — 2.8% 1 Fiserv, Inc. † 106 2,069 Microsoft Corp. 296,633 3,603 Qualcomm, Inc. 289,825 586,564Utilities — 1.1% 35,694 PG&E Corp. † 220,232Total Common Stocks (Cost $4,872,643) $4,896,381
Shares Fair Value Exchange-Traded Funds — 56.6% 16,200 Invesco DWA Momentum ETF $988,362 15,003 Invesco S&P 500 Pure Value ETF 982,396 9,373 iShares 10-20 Year Treasury Bond ETF 1,391,797 1,693 iShares 1-3 Year Treasury Bond ETF 143,820 9,227 iShares 20+ Year Treasury Bond ETF 1,303,221 12,383 iShares 7-10 Year Treasury Bond ETF 1,393,211 12,435 iShares Core S&P Small-Capital ETF 987,588 14,800 iShares MSCI EAFE ETF 997,816 7,928 ProShares Short VIX Short-Term Futures ETF 457,921 7,202 SPDR S&P 500 ETF Trust 2,184,584 8,342 Vanguard Dividend Appreciation ETF 997,787Total Exchange-Traded Funds (Cost $11,823,684) $11,828,503Total Investments — 80.0% (Cost $16,696,327) $16,724,884Other Assets less Liabilities — 20.0% 4,176,415 Net Assets — 100.0% $20,901,299
† Non-income producing securityETF — Exchange-Traded FundLP — Limited PartnershipS&P — Standard and Poor’sSPDR — Standard and Poor’s Depositary Receipts
Portfolio of Investments

(See notes which are an integral part of the Financial Statements)Semi-Annual Shareholder Report | 3
Strategy Shares EcoLogical Strategy ETF (HECO) October 31, 2019 (Unaudited)
Portfolio of Investments Summary Table
Percentage of Fair ValueCommunication Services 3.4%Consumer Discretionary 19.9%Consumer Staples 25.1%Financials 22.5%Health Care 6.9%Industrials 7.0%Information Technology 6.9%Exchange-Traded Fund 7.7%Exchange-Traded Note 0.6%Total 100.0%
Portfolio holdings and allocations are subject to change. As of October 31, 2019, percentages in the table above are based on total investments. Such total investments may differ from the percentages set forth in the following Portfolio of Investments which are computed using the Fund’s total net assets.
Shares Fair Value Common Stocks — 80.5% Communication Services — 3.0% 703 Alphabet, Inc., Class A † $884,936 9,377 Electronic Arts, Inc. † 903,943 1,788,879Consumer Discretionary — 17.5% 440 Booking Holdings, Inc. † 901,459 16,286 Home Depot, Inc. 3,820,370 4,514 McDonald’s Corp. 887,904 8,221 Ross Stores, Inc. 901,597 65,526 TJX Companies, Inc. 3,777,574 10,288,904Consumer Staples — 22.1% 15,492 Clorox Co. 2,288,013 33,092 Coca-Cola Co. 1,801,198 3,034 Costco Wholesale Corp. 901,432 16,514 Hershey Co. 2,425,411 15,468 Monster Beverage Corp. † 868,219 34,436 PepsiCo, Inc. 4,723,586 13,007,859Financials — 19.7% 13,960 Allstate Corp. 1,485,623 19,024 Intercontinental Exchange, Inc. 1,794,344 12,580 Progressive Corp. 876,826 4,669 RenaissanceRe Holdings, Ltd. 873,943 7,130 S&P Global, Inc. 1,839,468 15,104 SEI Investments Co. 905,032 7,746 T. Rowe Price Group, Inc. 896,987 22,646 Travelers Companies, Inc. 2,967,985 11,640,208Health Care — 6.1% 4,424 Amgen, Inc. 943,418 6,356 Danaher Corp. 875,984 6,704 Johnson & Johnson 885,196 4,112 Stryker Corp. 889,302 3,593,900
Shares Fair Value Common Stocks — (Continued) Industrials — 6.0% 9,898 Ametek, Inc. $907,152 3,337 Cintas Corp. 896,552 10,398 Eaton Corp. PLC 905,770 13,012 IHS Markit, Ltd. † 911,100 3,620,574Information Technology — 6.1% 7,198 CDW Corp. 920,696 12,294 Microsoft Corp. 1,762,591 4,814 Visa, Inc., Class A 861,032 3,544,319 Total Common Stocks (Cost $46,494,073) $47,484,643Exchange-Traded Funds — 6.8% 47,121 iShares 1-3 Year Treasury Bond ETF 4,002,929Total Exchange-Traded Funds (Cost $3,995,369) $4,002,929Exchange-Traded Notes — 0.5% 31,500 VelocityShares Daily 2X VIX Short-Term ETN 290,430Total Exchange-Traded Notes (Cost $295,284) $290,430Total Investments — 87.8% (Cost $50,784,726) $51,778,002Other Assets less Liabilities — 12.2% 7,192,049 Net Assets — 100.0% $58,970,051 † Non-income producing securityETF — Exchange-Traded FundETN — Exchange-Traded NotePLC — Public Limited CompanyS&P — Standard and Poor’s
Portfolio of Investments

(See notes which are an integral part of the Financial Statements)4 | Semi-Annual Shareholder Report
Strategy Shares Nasdaq 7 Handl™ Index ETF (HNDL) October 31, 2019 (Unaudited)
Portfolio of Investments Summary Table
Percentage of Fair ValueExchange-Traded Funds 100.0%Total 100.0%
Portfolio holdings and allocations are subject to change. As of October 31, 2019, percentages in the table above are based on total investments. Such total investments may differ from the percentages set forth in the following Portfolio of Investments which are computed using the Fund’s total net assets.
Shares Fair Value Exchange-Traded Funds — 90.0% 7,524 Fidelity MSCI Utilities Index ETF $317,137 54,540 Global X MLP ETF 431,957 34,632 Global X Nasdaq 100 Covered Call ETF 801,038 63,108 Global X U.S. Preferred ETF 1,585,273 23,220 Hartford Total Return Bond ETF 964,211 7,740 Invesco QQQ Trust 1,525,399 25,092 Invesco Taxable Municipal Bond 807,711 8,136 iShares Core Growth Allocation ETF 378,894 1,620 iShares Core S&P 500 ETF 494,051 7,272 iShares Core S&P Total U.S. Stock Market ETF 498,423 20,124 iShares Core U.S. Aggregate Bond ETF 2,277,031 42,300 Schwab U.S. Aggregate Bond ETF 2,277,854 6,876 Schwab U.S. Large-Cap ETF 498,235 5,760 Schwab U.S. REIT ETF 274,637 76,860 SPDR Portfolio Aggregate Bond ETF 2,275,825 1,404 Vanguard Dividend Appreciation ETF 167,932 11,196 Vanguard Intermediate-Term Corporate Bond ETF 1,025,554 27,936 Vanguard Mortgage-Backed Securities ETF 1,489,827 30,240 Xtrackers USD High Yield Corporate Bond ETF 1,509,278Total Exchange-Traded Funds (Cost $18,653,538) $19,600,267Total Investments — 90.0% (Cost $18,653,538) $19,600,267Other Assets less Liabilities — 10.0% 2,169,001 Net Assets — 100.0% $21,769,268
ETF — Exchange-Traded FundMLP — Master Limited PartnershipREIT — Real Estate Investment TrustS&P — Standard and Poor’sSPDR — Standard and Poor’s Depositary ReceiptsUSD — United States Dollar
Portfolio of Investments
Pay/ Receive
Financing Rate Description Counterparty
Payment Frequency
Expiration Date
Notional Amount
Value and Unrealized Appreciation/ (Depreciation)
Pay 1-Month USD-LIBOR + 80 bps Nasdaq 7 Handl™ Index BNP Paribas SA Monthly 1/7/20 $8,591,010 $44,092
SA — Societe Anonyme (French Investment Bank)
The derivative instruments outstanding as of October 31, 2019 as disclosed in the Portfolio of Investments and the amounts of realized and changes in unrealized gains and losses on swaps during the period as disclosed in the Statements of Operations serve as indicators of the volume of derivative activity for the Fund.
Total Return Swap Agreement

(See notes which are an integral part of the Financial Statements)Semi-Annual Shareholder Report | 5
Statements of Assets and Liabilities October 31, 2019 (Unaudited)
Strategy Shares US Market Rotation Strategy ETF (HUSE)
Strategy Shares EcoLogical
Strategy ETF (HECO)
Strategy Shares Nasdaq 7 Handl™ Index ETF (HNDL)
Assets: Investments, at value (Cost $16,696,327, $50,784,726 and $18,653,538, respectively) $16,724,884 $51,778,002 $19,600,267Cash and Cash Equivalents 4,204,422 7,049,187 2,150,316Dividends and interest receivable 7,733 35,813 3,919Receivable for investments sold 13,379,068 12,339,233 —Unrealized appreciation on swap agreement — — 44,092Prepaid expenses 4,015 1,914 1,242
Total Assets 34,320,122 71,204,149 21,799,836Liabilities:
Payable for investments purchased 13,348,212 12,162,960 —Accrued expenses:
Advisory 24,930 31,475 6,062Administration 3,181 4,563 1,616Administrative support 6,728 2,582 2,582Compliance services 275 4 13Custodian — 2,022 —Fund accounting — 78 26Other 35,497 30,414 20,269
Total Liabilities 13,418,823 12,234,098 30,568Net Assets $20,901,299 $58,970,051 $21,769,268Net Assets consist of:
Paid in Capital $51,932,321 $61,861,807 $21,337,761Total Distributable Earnings / (Loss) (31,031,022) (2,891,756) 431,507
Net Assets $20,901,299 $58,970,051 $21,769,268
Net Assets: $20,901,299 $58,970,051 $21,769,268Shares of Beneficial Interest Outstanding
(unlimited number of shares authorized, no par value): 625,000 1,450,000 900,000Net Asset Value (offering and redemption price per share): $33.44 $40.67 $24.19

(See notes which are an integral part of the Financial Statements)6 | Semi-Annual Shareholder Report
Statements of Operations For the six months ended October 31, 2019 (Unaudited)
Strategy Shares US Market Rotation Strategy ETF (HUSE)
Strategy Shares EcoLogical
Strategy ETF (HECO)
Strategy Shares Nasdaq 7 Handl™ Index ETF (HNDL)
Investment Income:Dividend income (Net of foreign tax withholding of $2,448, $1,128 and $—, respectively) $711,152 $387,427 $276,084Interest income — 6 —
Total Investment Income 711,152 387,433 276,084Expenses:
Advisory 345,021 206,201 50,994Administration 39,961 25,913 6,604Administrative support 22,512 15,082 15,082Fund accounting 564 454 184Custodian 21,802 10,059 807Trustee 4,751 4,751 4,751Compliance services 7,870 6,876 5,014Legal and audit 12,271 12,209 14,788Printing 10,455 6,890 5,529Other fees 20,468 11,455 9,095Recoupment of prior expenses waived or reimbursed by the Advisor — 24,118 —
Total Expenses before fee reductions 485,675 324,008 112,848Expenses contractually waived or reimbursed by the Advisor — — (32,088)Total Net Expenses 485,675 324,008 80,760Net Investment Income 225,477 63,425 195,324Realized and Unrealized Gains (Losses):
Net realized losses from investment transactions (6,471,416) (1,597,965) (42,656)Net realized gains from in-kind transactions 4,323,495 1,231,935 —Net realized gains from swap agreements — — 178,709Change in unrealized appreciation/depreciation on investments (5,418,036) (789,696) 565,109Change in unrealized appreciation on swaps — — 25,291
Net Realized and Unrealized Gains (Losses) (7,565,957) (1,155,726) 726,453Change in Net Assets Resulting From Operations $(7,340,480) $(1,092,301) $921,777

(See notes which are an integral part of the Financial Statements)Semi-Annual Shareholder Report | 7
Statements of Changes in Net Assets
Strategy Shares US Market Rotation Strategy ETF (HUSE)
Strategy Shares EcoLogical Strategy ETF (HECO)
Six Months Ended October 31, 2019
(Unaudited) Year Ended
April 30, 2019
Six Months Ended October 31, 2019
(Unaudited) Year Ended
April 30, 2019 From Investment Activities:Operations:
Net investment income $225,477 $615,008 $63,425 $296,825Net realized losses from investment and in-kind transactions (2,147,921) (25,317,820) (366,030) (2,966,258)Change in unrealized appreciation/depreciation on investments (5,418,036) 5,510,802 (789,696) (70,053)Change in net assets resulting from operations (7,340,480) (19,192,010) (1,092,301) (2,739,486)
Distributions to Shareholders From:Total Distributions Paid — (6,453,325) — (1,395,408)Change in net assets from distributions — (6,453,325) — (1,395,408)
Capital Transactions:Proceeds from shares issued 10,592,411 180,054,262 24,892,453 73,960,705Cost of shares redeemed (176,175,021) (49,090,508) (28,728,488) (14,191,883)Change in net assets from capital transactions (165,582,610) 130,963,754 (3,836,035) 59,768,822Change in net assets (172,923,090) 105,318,419 (4,928,336) 55,633,928
Net Assets:Beginning of period 193,824,389 88,505,970 63,898,387 8,264,459End of period $20,901,299 $193,824,389 $58,970,051 $63,898,387Share Transactions:
Issued 300,000 4,525,000 600,000 1,700,000Redeemed (5,125,000) (1,350,000) (700,000) (350,000)Change in shares (4,825,000) 3,175,000 (100,000) 1,350,000

(See notes which are an integral part of the Financial Statements)8 | Semi-Annual Shareholder Report
Statements of Changes in Net Assets (Continued)
Strategy Shares Nasdaq 7 Handl™ Index ETF (HNDL)
Six Months Ended October 31, 2019
(Unaudited) Year Ended
April 30, 2019 From Investment Activities:Operations:
Net investment income $195,324 $206,398Net realized gains (losses) from investment transactions and swap agreements 136,053 (141,962)Change in unrealized appreciation/depreciation on investments and swaps 590,400 471,597Change in net assets resulting from operations 921,777 536,033
Distributions to Shareholders From:Total Distributions Paid (595,413) (341,012)Return of Capital — (266,122)Change in net assets from distributions (595,413) (607,134)
Capital Transactions:Proceeds from shares issued 9,000,668 10,084,271Cost of shares redeemed — (1,146,854)Change in net assets from capital transactions 9,000,668 8,937,417Change in net assets 9,327,032 8,866,316
Net Assets:Beginning of period 12,442,236 3,575,920End of period $21,769,268 $12,442,236Share Transactions:
Issued 375,000 425,000Redeemed — (50,000)Change in shares 375,000 375,000

[THIS PAGE INTENTIONALLY LEFT BLANK]

(See notes which are an integral part of the Financial Statements)10 | Semi-Annual Shareholder Report
Financial Highlights Strategy Shares
Net Asset Value,
beginning of period
Net investment
income (loss)
Net realized and unrealized gains (losses)
Total from investment
activities
Distributions from net
investment income
Distributions from Return
of Capital
Distributions from net
realized gains Strategy Shares US Market Rotation Strategy ETF (HUSE)Six Months ended October 31, 2019 (Unaudited) $35.56 0.77 (2.89) (2.12) — — —Year Ended April 30, 2019 $38.90 0.11 (2.36) (2.25) (0.06) — (1.03)Year Ended April 30, 2018 $37.82 (0.01) 3.74 3.73 (0.01) — (2.64)Year Ended April 30, 2017 $37.17 0.11 4.42 4.53 (0.20) — (3.68)Year Ended April 30, 2016 $37.96 0.29 (0.09)(g) 0.20 (0.42) — (0.57)Year Ended April 30, 2015 $35.16 0.25 4.41 4.66 (0.24) — (1.62)
Strategy Shares EcoLogical Strategy ETF (HECO)Six Months ended October 31, 2019 (Unaudited) $41.22 0.05 (0.60) (0.55) — — —Year Ended April 30, 2019 $41.32 0.05 0.65(g) 0.70 (0.11) — (0.69)Year Ended April 30, 2018 $38.31 0.47 5.00 5.47 (0.45) — (2.01)Year Ended April 30, 2017 $35.11 0.43 6.44 6.87 (0.36) — (3.31)Year Ended April 30, 2016 $37.15 0.09 (0.62) (0.53) (0.04) — (1.47)Year Ended April 30, 2015 $34.75 0.10 2.77 2.87 (0.08) — (0.39)
Strategy Shares Nasdaq 7 Handl™ Index ETF (HNDL)Six Months ended October 31, 2019 (Unaudited) $23.70 0.45 0.88 1.33 (0.84) — —Year Ended April 30, 2019 $23.84 0.56(i) 0.95 1.51 (0.92) (0.73) —January 16, 2018(j) through April 30, 2018 $25.00 0.13 (0.87) (0.74) — (0.42) —
(a) Not annualized for periods less than one year.(b) Net asset value total return is calculated assuming an initial investment made at the net asset value at the beginning of the period, reinvestment of all dividends and distributions at
net asset value during the period, if any, and redemption on the last day of the period at net asset value. This percentage is not an indication of the performance of a shareholder’s investment in the Fund based on market value due to differences between the market price of the shares and the net asset value per share of the Fund.
(c) Market value total return is calculated assuming an initial investment made at the market value at the beginning of the period, reinvestment of all dividends and distributions at net asset value during the period, if any, and redemption on the last day of the period at market value. Market value is determined by the composite closing price. Composite closing security price is defined as the last reported sale price from any primary listing market (e.g., NYSE Arca) or participating regional exchanges or markets. The composite closing price is the last reported sale price from any of the eligible sources, regardless of volume and not an average price and may have occurred on a date prior to the close of the reporting period. Market value may be greater or less than net asset value, depending on the Fund’s closing price on the listing market.
(d) Annualized for periods less than one year.(e) If applicable, certain fees were waived and/or reimbursed. If such waivers/reimbursements had not occurred, the ratios would have been as indicated. (f) Effective June 1, 2016, Tuttle Tactical Management, LLC became the investment Subadvisor to the Strategy Shares US Market Rotation Strategy ETF (HUSE). The ETF is actively
managed to rotate among stocks and sectors, therefore portfolio turnover will be higher than previous years. (g) The amount shown for a share outstanding throughout the period does not accord with the change in aggregate gains and losses in the portfolio of securities during the period
because of the timing of sales and purchases of fund shares in relation to fluctuating market values during the period.(h) Effective September 1, 2018, Tuttle Tactical Management, LLC became the investment Subadvisor to the Strategy Shares EcoLogical Strategy ETF (HECO). The ETF is actively
managed to rotate among stocks and sectors, therefore portfolio turnover will be higher than previous years. (i) Calculated using average shares method. (j) Commencement of operations.

(See notes which are an integral part of the Financial Statements)Semi-Annual Shareholder Report | 11
Total distributions
Net Asset Value, end of period
Total return at NAV(a)(b)
Total return at market(a)(c)
Ratio of Net Expenses
to Average Net Assets(d)
Ratio of Gross Expenses
to Average Net Assets(d)(e)
Ratio of Net Investment
Income (Loss) to Average
Net Assets(d)
Net Assetsat end of period
(000’s)Portfolio
turnover(a)
— $33.44 (5.96)% (6.05)% 0.85% 0.85% 0.40% $20,901 2,181%(1.09) $35.56 (5.61)% (5.90)% 0.91% 0.91% 0.31% $193,824 3,537%(2.65) $38.90 9.93% 9.98% 0.95% 0.95% (0.02)% $88,506 1,989%(3.88) $37.82 12.61% 11.45% 0.95% 2.61% 0.51% $14,184 2,875%(f)
(0.99) $37.17 0.47% 0.76% 0.95% 3.83% 0.80% $4,646 85%(1.86) $37.96 13.26% 14.68% 0.95% 2.86% 0.51% $5,693 16%
— $40.67 (1.33)% (1.31)% 0.95% 0.95% 0.19% $58,970 1,024%(0.80) $41.22 1.79% 1.35% 0.95% 1.01% 0.63% $63,898 3,099%(h)
(2.46) $41.32 14.22% 14.18% 0.95% 2.35% 1.14% $8,264 16%(3.67) $38.31 20.12% 21.04% 0.95% 2.87% 1.18% $7,661 70%(1.51) $35.11 (1.55)% (3.17)% 0.95% 3.57% 0.22% $6,144 107%(0.47) $37.15 8.26% 10.19% 0.95% 2.79% 0.19% $8,358 54%
(0.84) $24.19 5.72% 5.36% 0.95% 1.33% 2.30% $21,769 21%(1.65) $23.70 6.65% 6.68% 0.95% 2.30% 2.41% $12,442 118%(0.42) $23.84 (2.96)% (2.76)% 0.95% 6.33% 2.00% $3,576 18%

12 | Semi-Annual Shareholder Report
Notes to Financial Statements October 31, 2019 (Unaudited)
(1) OrganizationStrategy Shares (the “Trust”) was organized on September 7, 2010 as a Delaware statutory trust. The Trust is registered under the Investment Company Act of 1940 (the “1940 Act”), as an open-end management investment company. The Declaration of Trust permits the Trust to issue an unlimited number of shares of beneficial interest (“Shares”) in one or more series representing interests in separate portfolios of securities. Currently, the Trust offers its Shares in three separate series: Strategy Shares US Market Rotation Strategy ETF (HUSE) (“US Market Rotation Strategy ETF”), Strategy Shares EcoLogical Strategy ETF (HECO) (“EcoLogical Strategy ETF”), and Strategy Shares Nasdaq 7 Handl™ Index ETF (HNDL) (“Nasdaq 7 Handl™ Index ETF”) (individually referred to as a “Fund”, or collectively as the “Funds”). Each Fund is classified as diversified under the 1940 Act. The US Market Rotation Strategy ETF (HUSE) and EcoLogical Strategy ETF (HECO) are each an actively-managed exchange-traded fund. The investment objective of both the US Market Rotation Strategy ETF (HUSE) and EcoLogical Strategy ETF (HECO) is long-term capital appreciation. The Nasdaq 7 Handl™ Index ETF (HNDL) is a passively-managed exchange-traded fund. The investment objective of the Nasdaq 7 Handl™ Index ETF (HNDL) is to seek investment results that correlate to the price and yield performance of the Nasdaq 7 Handl™ Index. The Funds’ prospectuses provide a description of each Fund’s investment objectives, policies, and strategies. The assets of each Fund are segregated and a shareholder’s interest is limited to the Fund in which shares are held.Shares of the US Market Rotation Strategy ETF and EcoLogical Strategy ETF are listed and traded on the NYSE Arca, Inc. Shares of the Nasdaq 7 Handl™ Index ETF are listed and traded on the Nasdaq. Market prices for the Shares may be different from their net asset value (“NAV”). Each Fund issues and redeems Shares on a continuous basis at NAV only in large blocks, currently 25,000 Shares, called “Creation Units.” Creation Units are issued and redeemed principally in-kind for securities included in a specified universe. Once created, Shares generally trade in the secondary market at market prices that change throughout the day in amounts less than a Creation Unit.Under the Trust’s organizational documents, its officers and Board of Trustees (“the Board”) are indemnified against certain liabilities arising out of the performance of their duties to the Funds. In addition, in the normal course of business, the Trust may enter into contracts with vendors and others that provide for general indemnifications. The Trust’s maximum exposure under these arrangements is unknown, as this would involve future claims that may be made against the Trust. However, based on experience, the Trust expects that risk of loss to be remote.(2) Significant Accounting PoliciesThe following is a summary of significant accounting policies consistently followed by each Fund in the preparation of its financial statements. These policies are in conformity with generally accepted accounting principles in the United States of America (“GAAP”). Each Fund is an investment company and accordingly follows the investment company accounting and reporting guidance of the Financial Accounting Standards Board (“FASB”) Accounting Standard Codification Topic 946 Financial Services - Investment Companies. The preparation of financial statements in conformity with GAAP requires management to make estimates and assumptions that affect the amounts of assets, liabilities and disclosure of contingent assets and liabilities at the date of the financial statements and the reported amounts of income and expenses for the period. Actual results could differ from those estimates.
A. Investment ValuationsThe Funds hold investments at fair value. Fair value is defined as the price that would be expected to be received to sell an asset or paid to transfer a liability in an orderly transaction between market participants at the measurement date. The valuation techniques used to determine fair value are further described below.Security values are ordinarily obtained through the use of independent pricing services in accordance with procedures adopted by the Trust’s Board. Pursuant to these procedures, the Funds may use a pricing service, bank, or broker-dealer experienced in such matters to value the Funds’ securities. When reliable market quotations are not readily available for any security, the fair value of that security will be determined by a committee established by the Board in accordance with procedures adopted by the Board. The fair valuation process is designed to value the subject security at the price the Funds would reasonably expect to receive upon its current sale. Additional consideration is given to securities that have experienced a decrease in the volume or level of activity or to circumstances that indicate that a transaction is not orderly. The Trust has a three-tier fair value hierarchy that is dependent upon the various “inputs” used to determine the value of the Funds’ investments. The valuation techniques described below maximize the use of observable inputs and minimize the use of unobservable inputs in determining fair value. These inputs are summarized in the three broad levels listed below:• Level 1 - Quoted prices in active markets for identical assets.• Level 2 - Other observable pricing inputs at the measurement date
(including quoted prices for similar securities, interest rates, prepayment speeds, credit risk, etc.).
• Level 3 - Significant unobservable pricing inputs at the measurement date (including the Fund’s own assumptions in determining the fair value of investments).
The inputs or methodology used for valuing investments are not necessarily an indication of the risk associated with investing in those investments.Equity securities (including foreign equity securities) traded on a securities exchange are valued at the last reported sales price on the principal exchange. Equity securities quoted by Nasdaq are valued at the Nasdaq official closing price. If there is no reported sale on the principal exchange, and in the case of over-the-counter securities, equity securities are valued at a bid price estimated by the security pricing service. In each of these situations, valuations are typically categorized as Level 1 in the fair value hierarchy.Debt securities traded on a national securities exchange or in the over-the-counter market are valued at the last reported sales price on the principal exchange. If there is no reported sale on the principal exchange, and for all other debt securities, debt securities are valued at a bid price estimated by a security pricing service. In each of these situations, valuations are typically categorized as Level 2 in the fair value hierarchy.Swaps are priced daily based on the underlying index and are typically categorized as Level 2 in the fair value hierarchy.

Semi-Annual Shareholder Report | 13
The following table provides the fair value measurement as of October 31, 2019, while the breakdown, by category, of common stocks is disclosed in the Portfolio of Investments for each Fund.
Level 1 Level 2Total
InvestmentsUS Market Rotation Strategy ETF (HUSE)
Common Stocks(1) $4,896,381 $– $4,896,381Exchange-Traded Funds 11,828,503 – 11,828,503
Total Investments $16,724,884 $– $16,724,884EcoLogical Strategy ETF (HECO)
Common Stocks(1) $47,484,643 $– $47,484,643Exchange-Traded Funds 4,002,929 – 4,002,929Exchange-Traded Notes 290,430 – 290,430
Total Investments $51,778,002 $– $51,778,002Nasdaq 7 Handl™ Index ETF (HNDL)
Exchange-Traded Funds $19,600,267 $– $19,600,267Other Financial Instruments(2)
Total Return Swap Agreement – 44,092 44,092Total Investments $19,600,267 $44,092 $19,644,359
(1) Please see the Portfolio of Investments for industry classifications. (2) Other Financial Instruments are derivative instruments not reflected in the total
investments, such as swap agreements, which are valued at fair value.
For the period ended October 31, 2019, there were no Level 3 investments for which significant unobservable inputs were used to determine fair value.
B. Security Transactions and Related Income
Investment transactions are accounted for no later than the first calculation of the NAV on the business day following the trade date. For financial reporting purposes, however, security transactions are accounted for on the trade date on the last business day of the reporting period. Discounts and premiums on securities purchased are amortized over the lives of the respective securities using the effective interest method. Securities gains and losses are calculated on the identified cost basis. Interest income and expenses are accrued daily. Dividends, less foreign tax withholding, if any, are recorded on the ex-dividend date. Investment income from non-U.S. sources received by a Fund is generally subject to non-U.S. withholding taxes at rates ranging up to 30%. Such withholding taxes may be reduced or eliminated under the terms of applicable U.S. income tax treaties. The Funds may be subject to foreign taxes on gains in investments or currency repatriation. The Funds accrue such taxes, as applicable, based on their current interpretation of tax rules in the foreign markets in which they invest.
C. Cash and Cash Equivalents
Idle cash may be swept into various overnight demand deposits and is classified as cash and cash equivalents on the Statements of Assets and Liabilities. The Funds maintain cash in bank deposit accounts which, at times, may exceed United States federally insured limits. Amounts swept overnight are available on the next business day.
D. Derivative InstrumentsSwap Agreements: The Nasdaq 7 Handl™ Index ETF may enter into swap agreements (“swaps”) in an attempt to obtain a particular desired return at a lower cost to the Fund than if it had been invested directly in an instrument that yielded that desired return. Swap agreements are two-party contracts entered into primarily by institutional investors for periods ranging from a few weeks to more than one year. In a standard swap transaction, two parties agree to exchange the returns (or differentials in rates of returns) earned or realized on particular predetermined investments or instruments. The gross returns to be exchanged or “swapped” between the parties are calculated with respect to a “notional amount,” i.e., the return on or increase in value of a particular dollar amount invested in a “basket” of securities representing a particular index. The “notional amount” of the swap agreement is only a fictive basis on which to calculate the obligations the parties to a swap agreement have agreed to exchange. A Fund’s obligations (or rights) under a swap agreement will generally be equal only to the amount to be paid or received under the agreement based on the relative values of the positions held by each party to the agreement (the “net amount”). Total Return Swaps: The Nasdaq 7 Handl™ Index ETF may enter into total return swaps to gain or mitigate exposure to the underlying securities or indices. In “long” total return swaps, the counterparty will generally agree to pay the Fund the amount, if any, by which the notional amount of the swaps would have increased in value had it been invested in the particular instruments, plus an amount equal to any dividends or interest that would have been received on those instruments. The Fund will agree to pay to the counterparty an amount equal to a fixed or floating rate of interest on the notional amount of the swaps plus the amount, if any, by which the notional amount would have decreased in value had it been invested in such instruments plus, in certain instances, commissions or trading spreads on the notional amount. Total return swaps do not involve the delivery of securities or other underlying instruments. Until a total return swap is settled in cash, the gain or loss on the notional amount plus dividends or interest on the instruments less the interest paid by the Fund on the notional amount is recorded as “unrealized appreciation or depreciation on swap agreements” and, when cash is exchanged, the gain or loss realized is recorded as “realized gains or losses on swap agreements.” A Fund may enter into total return swaps that provide the opposite return of its benchmark index or security (“short” the index or security). Its operations are similar to those swaps disclosed above except that the counterparty pays interest to the Fund on the notional amount outstanding and that dividends or interest on the underlying instruments reduce the value of the swaps plus, in certain instances, the Fund will agree to pay to the counterparty commissions or trading spreads on the notional amount. These amounts are netted against any unrealized appreciation or depreciation to determine the value of the swaps. The primary risks associated with the use of swaps are an imperfect correlation between the prices of financial instruments and movements in the prices of the underlying investments and the inability of counterparties to perform under the agreement. The counterparty to any swap agreement will typically be a bank, investment banking firm or broker-dealer. The Fund will bear the counterparty risk, i.e., the risk of loss of the net amount, if any, expected to be received under a swap in the event of the default or bankruptcy of the swap counterparty. The unrealized gain or loss at October 31, 2019 is disclosed in the swap tables included in the Portfolios of Investments.
Notes to Financial Statements (Continued)

14 | Semi-Annual Shareholder Report
Summary of Derivative InstrumentsThe following table summarizes the fair values of derivative instruments on the Nasdaq 7 Handl™ Index ETF’s Statement of Assets and Liabilities, categorized by risk exposure, as of October 31, 2019.
Fund
AssetsUnrealized Appreciation
on Swap Agreement
LiabilitiesUnrealized Depreciation
on Swap AgreementEquity Risk Exposure:Nasdaq 7 Handl™ Index ETF (HNDL) $44,092 $ —
The following table presents the effect of derivative instruments on the Nasdaq 7 Handl™ Index ETF’s Statement of Operations, categorized by risk exposure, for the period ended October 31, 2019.
Fund
Net Realized Gainon Swap Agreement
Recognized as a Resultfrom Operations
Change in UnrealizedAppreciation on Swap
Agreement Recognizedfrom Operations
Equity Risk Exposure: Nasdaq 7 Handl™ Index ETF (HNDL) $178,709 $25,291
E. Dividends and Distributions to Shareholders Dividends to shareholders are recorded on the ex-dividend date. For the US Market Rotation ETF and EcoLogical Strategy ETF, dividends from net investment income, if any, are declared and paid annually. Net realized capital gains, if any, are distributed at least annually. For the Nasdaq 7 Handl™ Index ETF, dividends from net investment income, if any, are declared and paid monthly. Net realized capital gains, if any, are distributed at least annually.The amount of dividends from net investment income and net realized gains are determined in accordance with federal income tax regulations, which may differ from GAAP. These “book/tax” differences are considered either temporary or permanent in nature. To the extent these differences are permanent in nature (e.g., distributions and income received from pass-through investments, differing treatment of income relating to swap agreements), such amounts are reclassified within the capital accounts based on their nature for federal income tax purposes; temporary differences do not require reclassification. Temporary differences are primarily due to wash sales and differing treatment on certain investments. To the extent dividends and distributions exceed net investment income and net realized gains for tax purposes, they are reported as distribution of capital.The Funds may own shares of real estate investments trusts (“REITs”) which report information on the source of their distributions annually. Distributions received from investments in REITs in excess of income from underlying investments are recorded as realized gain and/or as a reduction to the cost of the individual REIT.F. Allocation of ExpensesExpenses directly attributable to a Fund are charged to that Fund. Expenses not directly attributable to a Fund are allocated proportionally among all Funds within the Trust in relation to the net assets of each Fund or on another reasonable basis. The Trust may share expenses with Mutual Fund & Variable Insurance Trust, another open-end management investment company managed by Rational Advisors, Inc. (the “Advisor”). Those expenses that are shared are allocated proportionally among each of the Trusts or on another reasonable basis.
(3) Investment Advisory and Other Contractual ServicesA. Investment Advisory FeesThe Advisor serves as the Funds’ investment advisor. The Advisor is under common control with Catalyst Capital Advisors LLC and AlphaCentric Advisors LLC, the investment advisors of other funds in the same group of investment companies also known as a “fund complex”. The US Market Rotation Strategy ETF, EcoLogical Strategy ETF, and Nasdaq 7 Handl™ Index ETF each pay 0.60% of each Fund’s average daily net assets, computed daily and paid monthly, for the advisory services it receives from the Advisor. The Sub-Advisor to both US Market Rotation Strategy ETF and EcoLogical Strategy ETF is Tuttle Tactical Management, LLC. The Advisor pays the Sub-Advisor 0.65% of the net management fees that the Advisor receives from the US Market Rotation Strategy ETF and 0.50% of the net management fees that the Advisor receives from the EcoLogical Strategy ETF.The Advisor has contractually agreed to reduce its fees and/or reimburse the expenses for US Market Rotation Strategy ETF, EcoLogical Strategy ETF, and Nasdaq 7 Handl™ Index ETF (excluding interest, taxes, short sale dividends, and interest expenses brokerage commissions, acquired fund fees and expenses, expenses incurred in connection with the Funds’ compliance with the liquidity requirements of Rule 22e-4 under the 1940 Act and the Investment Company Reporting Modernization Rules, and extraordinary expenses) in order to limit total annual fund operating expenses after fee waivers and expense reimbursement to 0.95% of each Fund’s average annual daily net assets (“Expense Cap”). The Expense Cap will remain in effect for the Funds until at least August 31, 2020. The Expense Cap may be terminated earlier only upon the approval of the Board. The Advisor may recoup fees waived or expenses reimbursed at any time within three years from the year such expenses were incurred, so long as the recoupment can be achieved without causing the expense ratio (after the recoupment is taken into account) to exceed (i) the expense limit in effect at the time the fees were waived or expenses paid, or (ii) the expense limit in place at the time of recoupment.As of October 31, 2019, the Advisor may recoup amounts from the Funds as follows:
Expires 4/30/20
Expires 4/30/21
Expires 4/30/22
Expires 4/30/23 Total
EcoLogical Strategy ETF (HECO) $105,726 $116,210 $27,013 $– $248,949
Nasdaq 7 Handl™ Index ETF (HNDL) – 55,481 115,986 32,088 203,555
B. Administration, Transfer Agent and Accounting FeesCiti Fund Services Ohio, Inc. (“Citi”) provides financial administration, transfer agency and portfolio accounting services to the Trust. Citi performs certain services on behalf of the Trust including but not limited to: (1) preparing and filing the Trust’s periodic financial reports on forms prescribed by the Securities and Exchange Commission (“SEC”); (2) calculating Fund expenses and making required disbursements; (3) calculating Fund performance data; and (4) providing certain compliance support services. As transfer agent, Citi issues shares of a Fund in Creation Units to fill purchase orders for Fund shares, maintains records of the issuance and redemption of each Fund’s shares, and acts as each Fund’s dividend disbursing agent. As portfolio accountant, Citi maintains certain financial records of the Trust and provides accounting services to each Fund which
Notes to Financial Statements (Continued)

Semi-Annual Shareholder Report | 15
Notes to Financial Statements (Continued)
include the daily calculation of each Fund’s NAV. Citi also performs certain other services on behalf of the Trust including providing financial information for the Trust’s federal and state tax returns and financial reports required to be filed with the SEC. For these services, each Fund pays Citi a fee accrued daily and paid monthly based on a percentage of each Fund’s average net assets, subject to a minimum annual fee. The fees are as follows:- 0.040% of the first $500 million in aggregate net assets of the Funds;- 0.035% of the aggregate net assets of the next $500 million; and- 0.020% of the aggregate net assets in excess of $1 billionThe asset-based fees are subject to an annual minimum, allocated among the Funds, equal to the number of Funds multiplied by $50,000. MFund Services LLC (“MFund”), an affiliate of the Advisor, provides the Funds with various management and legal administrative services. For these services, each fund pays MFund a fee accrued daily and paid monthly based on a percentage of each Fund’s average net assets, subject to a minimum annual fee. The fees are as follows:- 0.030% of the aggregate net assets from $0 to $1,000,000,000; and- 0.020% of the aggregate net assets above $1,000,000,000The asset-based fees are subject to an annual minimum of $30,000 per Fund. In addition, the Funds reimburse MFund for any reasonable out-of-pocket expenses incurred in the performance of its duties. C. Distribution and Shareholder Services FeesForeside Fund Services, LLC (the “Distributor”) is the principal underwriter and distributor of each Fund’s Shares. The Distributor is compensated by the Advisor in accordance with a Distribution Services Agreement between the Advisor and the Distributor. The Trust has adopted but has yet to implement a Rule 12b-1 Distribution Plan (the “Plan”). The Plan is designed to compensate or reimburse financial intermediaries (including the Distributor, the Advisor, and their affiliates) for activities principally intended to result in the sale of Fund shares, such as advertising and marketing of shares (including printing and disseminating prospectuses and sales literature to prospective shareholders and financial intermediaries) and providing incentives to financial intermediaries to sell shares. The Plan is also designed to cover the cost of administrative services performed in conjunction with the sale of shares, including, but not limited to, shareholder services, recordkeeping services and educational services, as well as the costs of implementing and operating the Plan. In accordance with the Plan, the Distributor may enter into agreements with financial intermediaries and dealers relating to distribution and/or marketing services with respect to the Funds. Pursuant to the Plan, the Funds may pay a 12b-1 fee not to exceed 0.25% per year of each Fund’s average daily net assets. No 12b-1 fee is currently paid by the Funds and the Board has not approved any payments under the Plan. D. Custodian FeesCitibank, N.A. (the “Custodian”), an affiliate of Citi, serves as custodian for each Fund and safeguards and holds each Fund’s cash and securities, settles each Fund’s securities transactions, and collects income on Fund investments. The Custodian receives fees based on the level of each Fund’s average daily net assets for the period plus out-of-pocket expenses.
E. Compliance ServicesPursuant to a Compliance Services Agreement, MFund provides chief compliance officer services to the Funds. The Funds pay MFund a monthly fee plus an asset-based fee. In addition, the Funds reimburse MFund for any reasonable out-of-pocket expenses incurred in the performance of its duties under the Compliance Services Agreement. F. GeneralCertain officers of the Trust are officers, directors and/or trustees of the above companies.For the Nasdaq 7 Handl™ Index ETF, the Advisor paid all organizational and offering costs to the Fund.(4) Investment TransactionsPurchases and sales of investments, excluding in-kind transactions and short-term investments, for the period ended October 31, 2019 were as follows:
Purchases SalesUS Market Rotation Strategy ETF (HUSE) $1,941,100,925 $1,966,858,201EcoLogical Strategy ETF (HECO) 587,954,711 590,807,161Nasdaq 7 Handl™ Index ETF (HNDL) 3,259,082 4,669,977
Purchases and sales of in-kind transactions for the period ended October 31, 2019 were as follows:
Purchases SalesUS Market Rotation Strategy ETF (HUSE) $7,395,714 $138,685,511EcoLogical Strategy ETF (HECO) 21,121,337 24,235,315Nasdaq 7 Handl™ Index ETF (HNDL) 8,493,836 –
(5) Capital Share TransactionsShares are issued and redeemed by each Fund only in aggregations of a specified number of shares or multiples thereof at net asset value. Except when aggregated in Creation Units, shares of each Fund are not redeemable. Transactions in shares for each Fund are disclosed in detail on the Statements of Changes in Net Assets.The consideration for the purchase of Creation Units of a Fund generally consists of the in-kind deposit of a designated basket of securities, which constitutes an optimized representation of the securities of that Fund’s specified universe, and an amount of cash. Investors purchasing and redeeming Creation Units may be charged a transaction fee to cover the transfer and other transactional costs it incurs to issue or redeem Creation Units. The standard charge and maximum transaction fee for each Fund are $250 and $1,000, respectively. From time to time, settlement of securities related to subscriptions-in-kind or redemptions-in-kind may be delayed. In such cases, securities related to in-kind contributions are reflected as “Due from custodian” and securities related to in-kind redemptions are reflected as “Securities payable related to in-kind transactions” on the Statements of Assets and Liabilities.During the period ended October 31, 2019, the Funds received securities in exchange for subscriptions of capital shares (subscriptions-in-kind) as follows:
Fair ValueUS Market Rotation Strategy ETF (HUSE) $7,395,714EcoLogical Strategy ETF (HECO) 21,121,337Nasdaq 7 Handl™ Index ETF (HNDL) 8,493,836

16 | Semi-Annual Shareholder Report
Notes to Financial Statements (Continued)
As of April 30, 2019, and December 31, 2018 for Nasdaq 7 Handl™ Index ETF, the tax cost of securities and the breakdown of unrealized appreciation (depreciation), excluding swap agreements, for each Fund were as follows:
Tax Cost of Securities
Unrealized Appreciation
Unrealized Depreciation
Net Unrealized Appreciation/ (Depreciation)
US Market Rotation Strategy ETF (HUSE) $181,750,184 $– $(412,168) $(412,168)EcoLogical Strategy ETF (HECO) 57,653,441 1,321,134 (74,422) 1,246,712Nasdaq 7 Handl™ Index ETF (HNDL) 9,272,970 17,680 (343,673) (325,993)
The differences between book-basis and tax-basis unrealized appreciation/depreciation is attributable primarily to basis adjustments for wash sales.
The tax character of distributions paid during the fiscal year ended April 30, 2019 and the period ended December 31, 2018 for Nasdaq 7 Handl™ Index ETF, were as follows:
Distributions paid from
Ordinary Income
Net Long Term Capital Gains
Total Taxable Distributions
Return of Capital
Total Distributions Paid
US Market Rotation Strategy ETF (HUSE) $6,453,325 $— $6,453,325 $— $6,453,325EcoLogical Strategy ETF (HECO) 260,295 1,135,113 1,395,408 — 1,395,408Nasdaq 7 Handl™ Index ETF (HNDL) 97,189 — 97,189 266,122 363,311
As of April 30, 2019, and December 31, 2018 for Nasdaq 7 Handl™ Index ETF, the components of accumulated earnings/(deficit) on a tax basis were as follows:
Undistributed Ordinary Income
Undistributed Long Term
Capital GainsAccumulated
Earnings
Accumulated Capital and
Other Losses
Unrealized Appreciation
(Depreciation)
Total Accumulated
Earnings (Deficit)US Market Rotation Strategy ETF (HUSE) $286,147 $— $286,147 $(23,564,521) $(412,168) $(23,690,542)EcoLogical Strategy ETF (HECO) 93,427 — 93,247 (3,139,594) 1,246,712 (1,799,455)Nasdaq 7 Handl™ Index ETF (HNDL) — — — (193,599) (306,371) (499,970)
(6) Federal Income Taxes It is the policy of each Fund to qualify or continue to qualify as a regulated investment company by complying with the provisions available to certain investment companies, as defined in applicable sections of the Internal Revenue Code, and to make distributions of net investment income and net realized capital gains sufficient to relieve it from all, or substantially all, federal income taxes.The Trust has evaluated tax positions taken or expected to be taken in the course of preparing each Fund’s tax returns to determine whether it is more-likely-than not (i.e., greater than 50-percent chance) that each tax position will be sustained upon examination by a taxing authority based on the technical merits of the position. A tax position that meets the more-likely-than-not recognition threshold is measured to determine the amount of benefit to recognize in the financial
statements. Differences between tax positions taken in a tax return and amounts recognized in the financial statements will generally result in an increase in a liability for taxes payable (or a reduction of a tax refund receivable), including the recognition of any related interest and penalties as an operating expense. Tax positions taken in tax years remain subject to examination by tax authorities (generally three years plus the interim tax period since then for federal income tax purposes). The determination has been made that there are not any uncertain tax positions that would require the Funds to record a tax liability and, therefore, there is no impact to the Funds’ financial statements. The Funds recognize interest and penalties, if any, related to unrecognized tax benefits as income tax expense on the Statements of Operations. During the period ended October 31, 2019, the Funds did not incur any interest or penalties
Semi-Annual Shareholder Report | 17
Notes to Financial Statements (Continued)
(7) Investment RisksETF Risk The NAV of a Fund can fluctuate up or down, and you could lose money investing in a Fund if the prices of the securities owned by the Fund decline. In addition, a Fund may be subject to the following risks: (1) the market price of a Fund’s shares may trade above or below its NAV; (2) an active trading market for a Fund’s shares may not develop or be maintained; or (3) trading of a Fund’s shares may be halted if the listing exchange’s officials deem such action appropriate, the shares are delisted from the exchange, or the activation of market-wide “circuit breakers” (which are tied to large decreases in stock prices) halts stock trading generally.EcoLogical Investment RiskThe EcoLogical Strategy ETF’s ecological investment criteria could cause it to underperform funds that do not maintain ecological investment criteria. In order to comply with its ecological investment criteria, the EcoLogical Strategy ETF may be required to forego advantageous investment opportunities or sell investments at inappropriate times. The EcoLogical Strategy ETF’s ecological investment criteria may result in the EcoLogical Strategy ETF investing in industry sectors that are not performing as well as others. (8) Subsequent EventsManagement of the Funds has evaluated the need for disclosures and/or adjustments resulting from subsequent events through the date these financial statements were issued. Based upon this evaluation, no additional disclosures or adjustments were required to the financial statements as of October 31, 2019.

[THIS PAGE INTENTIONALLY LEFT BLANK]

[THIS PAGE INTENTIONALLY LEFT BLANK]
VOTING PROXIES ON FUND PORTFOLIO SECURITIES
A copy of the policies and procedures that the Funds use to determine how to vote proxies relating to securities held in the Funds’ portfolios, as well as a record of how the Funds voted any such proxies during the most recent 12-month period ended June 30, is available without charge and upon request by calling 1-855-HSS-ETFS or 1-855-477-3837 or at www.strategysharesetfs.com. This information is also available from the EDGAR database on the SEC’s website at www.sec.gov.
QUARTERLY PORTFOLIO SCHEDULE
The Funds file with the SEC a complete schedule of their portfolio holdings, as of the close of the first and third quarters of their fiscal year, on Form N-Q. Beginning April 30, 2020, the Funds will make these filings on Form N-PORT. These filings are available on the SEC’s website at www.sec.gov. You may also access this information at www.strategysharesetfs.com by selecting “Form N-Q” or for filings made on April 30, 2020 or later, “Form N-PORT.”
Rational Advisors, Inc. is the Investment Advisor of Strategy Shares. Rational Advisors, Inc. maintains corporate records of the Funds. Foreside Fund Services, LLC is the principal underwriter and distributor of each Fund’s shares.
Exchange-traded funds are not bank deposits or obligations, are not guaranteed by any bank, and are not insured or guaranteed by the U .S . government, the Federal Deposit Insurance Corporation, the Federal Reserve Board, or any other government agency . Investment in exchange-traded funds involves investment risk, including the possible loss of principal .
This report is authorized for distribution to prospective investors only when preceded or accompanied by a prospectus which contains facts concerning the Funds’ objectives and policies, management fees, expenses and other information.
strategyshares
Strategy Shares US Market Rotation Strategy ETF (HUSE)Cusip 86280R100
Strategy Shares EcoLogical Strategy ETF (HECO)Cusip 86280R209
Strategy Shares Nasdaq 7 Handl™ Index ETF (HNDL)Cusip 86280R506
Strategy Shares Shareholder Services: 1-855-477-3837