Embed Size (px)
Citation preview
Semi-Annual Report
April 30, 2015
Fund Adviser:
Kovitz Investment Group, LLC115 South LaSalle Street, 27th Floor
Chicago, IL 60603Toll Free (888) 695-3729

MANAGEMENT DISCUSSION & ANALYSIS – APRIL 30, 2015 – (Unaudited)
Kovitz Investment Group launched the Green Owl Intrinsic Value Fund (the Fund) with the goal of seekinglong-term capital appreciation through high risk-adjusted returns. Relying on a fundamental, research-drivenprocess, the Fund strives to build a diversified portfolio of equity investments through the purchase ofcompetitively advantaged and financially strong companies at prices substantially less than our estimate of theirintrinsic values.
We remain focused on the careful and patient application of our investment criteria and valuation requirements.We are more concerned with the risk of suffering a permanent loss of capital than about the risk of missingopportunities, especially those that are short-term in nature. Our bottom-up research emphasizes business quality,industry structures, growth opportunities, management skill and corporate culture. It is further augmented by ourassessment of the company’s ability to sustain earnings power over the long haul through an understanding of itscompetitive advantages, business model and management’s skill in the allocation of capital. We use absolute,rather than relative, methods to estimate companies’ intrinsic values and we use the movement of market pricesaround these intrinsic value estimates to construct and manage a portfolio of high-quality businesses that have thepotential to create sustained shareholder value over many years. One of the challenges we have faced over thelast twelve months is that there has been very little stress, very little fear and very little volatility in the marketsas a whole. Losing the opportunity to take advantage of large price swings doesn’t play to our strengths.
MARKET PERFORMANCE SUMMARY
The Fund increased in value by 5.70% during the first half of the fiscal year (November 1, 2014 throughApril 30, 2015), while our primary benchmark, the S&P 500, increased 4.40% over the same period.
As long-term investors, our research process emphasizes the appraisal of factors that we believe matter most to abusiness’s long-term success. These include the quality of the business, the strength of the balance sheet, thepredictability of the cash flows, and the ability of the management team to allocate capital intelligently andjudiciously. We believe these attributes are the most reliable predictors of a company’s ability to maximizeintrinsic value on a per share basis.
Business quality may mean different things to different investors. When we think about a high quality business,we are referring to a company that not only earns high returns on capital today, but is likely to sustain highreturns on capital long into the future due to a strong competitive position. Warren Buffett notably refers to suchbusinesses as possessing a competitive “moat.” Buffett asserts,
“A truly great business must have an enduring ‘moat’ that protects excellent returns on investedcapital. The dynamics of capitalism guarantee that competitors will repeatedly assault anybusiness ‘castle’ that is earning high returns.”
Buffett’s symbolic moat is formed when a business possesses one or more sustainable competitive advantages.The primary competitive advantages that we focus on include a low cost position, strong brand loyalty, highcustomer switching costs, and network effects.
As taught in introductory business classes, the value of any financial asset (e.g., stocks) should equal the presentvalue of all of its future cash flows. Therefore, to effectively value a business we have to make a reasonablyaccurate forecast of that business’s future. Accurately predicting the future cash flow of a business is difficult.Without a moat, it becomes even more difficult because competition can quickly disrupt a business’s sales andmargins resulting in diminished cash flow. On the other hand, predictability of cash flow increases if a businesshas a moat. The wider and more enduring we perceive a business’s moat to be, the more conviction we can havein our intrinsic value estimates. Assessing and appraising the strength and endurance of competitive advantagesis the most difficult task in investing. Most of our mistakes can be traced back to an incorrect assessment of a
1
company’s moat. Given the foundational nature of this exercise in our research process and its critical role in ourfuture success, continual improvement in this area will always be our main focus.
While it is mandatory for a company to possess a defensible moat before the possibility of an investment isconsidered, the overriding factor for inclusion in our portfolio is price. Regardless of positive qualitativeattributes, quantitatively, the company’s stock must trade at a significant discount to our determination of itsprivate market value (intrinsic value) before we will make an investment. This margin of safety provides furtherinsurance against a permanent loss of capital should our assessment of a company’s moat prove overlyoptimistic.
PERFORMANCE ATTRIBUTION
Top contributors to performance over the period were Kohl’s (KSS), Target (TGT), Walgreen Boots Alliance(WBA), Apple (AAPL), and Boeing (BA). Kohl’s efforts in building out its omni-channel offering along withtargeted marketing reforms have resulted in recent sales momentum that appears sustainable. We have long feltKohl’s business possessed unique advantages that, if harnessed properly, would ultimately lead to same-storesales growth. Target benefitted primarily from addition by subtraction as it announced that it was discontinuingits foray into Canada. The ill-conceived venture has been a drag on company profits since inception and newmanagement made the bold decision to stop deploying capital into what was likely a money losing effort for theforeseeable future. Walgreens is benefitting from strong sales in its U.S. stores and earnings accretion from itstwo-stage acquisition of Alliance Boots, which was completed in 2014. All three of these actions – Kohl’sdecision to invest in its omni-channel offering, Target’s decision to stop throwing good money after bad inCanada, and Walgreens acquisition of Alliance Boots – are excellent examples of how capital allocation bymanagement is one of the primary determinants of shareholder value.
The largest detractors from performance were Ocwen Financial (OCN), Ensco (ESV), National Oilwell Varco(NOV), Bank of America (BAC) and American Express (AXP). As investors, our primary job is to matchvaluation with expectations, meaning we are trying to determine what expectations for earnings growth arepriced into the current valuation. Secondarily, we need to determine whether recent negative news signifies abusted investment thesis, or whether it falls in the normal range of “things happen.” In each of these cases(except NOV, which we sold as discussed below), we believe the expectations priced in at current levels are farbelow what we believe will likely happen over the next few years.
On a sector basis, outperformance for the period was due primarily to stock selection in Consumer Discretionary(Kohl’s, Target, Walt Disney (DIS)), Consumer Staples (Walgreens, CVS Health (CVS)), InformationTechnology (Apple, Accenture (ACN)), Industrials (Boeing) and lack of exposure to Utilities, the second worstperforming sector for the time period. Hurting relative performance during the period was poor stock selection inFinancials (Ocwen, Bank of America, American Express) combined with a lack of any meaningful exposure toHealth Care, which was the second best performing sector. Frankly, we see little value in the Health Care sectorcurrently and will be patient about putting new money to work in the sector regardless of recent positive priceperformance.
PORTFOLIO ACTIVITY
Over the period, we initiated seven new positions, added to three current positions, trimmed exposure to five, andsold out of four completely.
BUYS
For the past several quarters we have lamented the stark lack of opportunities for us to put money to work in newnames. We believed that just about every sector of the market had elevated valuations and very few individualcompanies were trading at significant discounts to our estimates of fair value. This latest bull market has seen
2
almost no meaningful corrections and had not delivered any industry or sector declines that are normal even in amarket that is rising overall. This set of circumstances had made it difficult for investors like us who tend to beopportunistic in building portfolios.
During the quarter, however, the price of crude oil swooned, and shares of companies in the energy sector andthose in the industrial sector with energy-related businesses underwent a major correction. Historically, we havehad very low exposure to these names. In recent years, with the price of crude trading near $100 per barrel andmarket sentiment that it would remain there, our feeling was that most stocks in the energy group provided littlemargin of safety. As the price of oil collapsed almost 50% from June to December 2014, we determined thatvaluations were more favorable, and, with oil prices having collapsed approximately 50% since mid-June, webelieve that valuations in energy and energy-related names began to look attractive.
To be clear, we are not making a call on where we believe oil will trade over the next several months or quarters.In the short run, we don’t know if the current plunge in the price of a barrel of oil will continue, stabilize, or eventrend upward. Looking out over the next several years, however, our feeling is that oil prices will likely behigher. We say this not out of any sense of clairvoyance but from an understanding about how commoditymarkets generally work and our comprehension of how marginal cost economics typically play out. In a sense,commodity prices are self-correcting – the interaction between supply and demand in setting prices at the marginmakes this so. Commodity prices will decline if demand decreases or if there is too much supply. Conversely,prices will rise if demand increases or supply falls. In the current case of oil, the drop has largely stemmed fromoversupplied conditions caused by increased production in Northern Iraq and Libya coinciding with huge gains inproduction in the United States due to the “shale revolution.” Even more fuel was added to fire on ThanksgivingDay when OPEC announced they would not cut current production levels. The most common interpretation ofthis decision was that it was meant as a shot across the bow warning U.S. shale producers that the Saudis aredetermined to not be the first to blink in the face of falling oil prices.
The recent surge of U.S. oil and natural gas production has been nothing short of astonishing. Thistransformation is the product of advances in oil and natural gas production technology – notably, a newcombination of horizontal drilling and hydraulic fracturing. (Hydraulic fracturing, or “fracking,” is the process ofinjecting sand, water, and chemicals into shale rocks to crack them open and release the hydrocarbons trappedinside.) These technological advances combined with high oil and gas prices have enabled increased productionof the abundant oil and natural gas resources in the United States.
In the past five years, this technological revolution in the oil patch has made the United States the world’sfastest-growing hydrocarbon producer. In 2000, shale gas provided only 1% of U.S. natural gas production. By2010, it was over 20%, and the U.S. government’s Energy Information Administration predicts that 46% of theUnited States’ natural gas supply will come from shale gas by 2035. U.S. natural gas production has risen by25 percent since 2010, and the only reason it has temporarily stalled is that investments are required to facilitatefurther growth. Having already outstripped Russia as the world’s largest gas producer, the United States willbecome one of the world’s largest gas exporters by the end of the decade, fundamentally changing pricing andtrade patterns in global energy markets. U.S. oil production, meanwhile, has grown by 60 percent since 2008,growing at a clip of around 1 million barrels a day annually for the past several years. To put this in context,OPEC member Libya’s production is currently about 900,000 barrels per day.
While the supply glut is the major factor contributing to the fall in the price of oil, other factors have been atwork as well. On the demand side, slowing Chinese economic growth and a sputtering European economy havehelped to keep demand growth under wraps putting little pressure on the surging supply of oil. Even geopoliticaltensions, which heretofore served as a buttress for high oil prices in the form of a perceived risk premium,seemed to lose its sway on oil’s pricing mechanism. Oil had rallied into midyear, buoyed in part by geopoliticaltensions surrounding Russia’s annexation of the Crimea, civil war in Syria, and broad advances by Sunniinsurgents across northern Iraq. But the risk premium soon dissipated as oil investors came around to the view
3
that none of the scenarios posed an imminent danger to supply. Finally, the strength in the U.S. dollar (up 10%vs. a basket of foreign currencies since the beginning of May), which is generally inversely correlated todollar-priced commodities, has added to the oil price woes.
So why are we confident that oil prices will ultimately move higher? There is an old adage in the world ofcommodities that “low prices are the cure for low prices.” Around the world, the cost of drilling oil varieswidely. Ultimately, when the price of oil falls below a particular breakeven level (typically referred to as themarginal cost of production), then a drilling project becomes unprofitable and it makes sense for the driller to justshut down the particular project. These actions decrease supply, bringing it more in line with demand. We alsodon’t discount the possibility that demand may increase as cheaper prices stimulate more use. The simultaneouslowering of supply and increasing demand serves as a natural buoy to reinforce higher prices. (There is a lot oftalk that with slow global economic activity currently, it may take time for the demand side of the equation toincrease. This is likely true, but keep in mind, we are looking out several years for this to play out.)
Importantly, drilling projects can’t just be turned off like the flip of a light switch. In general, oil production is ahigh fixed cost, capital intensive business with low variable production costs. Current well and rig infrastructurewill likely continue to be used for pumping oil from the ground. Most new drilling, however, is likely to becurtailed until such time as internal rate of return hurdles can once again be cleared. While the daily news reportscontain lots of headlines and a great deal of noise, we believe there is a salient data point: capital expenditurebudgets for many oil exploration and production companies are already being slashed with a focus on cancellingthe projects to drill new wells. In other words, the supply response has started. It may take several years for theseactions to help the oil market regain its supply and demand balance, which is a timeframe many investors findtoo long to participate in. On the other hand, we like buying businesses with a margin of safety where theprimary cost to earn the outsized return is a willingness to wait.
In order to prepare for this eventuality, our research process has focused on preparing a “wish list” of energy andrelated companies we would want to own. In early December, with the price of oil and related companiescontinuing to fall, we firmed up our list. Toward mid-month, with prices seemingly in freefall, we implementedthe purchase of a basket of high quality stocks at valuations that imply oil will stay at or near the current priceforever. We may be early (we usually are), but we feel these stocks provide risk/reward characteristics we areextremely comfortable with over a sufficiently long time horizon.
Our basket focused on oilfield services companies, including Halliburton (HAL), Baker Hughes (BHI),Schlumberger (SLB), and FMC Technologies (FTI), and engineering and construction companies, includingJacobs Engineering (JEC) and Quanta Services (PWR). These are the companies that provide the proverbialpicks and shovels to the 49ers of the energy industry. All of these companies have substantial exposure to oil andgas production activity, but none have their revenues directly determined by the fluctuating price of oil.
Schlumberger, Halliburton, and Baker Hughes are three of the largest and most globally diversified oilfieldservices companies in the world. These companies provide services and solutions to independent exploration andproduction companies and integrated oil and gas companies at every stage in the process of production. Theseservices range from exploring for and locating hydrocarbons under the ground to completing wells drilled toaccess oil and gas to enhancing and optimizing the recovery of these commodities from deep below the surfaceof the Earth. The three firms function effectively as an oligopoly in many parts of their business, which keepspricing rational, and their breadth of offerings and strength in those areas provide meaningful barriers to entryagainst smaller players taking market share.
Schlumberger is the largest player in the industry and has the most exposure to producers outside the U.S.,including long relationships with many national oil companies. Halliburton, long removed from any involvementin government-contracted engineering and construction that made headlines during the Iraq War, provides theirservices globally, but with more of a focus inside the U.S. Baker Hughes is a solid third place in terms of size and
4
efficiency behind Schlumberger and Halliburton, but the company agreed to be acquired by Halliburton in a cashand stock deal shortly before we initiated our positions. Due to this pending transaction, we view our position inBaker Hughes as part of our position in Halliburton where the cash portion of the deal will provide a bufferagainst further downside should oil prices continue to slide in the short run. The substantial $3.5 billiontermination fee owed to the company by Halliburton should the deal fall apart, will also provide additionalprotection from loss in that scenario.
Our combined position in Halliburton and Baker Hughes is the largest position in our energy basket because thecombination of falling oil prices and the market perception that the announced merger was poorly timed – alsodue to falling oil prices – has caused the stock price to deviate the most from what we consider the company’sintrinsic value. Schlumberger also saw its share price decline substantially, although not to the same degree asHalliburton. Nevertheless, the stock was trading at a below-market multiple on depressed near-term earningsdespite our opinion that Schlumberger’s business deserves to be valued at a premium multiple on normalizedearnings – an opinion that the market has generally agreed with for at least the last decade.
FMC Technologies is also classified within the oilfield services industry, but they are primarily engaged inproviding subsea “trees” used in offshore oil and gas production. These “trees” are individual or multiplestructures that reside on the sea floor that allow the teams operating the well at the surface to regulate pressure inthe well and optimize the stimulation of the well. These structures are highly complex as they are intended tooperate up to two miles below the surface under incredible amounts of pressure and at widely varyingtemperatures between the water at those depths and in the well itself. FMC dominates this industry and offshoreoil production can’t function without these types of products. As long as offshore production of oil and gascontinues, and we believe it must to meet global demand in the intermediate- and long-term, FMC’s business iswell-positioned while the company’s share price seems to be pricing in a permanent decline in offshore drillingthat doesn’t seem like a viable assumption to us over the long-term.
Jacobs Engineering and Quanta Services are both engineering and construction firms, but with very differentareas of focus. Jacobs is one of the largest diversified engineering and construction firms in the world thatengages in the design and building of structures and infrastructure related to oil and gas, chemicals, governmentprojects, infrastructure, and various other industrial sectors. The new construction projects Jacobs takes on aretypically large scale and take place over multiple years. Projects can include oil refineries, chemical plants, lightrail stations and tracks, water reclamation facilities, office buildings, and the list goes on. Despite the oil and gas-related portions of their business representing only about a quarter of revenue last year and the prospects for mostof the other sectors they are exposed to remaining the same, or even improving with lower oil prices, the sharesare trading at a level implying that most of their oil and gas-related business will disappear and never return.While some projects could easily get pushed out or delayed, cancellation of most or all of these projects, many ofwhich have been planned for years and are designed to meet demands of the industry looking out decades into thefuture, seems like an extreme and unlikely assumption. We believe the shares are priced attractively withdownside risk further reduced by the diverse nature of their business and competitive position outside of oil andgas projects.
Quanta Services is a similar company, but about 70% of their revenue is derived from power generation andtransmission projects with most of the remainder related to oil and gas pipeline construction. Quanta’s revenuesfrom power and transmission have been growing nicely over the past decade as utilities have increased capitalspending on such projects in an effort to upgrade and expand the often inadequate state of the electric grid in theUnited States. Their involvement in oil and gas pipelines was the cause of the recent decline in the price of thecompany’s shares that provided the opportunity for us to initiate the position, but even this seems overdone to us.Quanta’s near-term pipeline projects are predominantly located in areas that produce natural gas as opposed tooil, and the price of natural gas, which plummeted several years ago when shale drilling created a supply glut inthat market, has been relatively stable since that time. This means that the prospects for a natural gas pipeline areunlikely to be reassessed because of what is going on in the oil market and we expect Quanta to retain much of
5
their currently booked business in this area. If that is the case, returns on Quanta’s shares from these levelsshould be quite satisfactory and there is a comfortable margin for error in our assessment given what today’sprice is implying.
CBS Corp. (CBS) is the only new addition to the portfolio unrelated to the energy sector. CBS is a householdname to many people because they operate the highest rated broadcast network in the United States. They alsoown a number of cable networks, including Showtime and CBS Sports, production and syndication companiesthat produce content for network and cable television, the Simon & Schuster publishing business, 30 localbroadcast CBS affiliates, and over 100 radio stations. Currently, about half of CBS’s revenues are generated fromadvertising on their networks, while the other half is generated by licensing and distributing content and affiliateand subscription fees paid by cable and satellite companies to carry their networks. Over time, however, CBS’saggressive stance with the multi-channel video providers and local broadcasters in boosting retransmission andreverse retransmission fees, respectively, will likely make less reliant on advertising.
Because of the recent tumult in the media industry with content creators, broadcasters, cable/satellite companies,and companies that stream content over the internet all jockeying over how big of a slice of the media dollar piethey each will ultimately lay claim to, CBS and many similar companies have seen the price of their shares fall.The intense competition among these different groups of companies has created worries that CBS’s businessmodel, which currently relies heavily on paid advertising, will be left behind in the new age of mediaconsumption that is perceived to be just over the horizon. We tend to think a decline in advertising revenue ismore than baked into the current price and that companies with desirable content and innovative operatinghistories, such as CBS, will end up retaining significant pricing power no matter how the media landscapeevolves. Our entry price at a below-market multiple of about 13x next year’s earnings estimate for a goodbusiness like CBS offers a substantial margin of safety against future unfavorable developments in the mediaindustry and attractive upside should the future bring nothing more than the status quo.
ADDITIONS
We increased our position size in three current holdings, Boeing, General Motors (GM) and ValmontIndustries (VMI). Shares of Boeing came under pressure as the slide in oil prices caused investors to speculatethat orders for its new fuel-efficient planes will slow and/or that its healthy backlog will dwindle due tocancellations. To us, this is short-termism at its finest. While the price of fuel is certainly a key input to anaircraft acquisition decision, it’s seldom based on where prices are currently. The decision is based on the rangeof prices that are likely over the useful life of the aircraft, which is measured in decades, and how large animprovement in fuel burn the new asset provides. It wouldn’t surprise us to see some orders cancelled ordeferred, but we don’t think it would cause a meaningful deterioration to our business value estimate.
More importantly, regardless of what happens to the price of crude, cash flows will continue to build as the 787first moves toward break-even on a cash basis and then gush cash thereafter. In fact, we estimate that Boeing’sfree cash flow will likely eclipse earnings starting in 2015. Speaking to management’s confidence in future cashflow, in December 2013, Boeing shareholders received a dividend increase of just over 50%. This pastDecember, the company tacked on another 25%, and the shares now yield almost 3%.
General Motors’ results from a sales perspective continue to impress. There is no sign that the massive recallsissued over the past year are tempering the demand for new GM vehicles. In the United States, industry-wideauto sales will approach 17 million units in 2014. While this may be the high water mark, we expect that salescould continue near this pace for several more years as the replacement cycle for aged vehicles remains intact. ItsEuropean business is still in a loss position (like it is for many other car makers), but management has taken stepsto improve the cost structure and, at some point, the continent will see its economic fortunes improve.Meanwhile, sales in China remain strong. To be sure, liabilities from the ignition switch issues continue to grow,yet we feel they are easily manageable as company’s net cash position is extremely strong. In our opinion, thestock is severely undervalued and an upward adjustment to its multiple seems warranted. In other words, goodthings typically happen to cheap stocks.
6
Regarding Valmont, we felt investor fears about its decline in utility project orders appeared overdone. Ourfeeling is that this segment is undergoing a temporary cyclical decline as opposed to a more worrisome secularone. As is often the case, at current prices, the market is ignoring Valmont’s long-term earnings power and hasfocused instead on short-term disruptions.
SALES
We eliminated three holdings. We sold Abbott Laboratories (ABT) and DirecTV (DTV) as each approachedour fair value estimates. The acquisition of DirecTV by AT&T has not yet been consummated, but what littleupside we would stand to make did not seem enough to compensate for the deal risk (i.e. the risk that thetransaction is delayed or terminated) we would be taking. We sold our position in National Oilwell Varco as wefocused our energy basket in the more promising energy names mentioned above. Coach (COH) was also soldas it reached our recently downgraded assessment of intrinsic value. While sales have likely stabilized at Coach,today’s price could prove low only if sales improve dramatically from here over the next couple of years, whichwe view as a low probability. We still believe the brand has value and management’s turnaround plan is credible,but execution risk remains high. We also think that there may be too much competitive pressure for sales togrow, even from today’s dramatically lower base, at rates that would make our exit price seem too pessimistic. Inhindsight, we should have been more skeptical before initially purchasing the stock because the genesis for thismistake can be traced back to a poor assessment of Coach’s moat. We initially believed Coach’s brand possessedwide moat characteristics, but increased competition and the fact that the company needed to make largeinvestments as a result demonstrated that the moat was actually much narrower than we believed.
We can’t promise this will be our last mistake. They say mistakes are the portal to discovery and we will makesure we learn something from each one. On the other hand, we can promise to treat your money as if it were ourown and to remain fully transparent in the decisions we make.
TRIMS
We also trimmed five positions that have performed very strongly this year: CarMax (KMX), CVS Health,Kohl’s, Target and Walgreens Boots Alliance. Financial results for each have been strong and that has beenreflected in the share price. As they now trade closer to our intrinsic value estimates, we felt compelled to reduceour exposures.
7
INVESTMENT RESULTS – (Unaudited)
Total Returns*(For the periods ended April 30, 2015)
Average AnnualReturns
Six Months One YearSince Inception
(December 22, 2011) (a)
Green Owl Intrinsic Value Fund 5.70% 8.74% 18.03%S&P 500® Index** 4.40% 12.98% 18.61%
Total annual operating expenses, as disclosed in the Fund’s prospectus dated February 28, 2015, were1.38% of average daily net assets (1.11% after fee waivers/expense reimbursements by the adviser).Effective March 1, 2015, the adviser contractually agreed to waive or limit its fees and to assume otherexpenses of the Fund until February 28, 2017, so that the Total Annual Operating Expenses do notexceed 1.10%. This operating expense limitation does not apply to interest, taxes, brokeragecommissions, other expenditures which are capitalized in accordance with generally acceptedaccounting principles, other extraordinary expenses not incurred in the ordinary course of the Fund’sbusiness, dividend expense on short sales, expenses incurred under a Rule 12b-1 plan of distribution,“acquired fund fees and expenses,” and expenses that the Fund has incurred but did not actually paybecause of an expense offset arrangement. Additional information pertaining to the Fund’s expenseratios as of April 30, 2015 can be found in the financial highlights.
The performance quoted represents past performance, which does not guarantee future results. The investmentreturn and principal value of an investment will fluctuate so that an investor’s shares, when redeemed, may beworth more or less than their original cost. The returns shown do not reflect deduction of taxes that ashareholder would pay on Fund distributions or the redemption of Fund shares. Current performance of theFund may be lower or higher than the performance quoted. The Fund’s investment objectives, risks, charges andexpenses must be considered carefully before investing. Performance data current to the most recent month endmay be obtained by calling 1-888-695-3729.(a) The Fund commenced operations on December 22, 2011. However, the Fund did not invest in long-term securities towards the
investment objective until December 28, 2011. December 28, 2011 is the performance calculation inception date.
* Return figures reflect any change in price per share and assume the reinvestment of all distributions.
** The S&P 500® Index is a widely recognized unmanaged index of equity securities and is representative of a broader domestic equitymarket and range of securities than is found in the Fund’s portfolio. Individuals cannot invest directly in the Index; however, anindividual can invest in exchange traded funds or other investment vehicles that attempt to track the performance of a benchmark index.
The Fund’s investment objectives, strategies, risks, charges and expenses must be considered carefully beforeinvesting. The prospectus contains this and other important information about the Fund and may be obtainedby calling the same number as above. Please read it carefully before investing.
The Fund is distributed by Unified Financial Securities, Inc., member FINRA.
8
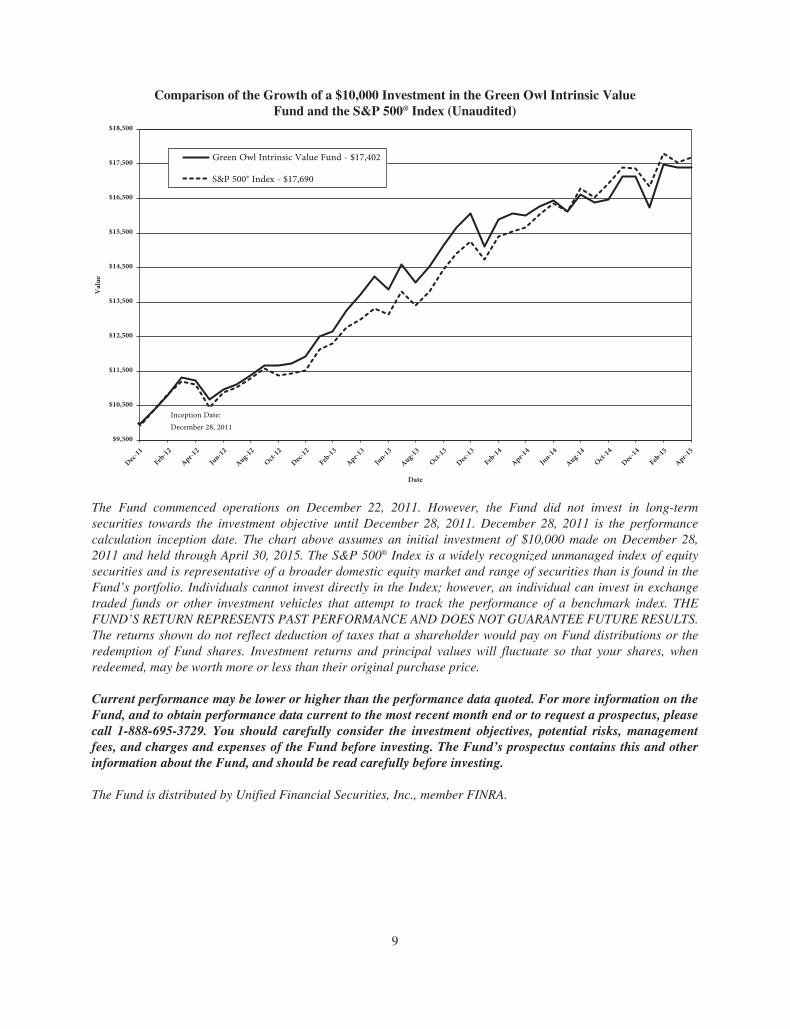
Comparison of the Growth of a $10,000 Investment in the Green Owl Intrinsic ValueFund and the S&P 500® Index (Unaudited)
$10,500
$9,500
$11,500
$12,500
$13,500
$14,500
$15,500
$16,500
$18,500
$17,500
Value
Date
Green Owl Intrinsic Value Fund - $17,402S&P 500® Index - $17,690
Inception Date: December 28, 2011
Dec-11
Feb-12
Apr-12
Jun-12
Aug-12
Oct-12
Dec-12
Feb-13
Apr-13
Jun-13
Aug-13
Oct-13
Dec-13
Feb-14
Apr-14
Jun-14
Aug-14
Oct-14
Dec-14
Feb-15
Apr-15
The Fund commenced operations on December 22, 2011. However, the Fund did not invest in long-termsecurities towards the investment objective until December 28, 2011. December 28, 2011 is the performancecalculation inception date. The chart above assumes an initial investment of $10,000 made on December 28,2011 and held through April 30, 2015. The S&P 500® Index is a widely recognized unmanaged index of equitysecurities and is representative of a broader domestic equity market and range of securities than is found in theFund’s portfolio. Individuals cannot invest directly in the Index; however, an individual can invest in exchangetraded funds or other investment vehicles that attempt to track the performance of a benchmark index. THEFUND’S RETURN REPRESENTS PAST PERFORMANCE AND DOES NOT GUARANTEE FUTURE RESULTS.The returns shown do not reflect deduction of taxes that a shareholder would pay on Fund distributions or theredemption of Fund shares. Investment returns and principal values will fluctuate so that your shares, whenredeemed, may be worth more or less than their original purchase price.
Current performance may be lower or higher than the performance data quoted. For more information on theFund, and to obtain performance data current to the most recent month end or to request a prospectus, pleasecall 1-888-695-3729. You should carefully consider the investment objectives, potential risks, managementfees, and charges and expenses of the Fund before investing. The Fund’s prospectus contains this and otherinformation about the Fund, and should be read carefully before investing.
The Fund is distributed by Unified Financial Securities, Inc., member FINRA.
9
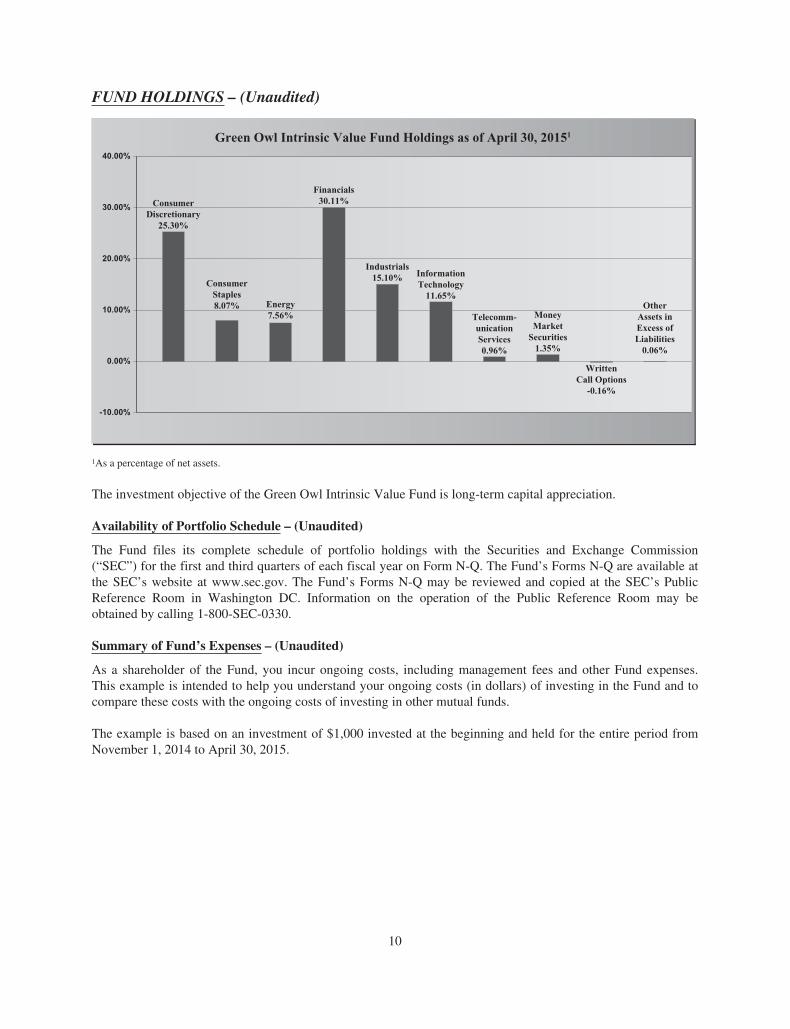
FUND HOLDINGS – (Unaudited)
Green Owl Intrinsic Value Fund Holdings as of April 30, 20151
ConsumerStaples8.07%
Financials30.11%
Industrials15.10% Information
Technology11.65%
Telecomm-unicationServices0.96%
MoneyMarket
Securities1.35%
WrittenCall Options
-0.16%
OtherAssets inExcess ofLiabilities
0.06%
ConsumerDiscretionary
25.30%
Energy7.56%
-10.00%
10.00%
0.00%
20.00%
30.00%
40.00%
1As a percentage of net assets.
The investment objective of the Green Owl Intrinsic Value Fund is long-term capital appreciation.
Availability of Portfolio Schedule – (Unaudited)
The Fund files its complete schedule of portfolio holdings with the Securities and Exchange Commission(“SEC”) for the first and third quarters of each fiscal year on Form N-Q. The Fund’s Forms N-Q are available atthe SEC’s website at www.sec.gov. The Fund’s Forms N-Q may be reviewed and copied at the SEC’s PublicReference Room in Washington DC. Information on the operation of the Public Reference Room may beobtained by calling 1-800-SEC-0330.
Summary of Fund’s Expenses – (Unaudited)
As a shareholder of the Fund, you incur ongoing costs, including management fees and other Fund expenses.This example is intended to help you understand your ongoing costs (in dollars) of investing in the Fund and tocompare these costs with the ongoing costs of investing in other mutual funds.
The example is based on an investment of $1,000 invested at the beginning and held for the entire period fromNovember 1, 2014 to April 30, 2015.
10
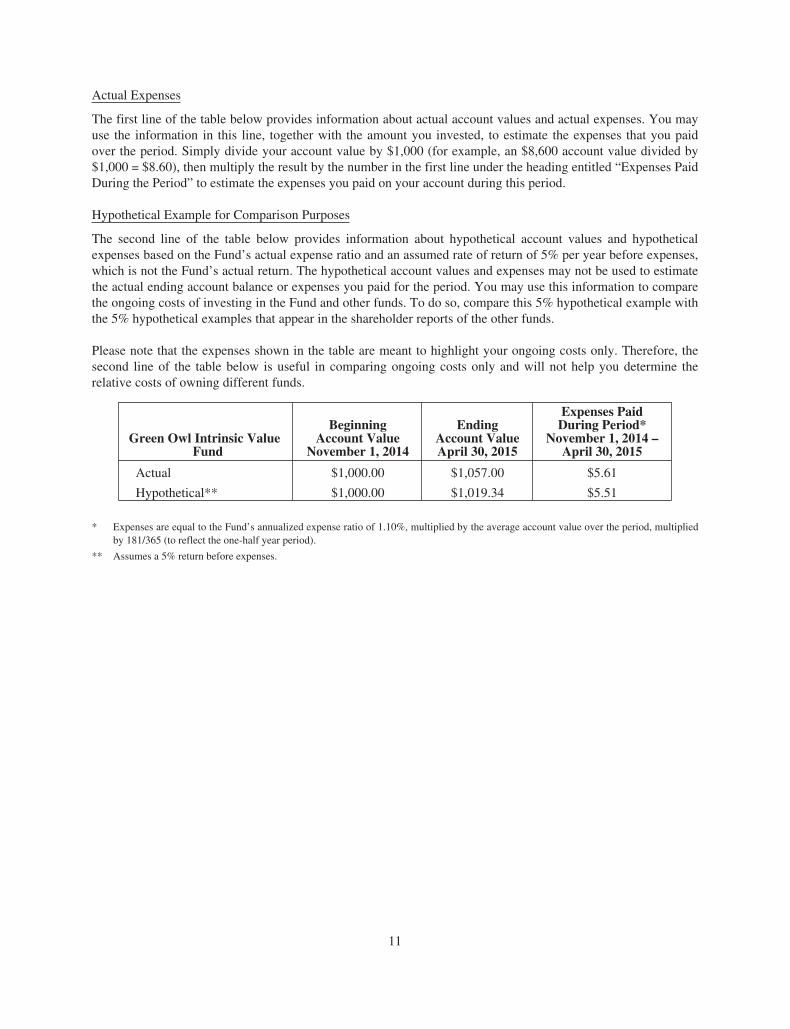
Actual Expenses
The first line of the table below provides information about actual account values and actual expenses. You mayuse the information in this line, together with the amount you invested, to estimate the expenses that you paidover the period. Simply divide your account value by $1,000 (for example, an $8,600 account value divided by$1,000 = $8.60), then multiply the result by the number in the first line under the heading entitled “Expenses PaidDuring the Period” to estimate the expenses you paid on your account during this period.
Hypothetical Example for Comparison Purposes
The second line of the table below provides information about hypothetical account values and hypotheticalexpenses based on the Fund’s actual expense ratio and an assumed rate of return of 5% per year before expenses,which is not the Fund’s actual return. The hypothetical account values and expenses may not be used to estimatethe actual ending account balance or expenses you paid for the period. You may use this information to comparethe ongoing costs of investing in the Fund and other funds. To do so, compare this 5% hypothetical example withthe 5% hypothetical examples that appear in the shareholder reports of the other funds.
Please note that the expenses shown in the table are meant to highlight your ongoing costs only. Therefore, thesecond line of the table below is useful in comparing ongoing costs only and will not help you determine therelative costs of owning different funds.
Green Owl Intrinsic ValueFund
BeginningAccount Value
November 1, 2014
EndingAccount ValueApril 30, 2015
Expenses PaidDuring Period*
November 1, 2014 –April 30, 2015
Actual $1,000.00 $1,057.00 $5.61
Hypothetical** $1,000.00 $1,019.34 $5.51
* Expenses are equal to the Fund’s annualized expense ratio of 1.10%, multiplied by the average account value over the period, multipliedby 181/365 (to reflect the one-half year period).
** Assumes a 5% return before expenses.
11
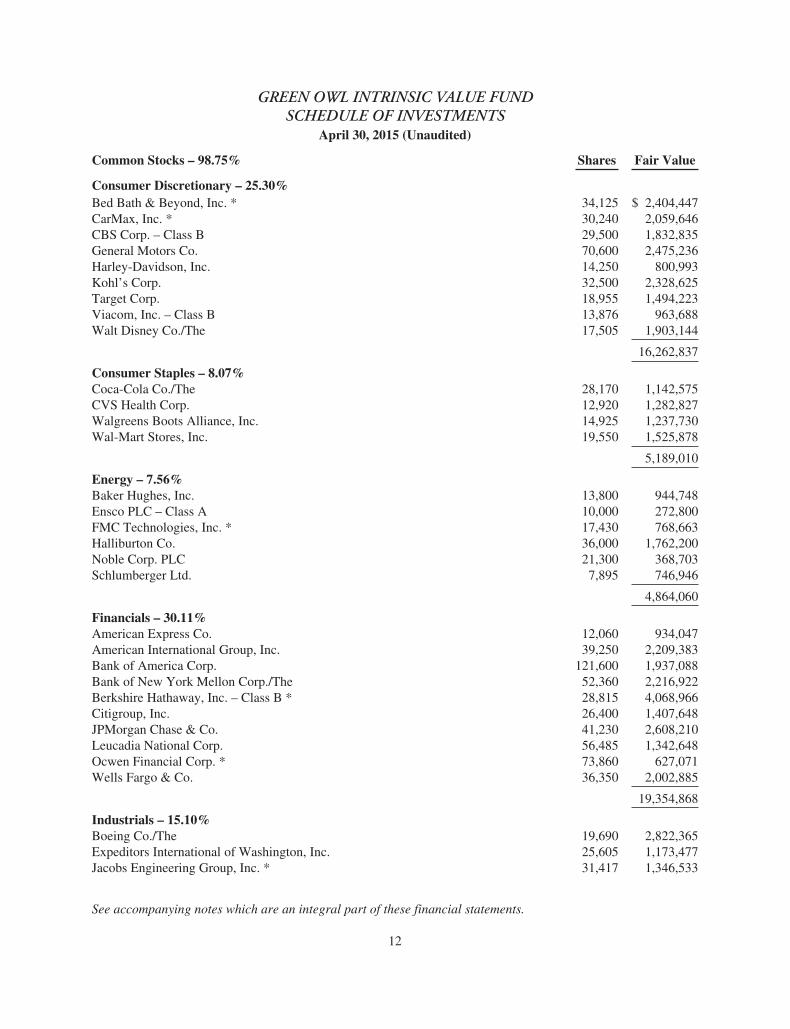
GREEN OWL INTRINSIC VALUE FUNDSCHEDULE OF INVESTMENTS
April 30, 2015 (Unaudited)
Common Stocks – 98.75% Shares Fair Value
Consumer Discretionary – 25.30%Bed Bath & Beyond, Inc. * 34,125 $ 2,404,447CarMax, Inc. * 30,240 2,059,646CBS Corp. – Class B 29,500 1,832,835General Motors Co. 70,600 2,475,236Harley-Davidson, Inc. 14,250 800,993Kohl’s Corp. 32,500 2,328,625Target Corp. 18,955 1,494,223Viacom, Inc. – Class B 13,876 963,688Walt Disney Co./The 17,505 1,903,144
16,262,837
Consumer Staples – 8.07%Coca-Cola Co./The 28,170 1,142,575CVS Health Corp. 12,920 1,282,827Walgreens Boots Alliance, Inc. 14,925 1,237,730Wal-Mart Stores, Inc. 19,550 1,525,878
5,189,010
Energy – 7.56%Baker Hughes, Inc. 13,800 944,748Ensco PLC – Class A 10,000 272,800FMC Technologies, Inc. * 17,430 768,663Halliburton Co. 36,000 1,762,200Noble Corp. PLC 21,300 368,703Schlumberger Ltd. 7,895 746,946
4,864,060
Financials – 30.11%American Express Co. 12,060 934,047American International Group, Inc. 39,250 2,209,383Bank of America Corp. 121,600 1,937,088Bank of New York Mellon Corp./The 52,360 2,216,922Berkshire Hathaway, Inc. – Class B * 28,815 4,068,966Citigroup, Inc. 26,400 1,407,648JPMorgan Chase & Co. 41,230 2,608,210Leucadia National Corp. 56,485 1,342,648Ocwen Financial Corp. * 73,860 627,071Wells Fargo & Co. 36,350 2,002,885
19,354,868
Industrials – 15.10%Boeing Co./The 19,690 2,822,365Expeditors International of Washington, Inc. 25,605 1,173,477Jacobs Engineering Group, Inc. * 31,417 1,346,533
See accompanying notes which are an integral part of these financial statements.
12
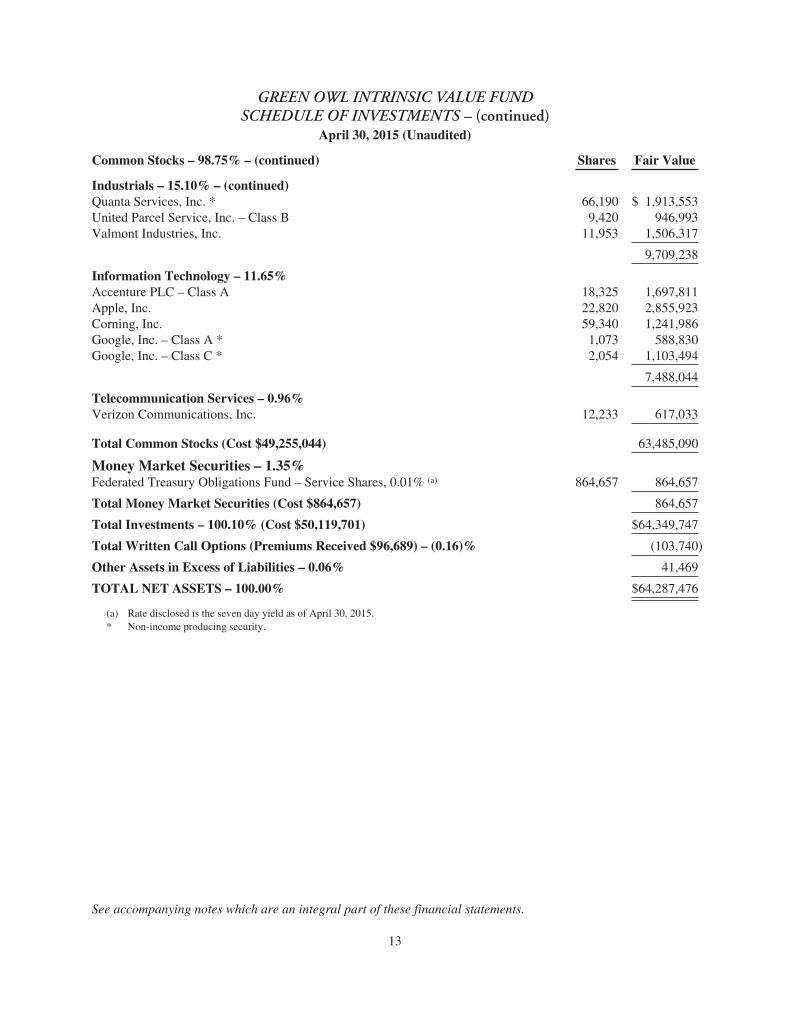
GREEN OWL INTRINSIC VALUE FUNDSCHEDULE OF INVESTMENTS – (continued)
April 30, 2015 (Unaudited)
Common Stocks – 98.75% – (continued) Shares Fair Value
Industrials – 15.10% – (continued)Quanta Services, Inc. * 66,190 $ 1,913,553United Parcel Service, Inc. – Class B 9,420 946,993Valmont Industries, Inc. 11,953 1,506,317
9,709,238
Information Technology – 11.65%Accenture PLC – Class A 18,325 1,697,811Apple, Inc. 22,820 2,855,923Corning, Inc. 59,340 1,241,986Google, Inc. – Class A * 1,073 588,830Google, Inc. – Class C * 2,054 1,103,494
7,488,044
Telecommunication Services – 0.96%Verizon Communications, Inc. 12,233 617,033
Total Common Stocks (Cost $49,255,044) 63,485,090
Money Market Securities – 1.35%Federated Treasury Obligations Fund – Service Shares, 0.01% (a) 864,657 864,657
Total Money Market Securities (Cost $864,657) 864,657
Total Investments – 100.10% (Cost $50,119,701) $64,349,747
Total Written Call Options (Premiums Received $96,689) – (0.16)% (103,740)
Other Assets in Excess of Liabilities – 0.06% 41,469
TOTAL NET ASSETS – 100.00% $64,287,476
(a) Rate disclosed is the seven day yield as of April 30, 2015.* Non-income producing security.
See accompanying notes which are an integral part of these financial statements.
13
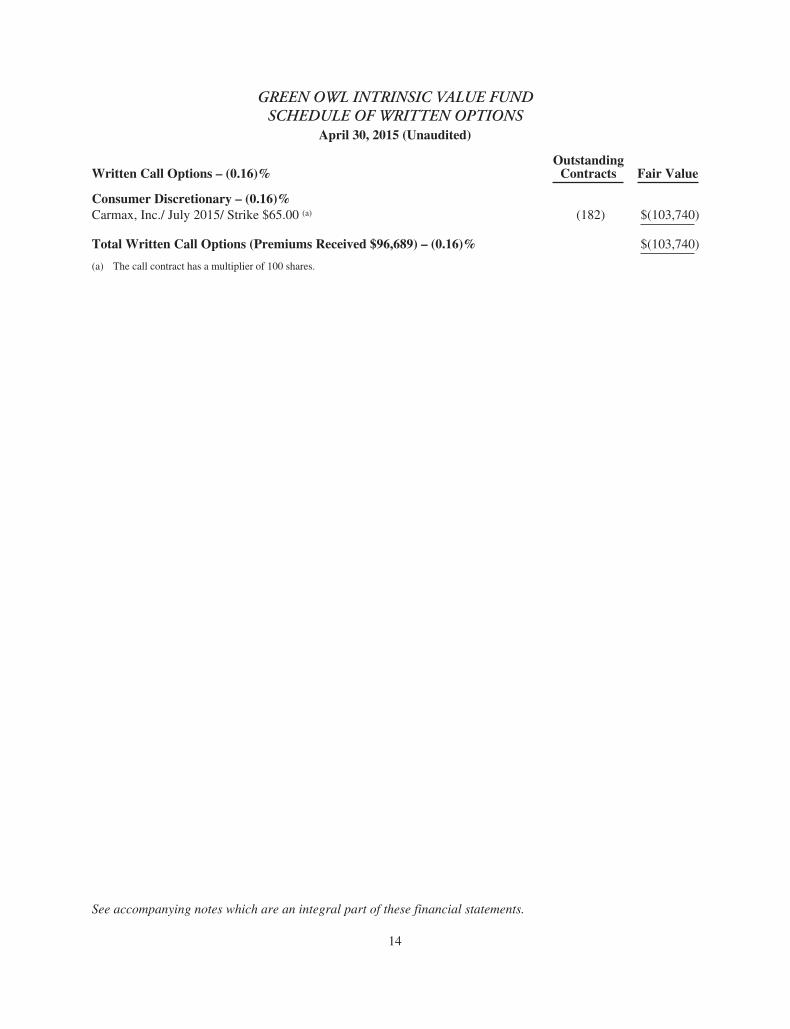
GREEN OWL INTRINSIC VALUE FUNDSCHEDULE OF WRITTEN OPTIONS
April 30, 2015 (Unaudited)
Written Call Options – (0.16)%Outstanding
Contracts Fair Value
Consumer Discretionary – (0.16)%Carmax, Inc./ July 2015/ Strike $65.00 (a) (182) $(103,740)
Total Written Call Options (Premiums Received $96,689) – (0.16)% $(103,740)
(a) The call contract has a multiplier of 100 shares.
See accompanying notes which are an integral part of these financial statements.
14
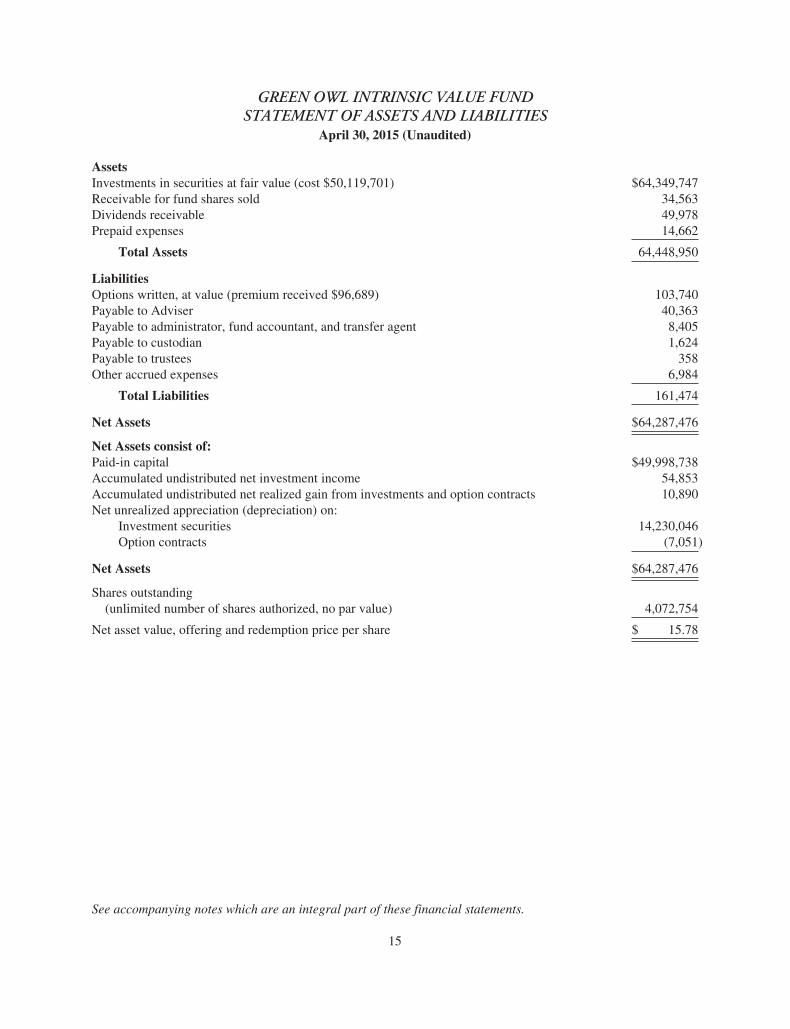
GREEN OWL INTRINSIC VALUE FUNDSTATEMENT OF ASSETS AND LIABILITIES
April 30, 2015 (Unaudited)
AssetsInvestments in securities at fair value (cost $50,119,701) $64,349,747Receivable for fund shares sold 34,563Dividends receivable 49,978Prepaid expenses 14,662
Total Assets 64,448,950
LiabilitiesOptions written, at value (premium received $96,689) 103,740Payable to Adviser 40,363Payable to administrator, fund accountant, and transfer agent 8,405Payable to custodian 1,624Payable to trustees 358Other accrued expenses 6,984
Total Liabilities 161,474
Net Assets $64,287,476
Net Assets consist of:Paid-in capital $49,998,738Accumulated undistributed net investment income 54,853Accumulated undistributed net realized gain from investments and option contracts 10,890Net unrealized appreciation (depreciation) on:
Investment securities 14,230,046Option contracts (7,051)
Net Assets $64,287,476
Shares outstanding(unlimited number of shares authorized, no par value) 4,072,754
Net asset value, offering and redemption price per share $ 15.78
See accompanying notes which are an integral part of these financial statements.
15
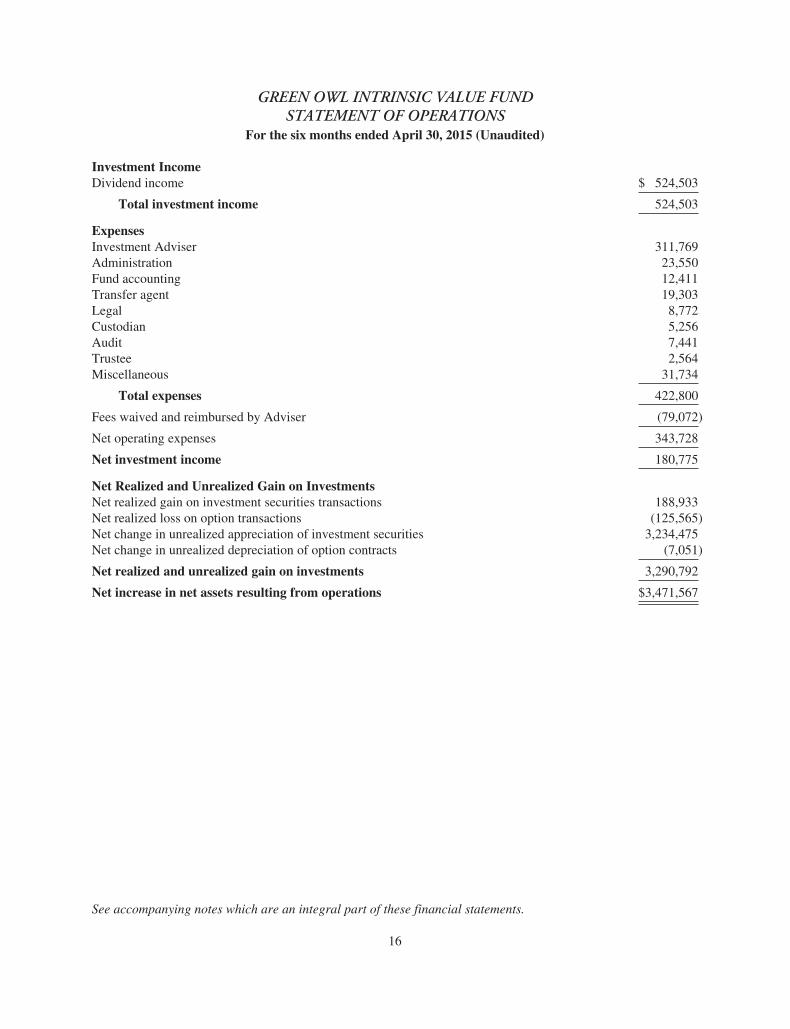
GREEN OWL INTRINSIC VALUE FUNDSTATEMENT OF OPERATIONS
For the six months ended April 30, 2015 (Unaudited)
Investment IncomeDividend income $ 524,503
Total investment income 524,503
ExpensesInvestment Adviser 311,769Administration 23,550Fund accounting 12,411Transfer agent 19,303Legal 8,772Custodian 5,256Audit 7,441Trustee 2,564Miscellaneous 31,734
Total expenses 422,800
Fees waived and reimbursed by Adviser (79,072)
Net operating expenses 343,728
Net investment income 180,775
Net Realized and Unrealized Gain on InvestmentsNet realized gain on investment securities transactions 188,933Net realized loss on option transactions (125,565)Net change in unrealized appreciation of investment securities 3,234,475Net change in unrealized depreciation of option contracts (7,051)
Net realized and unrealized gain on investments 3,290,792
Net increase in net assets resulting from operations $3,471,567
See accompanying notes which are an integral part of these financial statements.
16
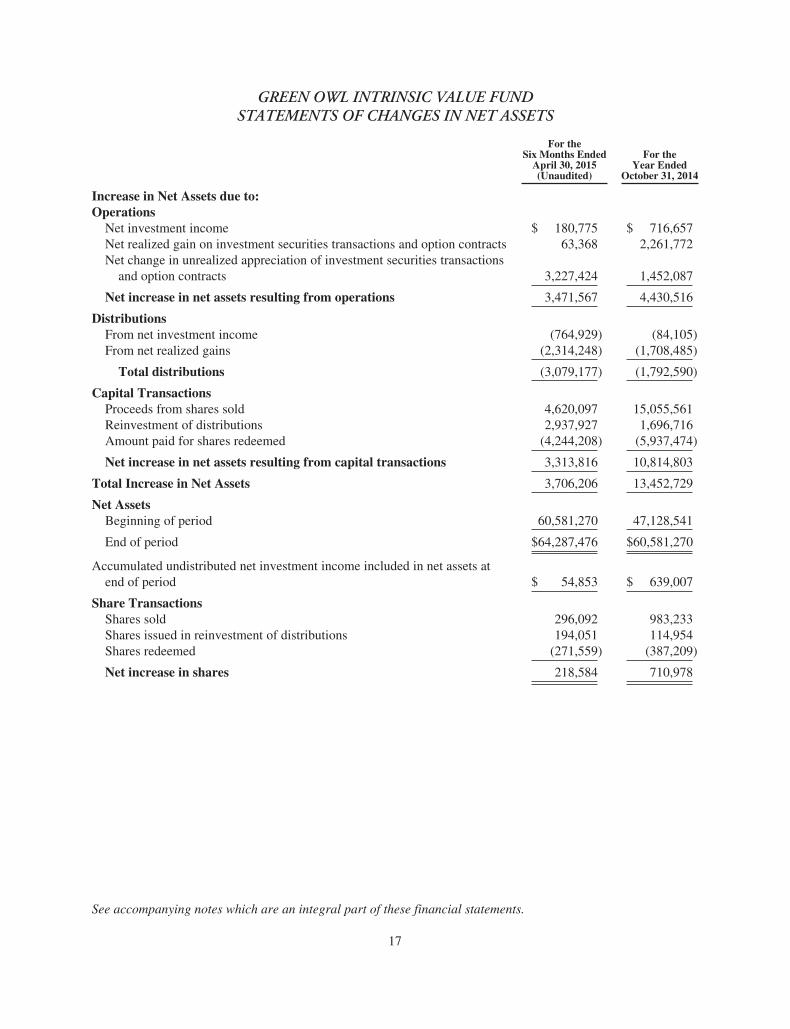
GREEN OWL INTRINSIC VALUE FUNDSTATEMENTS OF CHANGES IN NET ASSETS
For theSix Months Ended
April 30, 2015(Unaudited)
For theYear Ended
October 31, 2014
Increase in Net Assets due to:Operations
Net investment income $ 180,775 $ 716,657Net realized gain on investment securities transactions and option contracts 63,368 2,261,772Net change in unrealized appreciation of investment securities transactions
and option contracts 3,227,424 1,452,087
Net increase in net assets resulting from operations 3,471,567 4,430,516
DistributionsFrom net investment income (764,929) (84,105)From net realized gains (2,314,248) (1,708,485)
Total distributions (3,079,177) (1,792,590)
Capital TransactionsProceeds from shares sold 4,620,097 15,055,561Reinvestment of distributions 2,937,927 1,696,716Amount paid for shares redeemed (4,244,208) (5,937,474)
Net increase in net assets resulting from capital transactions 3,313,816 10,814,803
Total Increase in Net Assets 3,706,206 13,452,729
Net AssetsBeginning of period 60,581,270 47,128,541
End of period $64,287,476 $60,581,270
Accumulated undistributed net investment income included in net assets atend of period $ 54,853 $ 639,007
Share TransactionsShares sold 296,092 983,233Shares issued in reinvestment of distributions 194,051 114,954Shares redeemed (271,559) (387,209)
Net increase in shares 218,584 710,978
See accompanying notes which are an integral part of these financial statements.
17
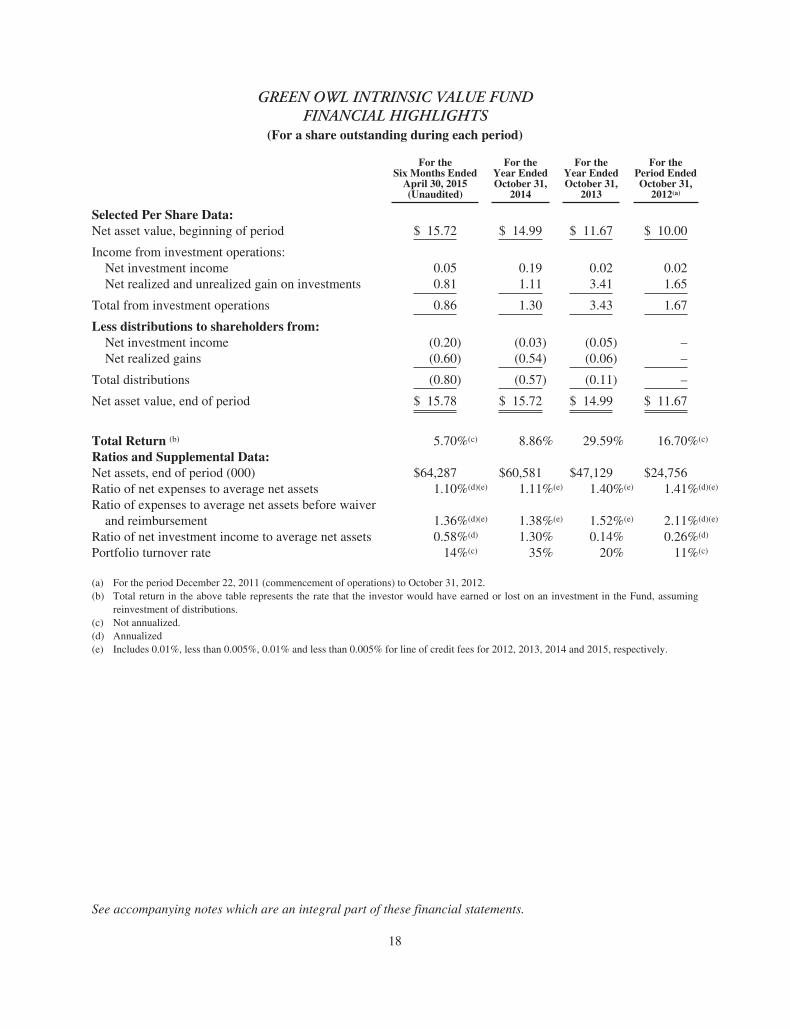
GREEN OWL INTRINSIC VALUE FUNDFINANCIAL HIGHLIGHTS
(For a share outstanding during each period)
For theSix Months Ended
April 30, 2015(Unaudited)
For theYear EndedOctober 31,
2014
For theYear EndedOctober 31,
2013
For thePeriod EndedOctober 31,
2012(a)
Selected Per Share Data:Net asset value, beginning of period $ 15.72 $ 14.99 $ 11.67 $ 10.00
Income from investment operations:Net investment income 0.05 0.19 0.02 0.02Net realized and unrealized gain on investments 0.81 1.11 3.41 1.65
Total from investment operations 0.86 1.30 3.43 1.67
Less distributions to shareholders from:Net investment income (0.20) (0.03) (0.05) –Net realized gains (0.60) (0.54) (0.06) –
Total distributions (0.80) (0.57) (0.11) –
Net asset value, end of period $ 15.78 $ 15.72 $ 14.99 $ 11.67
Total Return (b) 5.70%(c) 8.86% 29.59% 16.70%(c)
Ratios and Supplemental Data:Net assets, end of period (000) $64,287 $60,581 $47,129 $24,756Ratio of net expenses to average net assets 1.10%(d)(e) 1.11%(e) 1.40%(e) 1.41%(d)(e)
Ratio of expenses to average net assets before waiverand reimbursement 1.36%(d)(e) 1.38%(e) 1.52%(e) 2.11%(d)(e)
Ratio of net investment income to average net assets 0.58%(d) 1.30% 0.14% 0.26%(d)
Portfolio turnover rate 14%(c) 35% 20% 11%(c)
(a) For the period December 22, 2011 (commencement of operations) to October 31, 2012.(b) Total return in the above table represents the rate that the investor would have earned or lost on an investment in the Fund, assuming
reinvestment of distributions.(c) Not annualized.(d) Annualized(e) Includes 0.01%, less than 0.005%, 0.01% and less than 0.005% for line of credit fees for 2012, 2013, 2014 and 2015, respectively.
See accompanying notes which are an integral part of these financial statements.
18
GREEN OWL INTRINSIC VALUE FUNDNOTES TO THE FINANCIAL STATEMENTS
April 30, 2015 (Unaudited)
NOTE 1. ORGANIZATION
The Green Owl Intrinsic Value Fund (the “Fund”) is an open-end diversified series of the Valued Advisers Trust(the “Trust”). The Trust is a management investment company established under the laws of Delaware by anAgreement and Declaration of Trust dated June 13, 2008 (the “Trust Agreement”). The Trust Agreement permitsthe Trustees to issue an unlimited number of shares of beneficial interest of separate series without par value. TheFund is one of a series of funds authorized by the Trustees. The Fund’s investment adviser is Kovitz InvestmentGroup, LLC (the “Adviser”). The investment objective of the Fund is to provide long-term capital appreciation.
NOTE 2. SIGNIFICANT ACCOUNTING POLICIES
The Fund is an investment company and follows accounting and reporting guidance under Financial AccountingStandards Board (“FASB”) Accounting Standards Codification (“ASC”) Topic 946, “Financial Services-Investment Companies”. The following is a summary of significant accounting policies followed by the Fund inthe preparation of its financial statements. These polices are in conformity with generally accepted accountingprinciples in the United States of America (“GAAP”).
Securities Valuation – All investments in securities are recorded at their estimated fair value as described inNote 3.
Federal Income Taxes – The Fund makes no provision for federal income or excise tax. The Fund intends toqualify each year as a regulated investment company (“RIC”) under subchapter M of the Internal Revenue Codeof 1986, as amended, by complying with the requirements applicable to RICs and by distributing substantially allof its taxable income. The Fund also intends to distribute sufficient net investment income and net capital gains,if any, so that it will not be subject to excise tax on undistributed income and gains. If the required amount of netinvestment income or gains is not distributed, the Fund could incur a tax expense.
As of and during the six months ended April 30, 2015, the Fund did not have a liability for any unrecognized taxbenefits. The Fund recognizes interest and penalties, if any, related to unrecognized tax benefits as income taxexpense in the Statement of Operations. During the year, the Fund did not incur any interest or penalties. TheFund is subject to examination by U.S. federal tax authorities for all tax years since inception.
Expenses – Expenses incurred by the Trust that do not relate to a specific fund of the Trust are allocated to theindividual funds based on each fund’s relative net assets or other appropriate basis.
Security Transactions and Related Income – The Fund follows industry practice and records security transactionson the trade date for financial reporting purposes. The specific identification method is used for determininggains or losses for financial statements and income tax purposes. Dividend income is recorded on the ex-dividenddate and interest income is recorded on an accrual basis. Discounts and premiums on securities purchased areamortized or accreted using the effective interest method. Withholding taxes on foreign dividends have beenprovided for in accordance with the Fund’s understanding of the applicable country’s tax rules and rates. Theability of issuers of debt securities held by the Fund to meet their obligations may be affected by economic andpolitical developments in a specific country or region.
Dividends and Distributions – The Fund intends to distribute substantially all of its net investment income, netrealized long-term capital gains and its net realized short-term capital gains, if any, to its shareholders on at leastan annual basis. Dividends to shareholders, which are determined in accordance with income tax regulations, are
19
GREEN OWL INTRINSIC VALUE FUNDNOTES TO THE FINANCIAL STATEMENTS – (continued)
April 30, 2015 (Unaudited)
NOTE 2. SIGNIFICANT ACCOUNTING POLICIES – continued
recorded on the ex-dividend date. The treatment for financial reporting purposes of distributions made toshareholders during the year from net investment income or net realized capital gains may differ from theirultimate treatment for federal income tax purposes. These differences are caused primarily by differences in thetiming of the recognition of certain components of income, expense or realized capital gain for federal incometax purposes. Where such differences are permanent in nature, they are reclassified in the components of netassets based on their ultimate characterization for federal income tax purposes. Any such reclassifications willhave no effect on net assets, results of operations or net asset values per share of the Fund.
Writing Options – The Fund may write covered call options on equity securities or futures contracts that the Fundis eligible to purchase to extend a holding period to obtain long-term capital gain treatment, to earn premiumincome, to assure a definite price for a security it has considered selling, or to close out options previouslypurchased. The Fund may write covered call options if, immediately thereafter, not more than 30% of its netassets would be committed to such transactions. A call option gives the holder (buyer) the right to purchase asecurity or futures contract at a specified price (the exercise price) at any time until a certain date (the expirationdate). A call option is “covered” if the Fund owns the underlying security subject to the call option at all timesduring the option period, or to the extent that some or all of the risk of the option has been offset by anotheroption. When the Fund writes a covered call option, it maintains a segregated position within its account with itsCustodian or as otherwise required by the rules of the exchange the underlying security, cash or liquid portfoliosecurities in an amount not less than the exercise price at all times while the option is outstanding. See Note 4 foradditional disclosures.
The Fund will receive a premium from writing a call option, which increases the Fund’s return in the event theoption expires unexercised or is closed out at a profit. The amount of the premium will reflect, among otherthings, the relationship of the market price of the underlying security to the exercise price of the option and theremaining term of the option. However, there is no assurance that a closing transaction can be affected at afavorable price. During the option period, the covered call writer has, in return for the premium received, givenup the opportunity for capital appreciation above the exercise price should the market price of the underlyingsecurity increase, but has retained the risk of loss should the price of the underlying security decline.
The Fund may write put options on equity securities and futures contracts that the Fund is eligible to purchase toearn premium income or to assure a definite price for a security if it is considering acquiring the security at alower price than the current market price or to close out options previously purchased. The Fund may not write aput option if, immediately thereafter, more than 25% of its net assets would be committed to such transactions. Aput option gives the holder of the option the right to sell, and the writer has the obligation to buy, the underlyingsecurity at the exercise price at any time during the option period. The operation of put options in other respectsis substantially identical to that of call options. When the Fund writes a put option, it maintains a segregatedposition within its account with the Custodian of cash or liquid portfolio securities in an amount not less than theexercise price at all times while the put option is outstanding.
The Fund will receive a premium from writing a put option, which increases the Fund’s return in the event theoption expires unexercised or is closed out at a profit. The amount of the premium will reflect, among otherthings, the relationship of the market price of the underlying security to the exercise price of the option and theremaining term of the option. The risks involved in writing put options include the risk that a closing transactioncannot be effected at a favorable price and the possibility that the price of the underlying security may fall belowthe exercise price, in which case the Fund may be required to purchase the underlying security at a higher price
20
GREEN OWL INTRINSIC VALUE FUNDNOTES TO THE FINANCIAL STATEMENTS – (continued)
April 30, 2015 (Unaudited)
NOTE 2. SIGNIFICANT ACCOUNTING POLICIES – continued
than the market price of the security at the time the option is exercised, resulting in a potential capital loss unlessthe security subsequently appreciates in value. During the six months ended April 30, 2015, the Fund utilizedcovered call options to extend the holding period to obtain long-term capital gain treatment and to take advantageof the option premium to garner a higher exit price than would have been available by immediately selling thestock.
NOTE 3. SECURITIES VALUATION AND FAIR VALUE MEASUREMENTS
Fair value is defined as the price that a Fund would receive upon selling an investment in an orderly transactionto an independent buyer in the principal or most advantageous market of the investment. GAAP established athree-tier hierarchy to maximize the use of observable market data and minimize the use of unobservable inputsand to establish classification of fair value measurements for disclosure purposes.
Inputs refer broadly to the assumptions that market participants would use in pricing the asset or liability,including assumptions about risk; for example, the risk inherent in a particular valuation technique used tomeasure fair value including items such as a pricing model and/or the risk inherent in the inputs to the valuationtechnique. Inputs may be observable or unobservable. Observable inputs are inputs that reflect the assumptionsmarket participants would use in pricing the asset or liability developed based on market data obtained fromsources independent of the reporting entity. Unobservable inputs are inputs that reflect the reporting entity’s ownassumptions about the assumptions market participants would use in pricing the asset or liability developed basedon the best information available in the circumstances.
Various inputs are used in determining the value of the Fund’s investments. These inputs are summarized in thethree broad levels listed below.
• Level 1 – quoted prices in active markets for identical securities
• Level 2 – other significant observable inputs (including, but not limited to, quoted prices for an identicalsecurity in an inactive market, quoted prices for similar securities, interest rates, prepayment speeds,credit risk, etc.)
• Level 3 – significant unobservable inputs (including the Fund’s own assumptions in determining fairvalue of investments based on the best information available)
The inputs used to measure fair value may fall into different levels of the fair value hierarchy. In such cases, fordisclosure purposes, the level in the fair value hierarchy within which the fair value measurement falls in itsentirety, is determined based on the lowest level input that is significant to the fair value measurement in itsentirety.
Equity securities, including common stocks, are generally valued by using market quotations, but may be valuedon the basis of prices furnished by a pricing service when the Fund believes such prices more accurately reflectthe fair value of such securities. Securities that are traded on any stock exchange are generally valued by thepricing service at the last quoted sale price. Lacking a last sale price, an exchange traded security is generallyvalued by the pricing service at its last bid price. Securities traded in the NASDAQ over-the-counter market aregenerally valued by the pricing service at the NASDAQ Official Closing Price. When using the marketquotations or close prices provided by the pricing service and when the market is considered active, the securitywill be classified as a Level 1 security. Sometimes, an equity security owned by the Fund will be valued by the
21
GREEN OWL INTRINSIC VALUE FUNDNOTES TO THE FINANCIAL STATEMENTS – (continued)
April 30, 2015 (Unaudited)
NOTE 3. SECURITIES VALUATION AND FAIR VALUE MEASUREMENTS – continued
pricing service with factors other than market quotations or when the market is considered inactive. When thishappens, the security will be classified as a Level 2 security. When market quotations are not readily available,when the Fund determines that the market quotation or the price provided by the pricing service does notaccurately reflect the current fair value, or when restricted or illiquid securities are being valued, such securitiesare valued as determined in good faith by the Fund, in conformity with guidelines adopted by and subject toreview by the Board. These will generally be categorized as Level 3 securities.
Investments in open-end mutual funds, including money market mutual funds, are generally priced at the endingnet asset value (NAV) provided by the service agent of the funds. These securities are categorized as Level 1securities.
Written option contracts that the Fund invests in are generally traded on an exchange. The options in which theFund invests are generally valued at the last trade price as provided by a pricing service. If the last sale price isnot available, the options will be valued at the mean of the last bid and ask prices. The options will generally becategorized as Level 1 securities. If the Fund decides that a price provided by the pricing service does notaccurately reflect the fair value of the securities, when prices are not readily available from a pricing service, orwhen restricted or illiquid securities are being valued, securities are valued at fair value as determined in goodfaith by the Fund, in conformity with guidelines adopted by and subject to review of the Board. These securitieswill generally be categorized as Level 3 securities.
In accordance with the Trust’s good faith pricing guidelines, the Adviser is required to consider all appropriatefactors relevant to the value of securities for which it has determined other pricing sources are not available orreliable as described above. No single standard exists for determining fair value, because fair value depends uponthe circumstances of each individual case. As a general principle, the current fair value of an issue of securitiesbeing valued by the Adviser would appear to be the amount which the owner might reasonably expect to receivefor them upon their current sale. Methods which are in accordance with this principle may, for example, be basedon (i) a multiple of earnings; (ii) a discount from market of a similar freely traded security (including a derivativesecurity or a basket of securities traded on other markets, exchanges or among dealers); or (iii) yield to maturitywith respect to debt issues, or a combination of these and other methods. Good faith pricing is permitted if, in theAdviser’s opinion, the validity of market quotations appears to be questionable based on factors such as evidenceof a thin market in the security based on a small number of quotations, a significant event occurs after the closeof a market but before a Fund’s NAV calculation that may affect a security’s value, or the Adviser is aware ofany other data that calls into question the reliability of market quotations. Good faith pricing may also be used ininstances when the bonds the Fund invests in may default or otherwise cease to have market quotations readilyavailable. Any fair value pricing done outside the Fund’s approved pricing methods must be approved by thePricing Committee of the Board.
22
GREEN OWL INTRINSIC VALUE FUNDNOTES TO THE FINANCIAL STATEMENTS – (continued)
April 30, 2015 (Unaudited)
NOTE 3. SECURITIES VALUATION AND FAIR VALUE MEASUREMENTS – continued
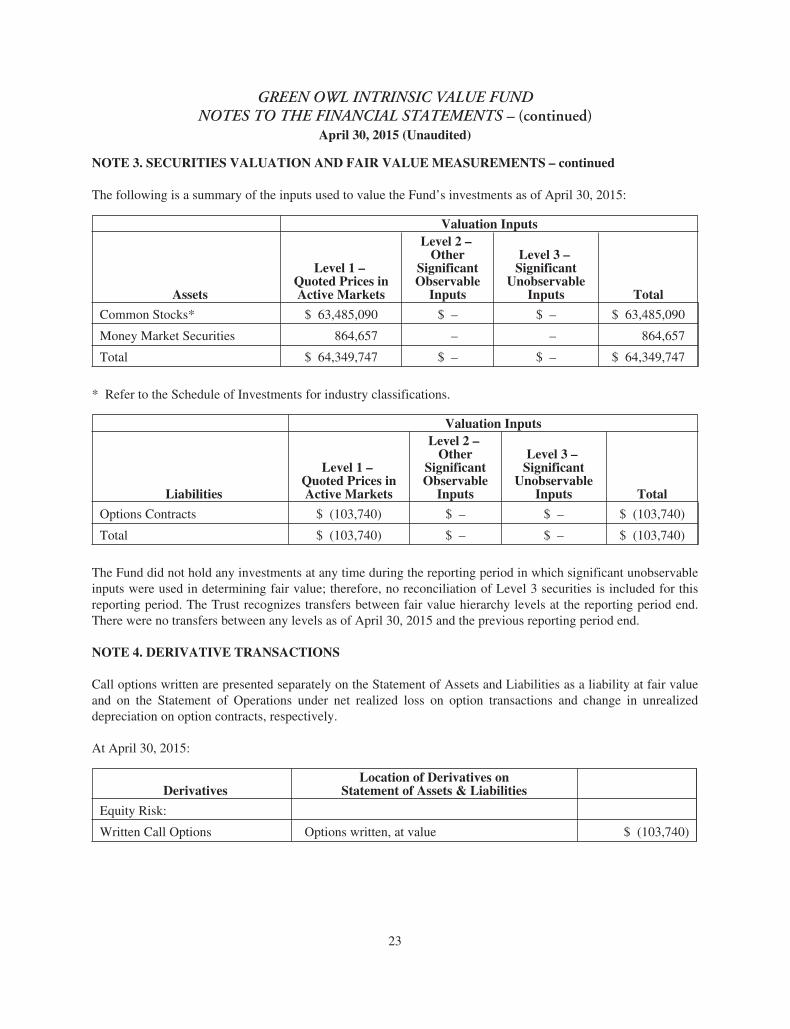
The following is a summary of the inputs used to value the Fund’s investments as of April 30, 2015:
Valuation Inputs
Assets
Level 1 –Quoted Prices inActive Markets
Level 2 –Other
SignificantObservable
Inputs
Level 3 –Significant
UnobservableInputs Total
Common Stocks* $ 63,485,090 $ – $ – $ 63,485,090
Money Market Securities 864,657 – – 864,657
Total $ 64,349,747 $ – $ – $ 64,349,747
* Refer to the Schedule of Investments for industry classifications.
Valuation Inputs
Liabilities
Level 1 –Quoted Prices inActive Markets
Level 2 –Other
SignificantObservable
Inputs
Level 3 –Significant
UnobservableInputs Total
Options Contracts $ (103,740) $ – $ – $ (103,740)
Total $ (103,740) $ – $ – $ (103,740)
The Fund did not hold any investments at any time during the reporting period in which significant unobservableinputs were used in determining fair value; therefore, no reconciliation of Level 3 securities is included for thisreporting period. The Trust recognizes transfers between fair value hierarchy levels at the reporting period end.There were no transfers between any levels as of April 30, 2015 and the previous reporting period end.
NOTE 4. DERIVATIVE TRANSACTIONS
Call options written are presented separately on the Statement of Assets and Liabilities as a liability at fair valueand on the Statement of Operations under net realized loss on option transactions and change in unrealizeddepreciation on option contracts, respectively.
At April 30, 2015:
DerivativesLocation of Derivatives on
Statement of Assets & Liabilities
Equity Risk:
Written Call Options Options written, at value $ (103,740)
23
GREEN OWL INTRINSIC VALUE FUNDNOTES TO THE FINANCIAL STATEMENTS – (continued)
April 30, 2015 (Unaudited)
NOTE 4. DERIVATIVE TRANSACTIONS – continued
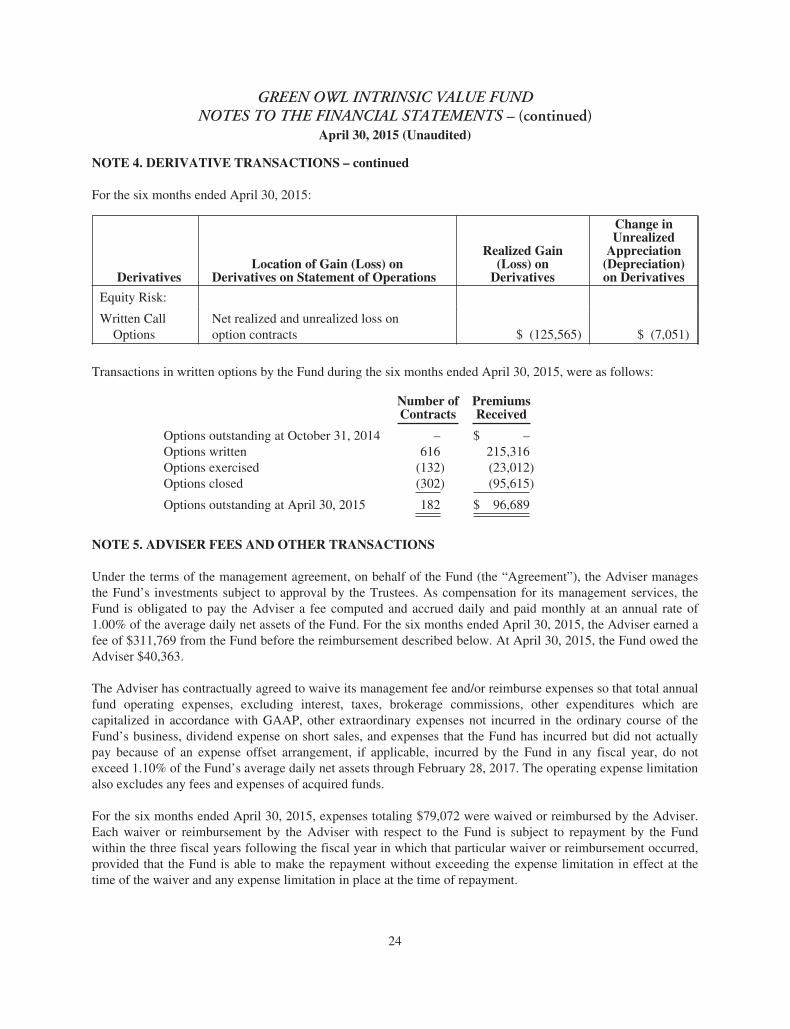
For the six months ended April 30, 2015:
DerivativesLocation of Gain (Loss) on
Derivatives on Statement of Operations
Realized Gain(Loss) on
Derivatives
Change inUnrealized
Appreciation(Depreciation)on Derivatives
Equity Risk:
Written CallOptions
Net realized and unrealized loss onoption contracts $ (125,565) $ (7,051)
Transactions in written options by the Fund during the six months ended April 30, 2015, were as follows:
Number ofContracts
PremiumsReceived
Options outstanding at October 31, 2014 – $ –Options written 616 215,316Options exercised (132) (23,012)Options closed (302) (95,615)
Options outstanding at April 30, 2015 182 $ 96,689
NOTE 5. ADVISER FEES AND OTHER TRANSACTIONS
Under the terms of the management agreement, on behalf of the Fund (the “Agreement”), the Adviser managesthe Fund’s investments subject to approval by the Trustees. As compensation for its management services, theFund is obligated to pay the Adviser a fee computed and accrued daily and paid monthly at an annual rate of1.00% of the average daily net assets of the Fund. For the six months ended April 30, 2015, the Adviser earned afee of $311,769 from the Fund before the reimbursement described below. At April 30, 2015, the Fund owed theAdviser $40,363.
The Adviser has contractually agreed to waive its management fee and/or reimburse expenses so that total annualfund operating expenses, excluding interest, taxes, brokerage commissions, other expenditures which arecapitalized in accordance with GAAP, other extraordinary expenses not incurred in the ordinary course of theFund’s business, dividend expense on short sales, and expenses that the Fund has incurred but did not actuallypay because of an expense offset arrangement, if applicable, incurred by the Fund in any fiscal year, do notexceed 1.10% of the Fund’s average daily net assets through February 28, 2017. The operating expense limitationalso excludes any fees and expenses of acquired funds.
For the six months ended April 30, 2015, expenses totaling $79,072 were waived or reimbursed by the Adviser.Each waiver or reimbursement by the Adviser with respect to the Fund is subject to repayment by the Fundwithin the three fiscal years following the fiscal year in which that particular waiver or reimbursement occurred,provided that the Fund is able to make the repayment without exceeding the expense limitation in effect at thetime of the waiver and any expense limitation in place at the time of repayment.
24
GREEN OWL INTRINSIC VALUE FUNDNOTES TO THE FINANCIAL STATEMENTS – (continued)
April 30, 2015 (Unaudited)
NOTE 5. ADVISER FEES AND OTHER TRANSACTIONS – continued
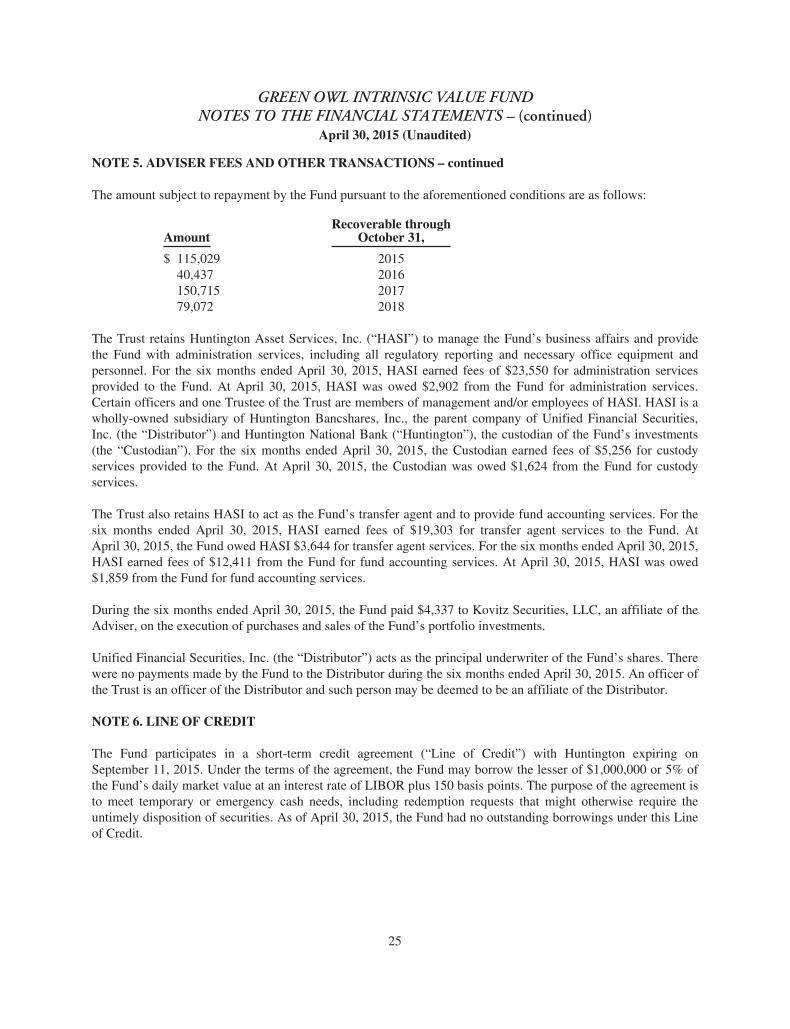
The amount subject to repayment by the Fund pursuant to the aforementioned conditions are as follows:
AmountRecoverable through
October 31,
$ 115,029 201540,437 2016150,715 201779,072 2018
The Trust retains Huntington Asset Services, Inc. (“HASI”) to manage the Fund’s business affairs and providethe Fund with administration services, including all regulatory reporting and necessary office equipment andpersonnel. For the six months ended April 30, 2015, HASI earned fees of $23,550 for administration servicesprovided to the Fund. At April 30, 2015, HASI was owed $2,902 from the Fund for administration services.Certain officers and one Trustee of the Trust are members of management and/or employees of HASI. HASI is awholly-owned subsidiary of Huntington Bancshares, Inc., the parent company of Unified Financial Securities,Inc. (the “Distributor”) and Huntington National Bank (“Huntington”), the custodian of the Fund’s investments(the “Custodian”). For the six months ended April 30, 2015, the Custodian earned fees of $5,256 for custodyservices provided to the Fund. At April 30, 2015, the Custodian was owed $1,624 from the Fund for custodyservices.
The Trust also retains HASI to act as the Fund’s transfer agent and to provide fund accounting services. For thesix months ended April 30, 2015, HASI earned fees of $19,303 for transfer agent services to the Fund. AtApril 30, 2015, the Fund owed HASI $3,644 for transfer agent services. For the six months ended April 30, 2015,HASI earned fees of $12,411 from the Fund for fund accounting services. At April 30, 2015, HASI was owed$1,859 from the Fund for fund accounting services.
During the six months ended April 30, 2015, the Fund paid $4,337 to Kovitz Securities, LLC, an affiliate of theAdviser, on the execution of purchases and sales of the Fund’s portfolio investments.
Unified Financial Securities, Inc. (the “Distributor”) acts as the principal underwriter of the Fund’s shares. Therewere no payments made by the Fund to the Distributor during the six months ended April 30, 2015. An officer ofthe Trust is an officer of the Distributor and such person may be deemed to be an affiliate of the Distributor.
NOTE 6. LINE OF CREDIT
The Fund participates in a short-term credit agreement (“Line of Credit”) with Huntington expiring onSeptember 11, 2015. Under the terms of the agreement, the Fund may borrow the lesser of $1,000,000 or 5% ofthe Fund’s daily market value at an interest rate of LIBOR plus 150 basis points. The purpose of the agreement isto meet temporary or emergency cash needs, including redemption requests that might otherwise require theuntimely disposition of securities. As of April 30, 2015, the Fund had no outstanding borrowings under this Lineof Credit.
25
GREEN OWL INTRINSIC VALUE FUNDNOTES TO THE FINANCIAL STATEMENTS – (continued)
April 30, 2015 (Unaudited)
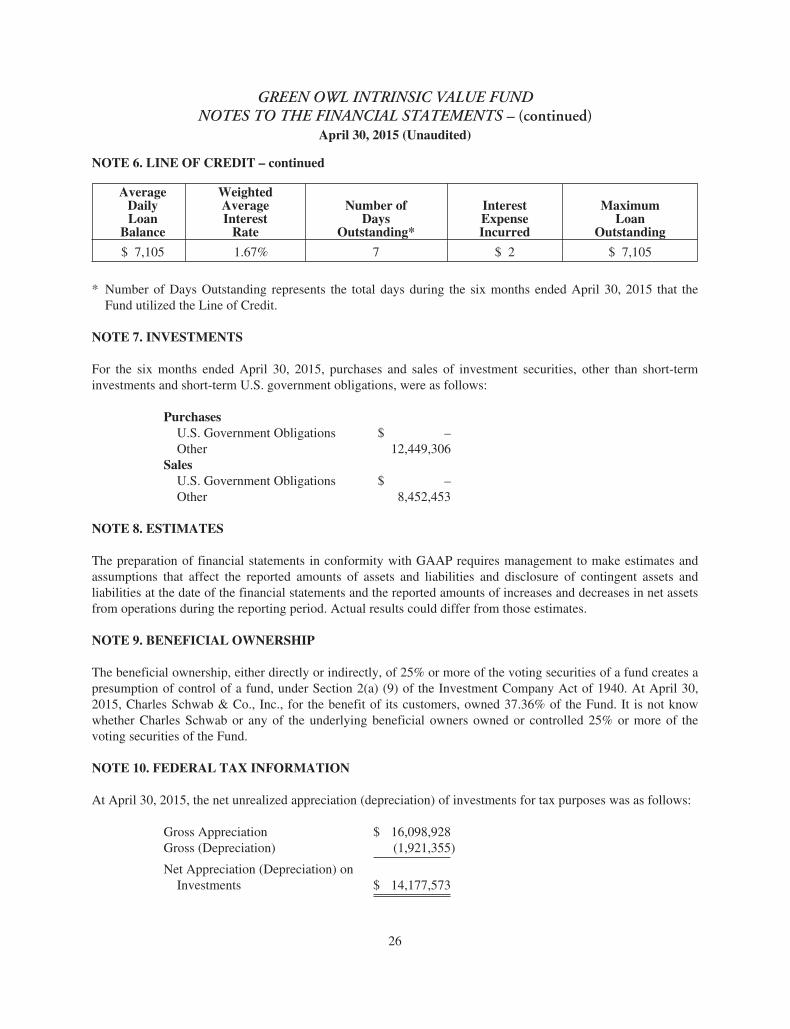
NOTE 6. LINE OF CREDIT – continued
AverageDailyLoan
Balance
WeightedAverageInterest
Rate
Number ofDays
Outstanding*
InterestExpenseIncurred
MaximumLoan
Outstanding
$ 7,105 1.67% 7 $ 2 $ 7,105
* Number of Days Outstanding represents the total days during the six months ended April 30, 2015 that theFund utilized the Line of Credit.
NOTE 7. INVESTMENTS
For the six months ended April 30, 2015, purchases and sales of investment securities, other than short-terminvestments and short-term U.S. government obligations, were as follows:
PurchasesU.S. Government Obligations $ –Other 12,449,306
SalesU.S. Government Obligations $ –Other 8,452,453
NOTE 8. ESTIMATES
The preparation of financial statements in conformity with GAAP requires management to make estimates andassumptions that affect the reported amounts of assets and liabilities and disclosure of contingent assets andliabilities at the date of the financial statements and the reported amounts of increases and decreases in net assetsfrom operations during the reporting period. Actual results could differ from those estimates.
NOTE 9. BENEFICIAL OWNERSHIP
The beneficial ownership, either directly or indirectly, of 25% or more of the voting securities of a fund creates apresumption of control of a fund, under Section 2(a) (9) of the Investment Company Act of 1940. At April 30,2015, Charles Schwab & Co., Inc., for the benefit of its customers, owned 37.36% of the Fund. It is not knowwhether Charles Schwab or any of the underlying beneficial owners owned or controlled 25% or more of thevoting securities of the Fund.
NOTE 10. FEDERAL TAX INFORMATION
At April 30, 2015, the net unrealized appreciation (depreciation) of investments for tax purposes was as follows:
Gross Appreciation $ 16,098,928Gross (Depreciation) (1,921,355)
Net Appreciation (Depreciation) onInvestments $ 14,177,573
26
GREEN OWL INTRINSIC VALUE FUNDNOTES TO THE FINANCIAL STATEMENTS – (continued)
April 30, 2015 (Unaudited)
NOTE 10. FEDERAL TAX INFORMATION – continued
At April 30, 2015, the aggregate cost of securities for federal income tax purposes was $50,172,174.
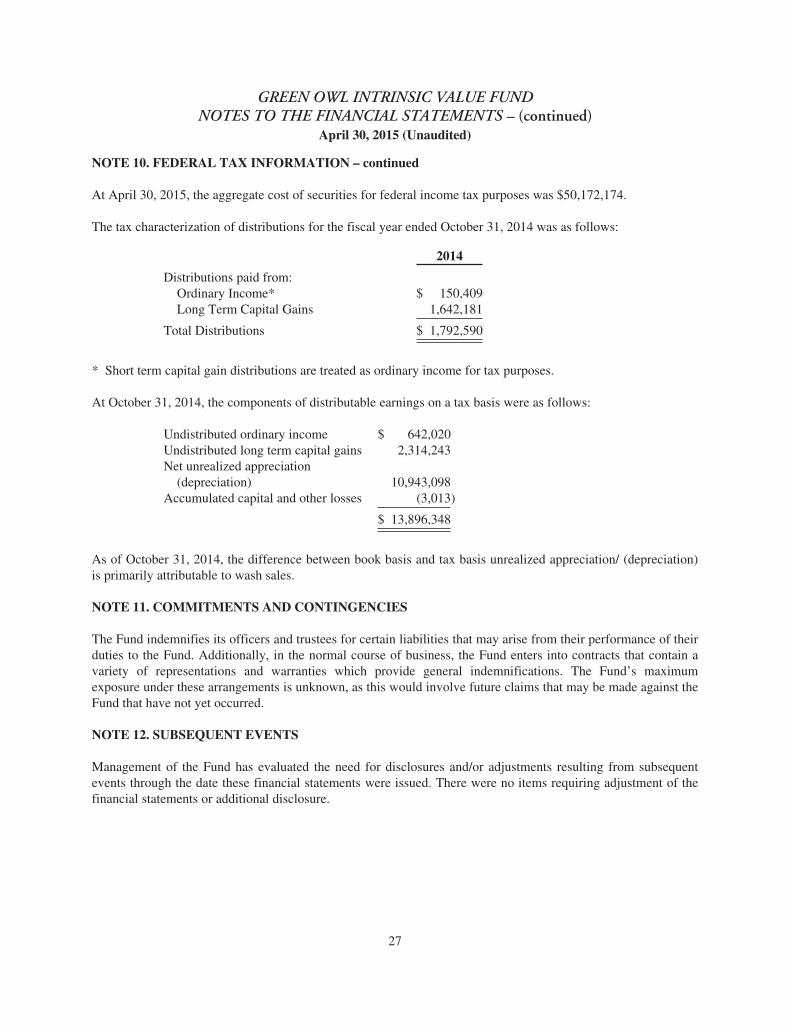
The tax characterization of distributions for the fiscal year ended October 31, 2014 was as follows:
2014
Distributions paid from:Ordinary Income* $ 150,409Long Term Capital Gains 1,642,181
Total Distributions $ 1,792,590
* Short term capital gain distributions are treated as ordinary income for tax purposes.
At October 31, 2014, the components of distributable earnings on a tax basis were as follows:
Undistributed ordinary income $ 642,020Undistributed long term capital gains 2,314,243Net unrealized appreciation
(depreciation) 10,943,098Accumulated capital and other losses (3,013)
$ 13,896,348
As of October 31, 2014, the difference between book basis and tax basis unrealized appreciation/ (depreciation)is primarily attributable to wash sales.
NOTE 11. COMMITMENTS AND CONTINGENCIES
The Fund indemnifies its officers and trustees for certain liabilities that may arise from their performance of theirduties to the Fund. Additionally, in the normal course of business, the Fund enters into contracts that contain avariety of representations and warranties which provide general indemnifications. The Fund’s maximumexposure under these arrangements is unknown, as this would involve future claims that may be made against theFund that have not yet occurred.
NOTE 12. SUBSEQUENT EVENTS
Management of the Fund has evaluated the need for disclosures and/or adjustments resulting from subsequentevents through the date these financial statements were issued. There were no items requiring adjustment of thefinancial statements or additional disclosure.
27
OTHER INFORMATION
The Fund’s Statement of Additional Information (“SAI”) includes additional information about the trustees andis available without charge, upon request. You may call toll-free at (888) 695-3729 to request a copy of the SAIor to make shareholder inquiries.
PROXY VOTING
A description of the policies and procedures that the Fund uses to determine how to vote proxies relating toportfolio securities and information regarding how the Fund voted those proxies is available without charge uponrequest by (1) calling the Fund at (888) 695-3729 and (2) from Fund documents filed with the Securities andExchange Commission (“SEC”) on the SEC’s website at www.sec.gov.
TRUSTEESR. Jeffrey Young, ChairmanIra CohenAndrea N. Mullins
OFFICERSR. Jeffrey Young, Principal Executive Officer and
PresidentJohn C. Swhear, Chief Compliance Officer, AML
Officer and Vice PresidentCarol J. Highsmith, Vice President and SecretaryMatthew J. Miller, Vice PresidentBryan W. Ashmus, Principal Financial Officer and
Treasurer
INVESTMENT ADVISERKovitz Investment Group, LLC115 South LaSalle Street, 27th FloorChicago, IL 60603
DISTRIBUTORUnified Financial Securities, Inc.2960 North Meridian Street, Suite 300Indianapolis, IN 46208
INDEPENDENT REGISTERED PUBLICACCOUNTING FIRMCohen Fund Audit Services Ltd.1350 Euclid Avenue, Suite 800Cleveland, OH 44115
LEGAL COUNSELThe Law Offices of John H. Lively &
Associates, Inc.A member firm of The 1940 Act Law GroupTM
11300 Tomahawk Creek Parkway, Ste. 310Leawood, KS 66211
CUSTODIANHuntington National Bank41 South High StreetColumbus, OH 43215
ADMINISTRATOR, TRANSFER AGENT ANDFUND ACCOUNTANTHuntington Asset Services, Inc.2960 North Meridian Street, Suite 300Indianapolis, IN 46208
This report is intended only for the information of shareholders or those who have received the Fund’s prospectuswhich contains information about the Fund’s management fee and expenses. Please read the prospectus carefullybefore investing.
Distributed by Unified Financial Securities, Inc.Member FINRA/SIPC
28
PRIVACY POLICY
The following is a description of the Fund’s policies regarding disclosure of nonpublic personal information thatyou provide to the Fund or that the Fund collects from other sources. In the event that you hold shares of theFund through a broker-dealer or other financial intermediary, the privacy policy of your financial intermediarywould govern how your nonpublic personal information would be shared with nonaffiliated third parties.
Categories of Information the Fund Collects. The Fund collects the following nonpublic personal informationabout you:
• Information the Fund receives from you on applications or other forms, correspondence, or conversations(such as your name, address, phone number, social security number, and date of birth); and
• Information about your transactions with the Fund, its affiliates, or others (such as your account numberand balance, payment history, cost basis information, and other financial information).
Categories of Information the Fund Discloses. The Fund does not disclose any nonpublic personal informationabout its current or former shareholders to unaffiliated third parties, except as required or permitted by law. TheFund is permitted by law to disclose all of the information it collects, as described above, to service providers(such as the Fund’s custodian, administrator, transfer agent, accountant and legal counsel) to process yourtransactions and otherwise provide services to you.
Confidentiality and Security. The Fund restricts access to your nonpublic personal information to those personswho require such information to provide products or services to you. The Fund maintains physical, electronic,and procedural safeguards that comply with federal standards to guard your nonpublic personal information.
Disposal of Information. The Fund, through its transfer agent, has taken steps to reasonably ensure that theprivacy of your nonpublic personal information is maintained at all times, including in connection with thedisposal of information that is no longer required to be maintained by the Fund. Such steps shall include,whenever possible, shredding paper documents and records prior to disposal, requiring off-site storage vendors toshred documents maintained in such locations prior to disposal, and erasing and/or obliterating any datacontained on electronic media in such a manner that the information can no longer be read or reconstructed.
29