Embed Size (px)
Citation preview

Semi-Annual Report for
AmIncome Plus30 April 2020

AmIncome Plus
TRUST DIRECTORY
Manager AmFunds Management Berhad
9th & 10th Floor, Bangunan AmBank Group 55 Jalan Raja Chulan 50200 Kuala Lumpur
Board of Directors Jeyaratnam A/L Tamotharam Pillai
Dato’ Mustafa Bin Mohd Nor Tai Terk Lin
Sum Leng Kuang Goh Wee Peng
Investment Committee Sum Leng Kuang
Tai Terk Lin Dato’ Mustafa Bin Mohd Nor
Zainal Abidin Bin Mohd Kassim Goh Wee Peng
Trustee AmanahRaya Trustees Berhad
Auditors and Reporting Accountants Ernst & Young PLT
Taxation Adviser Deloitte Tax Services Sdn Bhd

AmIncome Plus
CONTENTS
1 Manager’s Report
7 Condensed Statement of Financial Position
8 Condensed Statement of Comprehensive Income
9 Condensed Statement of Changes in Equity
10 Condensed Statement of Cash Flows
11 Notes to the Condensed Financial Statements
35 Statement by the Manager
36 Trustee’s Report
37 Directory

1
MANAGER’S REPORT Dear Unitholders, We are pleased to present you the Manager’s report and the unaudited accounts of AmIncome Plus (“Fund”) for the financial period from 1 November 2019 to 30 April 2020. Salient Information of the Fund
Name
AmIncome Plus (“Fund”)
Category/ Type
Fixed Income / Income
Objective The Fund is a short to medium-term fixed income fund which aims to provide you with enhanced returns. Note: Any material change to the investment objective of the Fund would require Unit Holders’ approval.
Duration AmIncome Plus was established on 26 November 2001 and shall exist for as long as it appears to the Manager and the Trustee that it is in the interests of the unitholders for it to continue. In some circumstances, the unitholders can resolve at a meeting to terminate the Fund.
Performance Benchmark
Malayan Banking Berhad 1-Month Fixed Deposit Rate (“MBB”) (obtainable from www.aminvest.com / www.maybank2u.com.my) Note: The benchmark does not imply that the risk profile of the Fund is the same as the risk profile of the benchmark. Investors of the Fund will assume a higher risk compared to the benchmark. Hence, the returns of the Fund may be potentially higher due to the higher risk faced by the investors.
Income Distribution Policy
Income distribution (if any) is paid at least twice every year.
Breakdown of Unit Holdings by Size
For the financial period under review, the size of the Fund stood at 814,835,874 units.
Size of holding As at 30 April 2020 As at 31 October 2019
No of units held
Number of unitholders
No of units held
Number of unitholders
5,000 and below 2,980 1 2,904 1
5,001-10,000 17,097 2 7,498 1
10,001-50,000 65,756 2 89,490 4
50,001-500,000 1,195,805 5 1,623,548 6
500,001 and above 813,554,236 15 781,834,871 13

2
Fund Performance Data
Portfolio Composition
Details of portfolio composition of the Fund for the financial period as at 30 April 2020 and three financial years as at 31 October are as follows:
As at 30.4.2020
%
FY 2019
%
FY 2018
%
FY 2017
%
Corporate bonds 87.26 77.75 83.31 78.89
Government Securities - 1.92 - 0.41
Money market deposit 5.59 5.68 4.70 19.13
Cash, other assets & liabilities 7.15 14.65 11.99 1.57
Total 100.00 100.00 100.00 100.00
Note: The abovementioned percentages are calculated based on total net asset value.
Performance Details
Performance details of the Fund for the financial period ended 30 April 2020 and three financial years ended 31 October are as follows:
Half year ended
30.4.2020
FY
2019
FY
2018
FY
2017
Net asset value (RM)* 549,228,945 530,266,207 531,623,462 495,103,231
Units in circulation* 814,835,874 783,558,311 783,953,256 720,576,045
Net asset value per unit (RM)*
0.6740
0.6767
0.6781
0.6871
Highest net asset value per unit (RM)*
0.6914
0.6941
0.6990
0.7116
Lowest net asset value per unit (RM)*
0.6719
0.6754
0.6781
0.6865
Benchmark performance (%)
1.31
3.02
3.12
2.95
Total return (%)(1) 2.20 5.03 3.84 3.29
- Capital growth (%) -0.39 -0.13 -1.25 -2.05
- Income distribution (%) 2.59 5.16 5.09 5.34
Gross distribution (sen per unit)
1.75
3.50
3.50
3.75
Net distribution (sen per unit)
1.75
3.50
3.50
3.75
Management expense ratio (%)(2)
0.82
0.82
0.85
0.87
Portfolio turnover ratio (times)(3)
0.26
0.44
0.40
0.23
* Above prices and net asset value per unit are shown as ex-distribution. Note: (1) Total return is the actual/annualised return of the Fund for the respective financial
period/years computed based on the net asset value per unit and net of all fees. (2) Management expense ratio (“MER”) is calculated based on the total fees and
expenses incurred by the Fund divided by the average fund size calculated on a daily basis.
(Forward)

3
(3) Portfolio turnover ratio (“PTR”) is calculated based on the average of the total acquisitions and total disposals of investment securities of the Fund divided by the average fund size calculated on a daily basis. The PTR decreased by 0.18 times (40.9%) as compared to 0.44 times for the financial year ended 31 October 2019 mainly due to decrease in investing activities.
Average Total Return (as at 30 April 2020)
AmIncome Plus(a) %
MBB(b) %
One year 4.92 2.78
Three years 4.33 2.98
Five years 3.98 3.01
Ten years 3.59 2.99
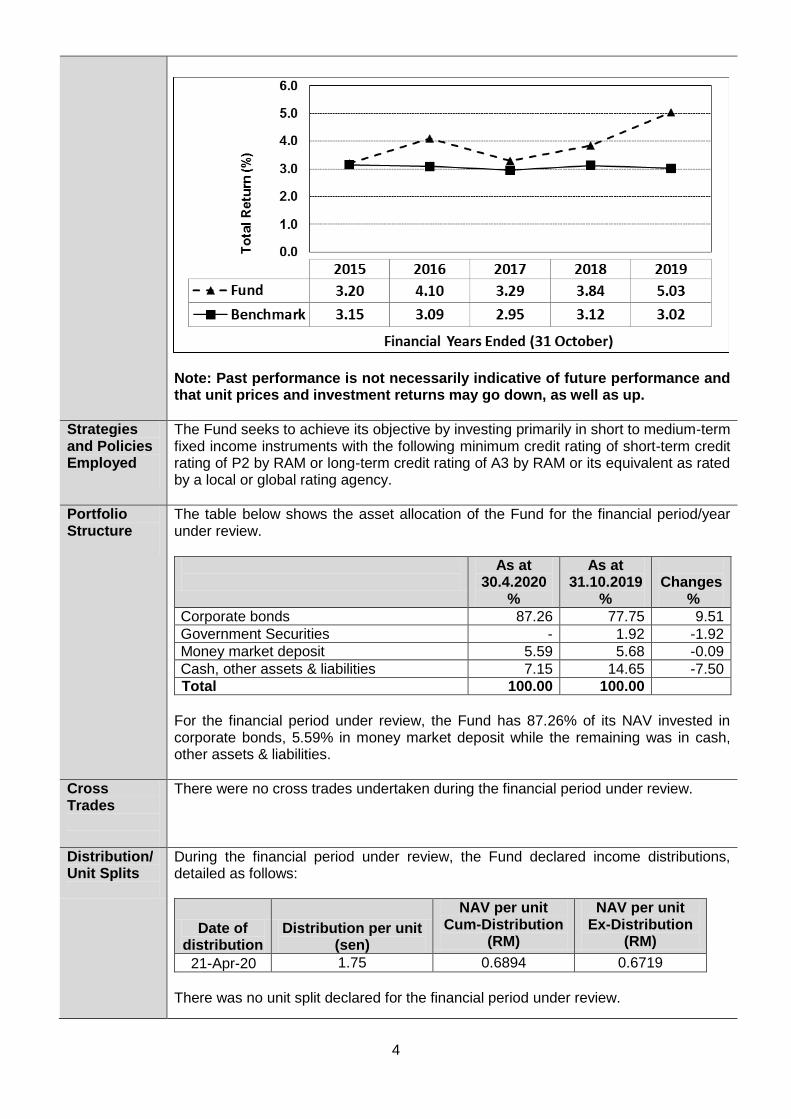
Annual Total Return
Financial Years Ended (31 October)
AmIncome Plus(a) %
MBB(b) %
2019 5.03 3.02
2018 3.84 3.12
2017 3.29 2.95
2016 4.10 3.09
2015 3.20 3.15
(a) Source: Novagni Analytics and Advisory Sdn Bhd. (b) Malayan Banking Berhad 1-month fixed deposit rate (“MBB”)
(obtainable from www.aminvest.com / www.maybank2u.com.my) The Fund performance is calculated based on the net asset value per unit of the Fund. Average total return of the Fund and its benchmark for a period is computed based on the absolute return for that period annualised over one year. Note: Past performance is not necessarily indicative of future performance and that unit prices and investment returns may go down, as well as up.
Fund Performance
For the financial period under review, the Fund registered a return of 2.20% comprising of negative 0.39% capital growth and 2.59% income distribution. Thus, the Fund’s return of 2.20% has outperformed the benchmark’s return of 1.31% by 0.89%. As compared with the financial year ended 31 October 2019, the net asset value (“NAV”) per unit of the Fund decreased by 0.40% from RM0.6767 to RM0.6740, while units in circulation increased by 3.99% from 783,558,311 units to 814,835,874 units. The line chart below shows comparison between the annual performances of AmIncome Plus and its benchmark, MBB, for each of the financial years ended 31 October. (Forward)
4
Note: Past performance is not necessarily indicative of future performance and that unit prices and investment returns may go down, as well as up.
Strategies and Policies Employed
The Fund seeks to achieve its objective by investing primarily in short to medium-term fixed income instruments with the following minimum credit rating of short-term credit rating of P2 by RAM or long-term credit rating of A3 by RAM or its equivalent as rated by a local or global rating agency.
Portfolio Structure
The table below shows the asset allocation of the Fund for the financial period/year under review.
As at 30.4.2020
%
As at 31.10.2019
%
Changes
%
Corporate bonds 87.26 77.75 9.51
Government Securities - 1.92 -1.92
Money market deposit 5.59 5.68 -0.09
Cash, other assets & liabilities 7.15 14.65 -7.50
Total 100.00 100.00
For the financial period under review, the Fund has 87.26% of its NAV invested in corporate bonds, 5.59% in money market deposit while the remaining was in cash, other assets & liabilities.
Cross Trades
There were no cross trades undertaken during the financial period under review.
Distribution/ Unit Splits
During the financial period under review, the Fund declared income distributions, detailed as follows:
Date of distribution
Distribution per unit (sen)
NAV per unit Cum-Distribution
(RM)
NAV per unit Ex-Distribution
(RM)
21-Apr-20 1.75 0.6894 0.6719
There was no unit split declared for the financial period under review.

5
State of Affairs
There has been neither significant changes to the state of affairs of the Fund nor any circumstances that materially affect any interests of the unitholders during the financial period under review.
Rebates and Soft Commission
Soft commissions received from brokers/dealers are retained by the Manager only if the goods and services provided are in the form of research services that assist in the decision-making process relating to the Fund’s investments. During the financial period under review, the Manager had received on behalf of the Fund, soft commissions as allowed under regulatory requirements to carry out investment management functions for the Fund. These soft commissions received by the Manager are deemed to be beneficial to the unitholders of the Fund.
Market Review
In a move that was widely anticipated by the market, Bank Negara Malaysia (BNM) slashed the Overnight Policy Rate (OPR) by 50bps to the historical low of 2.00% at its 5 May meeting. This 3rd OPR cut in-a-row, bringing total OPR reduction year-to-date to a whopping 100bps. The policy action was a response to the gloomy economic growth outlook, which BNM had projected to be in the range of -2.0% to 0.5% for 2020 (latest MoF forecast is -3.0% to -4.0% for 2020 Gross Domestic Product (GDP)). The OPR last reached the low of 2.00% in the aftermath of the 2008-09 Global Financial Crisis (GFC). Along with the rate cuts, BNM had injected a total of MYR42b into the financial markets through a combination of outright government security purchases, reverse repos and Statutory Reserve Requirement (SRR) reduction (100bps cut to 2.00% effective 20 March 2020). Following the central bank’s May meeting, a further MYR16b was injected into the capital markets with banking institutions permitted to use Malaysia Government Securities (MGS) and Government Investment Issues (GIIs) holdings to meet statutory reserve requirements effective 16 May 2020 until 31 May 2021.
The MGS market responded to the policy move positively with MGS/GII yields closing 4-12bps lower following the OPR announcement. In the trading sessions that ensued, we saw some profit taking activities which pushed the MGS yields 4-10bps higher in the middle of the month, before the auction results, along with less-than-impressive economic data releases, re-ignited buying enthusiasm in the front end and belly of the curve. The 15-year GII and 10-year MGS auctions garnered bid-to-cover (BTC) ratio of 2.17x and 1.73x respectively, with continued support from real money investors onshore. Markets were relatively quiet with thinner liquidity towards the end of the month given Hari Raya festive season, and the MGS market ended the month with a steeper curve as the 3-10 year segment of the curve was 4-15bps lower MoM while the long end was 5-12bps higher.
The 1Q2020 GDP print of +0.7% YoY was an upside surprise (consensus: -0.1%; 4Q2019: +3.6%), but the bulk of the impact of Movement Control Order (MCO)-driven business disruption will only be reflected in the 2Q2020 GDP data. The April 2020 Consumer Price Index (CPI) saw sharp deflation of -2.9% YoY mainly resulting from record low fuel prices while core inflation remained unchanged at +1.30%. Headline Foreign Exchange (FX) reserves sustained at USD102.6b as at 15 May (30 April: USD102.5b); while the Malaysian Ringgit (MYR) closed the month weaker at 4.35 (end-April: 4.30).
In the corporate bonds space, Danum Capital’s (Khazanah’s funding vehicle) MYR2.0b issuance and DanaInfra Nasional’s MYR2.8b issuance dominated the total primary volume of MYR7.1b for the month. Credit spreads ended the month with tightening of 2-7bps in the 3 to 10-year segment of the yield curve while the longer end tightened by 5-15bps. Amidst thinner market trading during the Raya festive season, we continue to see good demand for higher-rated names and defensive credits in the secondary market.

6
Market Outlook
Bond market sentiments should remain positive due to BNM policy remaining dovish as growth risks are tilted to the downside in 2020 and into 1H2021 which would likely require further OPR cuts in 2020. The quantum of further cuts in OPR rate would depend on:
a) factors surrounding the COVID-19 pandemic as well as; and b) any restart of United States (US)-China and/or US-European Union (EU)
trade-tensions. Market liquidity remains ample and demand for fixed income instruments is expected to remain strong despite any concerns on MGS/GII supply. As we expect continued BNM easing to stimulate the economy, we will still maintain our overweight duration to express the expectations of further rate cuts and the fact that interest rates will remain low for the foreseeable future.
Additional Information
The following information has been updated: 1. Seohan Soo resigned as a Non-Independent, Non-Executive Director for
AmFunds Management Berhad with effect from 1st January 2020.
Kuala Lumpur, Malaysia AmFunds Management Berhad 17 June 2020

AmIncome Plus
CONDENSED STATEMENT OF FINANCIAL POSITION
AS AT 30 APRIL 2020
30.4.2020 31.10.2019
(unaudited) (audited)
Note RM RM
ASSETS
Investments 4 479,256,262 422,450,274
Amount due from Manager 5(a) 4,386,572 26,606,984
Deposits with financial institutions 6 30,708,822 30,132,904
Cash at banks 35,672,888 52,116,159
TOTAL ASSETS 550,024,544 531,306,321
LIABILITIES
Amount due to Manager 5(b) 748,818 993,281
Amount due to Trustee 7 31,133 27,468
Sundry payables and accrued expenses 15,648 19,365
TOTAL LIABILITIES 795,599 1,040,114
EQUITY
Unitholders’ capital 9(a) 453,351,733 431,647,468
Retained earnings 9(b)(c) 95,877,212 98,618,739
TOTAL EQUITY 9 549,228,945 530,266,207
TOTAL EQUITY AND LIABILITIES 550,024,544 531,306,321
UNITS IN CIRCULATION 9 814,835,874 783,558,311
NET ASSET VALUE (“NAV”) PER UNIT 67.40 sen 67.67 sen
The accompanying notes form an integral part of the financial statements.
7

AmIncome Plus
CONDENSED STATEMENT OF COMPREHENSIVE INCOME (Unaudited)
FOR THE FINANCIAL PERIOD FROM 1 NOVEMBER 2019 TO 30 APRIL 2020
1.11.2019 to 1.11.2018 to
30.4.2020 30.4.2019
Note RM RM
INVESTMENT INCOME
Interest income 11,565,234 11,950,032
Net income from investments:
− Financial assets at fair value through profit or
loss (“FVTPL”) 8 2,066,973 2,039,208
13,632,207 13,989,240
EXPENDITURE
Manager’s fee 5 (2,048,903) (1,952,713)
Trustee’s fee 7 (191,231) (182,253)
Auditors’ remuneration (4,226) (4,215)Tax agent’s fee (2,040) (2,033)
Custodian’s fee (80) (265)
Other expenses (890) (1,754)
(2,247,370) (2,143,233)
Net income before tax 11,384,837 11,846,007
Less: Income tax 11 - -
Net income after tax 11,384,837 11,846,007
Other comprehensive income - -
Total comprehensive income for thefinancial period 11,384,837 11,846,007
Total comprehensive income comprises the following:
Realised income 10,559,498 9,825,158
Unrealised gain 825,339 2,020,84911,384,837 11,846,007
Distribution for the financial period
Net distribution 12 14,126,364 12,671,951
Gross/net distribution per unit (sen) 12 1.75 1.75
The accompanying notes form an integral part of the financial statements.
8

AmIncome Plus
CONDENSED STATEMENT OF CHANGES IN EQUITY (Unaudited)
FOR THE FINANCIAL PERIOD FROM 1 NOVEMBER 2019 TO 30 APRIL 2020
Unitholders’ Retained Total
capital earnings equity
Note RM RM RM
At 1 November 2018 433,163,368 98,460,094 531,623,462
Total comprehensive income
for the financial period - 11,846,007 11,846,007
Creation of units 467,294,209 - 467,294,209
Reinvestments of distributions 12,671,951 - 12,671,951
Cancellation of units (512,141,396) - (512,141,396)
Distributions 12 - (12,671,951) (12,671,951)
Balance at 30 April 2019 400,988,132 97,634,150 498,622,282
At 1 November 2019 431,647,468 98,618,739 530,266,207
Total comprehensive income
for the financial period - 11,384,837 11,384,837
Creation of units 9(a) 372,296,094 - 372,296,094
Reinvestments of distributions 9(a) 14,126,364 - 14,126,364
Cancellation of units 9(a) (364,718,193) - (364,718,193)
Distributions 12 - (14,126,364) (14,126,364)
Balance at 30 April 2020 453,351,733 95,877,212 549,228,945
The accompanying notes form an integral part of the financial statements.
9

AmIncome Plus
CONDENSED STATEMENT OF CASH FLOWS (Unaudited)
FOR THE FINANCIAL PERIOD FROM 1 NOVEMBER 2019 TO 30 APRIL 2020
1.11.2019 to 1.11.2018 to
30.4.2020 30.4.2019
RM RM
CASH FLOWS FROM OPERATING AND
INVESTING ACTIVITIES
Proceeds from maturity/sale of investments 114,090,275 30,330,720
Interest received 11,429,726 12,858,201
Manager’s fee paid (2,041,964) (1,965,140)
Trustee’s fee paid (187,566) (186,611)
Tax agent’s fee paid - (4,100)
Custodian’s fee paid (80) (265)
Payments for other expenses (10,873) (10,512)
Purchase of investments (169,269,700) (52,469,400)
Net cash used in operating and investing activities (45,990,182) (11,447,107)
CASH FLOWS FROM FINANCING ACTIVITIES
Proceeds from creation of units 394,516,506 465,587,033
Payments for cancellation of units (364,969,595) (512,655,021)
Net cash generated from/(used in) financing activities 29,546,911 (47,067,988)
NET DECREASE IN CASH AND
CASH EQUIVALENTS (16,443,271) (58,515,095)
CASH AND CASH EQUIVALENTS AT
BEGINNING OF FINANCIAL PERIOD 52,116,159 95,055,984
CASH AND CASH EQUIVALENTS AT
END OF FINANCIAL PERIOD 35,672,888 36,540,889
Cash and cash equivalents comprise:
Cash at banks 35,672,888 36,540,889
The accompanying notes form an integral part of the financial statements.
10

AmIncome Plus
NOTES TO THE CONDENSED FINANCIAL STATEMENTSFOR THE FINANCIAL PERIOD FROM 1 NOVEMBER 2019 TO 30 APRIL 2020
1. GENERAL INFORMATION
2. BASIS OF PREPARATION OF FINANCIAL STATEMENTS
Standards effective during the financial period
Standards issued but not yet effective
AmIncome Plus (“the Fund”) was established pursuant to a Deed dated 30 October 2001 as
amended by Deeds Supplemental thereto (“the Deed”), between AmFunds Management
Berhad as the Manager, AmanahRaya Trustees Berhad as the Trustee and all unitholders.
The Fund which is a short to medium-term fixed income fund which aims to provide investors
with enhanced returns. As provided in the Deed, the “accrual period” or financial year shall end
on 31 October and the units in the Fund were first offered for sale on 26 November 2001.
Subsequently, the Fund was re-launched on 17 June 2004.
The financial statements were authorised for issue by the Chief Executive Officer of the
Manager on 17 June 2020.
The financial statements of the Fund have been prepared on a historical cost basis, except as
otherwise stated in the accounting policies and comply with Malaysian Financial Reporting
Standards 134: Interim Financial Reporting (“MFRS 134”) as issued by the Malaysian
Accounting Standards Board (“MASB”) and Securities Commission Malaysia’s Guidelines on
Unit Trust Funds in Malaysia.
The adoption of MFRS which have been effective during the financial period did not have any
material financial impact to the financial statements.
The Fund will adopt the following MFRSs and Amendments to MFRSs when they become
effective in the respective financial periods and these MFRSs and Amendments to MFRSs are
not expected to have any material impact to the financial statements of the Fund upon initial
application.
11

AmIncome Plus
NOTES TO THE CONDENSED FINANCIAL STATEMENTSFOR THE FINANCIAL PERIOD FROM 1 NOVEMBER 2019 TO 30 APRIL 2020
2. BASIS OF PREPARATION OF FINANCIAL STATEMENTS (CONT’D.)
Standards issued but not yet effective (cont’d.)
Effective for
financial periods
beginning on or after
Revised Conceptual Framework for Financial Reporting 1 January 2020
Amendments to MFRS 3 - Definition of a Business 1 January 2020
Amendments to MFRS 101 and MFRS 108 - Definition of Material 1 January 2020
Amendments to MFRS 7, MFRS 9 and MFRS 139 - 1 January 2020
Interest Rate Benchmark Reform
MFRS 17 Insurance Contracts 1 January 2021
Amendments to MFRS 10 and MFRS 128: Sale or Contribution Deferred
of Assets between an Investor and its Associate or Joint Venture
3. SUMMARY OF SIGNIFICANT ACCOUNTING POLICIES
3.1 Income recognition
(i) Interest income
(ii) Gain or loss on disposal of investments
Once the recorded value of a financial asset or a group of similar financial assets has
been reduced due to an impairment loss, profit income continues to be recognised
using the rate of profit used to discount the future cash flows for the purpose of
measuring the impairment loss.
On disposal of investments, the net realised gain or loss on disposal is measured as
the difference between the net disposal proceeds and the carrying amount of the
investments. The net realised gain or loss is recognised in profit or loss.
Income is recognised to the extent that it is probable that the economic benefits will flow to
the Fund and the income can be reliably measured. Income is measured at the fair value
of consideration received or receivable.
For all interest-bearing financial assets, interest income is calculated using the
effective interest method. Effective interest rate is the rate that exactly discounts
estimated future cash payments or receipts through the expected life of the financial
instrument or a shorter period, where appropriate, to the net carrying amount of the
financial asset. The calculation takes into account all contractual terms of the
financial instrument and includes any fees or incremental costs that are directly
attributable to the instrument and are an integral part of the effective interest rate, but
not future credit losses.
12

AmIncome Plus
NOTES TO THE CONDENSED FINANCIAL STATEMENTSFOR THE FINANCIAL PERIOD FROM 1 NOVEMBER 2019 TO 30 APRIL 2020
3. SUMMARY OF SIGNIFICANT ACCOUNTING POLICIES (CONT’D.)
3.2 Income tax
3.3 Functional and presentation currency
3.4 Statement of cash flows
The Fund adopts the direct method in the preparation of the statement of cash flows.
3.5 Distribution
3.6 Unitholders’ capital
Current taxes are recognised in profit or loss except to the extent that the tax relates to
items recognised outside profit or loss, either in other comprehensive income or directly in
equity.
Functional currency is the currency of the primary economic environment in which the
Fund operates that most faithfully represents the economic effects of the underlying
transactions. The functional currency of the Fund is Ringgit Malaysia (“RM”) which reflects
the currency in which the Fund competes for funds, issues and redeems units. The Fund
has also adopted RM as its presentation currency.
Current tax assets and liabilities are measured at the amount expected to be recovered
from or paid to the tax authorities. The tax rates and tax laws used to compute the amount
are those that are enacted or substantively enacted at the reporting date.
Cash equivalents are short-term, highly liquid investments that are readily convertible to
cash with insignificant risk of changes in value.
Distributions are at the discretion of the Fund. A distribution to the Fund’s unitholders is
accounted for as a deduction from realised income. A proposed distribution is recognised
as a liability in the period in which it is approved. Distribution is either reinvested or paid in
cash to the unitholders on the income payment date. Reinvestment of units is based on
the NAV per unit on the income payment date, which is also the time of creation.
The unitholders’ capital of the Fund meets the definition of puttable instruments and is
classified as equity instruments under MFRS 132 Financial Instruments: Presentation
(“MFRS 132”).
13

AmIncome Plus
NOTES TO THE CONDENSED FINANCIAL STATEMENTSFOR THE FINANCIAL PERIOD FROM 1 NOVEMBER 2019 TO 30 APRIL 2020
3. SUMMARY OF SIGNIFICANT ACCOUNTING POLICIES (CONT’D.)
3.7 Financial assets – initial recognition and measurement
(i) Initial recognition
(ii) Initial measurement
(iii) “Day 1” profit or loss
3.8 Financial assets – classification and subsequent measurement
Business model
Financial assets and financial liabilities are recognised when the Fund becomes a
party to the contractual provisions of the instrument. Regular way purchases and
sales of financial assets are recognised using trade date accounting or settlement
date accounting. The method used is applied consistently for all purchases and
sales of financial assets that belong to the same category of financial assets.
The business model reflects how the Fund manages the financial assets in order to
generate cash flows. That is, whether the Fund’s objective is solely to collect the
contractual cash flows from the assets, or is to collect both the contractual cash flows and
cash flows arising from the sale of assets. If neither of these is applicable (e.g. the
financial assets are held for trading purposes), then the financial assets are classified as
part of “other” business model. Factors considered by the Fund in determining the
business model for a portfolio of assets include past experience on how the cash flows for
these assets were collected, how the asset’s performance is evaluated and reported to
key management personnel, and how risks are assessed and managed.
All financial assets are recognised initially at fair value, in the case of financial assets
not recorded at FVTPL, transaction costs that are attributable to the acquisition of the
financial asset. All financial liabilities are recognised initially at fair value and, in the
case of financial liabilities not recorded at FVTPL, net of directly attributable
transaction costs.
At initial measurement, if the transaction price differs from the fair value, the Fund
immediately recognises the difference between the transaction price and fair value (a
“Day 1” profit or loss) in profit or loss provided that fair value is evidenced by a
quoted price in an active market for an identical asset or liability (i.e. Level 1 input) or
based on a valuation technique that uses only data from observable markets. In all
other cases, the difference between the transaction price and model value is
recognised in profit or loss on a systematic and rational basis that reflects the nature
of the instrument over its tenure.
The classification and subsequent measurement of debt instruments held by the Fund are
determined based on their business model and cash flow characteristics.
14

AmIncome Plus
NOTES TO THE CONDENSED FINANCIAL STATEMENTSFOR THE FINANCIAL PERIOD FROM 1 NOVEMBER 2019 TO 30 APRIL 2020
3. SUMMARY OF SIGNIFICANT ACCOUNTING POLICIES (CONT’D.)
3.8 Financial assets – classification and subsequent measurement (cont’d.)
Cash flow characteristics
3.9 Financial assets under MFRS 9
(i) Classification and measurement
The Fund may classify its financial assets under the following categories:
Financial assets at amortised cost
Where the business model is to hold the financial assets to collect contractual cash flows,
or to collect contractual cash flows and sell, the Fund assesses whether the financial
assets’ contractual cash flows represent solely payment of principal and interest (“SPPI”).
In making this assessment, the Fund considers whether the contractual cash flows are
consistent with a basic lending arrangement, i.e. interest includes only consideration for
time value of money, credit risk, other basic lending risks and a profit margin that is
consistent with a basic lending arrangement. Financial assets with embedded derivatives
are considered in their entirety when determining whether their cash flows are SPPI.
The classification of financial assets depends on the Fund’s business model of
managing the financial assets in order to generate cash flows (“business model test”)
and the contractual cash flow characteristics of the financial instruments (“SPPI
test”). The business model test determines whether cash flows will result from
collecting contractual cash flows, selling the financial assets, or both and the
assessment is performed on a portfolio basis. The SPPI test determines whether the
contractual cash flows are solely for payments of principal and interest and the
assessment is performed on a financial instrument basis.
A financial asset is measured at amortised cost if it is held within a business model
whose objective is to hold financial assets in order to collect contractual cash flows
and its contractual terms give rise on specified dates to cash flows that are solely
payments of principal and interest on the principal amount outstanding. The Fund
includes in this category deposits with financial institution, cash at banks, amounts
due from brokers/financial institutions, amount due from the Manager and other
receivables.
15

AmIncome Plus
NOTES TO THE CONDENSED FINANCIAL STATEMENTSFOR THE FINANCIAL PERIOD FROM 1 NOVEMBER 2019 TO 30 APRIL 2020
3. SUMMARY OF SIGNIFICANT ACCOUNTING POLICIES (CONT’D.)
3.9 Financial assets under MFRS 9 (cont’d.)
(i) Classification and measurement (cont’d.)
Financial assets at FVOCI
Financial assets at FVTPL
3.10 Financial liabilities – classification and subsequent measurement
Any financial assets that are not measured at amortised cost or FVOCI are
measured at FVTPL. Subsequent to initial recognition, financial assets at FVTPL are
measured at fair value. Changes in the fair value of those financial instruments are
recorded in “Net gain or loss on financial assets at FVTPL”. Interest earned element
of such instruments are recorded in “Interest income”.
A financial asset is measured at fair value through other comprehensive income
(“FVOCI”) if its business model is both to hold the asset to collect contractual cash
flows and to sell the financial asset. In addition, the contractual terms of the financial
assets give rise on specified dates to cash flows that are solely payments of principal
and interest on the outstanding principal.
These investments are initially recorded at fair value and transaction costs are
expensed in the profit or loss. Subsequent to initial recognition, these investments
are remeasured at fair value. All fair value adjustments are initially recognised
through OCI. Debt instruments at FVOCI are subject to impairment assessment.
Instruments that qualify for amortised cost or FVOCI may be irrevocably designated
as FVTPL, if doing so eliminates or significantly reduces a measurement or
recognition inconsistency. Equity instruments are normally measured at FVTPL,
nevertheless, the Fund is allowed to irrevocably designate equity instruments that are
not held for trading as FVOCI, with no subsequent reclassification of gains or losses
to profit or loss.
Financial liabilities issued by the Fund are classified as financial liabilities at amortised
cost, where the substance of the contractual arrangement results in the Fund having an
obligation either to deliver cash or another financial asset to the holder. After initial
measurement, financial liabilities are subsequently measured at amortised cost using the
effective interest method. Amortised cost is calculated by taking into account any discount
or premium on acquisition and fees or costs that are an integral part of the effective
interest rate.
16

AmIncome Plus
NOTES TO THE CONDENSED FINANCIAL STATEMENTSFOR THE FINANCIAL PERIOD FROM 1 NOVEMBER 2019 TO 30 APRIL 2020
3. SUMMARY OF SIGNIFICANT ACCOUNTING POLICIES (CONT’D.)
3.11 Derecognition of financial instruments
(i) Derecognition of financial asset
-
-
-
-
(ii) Derecognition of financial liability
3.12 Financial instruments – expected credit losses (“ECL”)
-
-
-
The Fund assesses on a forward-looking basis the ECL associated with its financial
assets at amortised cost. The Fund recognises a loss allowance for such losses at each
reporting date. The measurement of ECL reflects:
an unbiased and probability-weighted amount that is determined by evaluating a
range of possible outcomes;
the time value of money; and
The ECL in respect of financial assets at amortised cost, if any, is recognised in profit or
loss.
A financial asset (or, where applicable a part of a financial asset or part of a group of
similar financial assets) is derecognised when:
the rights to receive cash flows from the asset have expired, or
the Fund has transferred its rights to receive cash flows from the asset or has
assumed an obligation to pay the received cash flows in full without material delay
to a third party under a “pass-through” arrangement; and either:
the Fund has transferred substantially all the risks and rewards of the asset, or
the Fund has neither transferred nor retained substantially all the risks and
rewards of the asset, but has transferred control of the asset.
Financial assets together with the associated allowance are written off when it has
exhausted all practical recovery efforts and there is no realistic prospect of future
recovery. The Fund may also write-off financial assets that are still subject to enforcement
activity when there is no reasonable expectation of full recovery. If a write-off is later
recovered, the recovery is credited to profit or loss.
A financial liability is derecognised when the obligation under the liability is
discharged, cancelled or expired. Gains and losses are recognised in profit or loss
when the liabilities are recognised, and through the amortisation process.
reasonable and supportable information that is available without undue cost or effort
at the reporting date about past events, current conditions and forecasts of future
economic conditions.
17

AmIncome Plus
NOTES TO THE CONDENSED FINANCIAL STATEMENTSFOR THE FINANCIAL PERIOD FROM 1 NOVEMBER 2019 TO 30 APRIL 2020
3. SUMMARY OF SIGNIFICANT ACCOUNTING POLICIES (CONT’D.)
3.13 Determination of fair value
3.14 Classification of realised and unrealised gains and losses
3.15 Significant accounting estimates and judgments
Realised gains and losses on disposals of financial instruments classified at FVTPL are
calculated using the weighted average method. They represent the difference between an
instrument’s initial carrying amount and disposal amount.
The preparation of the Fund’s financial statements requires the Manager to make
judgments, estimates and assumptions that affect the reported amounts of revenues,
expenses, assets and liabilities, and the disclosure of contingent liabilities at the reporting
date. However, uncertainty about these assumptions and estimates could result in
outcomes that could require a material adjustment to the carrying amount of the asset or
liability in the future.
The Fund classifies its investments as financial assets at FVTPL as the Fund may sell its
investments in the short-term for profit-taking or to meet unitholders’ cancellation of units.
No major judgments have been made by the Manager in applying the Fund’s accounting
policies. There are no key assumptions concerning the future and other key sources of
estimation uncertainty at the reporting date, that have a significant risk of causing a
material adjustment to the carrying amounts of assets and liabilities within the next
financial period.
Unrealised gains and losses comprise changes in the fair value of financial instruments
for the period and from reversal of prior period’s unrealised gains and losses for financial
instruments which were realised (i.e. sold, redeemed or matured) during the reporting
period.
For investments in fixed income securities, nominal value is the face value of the
securities and fair value is determined based on the indicative prices from Bond Pricing
Agency Malaysia Sdn Bhd plus accrued interest, which includes the accretion of discount
and amortisation of premium. Adjusted cost of investments relates to the purchase cost
plus accrued interest, adjusted for amortisation of premium and accretion of discount, if
any, calculated over the period for the date of acquisition to the date of maturity of the
respective securities as approved by the Manager and the Trustee. The difference
between adjusted cost and fair value is treated as unrealised gain or loss and is
recognised in profit or loss. Unrealised gains or losses recognised in profit or loss are not
distributable in nature.
18
AmIncome Plus
NOTES TO THE CONDENSED FINANCIAL STATEMENTSFOR THE FINANCIAL PERIOD FROM 1 NOVEMBER 2019 TO 30 APRIL 2020
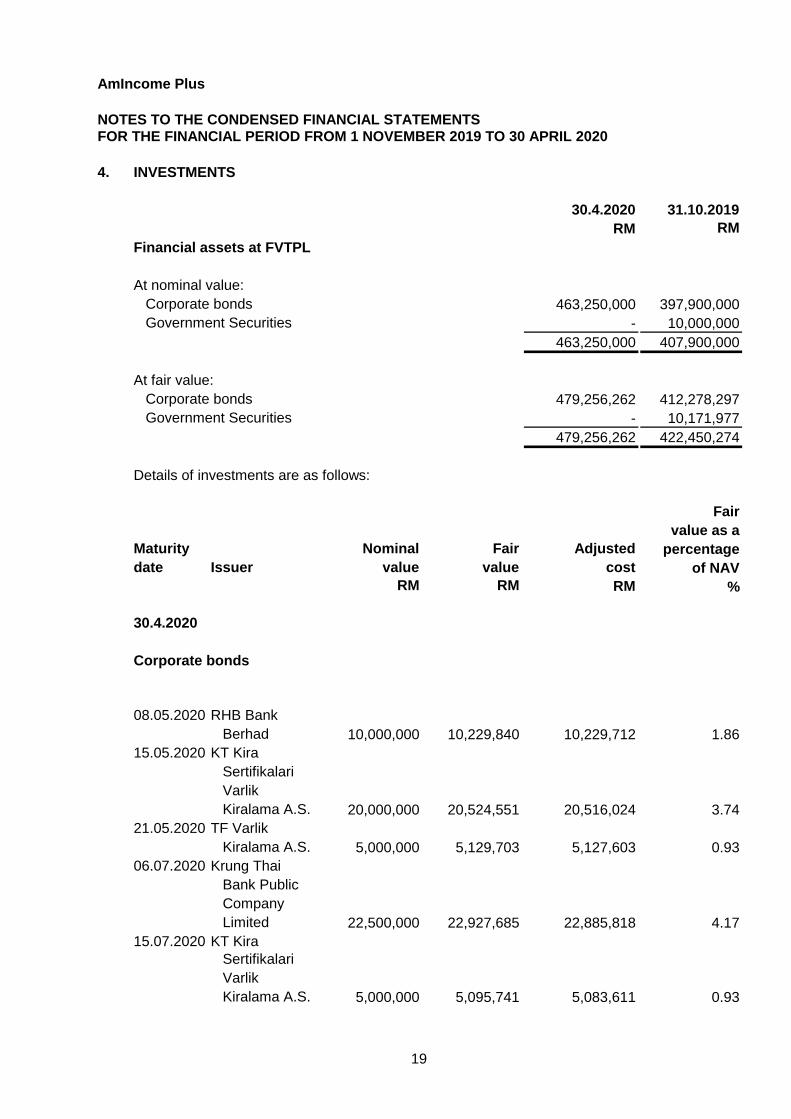
4. INVESTMENTS
30.4.2020 31.10.2019
RM RM
Financial assets at FVTPL
At nominal value:
Corporate bonds 463,250,000 397,900,000
Government Securities - 10,000,000
463,250,000 407,900,000
At fair value:
Corporate bonds 479,256,262 412,278,297
Government Securities - 10,171,977
479,256,262 422,450,274
Details of investments are as follows:
Fair
value as a
Nominal Fair Adjusted percentage
Issuer value value cost of NAV
RM RM RM %
30.4.2020
Corporate bonds
08.05.2020 RHB Bank
Berhad 10,000,000 10,229,840 10,229,712 1.86
15.05.2020 KT Kira
Sertifikalari
Varlik
Kiralama A.S. 20,000,000 20,524,551 20,516,024 3.74
21.05.2020 TF Varlik
Kiralama A.S. 5,000,000 5,129,703 5,127,603 0.93
06.07.2020 Krung Thai
Bank Public
Company
Limited 22,500,000 22,927,685 22,885,818 4.17
15.07.2020 KT Kira
Sertifikalari
Varlik
Kiralama A.S. 5,000,000 5,095,741 5,083,611 0.93
Maturity
date
19

AmIncome Plus
NOTES TO THE CONDENSED FINANCIAL STATEMENTSFOR THE FINANCIAL PERIOD FROM 1 NOVEMBER 2019 TO 30 APRIL 2020
4. INVESTMENTS (CONT’D.)
Fair
value as a
Nominal Fair Adjusted percentage
Issuer value value cost of NAV
RM RM RM %
30.4.2020 (cont’d.)
Corporate bonds (cont’d.)
19.11.2020 Special
Power
Vehicle
Berhad 5,000,000 5,997,259 5,992,017 1.09
11.12.2020 UEM Sunrise
Berhad 10,000,000 10,295,340 10,190,105 1.87
25.05.2021 CIMB Group
Holdings
Berhad 10,000,000 10,488,068 10,277,502 1.91
27.10.2021 First Resources
Limited 9,800,000 10,032,765 9,843,035 1.83
28.10.2021 Celcom Networks
Sdn Bhd 4,000,000 4,106,075 4,007,981 0.75
29.10.2021 UEM Sunrise
Berhad 5,000,000 5,124,864 5,004,961 0.93
31.03.2022 GENM Capital
Berhad 5,000,000 5,156,849 5,028,873 0.94
25.04.2022 Public Bank
Berhad 20,000,000 20,631,830 20,082,597 3.76
28.04.2022 Sabah
Development
Bank Berhad 10,000,000 10,390,956 10,082,998 1.89
10.06.2022 YTL Power
International
Berhad 10,000,000 10,430,214 10,448,166 1.90
30.06.2022 Sports Toto
Malaysia
Sdn Bhd 10,000,000 10,332,096 10,174,641 1.88
29.08.2022 Celcom
Networks
Sdn Bhd 5,000,000 5,234,606 5,052,494 0.95
20.09.2022 Affin Bank
Berhad 4,000,000 4,149,392 4,143,472 0.75
27.09.2022 RHB Bank
Berhad 10,000,000 10,357,219 10,258,058 1.89
Maturity
date
20

AmIncome Plus
NOTES TO THE CONDENSED FINANCIAL STATEMENTSFOR THE FINANCIAL PERIOD FROM 1 NOVEMBER 2019 TO 30 APRIL 2020
4. INVESTMENTS (CONT’D.)
Fair
value as a
Nominal Fair Adjusted percentage
Issuer value value cost of NAV
RM RM RM %
30.4.2020 (cont’d.)
Corporate bonds (cont’d.)
06.10.2022 Danajamin
Nasional
Berhad 5,000,000 5,182,538 5,031,215 0.94
14.11.2022 Bank Islam
Malaysia
Berhad 12,000,000 12,722,283 12,314,830 2.32
30.11.2022 Hong Leong
Financial
Group Berhad 5,000,000 5,289,431 5,124,391 0.96
13.01.2023 Kedah Cement
Sdn Bhd 30,000,000 30,825,210 30,423,827 5.61
23.02.2023 AmBank (M)
Berhad* 5,000,000 5,293,870 5,256,623 0.96
24.03.2023 YTL Power
International
Berhad 5,000,000 5,175,208 5,194,447 0.94
29.03.2023 CIMB Thai
Bank Public
Company
Limited 10,000,000 10,421,089 10,380,442 1.90
26.06.2023 Hong Leong
Financial
Group Berhad 5,000,000 5,300,468 5,085,768 0.96
11.07.2023 GENM Capital
Berhad 10,000,000 10,631,618 10,196,957 1.94
25.07.2023 United Overseas
Bank (Malaysia)
Berhad 9,000,000 9,499,965 9,117,899 1.73
23.10.2023 CIMB Group
Holdings
Berhad 28,500,000 29,960,726 28,857,272 5.45
31.10.2023 UEM Sunrise
Berhad 5,000,000 5,246,932 5,009,628 0.96
Maturity
date
21

AmIncome Plus
NOTES TO THE CONDENSED FINANCIAL STATEMENTSFOR THE FINANCIAL PERIOD FROM 1 NOVEMBER 2019 TO 30 APRIL 2020
4. INVESTMENTS (CONT’D.)
Fair
value as a
Nominal Fair Adjusted percentage
Issuer value value cost of NAV
RM RM RM %
30.4.2020 (cont’d.)
Corporate bonds (cont’d.)
29.03.2024 Hong Leong
Financial
Group
Berhad 10,000,000 10,358,958 10,042,257 1.89
24.04.2024 Sabah
Development
Bank Berhad 7,000,000 7,465,475 7,021,251 1.36
28.06.2024 CIMB Group
Holdings
Berhad 5,000,000 5,251,325 5,082,225 0.96
22.07.2024 Bumitama
Agri Ltd 9,700,000 10,042,923 9,808,959 1.83
25.09.2024 Malayan
Banking
Berhad 23,000,000 23,536,725 23,095,125 4.29
12.12.2024 DRB-Hicom
Berhad 23,500,000 23,545,278 23,913,053 4.29
20.12.2024 MBSB Bank
Berhad 10,000,000 10,402,514 10,185,680 1.89
21.02.2025 Danum Capital
Berhad 18,500,000 18,655,172 18,608,922 3.40
27.02.2025 Toyota Capital
Malaysia
Sdn Bhd 34,000,000 34,922,839 34,664,462 6.36
27.02.2025 TG Excellence
Berhad 2,750,000 2,795,254 2,769,047 0.51
25.02.2027 Prasarana
Malaysia
Berhad 10,000,000 10,095,408 10,054,608 1.84
Total corporate bonds 463,250,000 479,256,262 471,668,556 87.26
Total financial assets at FVTPL 479,256,262 471,668,556 87.26
Excess of fair value over adjusted cost 7,587,706
date
Maturity
22

AmIncome Plus
NOTES TO THE CONDENSED FINANCIAL STATEMENTSFOR THE FINANCIAL PERIOD FROM 1 NOVEMBER 2019 TO 30 APRIL 2020
4. INVESTMENTS (CONT’D.)
Fair
value as a
Nominal Fair Adjusted percentage
Issuer value value cost of NAV
RM RM RM %
31.10.2019
Corporate bonds
12.11.2019 Jimah Energy
Ventures
Sdn Bhd 3,000,000 3,135,704 3,134,840 0.59
30.12.2019 DRB-Hicom
Berhad 5,000,000 5,159,402 5,156,726 0.97
07.02.2020 Hong Leong
Assurance
Berhad 5,000,000 5,063,414 5,050,138 0.96
31.03.2020 KT Kira
Sertifikalari
Varlik
Kiralama A.S. 1,000,000 1,009,575 1,005,085 0.19
03.04.2020 CIMB Group
Holdings
Berhad 32,700,000 33,167,915 33,047,472 6.25
16.04.2020 RHB Investment
Bank Berhad 5,000,000 5,037,599 5,036,221 0.95
08.05.2020 RHB Bank
Berhad 15,000,000 15,424,714 15,420,897 2.91
15.05.2020 KT Kira
Sertifikalari
Varlik
Kiralama A.S. 20,000,000 20,639,822 20,533,200 3.89
21.05.2020 TF Varlik
Kiralama A.S. 5,000,000 5,142,278 5,129,178 0.97
06.07.2020 Krung Thai
Bank Public
Company
Limited 22,500,000 23,031,860 22,951,197 4.34
15.07.2020 KT Kira
Sertifikalari
Varlik
Kiralama A.S. 5,000,000 5,119,508 5,087,358 0.97
19.11.2020 Special Power
Vehicle Berhad 5,000,000 6,435,459 6,429,187 1.21
Maturity
date
23

AmIncome Plus
NOTES TO THE CONDENSED FINANCIAL STATEMENTSFOR THE FINANCIAL PERIOD FROM 1 NOVEMBER 2019 TO 30 APRIL 2020
4. INVESTMENTS (CONT’D.)
Fair
value as a
Nominal Fair Adjusted percentage
Issuer value value cost of NAV
RM RM RM %
31.10.2019 (cont’d.)
Corporate bonds (cont’d.)
11.12.2020 UEM Sunrise
Berhad 10,000,000 10,334,055 10,194,476 1.95
25.05.2021 CIMB Group
Holdings
Berhad 10,000,000 10,521,268 10,289,539 1.98
29.06.2021 DRB-Hicom
Berhad 5,200,000 5,484,117 5,321,626 1.04
27.10.2021 First Resources
Limited 9,800,000 10,010,589 9,853,858 1.89
28.10.2021 Celcom Networks
Sdn Bhd 4,000,000 4,103,995 4,010,020 0.77
29.10.2021 UEM Sunrise
Berhad 5,000,000 5,128,164 5,006,326 0.97
31.03.2022 GENM Capital
Berhad 5,000,000 5,154,003 5,031,673 0.97
25.04.2022 Public Bank
Berhad 20,000,000 20,596,603 20,107,470 3.88
28.04.2022 Sabah
Development
Bank Berhad 10,000,000 10,377,556 10,101,522 1.96
22.06.2022 UMW Holdings
Berhad 2,000,000 2,095,305 2,045,192 0.40
30.06.2022 Sports Toto
Malaysia
Sdn Bhd 10,000,000 10,241,781 10,180,372 1.93
29.08.2022 Celcom Networks
Sdn Bhd 5,000,000 5,215,671 5,055,344 0.98
06.10.2022 Danajamin
Nasional
Berhad 10,000,000 10,289,477 10,065,682 1.94
11.10.2022 Edra Solar
Sdn Bhd 3,500,000 3,506,156 3,508,256 0.66
14.11.2022 Bank Islam
Malaysia
Berhad 12,000,000 12,731,744 12,323,830 2.40
Maturity
date
24

AmIncome Plus
NOTES TO THE CONDENSED FINANCIAL STATEMENTSFOR THE FINANCIAL PERIOD FROM 1 NOVEMBER 2019 TO 30 APRIL 2020
4. INVESTMENTS (CONT’D.)
Fair
value as a
Nominal Fair Adjusted percentage
Issuer value value cost of NAV
RM RM RM %
31.10.2019 (cont’d.)
Corporate bonds (cont’d.)
30.11.2022 Hong Leong
Financial Group
Berhad 5,000,000 5,271,848 5,127,658 0.99
29.03.2023 CIMB Thai
Bank Public
Company
Limited 10,000,000 10,457,489 10,434,089 1.97
26.06.2023 Hong Leong
Financial
Group Berhad 5,000,000 5,266,169 5,087,119 0.99
11.07.2023 GENM Capital
Berhad 10,000,000 10,581,975 10,211,264 2.00
25.07.2023 United Overseas
Bank (Malaysia)
Berhad 9,000,000 9,397,163 9,126,265 1.77
28.09.2023 BGSM
Management
Sdn Bhd 5,000,000 5,170,297 5,023,705 0.98
18.10.2023 AmBank Islamic
Berhad* 5,000,000 5,181,809 5,009,359 0.98
23.10.2023 CIMB Group
Holdings
Berhad 28,500,000 29,764,588 28,903,510 5.61
31.10.2023 UEM Sunrise
Berhad 5,000,000 5,230,732 5,010,788 0.99
15.11.2023 AmBank (M)
Berhad* 10,000,000 10,577,645 10,231,945 2.00
27.12.2023 BGSM
Management
Sdn Bhd 5,000,000 5,425,058 5,277,327 1.02
29.03.2024 Hong Leong
Financial
Group Berhad 10,000,000 10,260,058 10,042,257 1.94
24.04.2024 Sabah
Development
Bank Berhad 7,000,000 7,359,322 7,023,831 1.39
date
Maturity
25

AmIncome Plus
NOTES TO THE CONDENSED FINANCIAL STATEMENTSFOR THE FINANCIAL PERIOD FROM 1 NOVEMBER 2019 TO 30 APRIL 2020
4. INVESTMENTS (CONT’D.)
Fair
value as a Nominal Fair Adjusted percentage
Issuer value value cost of NAV RM RM RM %
31.10.2019 (cont’d.)
Corporate bonds (cont’d.)
28.06.2024 CIMB Group
Holdings
Berhad 5,000,000 5,205,880 5,084,230 0.98
22.07.2024 Bumitama
Agri Ltd 9,700,000 9,922,785 9,811,138 1.87
25.09.2024 Malayan
Banking
Berhad 23,000,000 23,047,745 23,095,125 4.35Total corporate bonds 397,900,000 412,278,297 405,576,295 77.75
Government Securities
15.10.2024 Government
of Malaysia 10,000,000 10,171,977 10,111,612 1.92
Total GovernmentSecurities 10,000,000 10,171,977 10,111,612 1.92
Total financial assets at
FVTPL 407,900,000 422,450,274 415,687,907 79.67
Excess of fair value over adjusted cost 6,762,367
* Financial institutions related to the Manager
5. AMOUNT DUE FROM/TO MANAGER
30.4.2020 31.10.2019
Note RM RM
(a) Due from ManagerCreation of units (i) 4,386,572 26,606,984
(b) Due to Manager
Redemption of units (ii) 370,694 622,096
Manager’s fee payable (iii) 378,124 371,185
748,818 993,281
Maturity
date
26

AmIncome Plus
NOTES TO THE CONDENSED FINANCIAL STATEMENTSFOR THE FINANCIAL PERIOD FROM 1 NOVEMBER 2019 TO 30 APRIL 2020
5. AMOUNT DUE FROM/TO MANAGER (CONT’D.)
(i)
(ii)
(iii)
6. DEPOSITS WITH FINANCIAL INSTITUTIONS
30.4.2020 31.10.2019
RM RM
At nominal value:Fixed deposits with licensed banks 30,000,000 30,000,000
At carrying value:Fixed deposits with licensed banks 30,708,822 30,132,904
Details of deposits with financial institutions are as follows:
Carrying
value as a
Nominal Carrying Purchased percentage Maturity value value cost of NAV date Bank RM RM RM %
30.4.2020
Fixed deposits with
licensed banks
Public Bank
Berhad 15,000,000 15,321,185 15,000,000 2.79
Public Bank
Berhad 15,000,000 15,387,637 15,000,000 2.80
30,000,000 30,708,822 30,000,000 5.59
The amount represents amount payable to the Manager for units redeemed.
10.07.2020
28.08.2020
Manager’s fee is at a rate of 0.75% (2019: 0.75%) per annum on the NAV of the Fund,
calculated on a daily basis.
The normal credit period in the previous financial year and current financial period for
Manager’s fee payable is one month.
The amount represents amount receivable from the Manager for units created.
The normal credit period in the previous financial year and current financial period for
creation and redemption of units is three business days.
27

AmIncome Plus
NOTES TO THE CONDENSED FINANCIAL STATEMENTSFOR THE FINANCIAL PERIOD FROM 1 NOVEMBER 2019 TO 30 APRIL 2020
6. DEPOSITS WITH FINANCIAL INSTITUTIONS (CONT’D.)
Carrying
value as a
Nominal Carrying Purchased percentage Maturity value value cost of NAV date Bank RM RM RM %
31.10.2019
Fixed deposits with
licensed banks
Public Bank
Berhad 15,000,000 15,033,226 15,000,000 2.84
Public Bank
Berhad 15,000,000 15,099,678 15,000,000 2.84
30,000,000 30,132,904 30,000,000 5.68
7. AMOUNT DUE TO TRUSTEE
8. NET GAIN FROM INVESTMENTS
1.11.2019 to 1.11.2018 to
30.4.2020 30.4.2019
RM RM
Net gain on financial assets at FVTPL comprised:
− Net realised gain on sale of investments 1,241,634 18,359
− Net unrealised gain on changes in fair values of
investments 825,339 2,020,849
2,066,973 2,039,208
28.08.2020
10.07.2020
The normal credit period in the previous financial year and current financial period for Trustee’s
fee payable is one month.
Trustee’s fee is at a rate of 0.07% (2019: 0.07%) per annum on the NAV of the Fund,
calculated on a daily basis.
28

AmIncome Plus
NOTES TO THE CONDENSED FINANCIAL STATEMENTSFOR THE FINANCIAL PERIOD FROM 1 NOVEMBER 2019 TO 30 APRIL 2020
9. TOTAL EQUITY
Total equity is represented by:
30.4.2020 31.10.2019
Note RM RM
Unitholders’ capital (a) 453,351,733 431,647,468
Retained earnings
─ Realised income (b) 88,289,506 91,856,372
─ Unrealised gain (c) 7,587,706 6,762,367
549,228,945 530,266,207
(a)
30.4.2020 31.10.2019
Number of Number of
units RM units RM
At beginning of the
financial period/year 783,558,311 431,647,468 783,953,256 433,163,368
Creation during the
financial period/year 544,844,712 372,296,094 1,257,142,953 861,123,761
Distributions reinvested 21,024,503 14,126,364 37,549,223 25,383,289
Cancellation during the
financial period/year (534,591,652) (364,718,193) (1,295,087,121) (888,022,950)
At end of the financial period/year 814,835,874 453,351,733 783,558,311 431,647,468
(b) Realised – distributable
30.4.2020 31.10.2019
RM RM
At beginning of the financial period/year 91,856,372 97,407,879
Net realised income for the financial period/year 10,559,498 19,831,782
Distributions out of realised income (14,126,364) (25,383,289)At end of the financial period/year 88,289,506 91,856,372
(c) Unrealised – non-distributable
30.4.2020 31.10.2019
RM RM
At beginning of the financial period/year 6,762,367 1,052,215
Net unrealised gain for the financial period/year 825,339 5,710,152At end of the financial period/year 7,587,706 6,762,367
Unitholders’ capital/units in circulation
29

AmIncome Plus
NOTES TO THE CONDENSED FINANCIAL STATEMENTSFOR THE FINANCIAL PERIOD FROM 1 NOVEMBER 2019 TO 30 APRIL 2020
10. UNITS HELD BY RELATED PARTIES
The related parties and their relationships with the Fund are as follows:
Related parties Relationship
AmFunds Management Berhad The Manager
AmInvestment Bank Berhad Holdings company of the Manager
AMMB Holdings Berhad Ultimate holding company of the Manager
Subsidiaries and associates of AMMB Subsidiaries and associate companies of the
as disclosed in its financial statements ultimate holding company of the Manager
11. INCOME TAX
1.11.2019 to 1.11.2018 to
30.4.2020 30.4.2019
RM RM
Net income before tax 11,384,837 11,846,007
Taxation at Malaysian statutory rate of 24% (2019: 24%) 2,732,361 2,843,042
Tax effects of:
Income not subject to tax (3,271,730) (3,357,418)
Restriction on tax deductible expenses for unit trust fund 443,476 423,075
Non-permitted expenses for tax purposes 46,618 44,292
Permitted expenses not used and not available for future
49,275 47,009Tax expense for the financial period - -
financial periods
Pursuant to Schedule 6 of the Income Tax Act, 1967, provided that the exemption shall not
apply to the interest paid on credited to a unit trust that is a wholesale fund which is a money
market fund. Interest income earned by Funds other than wholesale money market fund is
exempted from tax.
A reconciliation of income tax expense applicable to net income before tax at the statutory
income tax rate to income tax expense at the effective income tax rate of the Fund is as
follows:
Income tax payable is calculated on investment income less deduction for permitted expenses
as provided for under Section 63B of the Income Tax Act, 1967.
There were no units held by the Manager or any related party as at 30 April 2020 and 31
October 2019.
30

AmIncome Plus
NOTES TO THE CONDENSED FINANCIAL STATEMENTSFOR THE FINANCIAL PERIOD FROM 1 NOVEMBER 2019 TO 30 APRIL 2020
12. DISTRIBUTION
1.11.2019 to 1.11.2018 to
30.4.2020 30.4.2019
RM RM
Undistributed net income brought forward 3,566,866 2,846,793
Interest income 11,565,234 11,950,032
Net realised gain on sale of investments 1,241,634 18,359
16,373,734 14,815,184
Less: Expenses (2,247,370) (2,143,233)
Total amount of distributions 14,126,364 12,671,951
Gross/net distributions per unit (sen) 1.75 1.75
Distributions made out of:
– Realised income 14,126,364 12,671,951
Comprising:
Distributions reinvested 14,126,364 12,671,951
13. MANAGEMENT EXPENSE RATIO (“MER”)
The Fund’s MER is as follows:
1.11.2019 to 1.11.2018 to
30.4.2020 30.4.2019
% p.a. % p.a.
Manager’s fee 0.75 0.75
Trustee’s fee 0.07 0.07
Fund’s other expenses -* -*
Total MER 0.82 0.82
* represents less than 0.01%
The MER of the Fund is the ratio of the sum of annualised fees and expenses incurred by the
Fund to the average NAV of the Fund calculated on a daily basis.
Distributions to unitholders declared on 21 April 2020 (declared on 24 April 2019 for the
previous financial period) are from the following sources:
Included in the distributions for the financial period ended 30 April 2020 was RM3,566,866
(2019: RM2,846,793) distributed from previous financial period’ realised income.
31

AmIncome Plus
NOTES TO THE CONDENSED FINANCIAL STATEMENTS
FOR THE FINANCIAL PERIOD FROM 1 NOVEMBER 2019 TO 30 APRIL 2020
14. PORTFOLIO TURNOVER RATIO (“PTR”)
15. SEGMENTAL REPORTING
16. TRANSACTIONS WITH FINANCIAL INSTITUTIONS
Financial institutions Transaction value
RM %
AmBank (M) Berhad* 84,932,320 32.32
CIMB Bank Berhad 72,101,758 27.44
Standard Chartered Bank Malaysia Berhad 47,328,415 18.01
RHB Investment Bank Berhad 32,977,075 12.55
Malayan Banking Berhad 11,331,727 4.31
AmInvestment Bank Berhad* 10,491,224 3.99
Hong Leong Bank Berhad 3,589,389 1.38
Total 262,751,908 100.00
*
The PTR of the Fund, which is the ratio of average total acquisitions and disposals of
investments to the average NAV of the Fund calculated on a daily basis, is 0.26 times (2019:
0.08 times).
In accordance with the objective of the Fund, substantially all of the Fund’s investments are
made in the form of fixed income securities in Malaysia. The Manager is of the opinion that
the risk and rewards from these investments are not individually or segmentally distinct and
hence the Fund does not have a separately identifiable business or geographical segments.
Details of transactions with financial institutions for the financial period ended 30 April 2020
are as follows:
Financial institutions related to the Manager. The Manager is of the opinion that the
above transactions have been entered in the normal course of business and have been
established under terms that are no less favourable than those arranged with
independent third parties.
The above transactions were in respect of fixed income instruments. Transactions in these
investments do not involve any commission or brokerage.
32

AmIncome Plus
NOTES TO THE CONDENSED FINANCIAL STATEMENTS
FOR THE FINANCIAL PERIOD FROM 1 NOVEMBER 2019 TO 30 APRIL 2020
17. FINANCIAL RISK MANAGEMENT OBJECTIVES AND POLICIES
(a) Market risk
(i) Interest rate risk
(b) Credit risk
Risk management is carried out by closely monitoring, measuring and mitigating the above
said risks, careful selection of investments coupled with stringent compliance to investments
restrictions as stipulated by the Capital Market and Services Act 2007, Securities
Commission’s Guidelines on Unit Trust Funds and the Deed as the backbone of risk
management of the Fund.
The Fund is exposed to a variety of risks that include market risk, credit risk, liquidity risk,
single issuer risk, regulatory risk, management risk and non-compliance risk.
Market risk, in general, is the risk that the value of a portfolio would decrease due to
changes in market risk factors such as equity prices, interest rates (yield curve), foreign
exchange rates and commodity prices.
Interest rate risk will affect the value of the Fund’s investments, given the interest
rates movements, which are influenced by regional and local economic
developments as well as political developments.
Domestic interest rates on deposits and placements with licensed financial
institutions are determined based on prevailing market rates.
Credit risk is the risk that the counterparty to a financial instrument will cause a financial
loss to the Fund by failing to discharge an obligation. The Fund is exposed to the risk of
bond issuers and financial institutions defaulting on their repayment obligations which in
turn would affect the NAV of the Fund.
For deposit with financial institution, the Fund makes placements with financial
institutions with sound rating of P1/MARC-1 and above. Cash at banks are held for
liquidity purposes and are not exposed to significant credit risk.
33

AmIncome Plus
NOTES TO THE CONDENSED FINANCIAL STATEMENTS
FOR THE FINANCIAL PERIOD FROM 1 NOVEMBER 2019 TO 30 APRIL 2020
17. FINANCIAL RISK MANAGEMENT OBJECTIVES AND POLICIES (CONT’D.)
(c) Liquidity risk
(d) Single issuer risk
(e) Regulatory risk
(f) Management risk
(g) Non-compliance risk
Internal policy restricts the Fund from investing in securities issued by any issuer of not
more than a certain percentage of its NAV. Under such restriction, the risk exposure to
the securities of any single issuer is diversified and managed based on internal/external
ratings.
Any changes in national policies and regulations may have effects on the capital market
and the NAV of the Fund.
This is the risk of the Manager, the Trustee or the Fund not complying with internal
policies, the Deed of the Fund, securities law or guidelines issued by the regulators. Non-
compliance risk may adversely affect the investments of the Fund when the Fund is
forced to rectify the non-compliance.
Liquidity risk is defined as the risk that the Fund will encounter difficulty in meeting
obligations associated with financial liabilities that are settled by delivering cash or
another financial asset. Exposure to liquidity risk arises because of the possibility that the
Fund could be required to pay its liabilities or redeem its units earlier than expected. The
Fund maintains sufficient level of liquid assets, after consultation with the Trustee, to
meet anticipated payments and cancellations of units by unitholders. Liquid assets
comprise of deposits with licensed financial institutions and other instruments, which are
capable of being converted into cash within 5 to 7 days. The Fund’s policy is to always
maintain a prudent level of liquid assets so as to reduce liquidity risk.
Poor management of the Fund may cause considerable losses to the Fund that in turn
may affect the NAV of the Fund.
34

AmIncome Plus
STATEMENT BY THE MANAGER
For and on behalf of the Manager
GOH WEE PENG
Chief Executive Officer
Kuala Lumpur, Malaysia
17 June 2020
I, Goh Wee Peng, for and on behalf of the Manager, AmFunds Management Berhad, for
AmIncome Plus (the “Fund”) do hereby state that in the opinion of the Manager, the
accompanying condensed statement of financial position, condensed statement of
comprehensive income, condensed statement of changes in equity, condensed statement of
cash flows and the accompanying notes are drawn up in accordance with Malaysian Financial
Reporting Standards so as to give a true and fair view of the financial position of the Fund as at
30 April 2020 and the comprehensive income, the changes in equity and cash flows of the Fund
for the half year then ended.
AmFunds Management Berhad
35

Trustee’s Report
For the Six Months Financial Period Ended 30 April 2020
To the Unit Holders of
AMINCOME PLUS
We are also of the opinion that:
(a)
(b)
(c)
Yours faithfully
AMANAHRAYA TRUSTEES BERHAD
Kuala Lumpur, Malaysia
Deputy Chief Executive Officer
17 June 2020
We, AMANAHRAYA TRUSTEES BERHAD, have acted as Trustee of AMINCOME PLUS for
the six months financial period ended 30 April 2020. In our opinion, AMFUNDS
MANAGEMENT BERHAD, the Manager, has operated and managed AMINCOME PLUS in
accordance with the limitations imposed on the investment powers of the management
company under the Deed, securities laws and the applicable Guidelines on Unit Trust Funds
for the six months financial period ended 30 April 2020.
Valuation and pricing is carried out in accordance with the Deed and any regulatory
requirement;
Creation and cancellation of units are carried out in accordance with the Deed and any
regulatory requirement; and
The distribution of income made by AMINCOME PLUS as declared by the Manager is
appropriate and reflects the investment objective of AMINCOME PLUS.
ZAINUDIN BIN SUHAIMI
36

37
DIRECTORY Head Office 9th & 10th Floor, Bangunan AmBank Group 55, Jalan Raja Chulan, 50200 Kuala Lumpur Tel: (03) 2032 2888 Facsimile: (03) 2031 5210 Email: [email protected] Postal Address AmFunds Management Berhad P.O Box 13611, 50816 Kuala Lumpur
For enquiries about this or any of the other Funds offered by AmFunds Management Berhad Please call 2032 2888 between 8.45 a.m. to 5.45 p.m. (Monday to Thursday),
Friday (8.45 a.m. to 5.00 p.m.)