Embed Size (px)
Citation preview

1
Semantic fluency in deaf children who use spoken and signed language, in comparison to
hearing peers
Chloë Marshall1, Anna Jones, Ambra Fastelli, Joanne Atkinson, Nicola Botting, Gary Morgan
1Corresponding author: UCL Institute of Education, University College London, London, UK.
Final version accepted 27th May 2017 for publication in the International Journal of
Language and Communication Disorders
DOI: 10.1111/1460-6984.12333
Key words: deaf, semantic fluency, vocabulary, lexicon, executive functions, British sign
language
Declaration of interest: The authors report no conflicts of interest. The authors alone are
responsible for the content and writing of the paper.

2
Abstract
Background
Deafness has an adverse impact on children’s ability to acquire spoken languages. Signed
languages offer a more accessible input for deaf children, but because the vast majority are
born to hearing parents who do not sign, their early exposure to sign language is limited.
Deaf children as a whole are therefore at high risk of language delays.
Aims
We compared deaf and hearing children’s performance on a semantic fluency task. Optimal
performance on this task requires a systematic search of the mental lexicon, the retrieval of
words within a subcategory, and, when that subcategory is exhausted, switching to a new
subcategory. We compared retrieval patterns between groups, and also compared the
responses of deaf children who used British Sign Language (BSL) to those who used spoken
English. We investigated how semantic fluency performance related to children’s expressive
vocabulary and executive function skills, and also re-tested semantic fluency in the majority
of the children nearly two years later, in order to investigate how much progress they had
made in that time.
Methods and procedures
Participants were deaf children aged 6-11 years (N=106, comprising 69 users of spoken
English, 29 users of BSL and 8 users of Sign Supported English) compared to hearing children
(N=120) of the same age who used spoken English. Semantic fluency was tested for the
category “animals”. We coded for errors, clusters (e.g., “pets”, “farm animals”) and
switches. Participants also completed the Expressive One-Word Picture Vocabulary Test and
a battery of six non-verbal executive function tasks. In addition, we collected follow-up

3
semantic fluency data for 70 deaf and 74 hearing children, nearly 2 years after they were
first tested.
Outcomes and results
Deaf children, whether using spoken or signed language, produced fewer items in the
semantic fluency task than hearing children, but they showed similar patterns of responses
for items most commonly produced, clustering of items into subcategories and switching
between subcategories. Both vocabulary and executive function scores predicted the
number of correct items produced. Follow-up data from deaf participants showed
continuing delays relative to hearing children two years later.
Conclusions and implications
We conclude that semantic fluency can be used experimentally to investigate lexical
organisation in deaf children, and that it potentially has clinical utility across the
heterogeneous deaf population. We present normative data to aid clinicians who wish to
use this task with deaf children.

4
What this paper adds
- Section 1: What is already known on this subject.
The semantic fluency task, particularly involving the semantic category “animals”, is widely
used as a research and clinical tool across the lifespan. Little is known, however, about how
deaf children perform on this task, or whether there are differences between deaf children
who use spoken language and those who sign.
- Section 2: What this study adds.
Our study of 106 deaf children aged 6-11 from the UK revealed that deaf children on
average produced fewer responses compared to hearing children, although there was
substantial overlap between the two groups. There were also similarities in the two groups’
patterns of performance, suggesting that the task measures the same cognitive processes in
both groups, regardless of the language that the deaf children responded in (British Sign
Language, spoken English, or Sign-Supported English).
- Section 3: Clinical implications of this study.
The data from this study, which investigates semantic fluency in the largest sample of deaf
children to date, suggest that semantic fluency could have value both as a research tool for
investigating deaf children’s vocabulary and executive functions, and as a clinical
assessment tool. The normative data for deaf children aged 6-11 that are included in this
paper will aid clinicians to use the task with deaf children in that age range.

5
Introduction
Deafness impacts adversely on children’s ability to process and acquire spoken languages.
Signed languages provide a more easily accessible language input, and for the small
proportion of deaf children who are born to deaf signing parents (“native signers”) signed
language development can proceed with very similar milestones and timescale to spoken
language acquisition in hearing children (Anderson & Reilly, 2002; Mayberry & Squires,
2006; Newport & Meier, 1985). However, the vast majority of deaf children - approximately
95% - are born to hearing parents who do not sign (Mitchell & Karchmer, 2004) and so they
do not usually have access to sign language, at least during the early stages of language
acquisition (Lu, Jones & Morgan, 2016). Deaf children as a group are therefore at high risk of
language delays. This in turn has implications for other areas of development, and lower
academic achievement and poorer social, emotional and mental wellbeing outcomes are
reported (Convertino, Marschark, Sapere, Sarchet, & Zupan, 2009; Vaccari & Marschark,
1997; van Eldik, Treffers, Veerman, & Verhulst, 2004).
This paper focuses on vocabulary, a fundamental part of language whose development is
closely related to the development of grammar, narrative ability and literacy (Duff, Reen,
Plunkett, & Nation, 2015; Fenson et al., 1994; Lee, 2011; Paul, Hernandez, Taylor, &
Johnson, 1997). There is considerable variability in the rate of vocabulary development even
in hearing children (Duff et al., 2015; Fenson et al., 1994), but this variability is particularly
marked in the case of deaf children, and is increased by heterogeneity in communication
approaches and quality of language input. Native signers generally outperform non-native
signers on measures of sign vocabulary (Hermans, Knoors, Ormel, & Verhoeven, 2008;
Schick & Hoffmeister, 2001), but even native signers have been shown to know fewer lexical

6
items than hearing children (Rinaldi, Caselli, Di Renzo, Gulli, & Volterra, 2014). Deaf children
who use spoken language also tend to have lower vocabulary levels than their hearing peers
(Convertino, Borgna, Marschark, & Durkin, 2014; Yoshinago-Itano, Baca, & Sedey, 2010; Ziv,
Most, & Cohen, 2013). Even though rapid advances in hearing technologies such as hearing
aids and early cochlear implantation generally yield good progress in improving deaf
children’s access to the sounds of spoken language (Yoshinaga-Itano et al., 2010), many deaf
children still do not reach age-equivalent vocabulary capabilities for either expressive or
receptive vocabulary (see Lund, 2016, for a recent meta-analysis).
Children’s vocabulary abilities can be investigated in different ways. In this study we used
the semantic fluency task, which has been employed to investigate lexical organisation and
retrieval across the lifespan. Semantic fluency requires participants to name as many
exemplars as they can from a particular semantic category (such as “foods”, “animals”, or
“household objects”) in a limited period of time. Given the limited time for responding
(most usually just one minute), the task does not provide an exhaustive list of the words
that a participant knows, but it does reveal those words that come most readily to mind.
The semantic fluency task provides a measure of two things: lexical organisation and
executive functions (EFs; Ardila, Ostrosky-Solís, & Bernal, 2006; Bose, Wood & Kiran, 2017).
With respect to lexical organisation, if participants are able to generate exemplars in
response to a superordinate label, e.g. “animals”, then this suggests that their semantic
knowledge is organised taxonomically. When a word is spoken (or signed) it is assumed that
this will in turn activate other words or concepts that are semantically similar or related to
it. Hence it is also assumed that the order in which words are produced will indicate,
indirectly, their proximity to each other in the lexicon. Characteristic findings for this task

7
are that items are produced in clusters of semantically-related words (e.g. “farm animals”,
“pets”, “sea animals”), and that more prototypical category exemplars are produced more
frequently than less typical ones (see Marshall, Rowley, Mason, Herman, & Morgan, 2013,
for a review of the relevant literature). With respect to EFs, the task requires the use of
word-retrieval strategies, which in turn rely on executive abilities, namely cognitive
flexibility (i.e. set-shifting between different clusters), working memory (to keep track of
items that have already been produced), and inhibition (so as to avoid repeating previous
responses, and responses that are not relevant to the category) (Rosen & Engle, 1997).
Overall, optimal performance on the semantic fluency task requires a systematic search of
the mental lexicon, word retrieval within a subcategory (e.g. “farm animals”), and, when a
subcategory is exhausted, switching to a new subcategory (e.g. “pets”) (Troyer, Moscovitch,
& Winocur, 1997).
Semantic fluency is widely used in studies of the lexicon in both children and adults, and as
part of neuropsychological test batteries to assess language and cognitive impairment. Its
simple instructions mean that it can be administered to a wide range of participant groups.
Ardila et al. (2006) argue that the task, and in particular the category “animals”, meets
criteria for clinical usefulness (i.e. specific patterns of performance and error types are
associated with specific brain pathologies), experimental usefulness (it has been used
experimentally in non-clinical populations, and the pattern of brain activation correlated
with performance is well known), and psychometric validity (performance on it correlates
with performance on other assessments). Furthermore, Ardila et al. (2006) argue that
“animals” is a semantically clear category across speakers of different languages and living
in different countries.

8
Given deaf children’s delayed vocabulary and delayed EF development as measured by tasks
of cognitive flexibility, working memory, inhibition and planning (Botting et al., 2016;
Figueras, Edwards, & Langdon, 2008), deaf children are predicted to perform worse on the
semantic fluency task compared to same-age hearing children. To date, however, there
have been very few studies to investigate whether this is indeed the case.
One exception is Wechsler-Kashi, Schwartz and Cleary (2014), who used the spoken
semantic fluency task with 20 deaf American children aged 7-10 who had received cochlear
implants (CIs) and who were learning spoken language, and 20 hearing children matched for
age and non-verbal IQ. The deaf children produced significantly fewer responses compared
to typically developing children. For the deaf children, age at implantation and years of CI
use were significantly correlated with the number of responses: children who had been
implanted earlier retrieved more words, and children who had used their implants for a
longer duration of time also tended to retrieve more words. There were no differences
between deaf and hearing children with respect to the more qualitative aspects of
performance, namely the number of clusters, number of switches, or mean cluster size.
Nevertheless, an analysis with a slightly larger sample (n=27 deaf and n=27 hearing; Kennett
et al., 2013) found that there were differences between the two groups in the semantic
network for “animals”: fewer different animal names were provided by the deaf group as a
whole compared to the hearing group, and the semantic network of the deaf children was
more condensed and less spread out. The semantic network of the deaf group was
therefore argued to be under-developed compared to that of the hearing children (Kennett
et al., 2013).

9
For children who use a signed language, there are only two published studies to our
knowledge, by Marshall et al. (2013) in British Sign Language (BSL) and Beal-Alvarez and
Figueroa (2017) in American Sign Language. Marshall et al. (2013) tested 35 deaf children
aged 4 to 15 years of age, 13 of whom had been identified as having a Specific Language
Impairment (SLI) which manifested in their use of BSL. The categories used were “animals”
and “food”. The performance of these deaf signers was very similar to that reported for
hearing children in spoken languages, with children producing similar clusters and switching
between clusters, and producing the same prototypical responses that have been noted in
the spoken language literature. Productivity increased with age. Interestingly, the results of
the children with and without SLI were comparable in most respects, but the group with SLI
made occasional word-finding errors and gave fewer responses in the first 15 seconds.
Marshall et al.’s results suggest that semantic fluency can be used with deaf children who
sign, that it is a valid measure of their lexical organisation and retrieval, and that it might be
clinically sensitive in that population. An important limitation of that study, was, however,
the lack of a hearing comparison group. Marshall et al. (2013, p.215) noted that the number
of responses was within the range reported for hearing children in spoken languages, but
they did not test this directly with an age-matched hearing group.
Beal-Alvarez and Figueroa (2017) employed the animal semantic fluency task in American
Sign Language with deaf children in the USA and Puerto Rico. Like Marshall et al. (2013) for
BSL, Beal-Alvarez and Figueroa (2017) report clustering of responses around subcategories
such as “pets”, “water animals” and “farm animals”, and they too found an increase in
productivity with age. Some of their participants had additional diagnoses of, for example,
autism or mild or moderate intellectual disability, and such children performed more poorly
than their typically-developing deaf peers: they produced fewer correct items and made

10
more errors (such as non-animal signs) during the task. Again, this pattern of findings
suggests that the semantic fluency task is sensitive to language and cognitive impairments in
deaf signers. However, as was the case for Marshall et al.’s (2013) study, Beal-Alvarez and
Figueroa (2017) did not include a hearing comparison group.
Thus, recent studies of semantic fluency in deaf children have been valuable, but the sample
sizes are small and there are several questions that remain relatively unexplored within the
heterogeneous population of deaf children that includes those who sign and who use
spoken language:
1. How does the semantic fluency performance of deaf children compare to that of
hearing children, and does it differ between groups of deaf children who sign or use
spoken language to communicate?
2. How does semantic fluency performance relate to children’s expressive vocabulary
and executive functions?
3. Do any group differences between deaf and hearing children’s semantic fluency
performance persist as they get older?
If the semantic fluency task is to be useful as a clinical and experimental tool in the deaf
population these questions need to be investigated for both signed and spoken language.
Methods
Participants
Participants were 226 children (106 deaf, 120 hearing) living in the UK and Ireland and who
had English, BSL or Sign-Supported English (SSE; i.e. the simultaneous use of sign and spoken

11
English) as their primary method of communication. None of the children had any known
developmental disorders such as autism, attention deficit/hyperactivity disorder or cerebral
palsy. They had previously been recruited as part of a larger sample in order to study the
relationship between language and EFs in deaf and hearing children. Language and EF data
from the majority of that group have been presented in a paper by Botting et al. (2016).
That paper did not present the semantic fluency data that are the focus of the current
paper. Data from 7 deaf and 11 hearing participants of Botting et al.’s (2016) group were not
used here because they did not do the semantic fluency task, while data from an additional
group of 5 deaf and 6 hearing children were not included in Botting et al. (2016) but were
tested as part of the same study and are included here. The groups in both studies
therefore overlap to a very high degree. To gain a sample that is representative of deaf
children’s varied educational and language experiences, deaf participants were recruited
from both specialist deaf (day and residential schools) and mainstream schools (with and
without a specialist hearing unit).
Table 1 provides details of participants’ hearing status (deaf or hearing), gender, age and
deaf group membership. Group membership was defined according to the language in
which participants completed the semantic fluency task and the Expressive One-Word
Picture Vocabulary Test (Brownell, 2000), and which was either BSL, spoken English, or SSE;
BSL users were then subgrouped according to whether they were native or non-native
signers. The deaf group as a whole was well-matched to the hearing group for age,
t(224)=0.342, p=0.746. On a test of non-verbal cognitive ability (the matrix reasoning
subtest of the Wechsler Abbreviated Scale of Intelligence, Wechsler, 1999), the mean T-
score of the deaf group was 50.21 (SD=10.47) and of the hearing group was 54.50 (9.74).
The deaf group therefore scored within the normal range (mean=50, SD=10), but an

12
independent samples t-test nevertheless revealed that it scored lower than the hearing
group, t(224)=3.192, p=.002.
INSERT TABLE 1 ABOUT HERE
The majority of deaf children were severely (n=31) or profoundly (n=54) deaf. Two were
mildly and 14 moderately deaf, with data missing from 5 children. Seventy children used a
hearing aid, and 39 a cochlear implant (this adds up to more than the 106 children in the
group because some children had both). For those children with a cochlear implant, the
mean age of implantation was 3;3 and ranged between 3 months and 10 years of age
(SD=1;10).
A subgroup of 70 deaf and 74 hearing participants were tested a second time, an average of
21 months (SD=2 months) after first testing. The mean age of the deaf group at re-test was
10;2 (SD=1;8) and of the hearing group was 10;5 (SD=1;6).
Procedure
The study was approved by the UCL Research Ethics Committee. Informed consent was
obtained from all the participating families prior to testing, and children gave verbal consent
with the option to opt out at any time during the testing session.
Testing took place in a quiet room in either the child’s school or home. Each session was
video recorded and lasted between 60 and 75 minutes. Children could opt to take short
breaks when necessary. Children were assessed by one of two lead researchers, who were

13
supported by a research assistant. One lead researcher was a hearing native user of BSL and
their research assistant was a deaf native signer, both very experienced in communicating
with deaf children. These researchers used BSL to present all task instructions to deaf
children for whom BSL was the preferred language. The second lead researcher and
research assistant, both hearing but with competent signing skills, tested all hearing children
and deaf children whose preferred language was spoken English or SSE.
Tasks
The category “animals” was used for the Semantic Fluency task. The instructions were
straightforward: “Please tell me the names of as many animals as you can. Be as quick as
possible. You have one minute. Ready? Go”. It was rarely necessary to give examples, but
when a child seemed unsure a couple of examples (cat and dog) were given. These items
were then excluded if the child repeated them during the task. Instructions were given in
spoken English, BSL or SSE, depending on the language choice of the child.
Single word production was tested using the Expressive One-Word Picture Vocabulary Test
(EOWPVT; Brownell, 2000) following the standardised administration guidelines. Children
are required to name single pictures (mostly simple nouns, e.g. “goat”; but also verbs, e.g.
“writing”, and category labels, e.g. “lights”). The test was adapted by substituting three of
the test items with alternative pictures to make it more suitable for children in the UK (e.g.
“badger” replaced “raccoon”). Kyle, Campbell and MacSweeney (2016) previously
ascertained appropriate signed responses (in BSL), however, in order to ensure that the
EOWPVT could be used to assess the vocabulary of both hearing and signing deaf children,

14
15 test items that do not exist in BSL (e.g. “cactus”, “banjo”) were removed after
administration and an adjusted EOWPVT score was calculated for analysis that excluded
these items.
Six EF tasks were chosen for their low language demands, meaning they were less likely to
disadvantage children with low language levels.
Odd One Out Span (Henry, 2001) is a measure of executive-loaded visuo-spatial working
memory. The child is instructed to identify which shape is the odd-one-out and remember
its location. At the end of a trial, the child has to recall the location of all of the odd shapes
by pointing to the correct box in a sequence of empty grids. There are four trials within a
block, beginning with one item to recall. Each block of trials increases in the number of
shape locations to recall, with a maximum of six. The test is terminated when two errors are
made within the same block. A score is calculated by totalling the number of correctly
recalled shape locations.
The Backwards Spatial Span task (Wechsler Nonverbal Scale of Ability; Wechsler & Naglieri,
2006) is also a test of executive-loaded visuo-spatial working memory. The experimenter
taps a sequence of blocks and the child is instructed to tap this sequence in reverse. Each
trial increases the number of blocks in the sequence to a maximum of nine. The test is
terminated after two errors at the same span length, and scored by tallying the number of
correct sequences.
The Design Fluency (NEPSY; Korkman, Kirk & Kemp, 1998) task contains a series of dot
arrays. Children are required to generate as many different designs as possible in one
minute by connecting two or more dots with straight lines. The assessment measures visuo-

15
spatial cognitive fluency and is scored by adding the total number of original designs.
Children’s Colour Trails Test 1 and 2 (Llorente, Williams, Satz & D’Elia, 2003) is a test of
cognitive shifting. For Test 1, the children are timed drawing a line connecting the
numbered circles from 1 to 15. In Test 2, two sets of numbered circles are printed, one set
filled with pink, and the other, yellow. Children are required to join the numbers in
ascending order, alternating between colours. In this study, an interference score was
calculated, showing the additional time taken in Test 2.
The Tower of London is a simplified version of the Tower of Hanoi task (Shallice, 1982) that
measures executive planning. The child needs to move coloured disks from their initial
formation, one by one, to match a target configuration. The task was presented using
Psychology Experiment Building Language (PEBL) version 0.14 (Müller & Piper, 2014) via a
laptop. The first trial was used as an example, and the children continued to complete the
seven trials that followed. To score the task, the number of additional moves was calculated
by subtracting the minimum number of possible moves from the total number made.
The Simon task (Simon, 1990) is a measure of cognitive inhibitory control. On each trial
either a sun or an apple appears on the computer screen either left or right of centre. The
children are instructed to respond by pressing a key with an apple sticker on the left hand
side of the keyboard when they see an apple appear, or a pressing a key with a sun sticker
on the right hand side when they see a sun appear. Each stimulus appears for 750ms, and
the order of trials was randomised for each child. There were 16 congruent (picture on the
same side as the response) and 16 incongruent (picture on the opposite side of the
response) trials. An interference score was calculated by subtracting congruent from
incongruent scores.
16
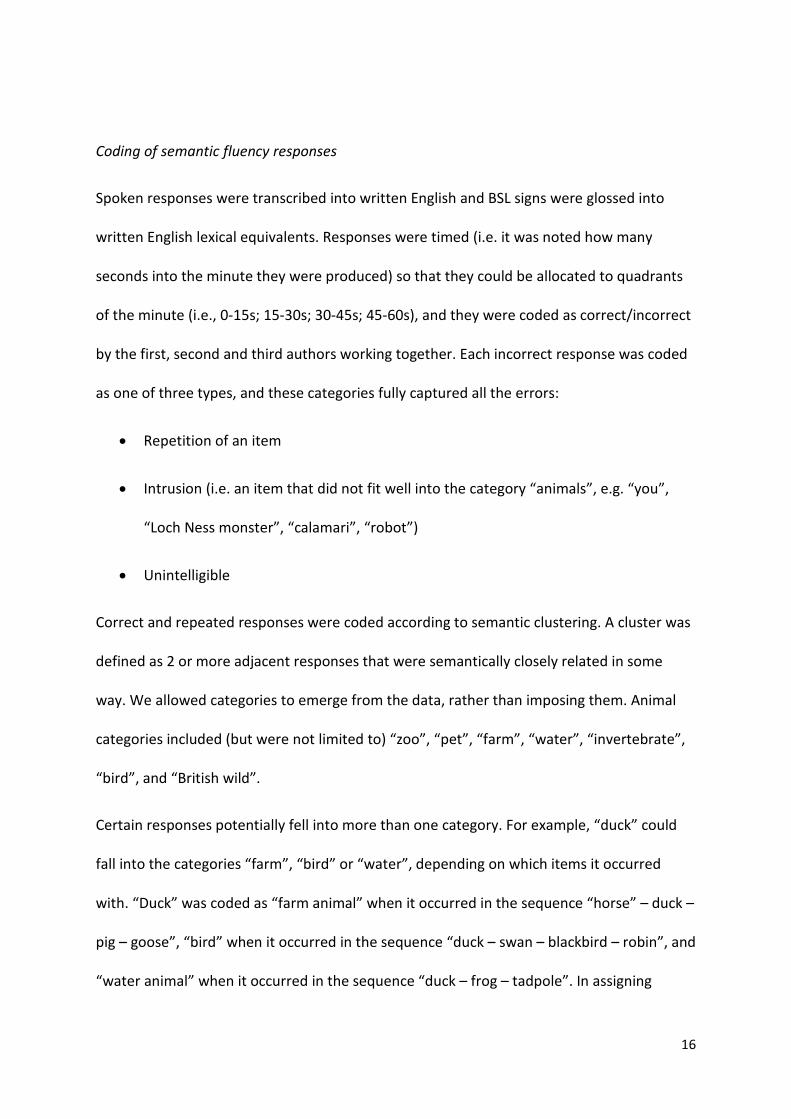
Coding of semantic fluency responses
Spoken responses were transcribed into written English and BSL signs were glossed into
written English lexical equivalents. Responses were timed (i.e. it was noted how many
seconds into the minute they were produced) so that they could be allocated to quadrants
of the minute (i.e., 0-15s; 15-30s; 30-45s; 45-60s), and they were coded as correct/incorrect
by the first, second and third authors working together. Each incorrect response was coded
as one of three types, and these categories fully captured all the errors:
• Repetition of an item
• Intrusion (i.e. an item that did not fit well into the category “animals”, e.g. “you”,
“Loch Ness monster”, “calamari”, “robot”)
• Unintelligible
Correct and repeated responses were coded according to semantic clustering. A cluster was
defined as 2 or more adjacent responses that were semantically closely related in some
way. We allowed categories to emerge from the data, rather than imposing them. Animal
categories included (but were not limited to) “zoo”, “pet”, “farm”, “water”, “invertebrate”,
“bird”, and “British wild”.
Certain responses potentially fell into more than one category. For example, “duck” could
fall into the categories “farm”, “bird” or “water”, depending on which items it occurred
with. “Duck” was coded as “farm animal” when it occurred in the sequence “horse” – duck –
pig – goose”, “bird” when it occurred in the sequence “duck – swan – blackbird – robin”, and
“water animal” when it occurred in the sequence “duck – frog – tadpole”. In assigning

17
categories we endeavoured to be as inclusive as possible, meaning that we tried to ensure
that as many responses as possible fell within clusters.
The third author coded all the clusters. The first author then independently coded
approximately 10% of the data (from 11 deaf children and 12 hearing children). Inter-rater
agreement of each items for cluster membership was 88.60% of the deaf children’s data and
89.04% for the hearing children’s data, which is very close to the 88.71% inter-rater
agreement reported by Marshall et al. (2013).
Results
This section is divided into 3 parts. The first part considers the semantic fluency data from
Time 1 in detail, with respect to the heterogeneity of deaf participants’ language experience
and characteristics of fluency output (including error types, clustering, switches between
clusters, tapering of responses over time, and the most frequent responses). In the second
part, the relationship between semantic fluency and the Expressive One-Word Vocabulary
Test and the executive function tests is investigated. In the third part, the number of correct
responses at Time 2 and the changes in group means from Time 1 to Time 2 are presented.
Semantic fluency data at Time 1
The number of correct responses was moderately correlated with age for both the deaf and
the hearing groups, r(106)=.439, p<.001 and r(120)=.411, p<.001 respectively, as shown in
Figure 1.

18
INSERT FIGURE 1 ABOUT HERE
Table 2 presents the results of the semantic fluency analysis for the deaf and hearing
groups. Independent samples t-tests revealed that despite some overlap in the range of
ability, the hearing group significantly outperformed the deaf group with respect to the
mean total number of responses, mean number of correct responses, mean number of
responses in each quadrant of the minute, mean number of switches, and mean number of
clusters. There were no group differences for any of the error types (there were very few
errors in either group, with a mean of less than one error per participant) or for cluster size.
INSERT TABLE 2 ABOUT HERE
In order to understand whether fluency performance in each the two groups was related to
the production of a greater number of clusters or to the production of bigger clusters, we
ran correlations between the number of correct items and the number of clusters, number
of switches, and cluster size, for the deaf and hearing groups separately. For the deaf group,
productivity was strongly related to the number of clusters, r(106)=.780, p<.001, and to the
number of switches, r(106)=.648, p<.001, but not to cluster size, r(106)=-.056, p=.568. The
same pattern was found for the hearing group: productivity was strongly related to the
number of clusters, r(120)=.794, p<.001, and to the number of switches, r(120)=.665,
p<.001, but not to cluster size, r(120)=.110 , p=.231. Thus it is the production of more
clusters, not bigger clusters, that drives productivity in both groups.

19
Next, the performance of the subgroups of deaf children was analysed. Table 3 presents the
semantic fluency data for the deaf group divided into those who responded using BSL, those
who used spoken English, and those who used SSE. Because these smaller subgroups were
not as well matched for age to the hearing group as the entire deaf group had been (see
Table 1), we partialed out age in an analysis of covariance (ANCOVA). Table 3 therefore
reports estimated marginal means and estimated standard error. Pairwise comparisons
(Bonferroni-corrected) were also computed comparing each of the deaf groups with one
another and with the hearing group. These comparisons revealed no significant differences
between any of the deaf groups on any of the variables (all ps>.05), and for the sake of
keeping the table as simple as possible those null results are not reported in the table.
Therefore, while hearing status predicts performance on the fluency task (see Table 6), the
type of language used by the deaf children does not.
INSERT TABLE 3 ABOUT HERE
In Table 4 we report the data for the native and non-native signers. Again, because the
groups were not well matched for age, we partialed out age in an ANCOVA and report
estimated marginal means and estimated standard error. The data must be treated with
caution because of the small number of native signers (n=9), but findings indicate that the
native signers produced more items overall and more correct items. No other comparisons
reached statistical significance.
INSERT TABLE 4 ABOUT HERE

20
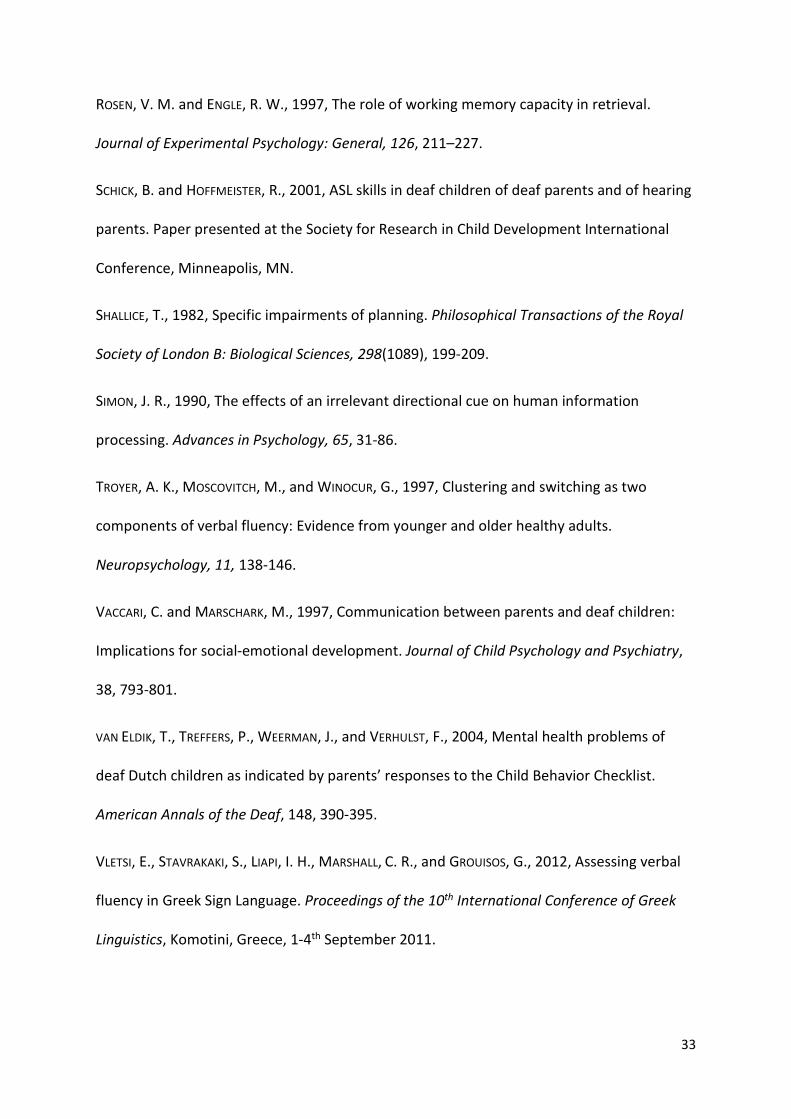
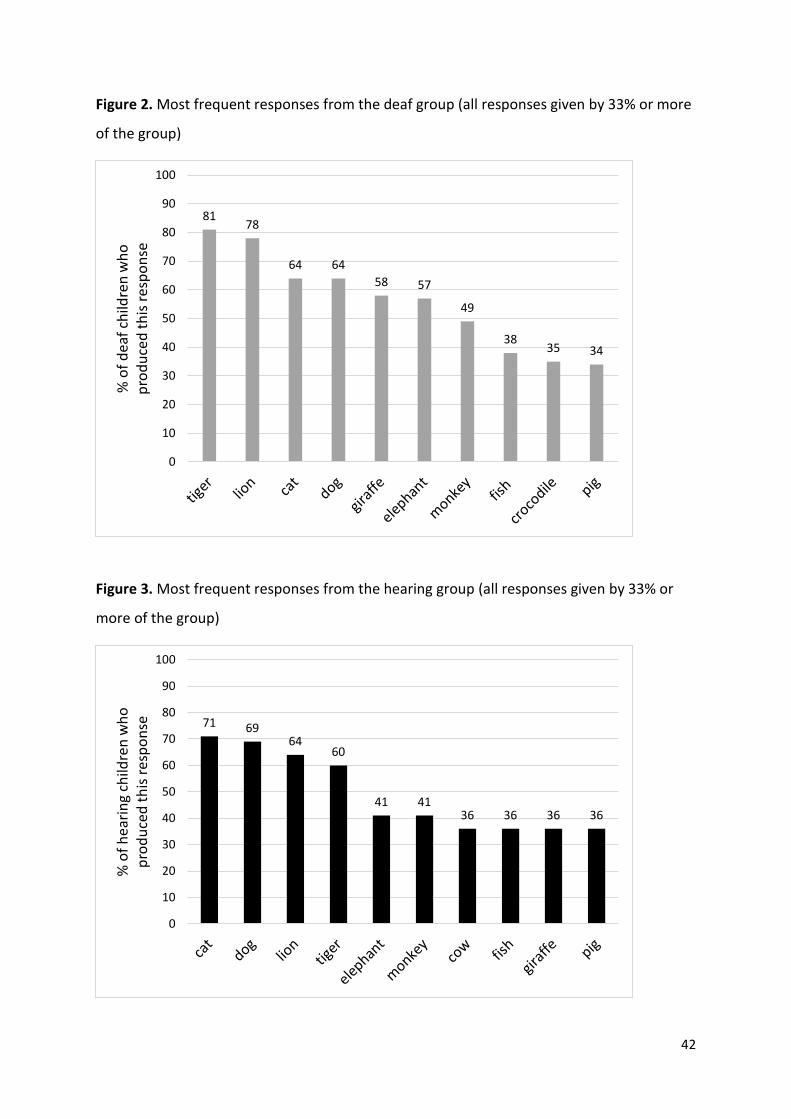
Next we consider the nature of the lexical items produced by the deaf group as a whole and
by the hearing group. The deaf children produced 196 different types of animals, and the
hearing children produced 297. Figures 2 and 3 show the responses which were produced
by 33% or more of the children in each group (following Marshall et al., 2013). For each
group there are 10 such responses, and of those, 9 were produced by both groups (“cat”,
“dog”, “elephant”, “fish”, “giraffe”, “lion”, “monkey”, “pig”, “tiger”). A positive association
between lexical frequency and the frequency of responses in the fluency task would be
predicted, but is rarely investigated. In order to determine whether a lexical frequency
effect exists in deaf children’s responses and is similar to magnitude to any effect found in
hearing children, the frequency of the full set of responses in the two groups was correlated
with the log of their lexical frequencies as reported in the CELEX database (Baayen,
Piepenbrock & Gulikers, 1995). For both groups, a moderate effect of lexical frequency was
found that was very similar in magnitude for the deaf children, rs(155)=.522, p<.001, and for
the hearing children, rs(208)=.554, p<.001.
INSERT FIGURES 2 AND 3 ABOUT HERE
Finally in this part of the results section, Table 5 presents the percentile scores for the deaf
children’s number of correct responses, broken down by 2-year age bands. The aim of this
table is to provide normative data should clinicians or researchers wish to use the semantic
fluency test with deaf children in the 6-11 age group. As there were no significant

21
differences in performance among the deaf subgroups, normative data for the whole deaf
group are reported.
Relationships between semantic fluency, expressive vocabulary and executive function
In this second part of the results section, the relationships between semantic fluency and
the Expressive One-Word Picture Vocabulary Test (EOWPVT) and the EF tasks are
investigated. The group comparisons between the deaf and hearing groups for the EOWPVT
and EF tasks were reported in Botting et al. (2016). To summarise the results of that paper,
the hearing group significantly outperformed the deaf group on all measures except for
design fluency1.
Table 6 presents the partial correlations (controlling for age) between the number of correct
items produced in the semantic fluency task, and the scores for the individual EF tasks and
the EOWPVT. Given the group differences in T-scores on the WASI matrix reasoning task
identified in the Participants section, partial correlations between WASI scores and semantic
fluency are also presented. Correlations are reported for the deaf and hearing groups
separately, and for all the children combined. EOWPVT, the two working memory tasks (odd
one out and backwards span) and design fluency correlated most strongly with semantic
fluency in both groups separately and the two groups combined. Tower of London
performance correlated significantly with semantic fluency in the deaf group but not for the
hearing group. WASI matrix reasoning score correlated significantly with semantic fluency in
both groups and the two groups combined.
1 As explained previously, the sample does not overlap exactly with the sample included in Botting et al.’s (2016) paper, but the same pattern of EF and vocabulary results that they report holds for this sample.

22
INSERT TABLE 6 ABOUT HERE
In order to further investigate the relationship between these variables, z-scores for the EF
tasks (which correlated sufficiently highly with one another) were calculated and combined
into a single, composite, score, as was done in the study by Botting et al. (2016). Regression
analyses were then carried out with semantic fluency scores as the dependent variable, and
age, matrix reasoning, vocabulary score, the EF composite score, and group (deaf or
hearing) as the predictors. Age and matrix reasoning scores were entered simultaneously in
the first block, then vocabulary and EF composite scores simultaneously in the second block,
and finally group in the third block.
The model with just age and matrix reasoning was significant, F(2,188)=33.053, p<.001. This
model accounted for 26.2% of the variance in semantic fluency scores. Both variables were
significant predictors; age: Beta=.426, t=6.685, p<.001; matrix reasoning: Beta=.359,
t=5.635, p<.001. Adding vocabulary and EF composite scores to the model explained an
additional 23.4% of the variance, F(4,188)=45.354, p<.001. Both vocabulary and EF composite
scores were significant predictors in this model; vocabulary: Beta=.381, t=5.272, p<.001; EF
composite: Beta=.314, t=3.982, p<.001. The third model with group added, however, did not
explain any additional variance (0.0%) in semantic fluency scores.
Repeating the same regression analysis on the deaf and hearing group separately revealed
exactly the same pattern. The results demonstrate that, alongside age and non-verbal
reasoning skills, EF and vocabulary scores were both unique and significant predictors of
semantic fluency scores in both groups.

23
Semantic fluency data at Time 2
The majority of the participants (70 deaf and 74 hearing) were re-tested on the semantic
fluency task nearly two years later. For this analysis, the data for the deaf children were not
subgrouped by language use (BSL, spoken English or SSE) because of its lack of effect on
semantic fluency at Time 1. Figure 4 presents the mean number of correct responses for
each group at Time 1 and Time 2. A 2x2 ANOVA, with Time (Time 1, Time 2) as the within
subjects factor and Group (Deaf, Hearing) as the between subjects factor revealed a
significant effect of Time, F(1,142)=68.208, p<.001, partial eta squared=.324 (a large effect
size, Cohen, 1988), and of Group, F(1,142)=12.470, p=.001, partial eta squared=.081 (a
medium effect size). These analyses indicate that children produced significantly more
correct responses at Time 2 compared to Time 1, and that the hearing children produced
significantly more correct responses than the deaf children. The interaction between Time
and Group was not significant, F(1,142)=2.440, p=.120, partial eta squared=.017 (a small effect
size), indicating that the gap between the two groups did not change over time.
INSERT FIGURE 4 ABOUT HERE
Discussion
The aims of this study were to investigate semantic fluency in deaf children aged 6-11 by
comparing deaf and hearing children’s lexical retrieval patterns, and by comparing the
responses of deaf children who used British Sign Language (BSL) to those who used spoken
English and Sign-Supported English (SSE). We investigated how semantic fluency
performance is related to children’s expressive vocabulary and executive function skills, and

24
we also tested the semantic fluency of a subset of the participants nearly two years later, in
order to investigate how much progress they had made in that period.
The semantic fluency category used in this study, as in many others, was “animals”. Deaf
children produced fewer responses than hearing children of the same age, and this was the
case for all four quadrants of the minute. A further difference was that deaf children drew
on a smaller set of lexical items than hearing children. However, there were also similarities:
neither group produced many errors (repetitions, intrusions, and unintelligible responses),
average cluster size did not differ significantly between the two groups, both groups shared
nine of their ten most frequent responses (cat, dog, elephant, fish, giraffe, lion, monkey, pig,
tiger), and both groups showed a significant correlation between response frequency and
the log of lexical frequencies reported in the CELEX database (Baayen et al., 1995). For both
groups, productivity was driven by cluster number and the number of switches rather than
cluster size.
Our deaf group was heterogeneous with respect to language experience, and we sought to
understand the effect of language mode on semantic fluency performance by comparing the
performance of children who responded using BSL, spoken English and SSE. The sample size
of the group who used SSE was small, so their results should be treated with caution.
Nevertheless, whether children used BSL, spoken English or SSE seemed to have no
influence on their semantic fluency performance: all produced fewer responses than the
hearing children, but did not differ from one another. Within the signing group, however,
native signers (i.e. children who had been exposed to BSL from birth) produced more items
than non-native signers (i.e. children who had only been exposed to BSL later in childhood).
Hence although the type of language used does not appear to influence fluency

25
performance, language proficiency does. Again, these results must be treated with caution
because of the small sample size of the native signer group. Nevertheless, that language
proficiency affects fluency performance is consistent with the results of our finding that
expressive vocabulary in either spoken English or BSL is a significant predictor of semantic
fluency scores. Our data suggest that deaf children generate fewer items than hearing
children partly because they have a smaller pool of lexical items to draw from in their
lexicon. Furthermore, we have also shown that semantic fluency performance is related to a
composite of executive function tasks that included design fluency, working memory tasks
and the Tower of London. Previous work on hearing populations has shown that semantic
fluency requires both vocabulary and executive functions (e.g. Ardila et al., 2006; Bose et al.,
2017), and our data directly support the same finding for deaf children, indicating that
semantic fluency is measuring equivalent cognitive abilities and has construct validity across
both groups.
Our final analysis compared semantic fluency performance in a subset of children at two
different testing times, 21 months apart. Both groups produced more responses at Time 2
compared to Time 1, showing development over the course of the study. There was no
interaction between group and time, indicating that while the deaf children did not catch up
with the hearing children during that time, neither did the gap between them widen. Both
groups showed a similar rate of development on the task but the deaf group had a lower
starting point.
Our results are consistent with the few studies that have previously investigated semantic
fluency in deaf children. As in the study by Wechsler-Kashi et al. (2014) of deaf children with
cochlear implants, deaf children in our study produced fewer items compared to hearing

26
children of the same age. With respect to deaf children who used sign, our results replicate
the findings of Marshall et al. (2013) and Beal-Alvarez and Figueroa (2017) that the same
“cognitive signatures” that characterise children’s semantic fluency responses in spoken
languages – namely clustering of responses, the slow-down in response rate during the
course of the minute, and the production of prototypical items – also characterise responses
in a signed language. More cross-linguistic work on other signed languages is needed, but
studies of deaf adults who use American Sign Language (Beal-Alvarez & Figueroa, 2017),
Portuguese Sign Language (Moita & Nunes, 2017) and Greek Sign Language (Vletsi,
Stavrakaki, Liapi, Marshall, & Grouisos, 2012) reveal similar patterns of responses to those
found with deaf adults who use BSL (Marshall, Rowley & Atkinson, 2014), indicating that,
just as the semantic fluency task has utility across different spoken languages (Ardila et al.,
2006), so it does across signed languages.
Our study provides comprehensive data on deaf children’s performance on one specific
semantic task - animal fluency – from the largest sample to date, and is the first to consider
development on this task over time using a longitudinal paradigm. Limitations are the small
numbers of children who were native users of BSL and who used SSE, and the use of just
one semantic category (albeit, the most widely used category in semantic fluency research,
“animals”). Future research is needed to confirm the patterns of responses and to provide
normative data for other semantic categories. The results should be treated with
appropriate caution because the language-learning opportunities open to deaf children in
the UK are changing rapidly: access to universal newborn hearing screening and advances in
cochlear implant technology are resulting in improved access to spoken language, but the
increase in deaf children being educated in mainstream schools with no specialist provision
and no exposure to skilled signers means that they have reduced knowledge of sign

27
language (Consortium for Research in Deaf Education, 2016). This means that the
population of deaf children who participated in our study might not be representative of the
deaf children in UK primary schools in the future.
Conclusions
Our findings confirm that semantic fluency is structured in a similar way across spoken and
sign languages, and that hearing and deaf children approach the task using the same
strategies. This means that a tool that has long been used with the hearing population can
be used experimentally to investigate lexical organisation in deaf children, and clinically
using our normative data to investigate impairments in their language or executive
functions. A further strength of this study is that it shows that semantic fluency has
equivalent validity across groups of deaf children using different forms of spoken and signed
communication, thus enabling simpler and more confident assessment of semantic fluency
in this highly heterogeneous population.

28
Acknowledgements
This research was funded by the Economic and Social Research Council (ESRC), Deafness,
Cognition and Language Research Centre (DCAL), Grant RES-620-28-0002. Ambra Fastelli
was supported by an Erasmus + traineeship at the UCL Institute of Education. We are very
grateful to all participating children, parents and schools. We also thank Tanya Denmark,
Mischa Cooke and Kathryn Mason for their support with the data collection.

29
References
ANDERSON, D. and REILLY, J., 2002, The MacArthur Communicative Development Inventory:
Normative data for American Sign Language. Journal of Deaf Studies and Deaf Education, 7,
83-106.
ARDILA, A., OSTROSKY-SOLÍS, F., and BERNAL, B., 2006, Cognitive testing toward the future: The
example of semantic verbal fluency (animals). International Journal of Psychology, 41, 324-
332.
BAAYEN, R., PIEPENBROCK, R., and GULIKERS, L., 1995, CELEX2 LDC96L14. Web Download.
Philadelphia: Linguistic Data Consortium.
BEAL-ALVAREZ, J. S. and FIGUEROA, D. M., 2017, Generation of signs within semantic and
phonological categories: Data from deaf adults and children who use American Sign
Language. Journal of Deaf Studies and Deaf Education, 22, 219-232.
BLAMEY, P., SARANT, J., PAATSCH, L., BARRY, J., BOW, C., WALES, R., et al., 2001, Relationships
among speech perception, production, language, hearing loss and age in children with
impaired hearing. Journal of Speech, Language and Hearing Research, 44, 264-285.
BOSE, A., WOOD, R., and KIRAN, S., 2017, Semantic fluency in aphasia: clustering and switching
in the course of 1 minute. International Journal of Language and Communication Disorders,
52, 334-345.
BOTTING, N., JONES, A., MARSHALL, C. R., DENMARK, T., ATKINSON, J., and MORGAN, G., 2016,
Nonverbal executive function is mediated by language: a study of deaf and hearing children.
Child Development. Advanced online access. DOI: 10.1111/cdev.12659
30
BROWNELL, R. (Ed.), 2000, Expressive One-Word Picture Vocabulary Test. Academic Therapy
Publications.
COHEN, J., 1988, Statistical power analysis for the behavioral sciences (2nd ed.). Hillsdale, NJ:
Erlbaum.
CONSORTIUM FOR RESEARCH IN DEAF EDUCATION, 2016, CRIDE report on 2015 survey on
educational provision for deaf children. Available from www.ndcs.org.uk/CRIDE.
CONVERTINO, C., BORGNA, G., MARSCHARK, M., and DURKIN, A., 2014, Word and world knowledge
among deaf learners with and without cochlear implants. Journal of Deaf Studies and Deaf
Education, 19, 471-483.
CONVERTINO, C., MARSCHARK, M., SAPERE, P., SARCHET, T., and ZUPAN, M., 2009, Predicting
academic success among deaf college students. Journal of Deaf Studies and Deaf Education,
14, 324-343.
DUFF, F., REEN, G., PLUNKETT, K., and NATION, K., 2015, Do infant vocabulary skills predict
school-age language and literacy outcomes? Journal of Child Psychology and Psychiatry, 56,
848-856.
FENSON, L., DALE, P., REZNICK, S., BATES, E., THAL, D., PETHICK, S., TOMASELLO, M., MERVIS, C., and
STILES, J., 1994, Variability in Early Communicative Development. Monographs of the Society
for Research in Child Development, 59(5), 1-185.
FIGUERAS, B., EDWARDS, L., and LANGDON, D., 2008, Executive function and language in deaf
children. Journal of Deaf Studies and Deaf Education, 13, 362-377.
HENRY, L. A., 2001, How does the severity of a learning disability affect working memory
performance? Memory, 9, 233-247.

31
HERMANS, D., KNOORS, H., ORMEL, E., and VERHOEVEN, L., 2008, The relationship between the
reading and signing skills of deaf children in bilingual education programs. Journal of Deaf
Studies and Deaf Education, 13, 518-530.
KENETT, Y. N., WECHSLER-KASHI, D., KENETT, D. Y., SCHWARTZ, R. G., BEN-JACOB, E. and FAUST, M.,
2013, Semantic organization in children with cochlear implants: computational analysis of
verbal fluency. Frontiers in Psychology, 4:543. doi:10.3389/fpsyg. 2013.00543
KORKMAN, M., KIRK, U., and KEMP, S., 1998, NEPSY: A developmental neuropsychological
assessment. San Antonio, Tex.: Psychological Corporation.
KYLE, F. E., CAMPBELL, R., and MACSWEENEY, M., 2016, The relative contributions of
speechreading and vocabulary to deaf and hearing children's reading ability. Research in
Developmental Disabilities, 48, 13-24.
Lee, J., 2011, Size matters: Early vocabulary as a predictor of language and literacy
competence. Applied Psycholinguistics, 32, 69-92.
LLORENTE, A. M., WILLIAMS, J., SATZ, P., and D’ELIA, L., 2003, Children’s color trails test (CCTT).
Odessa, Florida: Psychological Assessment Resources.
LU, J., JONES, A., and MORGAN, G., 2016, The impact of input quality on early sign development
in native and non-native language learners. Journal of Child Language, 43(3), 537–552.
LUND, E., 2016, Vocabulary knowledge of children with cochlear implants: a meta-analysis.
Journal of Deaf Studies and Deaf Education, 21, 107-121.
MARSHALL, C. R., ROWLEY, K., and ATKINSON, J., 2014, Modality-dependent and -independent
factors in the organization of the signed language lexicon: Insights from semantic and
phonological fluency tasks in BSL. Journal of Psycholinguistic Research, 43, 587-610.

32
MARSHALL, C. R., ROWLEY, K., MASON, K., HERMAN, R., and MORGAN, G., 2013, Lexical
organisation in deaf children who use British Sign Language: Evidence from a semantic
fluency task. Journal of Child Language, 40, 193-220.
MAYBERRY, R. I. and SQUIRES, B., 2006, Sign Language: Acquisition. In K. Brown, (Editor-in-
Chief) Encyclopedia of Language & Linguistics, Second Edition, volume 11, pp. 291-296.
Oxford: Elsevier.
MITCHELL, R. E., and KARCHMER, M. A., 2004, Chasing the mythical ten percent: Parental
hearing status of deaf and hard of hearing students in the United States. Sign Language
Studies, 4, 138–163.
MOITA, M. and NUNES, M. V., 2017, Disentangling linguistic modality effects in semantic
processing. Journal of Psycholinguistic Research, 46, 311-328.
NEWPORT, E. L. and MEIER, R., 1985, The acquisition of American Sign Language. In D. I. Slobin
(Ed.), The crosslinguistic study of language acquisition. 1: The data (pp. 881–938). Hillsdale,
NJ: Lawrence Erlbaum Associates.
NITTROUER, S., SANSOM, E., LOW, K., RICE, C., and CALDWELL-TARR, A., 2014, Language structures
used by kindergartners with cochlear implants: Relationship to phonological awareness,
lexical knowledge and hearing loss. Ear and Hearing 35, 506-518.
PAUL, R., HERNANDEZ, R., TAYLOR, L., and JOHNSON, K., 1997, Narrative development in late
talkers: Early school age. Journal of Speech and Hearing Research, 39, 1295-1303.
RINALDI, P., CASELLI, M. C., DI RENZO, A., GULLI, T., and VOLTERRA, V., 2014, Sign vocabulary in
deaf toddlers exposed to sign language since birth. Journal of Deaf Studies and Deaf
Education, 19, 303-318.
33
ROSEN, V. M. and ENGLE, R. W., 1997, The role of working memory capacity in retrieval.
Journal of Experimental Psychology: General, 126, 211–227.
SCHICK, B. and HOFFMEISTER, R., 2001, ASL skills in deaf children of deaf parents and of hearing
parents. Paper presented at the Society for Research in Child Development International
Conference, Minneapolis, MN.
SHALLICE, T., 1982, Specific impairments of planning. Philosophical Transactions of the Royal
Society of London B: Biological Sciences, 298(1089), 199-209.
SIMON, J. R., 1990, The effects of an irrelevant directional cue on human information
processing. Advances in Psychology, 65, 31-86.
TROYER, A. K., MOSCOVITCH, M., and WINOCUR, G., 1997, Clustering and switching as two
components of verbal fluency: Evidence from younger and older healthy adults.
Neuropsychology, 11, 138-146.
VACCARI, C. and MARSCHARK, M., 1997, Communication between parents and deaf children:
Implications for social-emotional development. Journal of Child Psychology and Psychiatry,
38, 793-801.
VAN ELDIK, T., TREFFERS, P., WEERMAN, J., and VERHULST, F., 2004, Mental health problems of
deaf Dutch children as indicated by parents’ responses to the Child Behavior Checklist.
American Annals of the Deaf, 148, 390-395.
VLETSI, E., STAVRAKAKI, S., LIAPI, I. H., MARSHALL, C. R., and GROUISOS, G., 2012, Assessing verbal
fluency in Greek Sign Language. Proceedings of the 10th International Conference of Greek
Linguistics, Komotini, Greece, 1-4th September 2011.

34
WECHSLER, D., 1999, Wechsler Abbreviated Scale of Intelligence (WASI). San Antonio, Texas:
Psychological Corporation.
WECHSLER, D. and NAGLIERI, J. A., 2006, Wechsler Nonverbal Scale of Ability (WNV). San
Antonio, Texas: Pearson.
WECHSLER-KASHI, D., SCHWARTZ, R.G., and CLEARY, M., 2014, Picture naming and verbal fluency
in children with cochlear implants. Journal of Speech, Language, and Hearing Research, 57,
1870–1882.
YOSHINAGA-ITANO, C., BACA, R., and SEDEY, A., 2010, Describing the trajectory of language
development in the presence of severe and profound hearing loss: A closer look at children
with cochlear implants versus hearing aids. Otology and Neurotology, 31, 1268-1274.
ZIV, M., MOST, T., and COHEN, S., 2013, Understanding of emotions and false beliefs among
hearing children versus deaf children. Journal of Deaf Studies and Deaf Education, 18, 161-
174.

35
Table 1. Participant details: hearing status, deaf group membership, sample sizes, gender and age
Deaf hearing n = 106 (boys = 59)
mean age = 8;10 SD = 1;8
n = 120 (boys = 66) mean age = 8;11
SD = 1;6
BSL Spoken English SSE n = 29 (boys = 18)
mean age = 9;1 SD: 1;7
n = 69 (boys = 37) mean age = 8;6
SD: 1;7
n = 8 (boys = 4) mean age = 9;5
SD: 1;6
native BSL non-native BSL
n = 9 (boys = 6) age = 8;1 SD = 0;9
n = 20 (boys = 12) age = 9;6 SD = 1;7
BSL = British Sign Language; SSE = Sign-supported English

36
Table 2. Semantic fluency results for the deaf and hearing groups
Variables
Group
t p deaf hearing
mean SD mean SD
Total number of responses 15.15 5.64 18.24 6.28 3.873 <0.001
Number of correct responses
14.33 5.45 17.63 6.05 4.279 <0.001
Error types
Repetitions 0.54 0.90 0.38 0.72 1.431 0.154
Intrusions 0.15 0.66 0.15 0.51 0.012 0.990
Unintelligible 0.13 0.37 0.09 0.37 0.826 0.409
Correct responses
per quadrant
0-15’’ 6.38 2.47 7.56 2.48 3.678 <0.001
15-30’’ 3.76 1.82 4.28 2.35 1.809 0.020
30-45’’ 2.75 1.70 3.30 1.71 2.441 0.031
45-60’’ 2.24 1.70 3.06 2.10 3.202 <0.001
Clusters
Number of switches
5.41 3.08 6.33 2.75 2.392 0.018
Number of clusters
3.89 1.77 4.86 1.88 3.985 <0.001
Average size of clusters 3.63 1.85 3.38 1.03 1.306 0.193

37
Table 3. Semantic fluency results for the three deaf (BSL, spoken English and SSE) groups and the hearing group
Variables
Group
pairwise comparisons with
hearing group p
deaf hearing
BSL spoken English SSE
e. m. mean e. SE e. m.
mean e. SE e. m. mean e. SE e. m.
mean e. SE
Total number of responses 14.35 1.00 15.85 0.65 12.84 1.91 18.19 0.49
BSL** 0.004 Spoken English* 0.028
SSE* 0.044
Number of correct responses 13.45 0.97 15.10 0.63 11.65 1.85 17.57 0.47
BSL** 0.001 Spoken English * 0.012
SSE* 0.013
Diffe
rent
err
or ty
pes Repetitions 0.58 0.15 0.55 0.10 0.35 0.29 0.38 0.07
BSL 1.000 Spoken English 1.000
SSE 1.000
Intrusions 0.12 0.11 0.09 0.07 0.84 0.20 0.15 0.05 BSL 1.000
Spoken English 1.000 SSE* 0.006
Unintelligible 0.21 0.07 0.12 0.04 0.002 0.13 0.09 0.03 BSL 0.769
Spoken English 1.000 SSE 1.000
Corr
ect r
espo
nses
per
qua
dran
t 0-15’’ 5.58 0.41 6.67 0.27 5.12 0.78 7.39 0.20 BSL** 0.001
Spoken English 0.198 SSE* 0.031
15-30’’ 3.58 0.38 3.53 0.25 3.02 0.73 4.15 0.19 BSL 1.000
Spoken English 0.296 SSE 0.815
30-45’’ 2.51 0.31 2.62 0.20 2.71 0.59 3.08 0.15 BSL 0.625
Spoken English 0.439 SSE 1.000
45-60’’ 1.74 0.34 2.30 0.22 0.68 0.64 2.95 0.17 BSL** 0.008
Spoken English 0.106 SSE** 0.004
Clus
ters
Number of switches 5.69 0.51 5.37 0.33 4.99 0.98 6.31 0.25
BSL 1.000 Spoken English 0.148
SSE 1.000
Number of clusters 3.95 0.32 3.94 0.21 3.37 0.61 4.85 0.16
BSL 0.078 Spoken English ** 0.004
SSE 0.121
Average size of clusters 3.20 0.27 3.87 0.18 3.10 0.52 3.38 0.13
BSL 1.000 Spoken English 0.160
SSE 1.000 BSL = British Sign Language; SSE = Sign-Supported English; e. m. mean = estimated marginal mean; e. SE = estimated standard error * p < .05, ** p < .01, *** p < .001

38
Table 4. Semantic fluency results for the deaf native and non-native users of BSL
Variables
Deaf BSL
F p native non-native
e. m. mean e. SE e. m. mean e. SE
Total number of responses 16.93 1.15 13.88 0.74 4.545* 0.043
Number of correct responses
15.93 1.11 12.98 0.72 4.573* 0.042
Different error types
Repetitions 0.72 0.31 0.53 0.20 0.256 0.617
Intrusions 0.19 0.16 0.12 0.10 0.124 0.728
Unintelligible 0.10 0.15 0.25 0.10 0.637 0.432
Correct responses
per quadrant
0-15’’ 6.41 0.62 5.47 0.40 1.501 0.231
15-30’’ 3.91 0.63 3.59 0.41 0.160 0.692
30-45’’ 3.32 0.45 2.26 0.29 3.595 0.069
45-60’’ 2.22 0.51 1.65 0.33 0.808 0.377
Clusters
Number of switches 5.80 0.90 5.89 0.58 0.007 0.932
Number of clusters
4.96 0.53 3.67 0.34 3.825 0.061
Average size of clusters
3.75 0.48 2.94 0.31 1.928 0.117
* p < .05, ** p < .01, *** p < .001

39
Table 5. Age band percentile scores* for deaf participants’ semantic fluency
*Scores are rounded to the nearest whole number
Age Band (years)
Percentile Scores
N Mean (SD) Minimum – maximum
1st 2nd 5th 10th 20th 30th 40th 50th 60th 70th 80th 90th 95th
6-7
37 11.65 (4.16) 4 – 23 4
4 6 7 8 9 10 11 12 13 15 17 21
8-9 39 14.87 (4.51) 7 – 25 7
7 7 8 11 12 13 16 17 17 18 21 23
10-11
30 16.93 (6.54) 6 – 29 6
6 8 9 12 13 14 15 17 20 24 28 29

40
Table 6. Partial correlations (controlling for age) between semantic fluency and each EF task or vocabulary task
Deaf Hearing All children r p r p r p Working memory: Odd one out
.443*** <.001 .450*** <.001 .500*** <.001
Working memory: Backwards spatial span
.409*** <.001 .254* .013 .400*** <.001
Non-verbal fluency: Design fluency
.383*** <.001 .421*** <.001 .474*** <.001
Cognitive flexibility: Colour trails
-.169 .103 -.002 .986 -.167* .021
Planning: Tower of London
-.404*** <.001 -.174 .092 -.327*** <.001
Inhibition: Simon Task
.097 .353 .048 .645 .126 .083
Expressive vocabulary: EOWPVT
.565*** <.001 .493*** <.001 .592*** <.001
WASI: Matrix reasoning
.321** .001 .360*** <.001 .376*** <.001
* p < .05, ** p < .01, *** p < .001

41
Figure 1. Scatterplot showing the association between the correct number of responses and
age for the deaf and the hearing groups
42
Figure 2. Most frequent responses from the deaf group (all responses given by 33% or more
of the group)
Figure 3. Most frequent responses from the hearing group (all responses given by 33% or
more of the group)
8178
64 6458 57
49
3835 34
0
10
20
30
40
50
60
70
80
90
100
% o
f dea
f chi
ldre
n w
hopr
oduc
ed th
is re
spon
se
71 6964
60
41 4136 36 36 36
0
10
20
30
40
50
60
70
80
90
100
% o
f hea
ring
child
ren
who
prod
uced
this
resp
onse

43
Figure 4. Correct responses on the semantic fluency task at Time 1 and Time 2 (Vertical bars
indicate standard deviations.)
0
5
10
15
20
25
30
Time 1 Time 2
Num
ber o
f cor
rect
resp
onse
s
Deaf Hearing