Embed Size (px)
Citation preview

SEM: Confirmatory Factor AnalysisSEM: Confirmatory Factor Analysis

LEARNING OBJECTIVESLEARNING OBJECTIVESUpon completing this chapter, you should be able to Upon completing this chapter, you should be able to
do the following:do the following: Distinguish between exploratory factor analysis Distinguish between exploratory factor analysis
and confirmatory factor analysis.and confirmatory factor analysis. Assess the construct validity of a measurement Assess the construct validity of a measurement
model.model. Know how to represent a measurement model Know how to represent a measurement model
using a path diagram.using a path diagram.
SEM – Confirmatory Factor AnalysisSEM – Confirmatory Factor AnalysisSEM – Confirmatory Factor AnalysisSEM – Confirmatory Factor Analysis

LEARNING OBJECTIVES continued . . .LEARNING OBJECTIVES continued . . .Upon completing this chapter, you should be able to Upon completing this chapter, you should be able to
do the following:do the following: Understand the basic principles of statistical Understand the basic principles of statistical
identification and know some of the primary identification and know some of the primary causes of SEM identification problems.causes of SEM identification problems.
Understand the concept of model fit as it Understand the concept of model fit as it applies to measurement models and be able to applies to measurement models and be able to assess the fit of a confirmatory factor analysis assess the fit of a confirmatory factor analysis model.model.
SEM – Confirmatory Factor AnalysisSEM – Confirmatory Factor AnalysisSEM – Confirmatory Factor AnalysisSEM – Confirmatory Factor Analysis

• What is it?What is it?
• Why use it?Why use it?
Confirmatory Factor Analysis Confirmatory Factor Analysis OverviewOverview

Confirmatory Factor Analysis . . . is similar to EFA in some respects, but philosophically it is quite different. With CFA, the researcher must specify both the number of factors that exist within a set of variables and which factor each variable will load highly on before results can be computed. So the technique does not assign variables to factors. Instead the researcher must be able to make this assignment before any results can be obtained. SEM is then applied to test the extent to which a researcher’s a-priori pattern of factor loadings represents the actual data.
Confirmatory Factor Analysis Confirmatory Factor Analysis DefinedDefined

Review of and Contrast withReview of and Contrast with Exploratory Factor AnalysisExploratory Factor Analysis
EFA (exploratory factor analysis) explores the data and provides the researcher with information about how many factors are needed to best represent the data. With EFA, all measured variables are related to every factor by a factor loading estimate. Simple structure results when each measured variable loads highly on only one factor and has smaller loadings on other factors (i.e., loadings < .40).
The distinctive feature of EFA is that the factors are derived from statistical results, not from theory, and so they can only be named after the factor analysis is performed. EFA can be conducted without knowing how many factors really exist or which variables belong with which constructs. In this respect, CFA and EFA are not the same.

CFA and Construct ValidityCFA and Construct Validity One of the biggest advantages of CFA/SEM is its ability to assess the construct validity of a proposed measurement theory. Construct validity . . . is the extent to which a set of measured items actually reflect the theoretical latent construct they are designed to measure. Construct validity is made up of four important components:
1. Convergent validity – three approaches:o Factor loadings.o Variance extracted.o Reliability.
2. Discriminant validity.3. Nomological validity.4. Face validity.

Rules of Thumb 13–1Rules of Thumb 13–1
Construct Validity: Convergent and Construct Validity: Convergent and Discriminant ValidityDiscriminant Validity
• Standardized loading estimates should be .5 or higher, and ideally .7 or higher.
• AVE should be .5 or greater to suggest adequate convergent validity.
• AVE estimates for two factors also should be greater than the square of the correlation between the two factors to provide evidence of discriminant validity.
• Construct reliability should be .7 or higher to indicate adequate convergence or internal consistency.

Confirmatory Factor Analysis StagesConfirmatory Factor Analysis Stages
Stage 1: Defining Individual Constructs
Stage 2: Developing the Overall Measurement Model
Stage 3: Designing a Study to Produce Empirical Results
Stage 4: Assessing the Measurement Model Validity
Stage 5: Specifying the Structural Model
Stage 6: Assessing Structural Model Validity
Note: CFA involves stages 1 – 4 above. SEM is stages 5 and 6.

Stage 1: Defining Individual Stage 1: Defining Individual ConstructsConstructs
• List constructs that will comprise the List constructs that will comprise the measurement model.measurement model.
• Determine if existing scales/constructs are Determine if existing scales/constructs are available or can be modified to test your available or can be modified to test your measurement model.measurement model.
• If existing scales/constructs are not If existing scales/constructs are not available, then develop new scales.available, then develop new scales.

Rules of Thumb 13–2 Rules of Thumb 13–2
Defining Individual ConstructsDefining Individual Constructs
• All constructs must display adequate construct validity, whether they are new scales or scales taken from previous research. Even previously established scales should be carefully checked for content validity.
• Content validity should be of primary importance and judged both qualitatively (e.g., expert’s opinions) and empirically (e.g., unidimensionality and convergent validity).
• A pre-test should be used to purify measures prior to confirmatory testing.
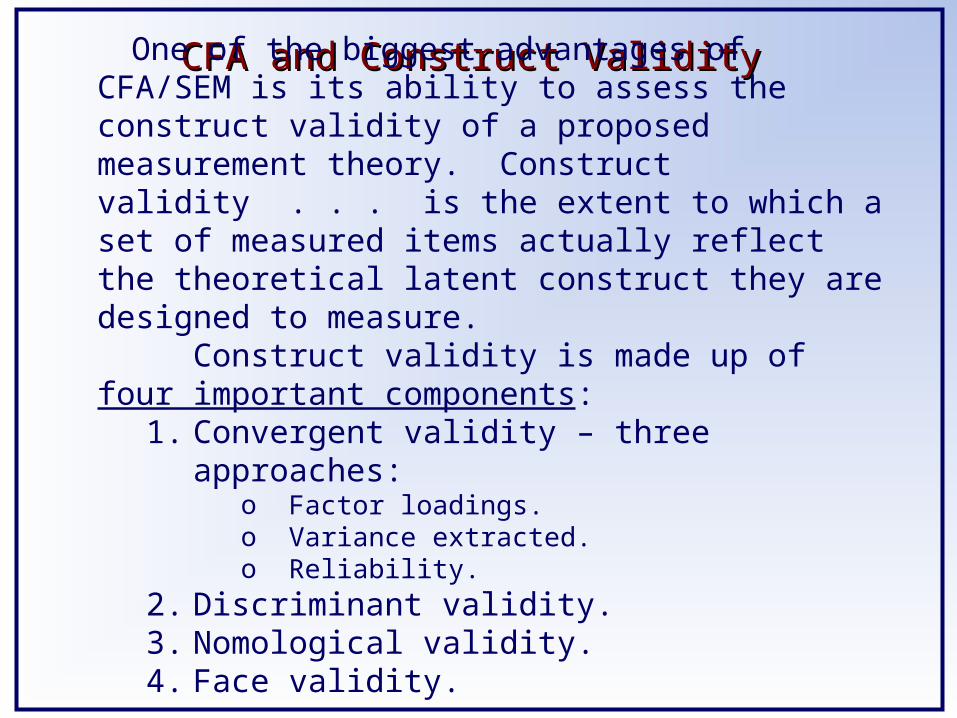
Stage 2: Developing the Overall Stage 2: Developing the Overall Measurement ModelMeasurement Model
Key Issues . . .Key Issues . . .
• Unidimensionality – no cross loadingsUnidimensionality – no cross loadings
• Congeneric measurement model – no Congeneric measurement model – no
covariance between or within construct covariance between or within construct
error varianceserror variances
• Items per construct – identificationItems per construct – identification
• Reflective vs. formative measurement Reflective vs. formative measurement
modelsmodels


Stage 2: A Congeneric Stage 2: A Congeneric Measurement ModelMeasurement Model
Compensation
X1 X2 X3 X4
e1 e2 e3 e4
Lx1
Lx 2
Lx 3
Lx 4
Teamwork
X5 X6 X7 X8
e5 e6 e7 e8
Lx 5 L 6 Lx 7Lx 8
Each measured variable is related to exactly one construct.

X5 X6 X7 X8
δ5 δ6 δ7 δ8
λx5,2 λx6,2 λx7,2
λx8,2
X1 X2 X3 X4
λx1,1 λx2,1 λx3,1
λx4,1
λx3,2λx5,1
δ1 δ2 δ3 δ4
Ф21
θδ 2,1 θδ 7,4
Figure 11.2 A Measurement Model with Hypothesized Cross-Figure 11.2 A Measurement Model with Hypothesized Cross-Loadings and Correlated Error VarianceLoadings and Correlated Error Variance
Each measured variable is not related to exactly one construct – errors are not independent.
Stage 2: A Measurement Stage 2: A Measurement Model that is Not CongenericModel that is Not Congeneric
Compensation Teamwork


Stage 2: A 4-Item Stage 2: A 4-Item Construct is Over-IdentifiedConstruct is Over-Identified
Measured ItemsX1=CheerfulX2=StimulatedX3=LivelyX4=Bright
Loading Estimatesλx 1,1=0.78λx 2,1=0.89λx 3,1=0.83λx 4,1=0.87
Error Variance Estimatesθδ1,1=0.39θδ2,2=0.21θδ3,3=0.31θδ4,4=0.24
Eight paths to estimate
10 unique variance-covariance terms
ξ1
X1 X2 X3 X4
δ1 δ2 δ3 δ4
λx 1,1
λx 2,1λx 3,1
λx 4,1
θδ 1,1 θδ 2,2 θδ 3,3 θδ 4,4
Symmetric Covariance Matrix:
X1 X2 X3 X4 -------------------------X1 2.01X2 1.43 2.01X3 1.31 1.56 2.24X4 1.36 1.54 1.57 2.00
Model Fit:χ2 = 14.9df = 2p = .001CFI = .99

Rules of Thumb 13–3Rules of Thumb 13–3
Developing the Overall Measurement Model
• In standard CFA applications testing a measurement theory, within and between error covariance terms should be fixed at zero and not estimated.
• In standard CFA applications testing a measurement theory, all measured variables should be free to load only on one construct.
• Latent constructs should be indicated by at least three measured variables, preferably four or more. In other words, latent factors should be statistically identified.
• Formative factors are not latent and are not validated as are conventional reflective factors. As such, they present greater difficulties with statistical identification and should be used cautiously.

Formative ConstructsFormative Constructs
Formative factors are not latent and are not validated as are conventional reflective factors. Internal consistency and reliability are not important. The variables that make up a formative factor should explain the largest portion of variation in the formative construct itself and should relate highly to other constructs that are conceptually related (minimum correlation of .5):
o Formative factors present greater difficulties with statistical identification.
o Additional variables or constructs must be included along with a formative construct in order to achieve an over-identified model.
o A formative factor should be represented by the entire population of items that form it. Therefore, items should not be dropped because of a low loading.
o With reflective models, any item that is not expected to correlate highly with the other indicators of a factor should be deleted.


Key Issues . . . Key Issues . . .
• Measurement scales in CFA• SEM/CFA and sampling• Specifying the model:
o Which indicators belong to each construct?o Setting the scale to “1” for one indicator on
each construct• Issues in identification• Problems in estimation . . .
o Heywood cases.o Illogical standardized parameters.
Stage 3: Designing a Study to Stage 3: Designing a Study to Produce Empirical ResultsProduce Empirical Results

Rules of Thumb 13–4Rules of Thumb 13–4
Designing a Study to Provide Empirical ResultsDesigning a Study to Provide Empirical Results
• The ‘scale’ of a latent construct can be set by either:o Fixing one loading and setting its value to 1, oro Fixing the construct variance and setting its value to 1.
• Congeneric, reflective measurement models in which all constructs have at least three item indicators are statistically identified in models with two or more constructs.
• The researcher should check for errors in the specification of the measurement model when identification problems are indicated.
• Models with large samples (more than 300) that adhere to the three indicator rule generally do not produce Heywood cases.
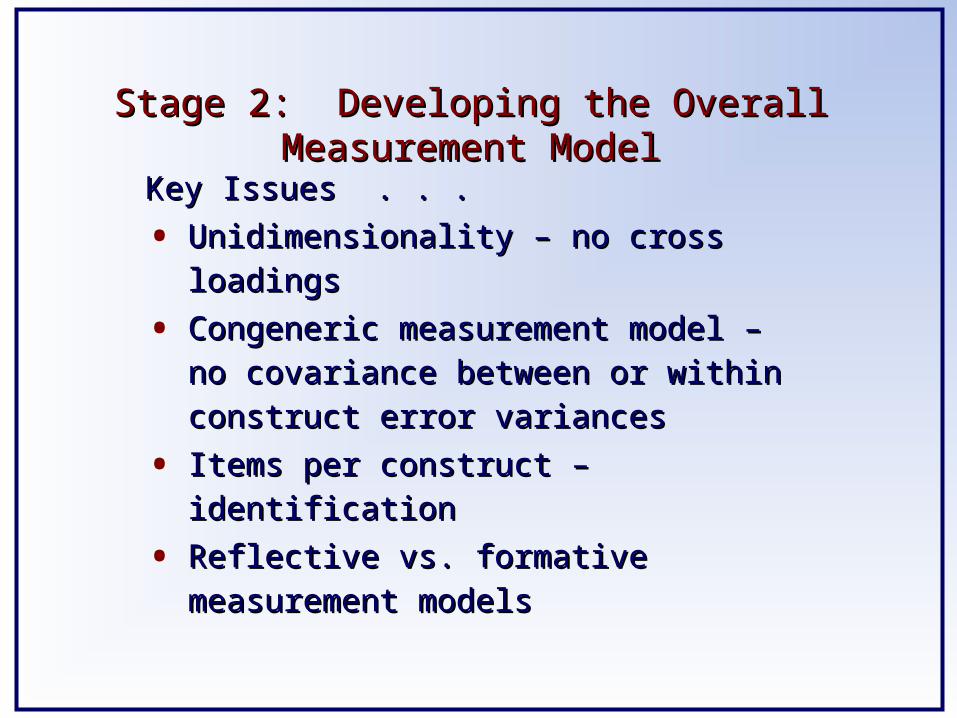
• Order ConditionOrder Condition – – the net degrees of the net degrees of freedom for a freedom for a model are greater model are greater than zero.than zero.
• Rank ConditionRank Condition – – each parameter each parameter estimated is estimated is uniquely, uniquely, algebraically algebraically defined.defined.
IdentificationIdentification
Recognizing Identification Recognizing Identification Problems:Problems:
1.1. Very large standard errorsVery large standard errors2.2. Inability to invert the Inability to invert the
information matrix (no information matrix (no solution can be found)solution can be found)
3.3. Wildly unreasonable Wildly unreasonable estimates including negative estimates including negative error varianceserror variances
4.4. Unstable parameter Unstable parameter estimatesestimates
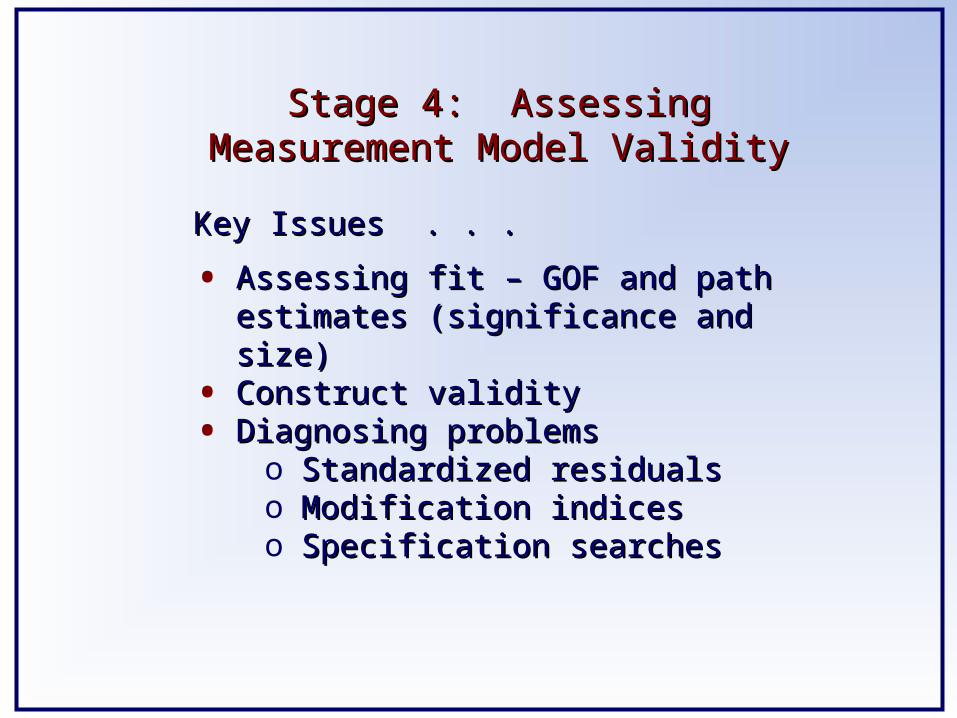
Stage 4: Assessing Stage 4: Assessing Measurement Model ValidityMeasurement Model Validity
Key Issues . . . Key Issues . . .
• Assessing fit – GOF and path Assessing fit – GOF and path estimates (significance and size)estimates (significance and size)
• Construct validityConstruct validity• Diagnosing problemsDiagnosing problems
o Standardized residualsStandardized residualso Modification indicesModification indiceso Specification searchesSpecification searches

Rules of Thumb 13–5 Rules of Thumb 13–5 Assessing Measurement Model ValidityAssessing Measurement Model Validity
• Loading estimates can be statistically significant but still be too low to qualify as a good item (standardized loadings below |.5|). In CFA, items with low loadings become candidates for deletion.
• Completely standardized loadings above +1.0 or below -1.0 are out of the feasible range and can be an important indicator of some problem with the data.
• Typically, standardized residuals less than |2.5| do not suggest a problem. o Standardized residuals greater than |4.0| suggest a potentially
unacceptable degree of error that may call for the deletion of an offending item.
o Standardized residuals between |2.5| and |4.0| deserve some attention, but may not suggest any changes to the model if no other problems are associated with those items.
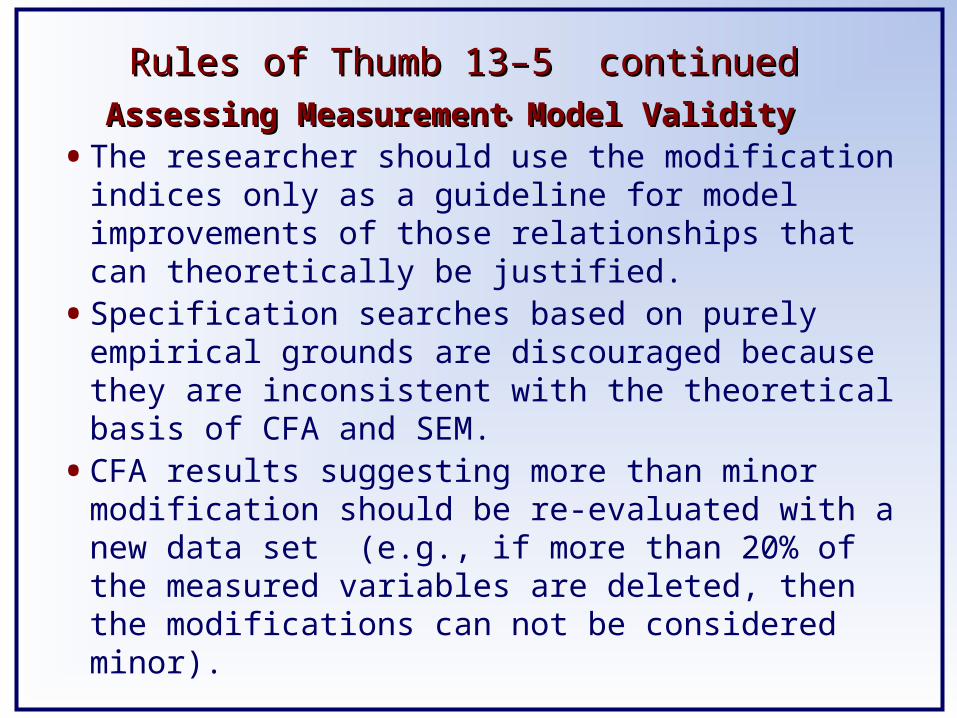
Rules of Thumb 13–5 continued . . . Rules of Thumb 13–5 continued . . .
Assessing Measurement Model ValidityAssessing Measurement Model Validity
• The researcher should use the modification indices only as a guideline for model improvements of those relationships that can theoretically be justified.
• Specification searches based on purely empirical grounds are discouraged because they are inconsistent with the theoretical basis of CFA and SEM.
• CFA results suggesting more than minor modification should be re-evaluated with a new data set (e.g., if more than 20% of the measured variables are deleted, then the modifications can not be considered minor).

HBAT CFA/SEM Case Study
HBAT employs thousands of workers in different operations around the world. Like many firms, one of their biggest management problems is attracting and keeping productive employees. The cost to replace and retrain employees is high. Yet the average new person hired works for HBAT less than three years. In most jobs, the first year is not productive, meaning the employee is not contributing as much as the costs associated with employing him/her. After the first year, most employees become productive. HBAT management would like to understand the factors that contribute to employee retention. A better understanding can be obtained if the key constructs are measured accurately. Thus, HBAT is interested in developing and testing a measurement model made up of constructs that impact employees’ attitudes and opinions about remaining with HBAT.
HBAT initiated a research project to study the employee retention/turnover problem. Preliminary research discovered that a large number of employees are exploring job options with the intention of leaving HBAT should an acceptable offer be obtained from another firm. Based on published literature and some preliminary interviews with employees, an employee retention/turnover study was designed focusing on five key constructs. The five constructs are defined as:
Job Satisfaction (JS) – reactions / beliefs about one’s job situation. Organizational Commitment (OC) – the extent to which an employee identifies and feels part of HBAT. Staying Intentions (SI) – the extent to which an employee intends to continue working for HBAT and is not participating in activities that make quitting more likely. Environmental Perceptions (EP) – beliefs an employee has about their day-to-day, physical working conditions. Employee Attitudes toward Coworkers (AC) – attitudes an employee has toward the coworkers he/she interacts with on a regular basis.

Attitudes Attitudes toward toward
CoworkersCoworkers
JS4
JS3
JS5
JS2
JS1
OC1OC2 OC3
OC4
AC3AC2 AC4AC1
SI2
SI3
SI1
SI4
EP2EP1 EP3
Note: Measured variables are shown as a box with labels corresponding to those shown in the HBAT questionnaire. Latent constructs are an oval. Each measured variable has an error term, but the error terms are not shown. Two headed connections indicate covariance between constructs. One headed connectors indicate a causal path from a construct to an indicator (measured) variable. In CFA all connectors between constructs are two-headed covariances / correlations.
EP4
Organizational Organizational CommitmentCommitment
Staying Staying IntentionsIntentions
Job Job SatisfactionSatisfaction
Environmental Environmental PerceptionsPerceptions
Measurement Theory Model for HBAT 5 Construct CFA

Theoretically-Based HBAT Employee Retention SEM Model
JS
OC
SI
EP
AC
Hypotheses: H1: EP + JS H2: EP + OC H3: AC +JS H4: AC +OC H5: JS + OC H6: JS + SI H7: OC +SI
Note: observable indicator variables are not shown to simplify the model.


Copyright © 2010 Pearson Education, Inc., publishing as Prentice-Hall.
13-32
CFA Learning Checkpoint CFA Learning Checkpoint
1.1. What is the difference between EFA and What is the difference between EFA and CFA?CFA?
2.2. Describe the four stages of CFA.Describe the four stages of CFA.
3.3. What is the difference between reflective and What is the difference between reflective and formative measurement models?formative measurement models?
4.4. What is “statistical identification” and how What is “statistical identification” and how can it be avoided?can it be avoided?
5.5. How do you decide if CFA is successful?How do you decide if CFA is successful?