Embed Size (px)
Citation preview
Performance creates trust
CFO Martin Sieg Castagnola
London, 23 May 2014
Sell-Side Analysts’ Breakfast

Caution regarding forward-looking statements
This document may contain projections or other forward-looking statements
related to the Vontobel Group that are subject to known and unknown risks,
uncertainties and other important factors. These projections and forward-
looking statements reflect management’s current views and estimates. They
involve certain risks and uncertainties that could cause actual results to
differ materially from those contained in the projections and forward-
looking statements. Potential risks and uncertainties include factors such as
general economic conditions, foreign exchange, share price and interest rate
fluctuations as well as legal and regulatory developments.
Slide 2
Looking at the past….to understand the future
Slide 3

A consistent, improving and solid business case…
CHF mns
� Solidity, reliability and respect of all stakeholders are fundamental to us
� No single year without profit through the entire financial crisis
0
200
400
600
800
1000
Total operating income Operating expenses
102 81183 256 264
113 139 148 114 124 122
2003 2004 2005 2006 2007 2008 2009 2010 2011 2012 2013
Slide 4
Group
net
profit

1.10 1.20
1.602.00 2.00
1.20
1.40 1.40
1.10
1.20 1.30
3.9%
4.5%
4.0% 3.8% 3.7%
5.5%
4.7%
3.9%
5.2%
4.3%
3.5%
0.00%
1.00%
2.00%
3.00%
4.00%
5.00%
6.00%
0.0
0.5
1.0
1.5
2.0
2.5
3.0
3.5
4.0
4.5
5.0
2002 2003 2004 2005 2006 2007 2008 2009 2010 2011 2012 2013
DPS (in CHF) Dividend yield in %
…underpinned by sustainable dividend yield of over 4%
� Since 2003 dividend yield has been below the financial sector average only in the absolute boom years
� Consistent long-term dividend policy / high payout ratio
Avg. 10Y
Dividend yield
4.2%
Payout ratio 64% 89% 56% 50% 48% 67% 61%65% 62% 62% 68%Payout ratio
mostly
over 50%
Slide 5
The most
senior
person of the current
management team started
in October
2002; average
seniority of members is
of over 6
years

ROE is strong, but it is an ‘R on a lot of E’
� Base case remains very solid, ROE adjusted for current excess capital position some 3pp higher
� We deliberately mantain our excess capital position
939
1'0771'199
1'287
1'421
1'370
1'484 1'504
1'448
1'5521'626
11.4
8.5
16.2
21.619.2
8.1
9.7 9.8
7.5
8.4 8.9
0
5
10
15
20
25
30
35
40
0
200
400
600
800
1000
1200
1400
1600
1800
2002 2003 2004 2005 2006 2007 2008 2009 2010 2011 2012 2013
Shareholders’ equity
(in CHF mns)
ROE in %
Slide 6
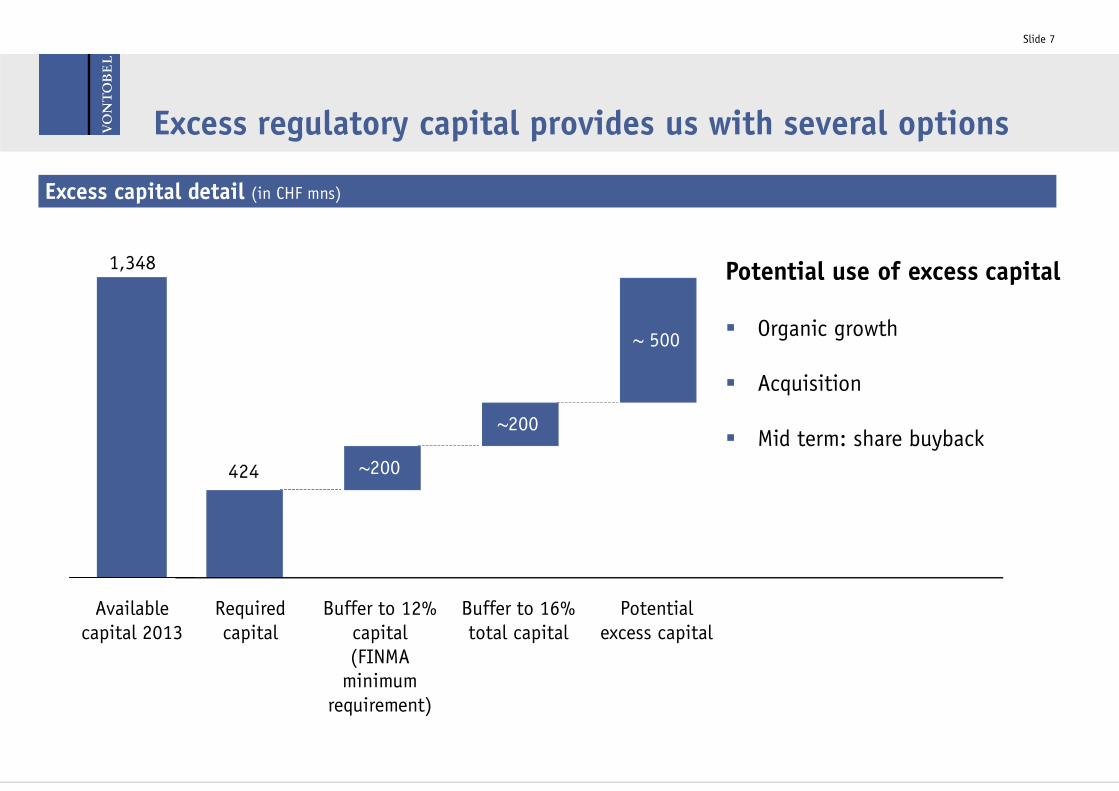
Excess regulatory capital provides us with several options
Excess capital detail (in CHF mns)
~ 500
~200
Buffer to 16%
total capital
Buffer to 12%
capital
(FINMA minimum
requirement)
Potential
excess capital
Required
capital
~200
Available
capital 2013
1,348
Slide 7
Potential use of excess capital
� Organic growth
� Acquisition
� Mid term: share buyback

Stronger capital base, controlled risks and top discipline
939
2013
1,497
2010
1,504
2009
1,626
2011
1,552
2008
1,484
2012
1,199
2006
6,281
2003
1,287
4,948
4,186
1,099
5,292
2004 2005
1,421
2007
1,370
4,969
5,895 5,6905,019
5,294
2,4522,972
Total risk weighted positions (CHF mns)
Total equity (CHF mns)
CAGR: 5.6%
CAGR: 8.0%
Regulatory changes
continuing to demand
more capital for lower effective exposure
It is a key concern for
us to have enough
capital to cope with this additional capital
burden and to not
bother shareholders
with tedious capital
increases
� Leverage ratio under FINMA rules not defined yet
� Basel II and Basel III increased our capital requirements
� Uncertainity in market prevails
Slide 8

Looking at the present to understand the future
Slide 9

Strong business fundamentals –total client assets increase by average 11% per year…
16%
10%
8%
2013201220112010200920082007200620052004
CAGR 11%
2003
AuM non-discretionary
AuM discretionaryCustody assets
Structured products outstanding
Total client assets (in CHF bns)
10Y CAGR
Slide 10
2%

…leading to consistent earnings pattern
6136 46
2014 2013
122
76
2012
124
63
2011
114
78 <761H
2H
Group reported net profit (in CHF mns)
23.3% 27.2% 25.5%
Slide 11
BIS tier
1 ratio

Brand value and reputation increased sharply during the crisis
Slide 12
in CHF mns
� Interbrand and Bilanz regularly assess the brand value of companies
� The brand value has doubled up since 2009, but the market multiples barely reflect this
� Vontobel is in a strong position to further build up trust and reputation
� New hiring is the best proof of increased trust and reputation
1 Brand value of 2009

Our most important message of this morning to you
Shareholders are our focus - we are driven by total return to shareholders
Slide 13
Vontobel: 10% Banking Sector: 2%1
TSR, annualized as from 1/10/2002 to end 2013
1 DJ EURO STOXX Banks Index

Contact Details
Fabrizio Croce, Head Investor Relations
Slide 14
Susanne Borer, Deputy Head Investor Relations
Vontobel Gotthardstrasse 43
CH-8022 Zürich +41 (0)58 283 7329
Vontobel Gotthardstrasse 43
CH-8022 Zürich +41 (0)58 283 5126

The Vontobel Group
Slide 15