Embed Size (px)
Citation preview

SELF-SERVICE TECHNOLOGIES
INVESTIGATION ON HOW SELF-SERVICE TECHNOLOGIES INFLUENCE THE
CONSUMER’S PERCEPTION OF QUALITY
MANSUROV BEHZOD
ROSENGREN NILS RICHARD
School of Business, Society & Engineering Course: Bachelor thesis in Business administration Course code: FOA214 15 HP
Supervisor: Ulf R Andersson Date: 2017-05-22, 2017-06-05

Abstract
Date: 2017-05-22, 2017,06-05
Level: Bachelor thesis in Business Administration, 15 HP
Institution: School of Business, Society and Engineering, Mälardalen University
Authors: Mansurov Behzod Rosengren Richard
(92/01/31) (94/07/31)
Title: Self-Service Technologies: Investigation on how self-service
technologies influence the consumer’s perception of quality
Tutor: Ulf R Andersson
Keywords: One way ANOVA test, expected quality, experienced quality, total
perceived quality, self-service technologies.
Research
Questions: How can consumers’ experiences and expectations of technology self-based
services affect the perceived quality of their service encounters?
Purpose: The aim of this study is to see how consumers’ expectations and experiences of
self-service technologies can affect the total perceived quality of service encounters
Method: Quantitative, Survey and One-way ANOVA test
Conclusion: This study concludes that the expectation and experience factors of self-service
technologies do affect the total perceived quality. This study shows that the
consumers’ perception of quality towards these technologies can also vary
between age groups.

1
ACKNOWLEDGEMENTS
The authors would like to thank the supervisor Ulf R. Andersson for his
excellent guidance and reviews during the Bachelor thesis work. His advice
supported the authors during their work.
The authors would also like to thank the classmates that took their time to help
evaluate and provide constructive feedback for this Bachelor thesis.

2
Contents 1. Introduction ........................................................................................................................ 3
1.1 Background ................................................................................................................... 3
1.2 Previous Research .......................................................................................................... 3
1.3 Research Problem of this Study ........................................................................................ 4
1.4 Purpose and Research Question ........................................................................................ 4
1.5 Structure ........................................................................................................................ 5
2. Theory and Concepts ............................................................................................................ 5
2.1 Service Quality ............................................................................................................... 5
2.2 Expected Quality ............................................................................................................ 6
2.3 Experienced Quality........................................................................................................ 7
2.4 Total Perceived Quality Model ......................................................................................... 8
2.5 Self-Service Technologies ............................................................................................... 9
2.5.1 Self-Scanning Technologies ..................................................................................... 10
2.6 Service Encounters ....................................................................................................... 11
3. Conceptual Framework ....................................................................................................... 12
4. Methods ............................................................................................................................ 13
4.1 Research Design ........................................................................................................... 13
4.2 Survey ......................................................................................................................... 14
4.3 Operationalisation ......................................................................................................... 14
4.4 ICA Gruppen AB .......................................................................................................... 17
4.5 Sample Method ............................................................................................................ 17
4.7 One-Way ANOVA Test ................................................................................................ 18
4.8 Trustworthiness ............................................................................................................ 19
5. Results.............................................................................................................................. 19
6. Discussion ........................................................................................................................ 23
7. Conclusion ........................................................................................................................ 27
8. Limitations and Future Research .......................................................................................... 28
References ............................................................................................................................ 29
Appendix 1, Questionnaire ..................................................................................................... 32

3
1. Introduction
1.1 Background
The recognition of information technology (IT) has become an increasingly
important factor within organizations since it determines the outcome of market success
(Croteau & Bergeron, 2001; Zahra & Covin, 1993). Orlikowski and Gash (1992), defined
information technology as “any form of computer-based information system, including
mainframe as well as microcomputer applications”. IT is used to help regulate business
activities internally by, for example, solving dilemmas of coordination or managing strategic
business practices (Powell & Dent-Micallef, 1997). These are a couple of examples that can
determine market success. Through the recognition of technological advancements, companies
have increased the adoption of these resources as well as the technological matured products
(Zahra & Covin, 1993). Firms consistently extend their investments on IT in order to maximize
their profits (Weill, 1992). There are several reasons why these investments are important for
firms’ profit. These reasons can range from increasing internal efficiency and performance,
gaining a strong network position or competitive advantage due to technological innovations,
to implement new ways of coordinating business activities as well as developing new strategies
in order to grow (Powell, 1992).
One aspect of technological growth being self-services, has developed critically
over the past decade. Service companies adopt these types of resources in attempt to simplify
employees’ jobs as well as motivate customers to conduct services individually. The reasoning
behind self-based services integration in business strategies is due to vital costs reductions, the
simplification of customers’ purchasing processes and the internal efficiency improvement
which can result in high service quality (Dabholkar, 1996; Dabholkar & Bagozzi, 2002).
Technology self-based services can be defined as a software or hard technology that provides
a specific service requiring customers’ performance (Marzocchi & Zammit, 2006).
However, for future investments into self-service technologies, companies need
to consider customers’ responses towards these services. The reason being customers’
perception of quality, which can determine the success or failure of using self-based
technologies. The service quality that customers expect and experience from self-service
technologies can influence their perceptions of service quality in either a positive or negative
way. This study will have a prime focus on consumer’s experiences and expectations of using
two types of self-service technologies, self-checkouts and self-scanning with portable scanners.
1.2 Previous Research
Previous research regarding technology based self-services explains the
acceptance of using these services from the consumers perspective as well as discussing the
consumers experiences (Marzocchi & Zammit, 2006). Dabholkar & Bagozzi (2002), have
found that some consumers’ can easily adapt to these technological self-based services since it
simplifies the purchasing process and can avoid interaction between consumers’ and
employees. Most customers nowadays possess the necessary knowledge to adapt accordingly
to these services. These self-services range from automated teller machines (ATM) to internet
shopping and in-room hotel checkouts (Dabholkar, Michelle Bobbitt & Lee, 2003). Dabholkar

4
& Bagozzi (2002), also discussed that some consumers react negatively towards using self-
service technologies if, for example, waiting lines are too long due to some customers who do
not understand how to utilize the machines. However, are waiting lines the main cause of using
self-service technologies? Regularly, consumers have begun to use self-based technologies
even though they spend time waiting in ques. The reason for this can be that consumers are
becoming more comfortable with these technologies the more they practice with them. The
question that needs to be asked is, what factors can influence consumers’ behaviour toward
self-based technologies? (Dabholkar & Bagozzi, 2002).
One of the major challenges for companies utilizing self-service technologies, is
to convince the customer that this new method is effective and safe, therefore, companies need
to get customers to try using these services (Meuter, Bitner, Ostrom & Brown, 2005). As self-
based technologies can be problematic in the beginning, customers tend to opt back to the
previous service method. Due to said tendency, behaviour is acknowledged as an influential
factor towards these technological service changes. One method of facing the challenge is to
gather information about the targeted customers who are going to be using this new mechanism
and speculate a certain type of behavioural response. Once the information is obtained, firms
will be able to develop these services and implement them correctly, increasing customer's
satisfaction and thus their experience (Meuter, Bitner, Ostrom & Brown, 2005).
1.3 Research Problem of this Study
Despite the fact that previous research has explored the components of
interactions between service companies and consumers’, there seems to be a lack of research
on consumers’ perceptions in terms of quality with self-service technologies. Although there
are several suggestions discussed in previous research to reduce the gap of why consumers use
technology self-based services, nevertheless, there is little concrete information explaining the
consumers’ overall quality perception of these technologies. According to Dabholkar (1996),
there has been limited research on exploring consumers’ view on technology self-based
services. For example, there is no sufficient information on examining how consumers perceive
the quality of service encounters when using technology self-based services.
1.4 Purpose and Research Question
The aim of this study is to see how consumers’ expectations and experiences can
affect the total perceived quality of service encounters. For example, a consumer who has high
expectations of a technology self-based service can increase the perceived quality in terms of
having a positive reaction towards the service encounter. Whereas if the consumer has a poor
experience with the service, it can dramatically decrease the perceived quality of the service
encounter and thus having a negative reaction. A case company that uses self-service
technology was chosen to help understand and develop the research phenomenon. Another
reason for choosing a case company was due to the availability of information of self-scanning
technologies.
Another variable to take into consideration that can affect the perceived quality
of self-service technologies is age. This variable will be examined in relation to the research
phenomenon to see if it can have an impact on how consumers expect and experience self-

5
service technologies. It can be assumed that different ages have various reactions towards self-
scanning technologies, which in turn can affect the results. According to Moris & Venkatesh
(2000), understanding age differences is important, since it relates to users acceptance as well
as the usage of information technologies.
This study focuses on answering the phenomenon; How can consumers’
experiences and expectations of technology self-based services affect the perceived quality of
their service encounters?
1.5 Structure
The outline of this study is formatted as follows; the first section will discuss the
theories and concepts that have been provided. Secondly, a model will describe why these
theories have been used and their connection to the overall phenomenon. The methods used
will be discussed shortly after, explaining how the data has been collected and how it will be
analysed. Subsequently, the results will then be presented, which will help frame the discussion
section. Lastly, a conclusion about the findings of this phenomenon will be given, followed by
future research suggestions and limitations.
2. Theory and Concepts This chapter will discuss what the Total Perceived Quality Model is about, as
well as providing information about self-service technologies and service encounters. The
authors chose this theory since it has an excellent relation to the research question. The research
question remarks how experiences and expectations can affect the total perceived quality of a
service, while the theory indicates how the total perceived quality of a service is influenced by
experience and expectation factors.
2.1 Service Quality
Services are a series of complex processes where production and consumption of
a specific service occurs simultaneously and where customers participate in the production
process (Grönroos, 2007). It is therefore important for a firm to understand what customers are
seeking and what factors they appraise. For successful service quality to be delivered; the
service concept, the service offered to customers and the customer benefits of these services
must be previously analysed (Grönroos, 2007). In 1984, Christian Grönroos introduced a
concept of perceived service quality and the model of total perceived service quality which was
meant to describe how the quality of services is perceived by customers which in turn could
develop service oriented concepts (Grönroos, 1984). The perceived service quality concept was
based on analysing consumer behaviour and how expectations of services developed due to
post-consumption evaluations (Grönroos, 2007). During the production and consumption
process of a service, specific features such as the behaviour of the service provider or the
interaction between the service provider and consumer start to appear which affects the quality
of a service. The model of perceived service quality was therefore introduced to evaluate these
features (Grönroos, 2007).
In today’s competitive environment, the idea of service quality has become an
important factor for an organization’s survival as well as the concept of a successful strategy
6
(Zeithaml, Berry & Parasuraman, 1996). Corporations are starting to focus more on delivering
better service quality to consumers, because of its direct relation to the organization’s profit
and financial stability (Rust, Zahorik & Keiningham, 1995). According to Johnson & Sirikit
(2002), competitive advantage is achieved when a firm possess some type of skill or resource
that is hard to replicate. In this case, the concept of service is considered to be a valuable
resource in gaining a competitive advantage. In order to deliver successful service quality, it is
crucial for a firm to understand the nature of service quality. According to Bitner, Booms &
Tetreault (1990), there are three distinctive factors of services; intangibility, heterogeneity, and
inseparability. Due to most services being intangible, firms may find it challenging to
understand how customers perceive their services. This is because services are intangible
performances that can be rarely measured in advance to assure quality towards the customers.
For example, a customer who is unfamiliar with a travel agency will pay for an online ticket
and will have no idea how the travel will be. At best, the customer will rely on the promise of
the travel agency that the experience will be unforgettable. But again, there is nothing that is
tangible about the travel agency’s promise. Services in nature are heterogeneity, meaning that
every service is produced and consumed differently. Having consistency in delivering the
service is tough, since the consumer can receive a completely different outcome from what the
firm intends to deliver. Since the consumption and production of services occur
simultaneously, they become inseparable. For instance, you cannot produce a service at one
place and consume it at another place simultaneously. If a firm manages to understand these
concepts of service and can regulate these services into their business operations, it can result
in retaining old customers. It can also attract new customers as well create more business with
existing customers. This is because the service quality that they are delivering will be high and
beneficial to the customers (Johnson & Sirikit, 2002). This can then provide firms a competitive
advantage in the market. According to Johnson & Sirikit (2002), they mention that service
quality is considered an essential strategy in the business environment. This is due to the market
environment becoming more competitive, which means that a superior product is not enough
to dominate the market.
During the service performance, the quality of services can be measured. This
usually occurs through the interaction between the service provider and the customer. Firms
can experience difficulties when providing service quality, since the customer’s participation
influences the process (Grönroos, 2007). For example, a customer giving a poor description of
the type of haircut they would want, can result in a negative post-consumption of the service
provided. When examining the total perceived quality model, the quality of a service is
formulated through whatever the customer perceives it to be. In order for a customer to have a
positive perceived quality of the service, firms should promote high expectations as well as
making the experience as satisfactory as possible for the consumer. If firms accomplish these
stages, then the consumer will receive exceptional service quality, thus strengthening the image
of the corporation.
2.2 Expected Quality
Developing concrete business strategies provide service firms an opportunity to
achieve customer satisfaction. Creating a service program as a form of business strategy for
achieving customer satisfaction can lead to service improvement. If accomplished efficiently,

7
service improvement will present an advantage over competitors, especially if firms manage to
develop a service that meets customers’ needs (Grönroos, 2007). Materializing a new strategy
such as managing customers’ expectations can be an option to achieving customer satisfaction
(Grönroos, 2007).
Establishing high customer expectations can therefore influence the customer's
perception of service. According to Grönroos (2007), the higher the level of expectations of
the service, the better the chances of having a positive impact on total perceived quality can
occur. It is crucial that firms hold expectations at a constant level. To achieve desirable
expectations, a firm makes a promise towards its customers. Promises about what a service or
product can do for a consumer should be fulfilled successfully. This is because promises
attempt to provide value creation for customers. Firms try to create promises through
advertising, pricing, brand image, word-of-mouth (WOM) so that the target customers can be
reached. Such promises will have an impact on customers’ expectation. It is important for firms
to manage customers’ expectations as effectively as possible. If a firm over promises,
customers’ expectations will be high, and if firms are not able to deliver what has been
promised, the customer would perceive the service negatively. Instead, it is suggested that
companies should under promise and thus deliver exceptional service unexpectedly. For
instance, a travel agency promises that their customers will arrive at their destination on time,
where the customer can also immediately check in to their hotel at arrival. Upon arrival, the
travel agency provides a private limousine for the customer which will take them to the hotel.
In this example, the company delivers exceptional quality towards its customers by providing
a private limousine to pick them up. This is a scenario where the company under promises their
services by not mentioning anything about the private limousine. In the end, the customers will
be surprised and will most likely establish high expectations of the company.
Another way of influencing consumers’ expectations is through word-of-mouth.
Word-of-mouth is a concept where customers exchange information between themselves
which will then influence the expectations of services and products of each other (Kozinets,
De Valck, Wojnicki & Wilner, 2010). Kozinets, De Valck, Wojnicki & Wilner (2010), have
discussed the importance of word-of-mouth towards firms. Conversations between customers
have a high impact on their overall expectations. For instance, as is today, most sales companies
offer the possibility to buy from their website. In order to influence consumers' expectations,
firms add a review section on their website where customers can read comments from other
customers’ previous purchases. By reading recent comments, it may influence future
customers’ expectations either positively or negatively. If most of the reviews are positive, it
will raise customer's expectation, although if it is negative, customers may have low
expectations of the service (Kozinets, De Valck, Wojnicki & Wilner, 2010).
2.3 Experienced Quality
Services are a complicated series of activities where interactions between the
buyer and seller can have an impact on the perceived quality of service. The quality of a service
can be split up into two dimensions, a technical and a functional dimension (Grönroos, 2007).

8
The technical quality deals with questions of “what” the customer will receive once the service
interaction and production process is over (Grönroos, 2007). For example, a consumer going
to the hairdresser will get a haircut. Once the consumer will receive the service, they can then
evaluate the result and perceive its quality. The perceived quality is also affected by how the
consumer will receive the service. This is termed the functional quality (Grönroos, 2007).
Going back to the hairdresser example; how the service employee performs their task, what
they say and how they say it, their appearance and behaviour are all factors that can affect the
service (Grönroos, 2007). External factors that can affect the service delivery are other
consumers who are experiencing either the same or similar service. For example, a rude and
noisy consumer can affect the overall experience of another consumer getting their hair cut. It
can therefore be seen that the technical quality can be evaluated objectively, while the
functional quality can be evaluated subjectively (Grönroos, 2007).
Furthermore, a firm has to take into consideration that their image plays an
important role when providing services to consumers. The reason is that consumers can
examine and observe the service firm, its methods of operations and its resources. A company’s
image can affect the perceived quality in numerous ways (Grönroos, 1988). For example, if
consumers have a positive mindset of the company, minor situations that occur can be forgiven.
Whereas, if a consumer has a negative perception of the company or the company is unknown
to the consumer, any mistakes that the service provider commits will greatly affect the
consumer’s experience of the service (Grönroos, 1988). The image of a firm can consequently
influence the consumer’s expectations of their services. A firm that builds their image based
on technical and functional quality factors may create high expectations of their services
(Grönroos, 1984). Moreover, traditional marketing activities such advertising and pricing or
external activities such as tradition and word of mouth can also have an impact on customers’
expectations of the firm (Grönroos, 1984). In order to deliver quality service, a firm should
establish positive expectations of their services to customers.
2.4 Total Perceived Quality Model
One of the main drivers to achieve success for a firm is through quality. The value
of goods and services can be the foundation to achieve a competitive advantage towards rivals
(Grönroos, 2007). In the service context, firms should consider which quality factors
(functional and technical) are most vital, because, if wrong actions are taken, the company can
lose valuable resources as well as their competitive position (Grönroos, 2007). Delivering
satisfactory service quality to the customer is a complicated process. It does not solely rely on
the experiences customers collect, but also on what expectations they have. In order to achieve
good perceived quality, the experienced quality should meet the expected quality of a customer
(Grönroos, 2007). Figure 1 provides a model for total perceived quality.

9
Figure 1 Total Perceived Quality (Grönroos, 2007)
If the expected quality of a service is low, then the total perceived quality will be
low even if experienced quality is satisfactory (Grönroos, 2007). For instance, a consumer
going to an unknown saloon for the first time may have low expectations of the service delivery
due to being unfamiliar with the brand. This in turn will decrease the perceived service quality.
However, after the consumption and production process is over as well as the interactions
between the customer and service provider, the customer will evaluate the experience. In this
case, it is assumed that the customer has a positive experience due to the staff having good
behaviour. This can then alter the total perceived quality of the service and thus affect the
customer’s view of the saloon’s image. As shown in Figure 1, the expectations can range from
market communications such as advertising or direct mail to customers’ needs and values. The
gap between expected quality and experienced quality determines the total perceived quality a
consumer has (Grönroos, 2007). It is therefore important for a firm to have a balance between
the expected quality and experienced quality so that their image does not deteriorate
2.5 Self-Service Technologies
A growing number of customers are starting to engage with self-service
technologies (SST), and the importance of these technologies has begun to emerge (Meuter,
Ostrom, Roundtree & Bitner, 2000). Self-service technologies are technologies that have
specific tasks that require customer's interaction. Examples of SSTs are computer hotel
checkouts, online shopping, and ATM. These SSTs are mostly used in the traditional market.
The traditional market is where customers buy products and services with the help of
employees. Due to SSTs becoming more accepted in today’s market, the use of the traditional
market has begun to decline because of marketspace. Marketspace is a market where products
and services are digitized and can be delivered through information based channels (Meuter,
Ostrom, Roundtree & Bitner, 2000). For instance, the use of self-service technologies in a
marketspace leads to less interaction between the buyer and seller.
Authors of previous studies tried to figure out why customers use self-services
technologies. Dabholkar & Bagozzi (2002), demonstrated that the users of these self-service

10
technologies tend to be young, educated technologically informed males. Another factor to be
considered is that a significant number of customers choose these technologies because it is
time-saving. As self-based technologies become increasingly more accepted, researchers
continue to explore issues about why customers choose these technologies (Meuter, Ostrom,
Roundtree & Bitner, 2000). According to Dabholkar (1992), customer's behaviour may
develop a positive acceptance of self-services technologies if it includes avoiding interaction
with employees.
Earlier investigations show that customers react in a negative way if waiting lines
are too long (Dabholkar & Bagozzi, 2002). However, the question that needs to be considered
is if waiting lines are a big factor for customers? According to Dabholkar & Bagozzi (2002),
as customers become more comfortable with self-service technologies, their willingness to wait
becomes more accepted. Due to technology advancements in today’s society, questions have
increasingly begun to arise for firms, where they have to endorse the main factors for why
customers use self-service technologies (Dabholkar & Bagozzi, 2002).
2.5.1 Self-Scanning Technologies
A self-scanning machine is a tool for customers to process their own purchases
from a retailer. Scanning devices have the capacity to read bar codes that contain product
information and prices so that the customer is well informed before the purchase (Meuter,
Ostrom, Roundtree & Bitner, 2000). The purpose of this technology is to save time for
customers (Meuter, Ostrom, Roundtree & Bitner, 2000). An Italian retail survey, showed that
customers save their time by 70 percent in the purchasing process. Most customers react
negatively when waiting in line (Dabholkar & Bagozzi, 2002), so instead of wasting time by
waiting, self-scanning can speed up the process. SSTs provide the possibility for a customer to
allocate their time on interacting with and pursuing products. Marzocchi & Zammit (2006),
have attempted to explain that companies try to distract customers in some form of activity,
such as establishing a newspaper stand by the cashier so that the lost time customers experience
in waiting lines can be compensated. Self-scanning is a perfect solution towards waiting lines,
especially for customers whom are very active in the purchasing process (Marzocchi &
Zammit, 2006).
Today, customers are provided with different forms of technology self-based
service (Pantano, 2014). The main focus of technology self-based services in this study takes
two forms: self-scanning (portable scanners) and self-checkout cashiers. Self-checkout cashiers
is one method of simplifying the purchasing process where the customer can, for instance,
avoid human interaction. When customers have chosen their line of products, they have the
opportunity to make the payment in a flexible way, either through traditional payments with
employees or self-scanning cashiers (Pantano, 2014). The fundamental concerns of self-
scanning cashiers are that customers may find this method of checkout confusing and difficult
to use (Zagel, 2015).
The second way of using self-scanning technologies is through portable scanners.
Portable scanners can provide customers the opportunity to scan their products while picking
them out (Wwwicase. 2017). The differences between portable self-scanning technologies and
the traditional way of payment or self-checkout cashiers is that customers have already scanned

11
their products and therefore only need to pay. The main advantage of this technology is that
the payment method has become much faster and the customer can pack and scan their products
at the same time. The disadvantage of this technology could be that customers may commit
errors such as scanning the products twice. This could lead to interactions between the customer
and the employee in order for the problem to get resolved, thus creating a negative shopping
experience (Zagel, 2015). As technologies are advancing and improving on a daily basis, these
technology self-based services are developing as well. However, the main concerns of these
self-service technologies are that they are too complicated and customers might not be able to
adapt to the fast-paced technology advancements, thus leading customers to avoiding these
technologies.
2.6 Service Encounters
The term "Service encounter" has been discussed in different scientific articles
and business journals in the past years. According to Surprenant & Solomon (1987), they
defined service encounter as "the dyadic interaction between a customer and service provider."
Additional scientific articles characterized service encounter as " a period during which a
consumer directly interacts with a service” (Shostak, K. 1987). Interactions of services could
be, for example, a customer engaging with employees, firms’ physical facilities, and other
tangible evidence. However, Bitner, Booms & Tetreault (1990), suggested that service
encounters do not always require human interaction.
A service encounter can have high impacts on customers, if direct interaction
between customers and employees are present. The customers will evaluate the service of
quality depending on how they received it from the employees, which will thus affect the
customer’s total experience and perception of the service. Lewis & Entwistle (1990), have
examined how service encounters can have an influence on employees. These influences were
related to employees’ motivation, rewards, job satisfaction, etcetera. To be able to reach
customer satisfaction, service firm's managers should handle service encounters as efficiently
as possible so that both customers and employees can benefit from the service encounter (Lewis
& Entwistle, 1990).
Lewis & Entwistle (1990), examined the challenges that managers may face
when trying to improve service encounters. Consistency and excellent service is a key factor
for success for service firms. However, the ability to control service encounters can become a
difficult task to deal with. Managers may have the capacity to deal with different organizational
departments, but dealing with service encounters is considered to be most challenging for them.
Another important factor that can reflect the service encounter is the physical environment of
the encounter. Physical evidence such as the size of the room, placement of tables, lighting and
scenery can influence the customer’s experience of the service (Lewis & Entwistle, 1990).
These components should be taken into consideration so that the risk of delivering poor
service can be reduced.

12
3. Conceptual Framework A conceptual framework is characterized as “A set of broad ideas and principles
taken from relevant fields of enquiry” (Smyth, 2004). This tool is meant to provide a clear link
between the theoretical framework and the research question. The conceptual framework of
this study aims to inform the readers about the research design. It will provide information in
relation to the discussion of literature and analysis of the data collected (Smyth, 2004).
Referring back to the literature in Chapter 2.1, in order for corporations to deliver good
perceived quality of service to customers, they must build up high expectations as well as make
the customers experience as pleasant as possible. Through the phenomenon and literature that
this study has provided, a conceptual framework can be built.
Firstly, customers will build up their own expectations of the firm where they
either have low or high expectations of the company’s image. This will depend on how the firm
expresses itself in terms of traditional marketing or external factors. Secondly, a new type of
service is presented where it involves the use of self-service technologies. This takes a step
away from the traditional use of service where the service provider produces the service and
the consumer consumes the service. Self-service technologies provides the consumer the ability
to produce and consume their own services. After the production and consumption process is
over during the service encounter, the consumer will then evaluate their experiences towards
these self-service technologies. During the evaluation process of their experiences in relation
to their expectations, consumers will then build up their perception of the service quality that
they received. This in turn can affect the way consumers perceive self-service technologies and
their expectations of the firm. In many cases involving traditional services, consumers are most
likely to evaluate the technical and functional quality of their service encounter. In this case,
the consumer is providing their own technical and functional qualities instead of the traditional
service provider during the service encounter. Figure 2 provides a conceptual framework.
Through this model, we will try to explain how expected and experienced factors of self-service
technologies can affect the total perceived quality. Although this model replicates Grönroos’s
model of Total Perceived Quality, it differs since it comprises of self-service technologies.

13
Figure 2 Conceptual Framework (own illustration)
4. Methods This chapter will portray the methods of this research study. It will inform the
reader of the research process, such as which methods used and the reasoning behind them.
4.1 Research Design
The research design is a descriptive plan and strategy for investigating answers
towards the research question (Saunders & Lewis, 2016). This design will specify factors such
as; what sources we collected data from, how we intend to gather and evaluate the data
collection and how reliable and trustworthy the data is.
The design of this study is explanatory in nature. The emphasis in explanatory
research is to examine a situation or a problem in order to explain the link between different
variables (Saunders & Lewis 2016). "Why" or "How" questions are used in order to gain
explanatory answers to the research question. The authors aim to explain the link between
experience and expectation variables which is reasonable for an explanatory research design.
• Market Communication
• Brand
• Word-of-Mouth
Expected Quality Experienced Quality
• Consumer Service Encounter
Total Perceived Quality of Self-Service Technologies

14
These variables will be examined in order to understand the influence they have on consumer’s
perception of quality with self-scanning technologies.
This study will take a quantitative approach, since the interest of this study
involves collecting data that makes it possible to generalize the results of the study to a specific
population. According to Saunders & Lewis (2016), quantitative methods are useful when
standardised questions will be understood the same way by all respondents or when trying to
find comparisons between different phenomena. A quantitative research method for data
collection focuses on numerical data. Examples of data collection techniques and data analysis
procedures include questionnaires and graphs where numerical data can be presented.
In order to get sufficient data for this phenomenon, the authors will be using a
single data collection technique such as questionnaires. Questionnaires will be used to collect
data from the consumer’s viewpoint. The reason for using a questionnaire is because it is an
efficient way of collecting data from a large population. This can be referred to as a mono
method quantitative study (Saunders & Lewis, 2016). By using a questionnaire in a quantitative
research method, the authors can examine the link between variables which will be analysed
through statistics in order to get a better insight of one subject (Saunders & Lewis, 2016).
4.2 Survey
The data collected in our study will explain the research phenomenon and will
help identify and back-up the conceptual framework (Saunders & Lewis, 2016). There are
many different styles of collecting primary data, however, the method chosen for gathering
data will be through a survey. The type of questionnaire undertaken in this study is through
delivery and collection questionnaires where the respondents are handed a survey for them to
complete, which is then collected by the deliverer after completion. The survey is focused at a
sample of ICA Gruppen AB consumers who have had contact with self-service technologies.
The delivery of these surveys will take place at the entrance of ICA retail stores where self-
service technologies are available and public places such Mälardalens Högskola and shopping
centres in Västerås.
4.3 Operationalisation
The design of the survey is very crucial, where the reliability and response rate
can affect the data collected (Saunders & Lewis, 2016). The process of creating a well-designed
survey started by clearly explaining the purpose of the survey. This was then followed by a
couple of questions where the respondents were expected to disclose information about their
age and how they first heard of self-service technologies. The survey consisted of twelve simple
statements without taking into account how they first came in contact with self-service
technologies and their age. The respondents were expected to answer each statement with a
rating between 1-5 which is known as a Likert Scale (Dawes, 2012). The rating of 1 represented
strongly disagrees, a rating of 2 represented disagrees, a rating of 3 represented neither agrees
or disagrees, a rating of 4 represented agrees, whereas a rating of 5 represented strongly agrees.
The reason why the authors chose a 5 point Likert Scale is because it presents clear verbal
statements and provides the respondents with options for choosing transparent answers. The

15
visual presentation of the survey was formulated to be clear and pleasing. Table 1 provides a
brief description of how the statements were organized within the survey.
No. Statements Theory
E
xp
ecte
d Q
uali
ty
2 After hearing about self-service
technologies, you had high expectations
of these services
Total Perceived
Quality Model
3 ICA AB’s brand gives you high
expectations of their self-service
technologies
4 Communication between friends and
family about ICA Gruppen AB gives
you high expectations of their self-
service technologies
5 When you hear negative things about
self-scanning technologies, your
expectations of ICA Gruppen AB self-
service technologies are still high
6 Your expectations of self-service
technologies replacing traditional
services (receiving a service from an
employee) are high
Ex
per
ien
ced
Qu
ali
ty
7 Self-service technologies are easy to use
8 Self-service technologies are faster than
waiting lines (where a cashier produces
the service for you)
9 Self-service technologies provide clear
information of what you are purchasing.
For example, when you scan a product,
it shows the price and quantity of that
product
10 Self-service technologies are secure and
reliable. For example, making payments
are trustworthy
11 Your experiences of using self-service
technologies are positive
T
ota
l
Per
ceiv
ed
Qu
ali
ty
12 Through your expectations and
experiences of self-service technologies,
your overall perception of quality in
terms of these services are high/positive
13 You will continue to use these self-
service technologies in the future
Table 1

16
The survey was divided into three investigational themes; expectation,
experience, and perception, where the statements were structured in a transitional flow. Each
statement was designed in relation to the Total Perceived Quality Model, where it was intended
to find a connection between the expectation factors and experience factors so that the total
perceived quality could be measured. Within this survey, a correlation between the statements
in each theme can be seen. In the expectation section, statement 4 and 5 are related where it
comprises of external factors such as word-of-mouth. Statement 4 deals with high expectations
in terms of word-of-mouth about self-service technologies of the case company. The purpose
of the statement was to understand if word-of-mouth about the brand image would have an
impact on the respondent’s answer. Statement 5 deals with high expectations in terms of
negative word-of-mouth about self-service technologies. The concept of this statement was to
see if negative word-of-mouth about self-service technologies would influence the
respondent’s answer. A similarity between statement 2 and statement 6 can be recognized
where the respondents provided answers about their expectations of self-service technologies
in respect to different time frames. Statement 2 deals with respondents having high
expectations of self-service technologies in the present, whereas statement 6 deals with
respondents having high expectations of self-service technologies replacing traditional services
in the future.
Within the experience section of the survey, statements 7 and 8 show a similar
resemblance. These two statements mention the simplicity as well as swiftness of self-service
technologies. Statement 7 characterizes that self-service technologies are straightforward
processes where the purpose of these technologies is to speed up the service procedure. The
principle of this statement was to see if self-service technologies are simple to use since
previous research mentions that consumers have positive experience towards these services, as
long as they are uncomplicated. Another aspect for why this statement was used, was to see if
self-service technologies are simple to use for all ages. Do the younger generations consider
these services clear and effortless compared to the older generations? Proportionately, the
purpose for statement 8 is quite similar to statement 7, where it determines that self-service
technologies are faster than traditional service encounters. The reason why this statement was
used was to see if self-service technologies actually benefit the customer by saving time,
instead of spending time waiting in line. Again, can age have an influence on the dexterity of
using these services?
The perceived quality section of the survey consists of two statements that have
parallel connection. These statements remark the consumers’ perception of quality towards
self-scanning technologies as well as the probability of continuing to using these services in
the future. Statement 12 compares the overall expectations and experiences of the consumer,
and is meant to examine if the consumer has had a positive understanding of these technologies.
The purpose of this statement was to connect it to the theory, since the experienced quality and
expected quality can influence the perceived quality. The authors also wanted to investigate if
the answers would vary from different age groups. Statement 13 is comparable with statement
12 since it represents the probability of using these services in the future. The intent of this
statement is to relate it back to the theory, since the experiences and expectations a consumer
has of a service can either influence the future usage of these services in a positive or negative

17
way. The correlation of these statements is to try and connect the different themes in respect to
the theory.
4.4 ICA Gruppen AB
ICA Gruppen AB is one of the leading companies in grocery retail in the Nordic
regions. Their net sales reached to around SEK 104 billion in 2016 with over 22,000 employees
in the Swedish and Baltic regions. In 2016, ICA Gruppen AB consisted of around 2,103 wholly
owned stores, pharmacies, and retail owned stores (Icagruppense, 2017). According
Icagruppense (2017), they have been known for their brand image. Nine out of ten Swedish
consumers know the ICA brand and are also willing to purchase from their stores. More than
half of Swedish consumers choose ICA as their first choice (Icagruppense, 2017).
ICA Gruppen AB are known for their vast variety of products and services.
Recently, self-scanning technologies has become an addition to their collection of services. For
example, services include self-scanning with portable scanners where the consumer can shop
and scan their products by themselves. This is meant to benefit the consumer by speeding up
the purchasing process, avoiding waiting lines, providing a clear view of how much the
consumer is shopping for as well as being easy to use (Wwwicase, 2017).
The reason why ICA Gruppen AB was chosen was because the authors of this
study found additional information about their self-service technologies describing how these
services benefit their consumers. The authors chose ICA as a case company since they believed
that the population for gathering data from a leading grocery retail store could be done in a
effective manner. An official website of the case company was primarily used to gather
information about self-service technologies and its purpose towards consumers. The
information provided about self-service technologies helped develop the research design. The
reason for this is that the results that will be gathered and analysed can thus be compared to
what the case company states about their self-service technologies.
4.5 Sample Method
According to Saunders & Lewis (2016), sampling is an approach where samples
of a population are gathered in order to determine certain characteristics of the specific
population. For instance, if a research question leads to a generalization of statistical findings,
sampling would be an appropriate method. In most circumstances, for a research question to
be answered, data needs to be collected in order to strengthen the findings. Some questions
may investigate an entire population so that a generalization can be formed. However, certain
restrictions such as limited resources may pose as a challenge for gathering information
(Saunders & Lewis, 2016). Sampling is a tool that simplifies the process of gathering data from
a target population. According to Saunders & Lewis (2016), a target population is the actual
focus of the research phenomenon.
There are two types of sampling methods: probability and non-probability
techniques (Saunders & Lewis, 2016). Probability sampling represents the probability of each
case being selected from a known target population. Most circumstances, questionnaires and
surveys are methods which are considered to be probability sample. This helps answer the
research question where results can be statistically generalized for the entire population

18
(Saunders & Lewis, 2016). There are five different techniques that can help determine the right
population for the research question, but the authors will be focusing on one technique that is
suitable for this study, which is stratified random sampling. Stratified random sampling is a
method where the target population is divided into two or more groups (Saunders & Lewis,
2016). The advantage of this technique is that when the population is split into small groups,
the results of these groups can be generalized for the whole population. However, this method
is most useful when there is a significant difference between the groups.
As it was mentioned earlier, probability sampling is useful when the target
population is known. In some other circumstances, it's hard to use a probability sampling when
the target population is unknown. It becomes challenging to form a generalization of the whole
population. In this case, a non-probability sampling would be preferred. Due to the target
population being known, this study will take a probability sampling approach.
The target population is already acknowledged in this study, since the authors
have decided to use a case company. A face-to-face survey was conducted to be able to gather
the data. The survey included only consumers who have previously used self-service
technologies. None users of self-service technologies would be considered as invalid data. The
authors decided to use stratified random sampling method where consumers of ICA Gruppen
AB are divided into three age groups.
4.7 One-Way ANOVA Test
The one-way ANOVA (Analysis of variance) is a statistical analysis that is used
to determine if there are any statistical significant differences between the means of the chosen
populations (Lind, Marchal & Wathen, 2005). The authors have divided the population into
three age groups where the authors try to compare the means of each group. In this study, the
ANOVA test examines that there are no significant differences between the group means. To
prove that there are no significant differences between the group means, the null hypothesis
will be tested (Lind, Marchal & Wathen, 2005). However, in order for a statement to be made,
the group means must be tested to see if there is any statistical significant differences.
Based on the conceptual framework, literature and issue of the study presented
before, an assumption can therefore be made:
H0: There is no statistical significant differences between the age groups.
If the null hypothesis is not rejected, the authors can confirm that there is no
statistical significant difference between the age groups. If the null hypothesis is rejected, then
there is a statistical significant difference in at least one age group. The p-value is the
probability of rejecting the null hypothesis when it is actually true (Lind, Marchal & Wathen,
2005). The authors decided to use a 0.05 significance level (p-value), since it is traditionally
selected for consumer research projects (Lind, Marchal & Wathen, 2005). This means that there
is a 95% level of certainty that one of the group means will differ. If the p-value is less than
0.05, then there is a statistical significant difference, which means that the null hypothesis will
be rejected.

19
4.8 Trustworthiness
In order for the scientific results to be trustworthy, two concepts should be taken
into consideration: reliability and validity. These concepts are mostly used in quantitative
methods (Golafshani, 2003). Internal validity is established when the research exhibits a
connection between two variables (Saunders & Lewis, 2016). In a survey, internal validity is
formed when a set of questions can statistically show an outcome (Saunders & Lewis, 2016).
In this study, the authors use a one-way ANOVA test to statistically show a comparison
between age groups for different statements. The results gathered were conducted through a
survey. The survey contained statements that were relevant to the research phenomenon and
theory. The survey included only customers who are familiar with self-service technologies.
The collected data of this study has been done through a survey. According to
Bell & Bryman (2005), reliability can be achieved when the same result occurs through
different approaches. The authors of this study interpreted the results reliable, since the survey
consists of well-defined statements that have fixed response options, which means that the
process of repeating the survey will be simple.
5. Results This chapter is meant to describe the data that has been collected through surveys.
It will present data based on the expected quality, experienced quality and perceived quality.
Out of the 150 surveys handed out, there were only 125 surveys that were reliable or valid.
Each age group had different amounts of respondents. Age group 0-24 included 49 respondents,
age group 25-44 consisted of 40 respondents and age group 45-65+ had 36 respondents. The
results gathered strive to disclose which statements are statistically significantly different
between the age groups.
At the beginning of the survey, the authors wanted to find out how consumers
heard about self-service technologies. There were different ways of encountering self-service
technologies between the three age groups. The most popular form of contact with these
technologies between the age groups was through store encounters. Out of all the age groups;
21 out of 49 respondents in age group 0-24, 19 out of 40 respondents in age group 25-44 and
13 out of 36 respondents in age group 45-65+ came in contact with self-service technologies
in stores. Friends and family was the second most popular option when it came to consumers
getting informed about these technologies. In age group 0-24, there were 14 respondents out of
49 respondents that first heard of these technologies through friends and family. In age group
25-44, there were 10 respondents out of 40, while in age group 45-65+, there were 9
respondents out of 36 that were informed about these technologies through friends and family.
These two components were the most popular ones when coming in contact with self-service
technologies for the first time. Other components of encountering these technologies were
either through TV, Direct Mail, Website, Social Media, Other or the consumers did not
remember.
Within the survey, there were five expectation statements where the answers from
each statement were analysed thoroughly in relation to each age group. The answers for each
statement were compared to each other to see if there was any statistical significant difference.

20
Out of the five expectation statements, there was only one statement that had a statistically
significant difference. Referring to Appendix 1, statement six, “Your expectations of self-
service technologies replacing traditional services (receiving a service from an employee) are
high.” was statistically significantly different between the age groups. This is determined by
the one-way ANOVA (F(2,122) = 3,505, p-value = 0,033) on Figure 3, which is lower than
0,05.
Figure 3, One-Way ANOVA test for Statement 6
As we can see in the one-way ANOVA table, the variances and means provide
information for the statistical significant difference. The age group of 25-44 had a variance of
0,9 and the age group of 45-65+ had a variance of 0,806, while the age group of 0-24 had a
variance of 1,344. According to the same one-way ANOVA table, the mean of the age group
0-24 was 3,775 which was higher than the mean of the age group 25-44 which was 3,35 and
the age group 45-65+ which was 3,222. There were no statistically significant difference
between the age group means for the other four statements presented. Check Appendix 2,
statements five, four, three and two.
Similar to the expectation section of the survey, the experience section consisted
of five statements where each answer was compared to each other in order to see if there was
a statistical significant difference between the age groups. The one-way ANOVA test showed
that there were statistical significant differences between the age groups. In Appendix 1,
statement seven, “Self-service technologies are easy to use.” proved statistical significant
difference. Referring to Figure 4, it showed that ages 0-24 had a mean of 3,979 and a variance
of 1,520. Age group 25-44 had a mean of 4.05 and a variance of 0,869 where age group 45-
65+ had a mean of 3,277 and a variance of 1,863. The p-value of the ANOVA test for statement
seven was 0,008 which demonstrates that there were statistical significant differences between
the age groups, ANOVA (F(2,122) = 4,926, p-value = 0,008).

21
Figure 4, One-Way ANOVA test for Statement 7
According to Appendix 1, statement eight, “Self-service technologies are faster
than waiting lines (where a cashier produces the service for you).” was statistically
significantly different where it had a p-value of 0,031 which is significantly lower than 0,05.
Figure 5, shows that there was a statistical significant difference between the age groups,
ANOVA (F(2,122) = 3,570, p-value = 0,031). The mean of age group 0-24 was 3,897 with a
variance of 1,635. The mean of age group 25-44 was 3,925 with a variance of 1,301. The age
group 45-65+ had mean of 3,222 with a variance of 2,234.
Figure 5, One-Way ANOVA test for Statement 8

22
The last statement that showed statistical significant difference was statement
eleven in Appendix 1, “Your experiences of using self-service technologies are positive.”.
Referring to Figure 6, the p-value demonstrated significant differences with a value of 0,016,
ANOVA (F(2,122) = 4,247, p-value = 0,016). Age group 45-65+ had a mean of 3,277 and a
variance of 1,520. Age group 25-45 and age group 0-24 had means of 4,075 and 3,734
respectively. Although some statements are statistically significantly different, there were two
statements within the experience section that exceeded the p-value of 0,05 which shows that
there were no differences between the age groups. Check Appendix 2, statements nine and ten.
Figure 6, One-Way ANOVA test for Statement 11
The perceived quality section of the survey covered two statements. Respondents
answered the statements based on their perception of self-service technologies after expecting
what the service could be and their experiences of those services. Out of the two statements,
only one of them had a statistical significant difference. Referring back to Appendix 1,
statement thirteen, “You will continue to use these self-service technologies in the future.” had
a p-value of 0,002 which is statistically significantly different. This can be shown in Figure 7,
ANOVA (F(2,122) = 6,356, p-value = 0,002). Age group 0-24 had a mean of 4,183 with a
variance of 0,944. Age group 25-44 had a mean of 4,125 and a variance of 1,086. Age group
45-65+ had a mean of 3,333 and a variance of 2,285. There was no statistical significant
difference between the age groups for the other statement since the p-value exceeded 0.05.
Check Appendix 2, statement twelve.

23
Figure 7, One-Way ANOVA test for Statement 13
6. Discussion According to this research study, the authors of this subject have investigated
how consumers’ experience and expectation factors of self-service technologies can have an
impact on the consumer’s perceived quality. The results previously presented have shown that
different age groups have diversified viewpoints over self-scanning technologies in terms of
expectation, experience and perceptions of quality.
These three factors variate significantly among buyers due to the aforementioned
impact age has on customers experiencing self-service technologies. In regard to expectations,
age may influence the perceived quality on customers since some generations have a broader
understanding on technologies’ different functions. For instance, younger customers who have
access to advanced technology on a daily basis, adapting to self-service technologies will not
be as burdensome as for customers who have not experienced technology in the same manner.
Therefore, expectations on the early generations can be higher because of their knowledge on
the welfare technology provides. On the other hand, expectations from customers who do not
have the same knowledge and experience on technology, are expected to be lower. In relation
to experience, a similar situation is faced compared to expectations. The more a customer has
experienced technology and its benefits/disadvantages, the higher the expectations will be.
Linking experience to age, nowadays, it is shown that upcoming generations have extensive
experience regarding technology, thus their perception of these self-service technologies can
be greatly influenced. In addition to this, customer’s perception over self-service technologies
will variate depending on age due to the understanding of the services before they utilize them.
However, this perception will also be based on the experience and expectations customers have
at different ages.
Referring to the theory, every firm tries to gain an advantage over its competitors.
One way of achieving this advantage is by providing an excellent product or service to their

24
consumers. Although good service delivery is seen as an advantage, firms should also build up
positive expectations. It is essential that there is a balance between these two concepts. For
instance, a firm that promises to deliver something but cannot comply with these deliveries can
significantly affect the experience of the consumer. This, in turn, will influence the total
perceived quality. It is therefore critical for firms to develop strategies in concurrent with being
able to deliver excellent service and build up positive expectations at the same time, so that the
total perceived quality for the consumer will be prominent.
The one-way ANOVA test for statement six in Appendix 2 demonstrated that at
least one of the age groups was statistically significantly different from the others. This finding
is important, since it shows that at least one age group of ICA Gruppen AB, expect that self-
service technologies will replace traditional services in the future. It is assumed that this could
be due to two specific reasons; image and technology investments. According to the preceding
theory, a company’s image plays an important role in encouraging positive expectations for a
consumer. Since ICA Gruppen AB are the leading grocery retail store in the Nordic region with
a strong brand image, their brand image can thus influence consumers’ expectations either in a
constructive or deconstructive manner. If brand image is managed appropriately, the influence
is most possible to become positive. For instance, it can establish high expectations for the
consumer, which in the end will also raise the overall perceived quality of the service
encounter.
Due to technological advancements, firms have started to adopt these types of
technologies because of their well-known advantages. The benefits of using these technologies
are that companies can work more efficiently, they can gain a better network position over their
competitors as well as hasten consumers purchasing process. Over the years, firms have started
to invest in self-service technologies since it can simplify employee's job and save time by
engaging consumers to produce their own services. From this point of view, it is assumed that
consumers have an idea that technologies are advancing at an exponential rate. This could be
a reason for why at least one age group believes that traditional services will be replaced by
these technologies.
Referring to Appendix 2, statements two, three, four and five proved to have no
statistical significant differences between the age groups. This means that the consumers had
high expectations of ICA Gruppen ABs services. It can therefore be assumed that factors such
as word-of-mouth or advertising have no influence on the consumers’ expectations towards
self-scanning technologies. According to the results in the above section, the most popular
forms of self-service encounters were either through store encounters or friends and family.
This shows that external factors such as the physical evidence of the environment and word-
of-mouth are important factors for informing consumers about self-service technologies. For
example, in Appendix 1, statement five mentions that when consumers hear negative things
about self-scanning technologies, their expectations towards ICA Gruppen AB are still
positive. This result showed no statistical significant difference which means that the age
groups have high expectations of ICA Gruppen AB. This could be because of ICA Gruppen
ABs brand image as well as the age difference among customers. Although there were not
statistical significant differences between the age groups within the expectation section, the age
groups had different opinions when it came to the experience section.

25
The authors have found that experienced quality of self-service technologies
posed more of an influential component compared to the expected quality. When evaluating
the results for statement seven in Appendix 2, it was discovered that at least one of the age
groups was statistically significantly different from the other groups. This means that there is
a difference concerning the utilization of these services encompassed by age groups.
According to the conceptual framework, consumers will experience self-service
technologies differently since they produce and consume their own services. Consumers
normally evaluate their experience in terms of how they received the service individually and
the outcome of the service. For this result, it can be assumed that at least one age group had
negative experiences rather than positive ones. The reasons for experiencing self-service
technologies negatively could be due to the technology complications. For example, there is a
probability of consumers committing errors during the production and consumption process.
This influences the overall quality perception since the consumers’ participation can vary
depending on situational factors during the service delivery process (Zeithaml, Berry &
Parasuraman, 1993). Consequently, in terms of what they received, it can be poor service and
in terms of how they received it can be a slow and frustrating process. According to ICA
Gruppen AB, they mention that their self-service technologies are easy to use. In this case, the
results are contradictory for at least one age group.
Services are sophisticated performances where the consumers’ experiences can
influence their perception of quality. For example, most consumers identify traditional services
in a negative way if waiting lines are too long. Therefore, firms provide consumers with self-
service technologies because it provides them the opportunity to avoid waiting in lines.
According to the case company, ICA Gruppen AB present their consumers with self-service
technologies, since they state that it is a faster purchasing process than traditional services. In
Appendix 2, statement eight showed that there are statistical differences between at least one
age group. This explains that at least one of the age groups experiences of using self-service
technologies tend to be slower than waiting lines where the cashier completes the service
encounter. Referring to Appendix 2, statement seven showed that at least one of the age groups
found it difficult to use self-service technologies. A similar assumption can therefore be made
from this statement, where consumers experience problems when utilizing these technologies,
thus making the purchasing procedure a slow process. For instance, problems such as technical
errors can prolong the purchasing procedure, which ironically can create waiting lines for self-
service technologies in the end. If consumers spend equal amounts of time waiting in lines for
traditional services and waiting in lines to use self-service technologies, then the value of using
these technologies for the consumer will decline. This means that the consumer will have no
distinction between the types of services provided to them, which in turn could lead them to
avoiding self-service technologies. One reason to do so, is because when utilizing self-service
technologies, the consumer has to do the process individually rather than having employees
facilitating it for them. Therefore, if waiting in line is already seen as an obstacle for consumers,
having to manage the purchasing process oneself as well, is assumed to decrease the total
quality perception of the service.
When discussing the experiences of using self-service technologies, the one-way
ANOVA test in Appendix 2 statement eleven, provided data confirming that there was at least
one age group that did not have positive experiences with self-service technologies. This data

26
provides information that although there can be high expectations of using self-service
technologies, the actual experiences of these technologies can differ respectively. Many
assumptions can be developed in relation to this statement of why there was at least one age
group that was statistically significantly different from the others. Relating back to statements
seven and eight, these are indirectly connected to statement eleven. For example, statement
seven mentions that self-service technologies are easy to use and statement eight states that
self-service technologies are faster than waiting lines. Both of these statements had at least one
group that was statistically significantly different from the others. It can therefore be assumed
that at least one age group's experiences of using self-service technologies are negative due to
the previous findings discussed in statements seven and eight. Another outlook can be that the
age group that was statistically significantly different did not enjoy the experience of producing
and consuming their own service independently. Similarly, external factors can also pose as an
obstacle for achieving positive experiences. An example of these factors is the physical
environment or the overall atmosphere of the service encounter. There is a possibility that this
can be unsettling, which in turn could affect the consumer's comprehensive shopping
experience.
Although there is at least one age group that does not have positive experiences
towards self-service technologies, it can be concluded that all age groups believe that self-
service technologies provide clear information about their purchases as well as being secure
and reliable. This can be shown on statements nine and ten in the one-way ANOVA test on
Appendix 2. Despite the fact that expectations and experiences between age groups can vary,
in the end consumers will create a perception in terms of quality towards self-service
technologies. This can thus influence their decisions on whether or not they shall continue to
use these types of self-service technologies in the future.
In order for a firm to deliver satisfactory service to a consumer and build up a
good perception of quality, they should consider balancing the experienced quality with the
expected quality. The reason is that each of these factors have an influence on the perceived
quality. After the consumer has produced and consumed the service, they will then evaluate
their experiences in relation to their expectations which will then build up their perception in
terms of quality towards the service encounter. According to the one-way ANOVA test on
Appendix 2, statement thirteen showed statistical significant difference, which means that there
was at least one age group that was statistically significantly different from the others. This
finding shows that there is at least one age group that will not use self-service technologies in
the future. This is most likely based on the components of expectations and experiences that
the consumers had towards these self-service technologies. An interesting circumstance arises
when discussing the consumers’ perception towards these technologies. Referring back to
Appendix 2, statement twelve showed no statistically significant differences between the age
groups. This means that the consumers overall perception in terms of quality towards self-
service technologies was high for all age groups. Although the age groups overall perception
of quality towards self-service technologies are influential, the causes of why at least one age
group not using these services in the future can be based on the previous statements discussed.
For example, where there was at least on age group that did not believe that self-service
technologies are simple or fast. This can be the reason why there is at least one age group that
are considering not using these technologies in the future. This can be assumed for statement

27
twelve, where it showed no statistical significant difference. Statement nine and ten in the
experience section showed no differences between the age groups, meaning that all age groups
believed that the self-service technologies are reliable and informative. In the expectations
section, statements two, three, four and five also revealed that there was no statistical
significant differences, meaning that the age groups had great expectations of the company and
self-service technologies. This data can explain the reason why consumers’ perceptions
towards self-service technologies are high. It can therefore be assumed that experience and
expectation can affect the perceived quality of self-service technologies in a service encounter.
7. Conclusion It can be seen that information technology is an important concept for service
firms, where they can gain competitive advantages in the market. This study has focused on
self-service technologies in the form of self-checkouts and self-scanning with portable
scanners. Due to these self-service technologies, consumers have the opportunity to produce
and consume their services. Grocery retail stores such as ICA Gruppen AB is an example of a
company which have provided self-service technologies to their consumers. It is important for
firms to understand the reasons why consumers use self-service technologies, in order to
develop service strategies. Firms need to recognize the drivers for consumer satisfaction and
dissatisfaction so that self-service technologies can be improved. In this study, the authors try
to see how consumers’ expectations and experiences can influence their total perceived quality
of self-service technologies. According to the theory, it is essential that firms should build up
consumers’ expectations as well as deliver satisfactory service so that high perceived quality
can be achieved for the consumer.
To be able to answer the research question, the authors used a quantitative method
in the form of a survey which helped create a generalization of the population. The data
gathered from these surveys was analysed through a one-way ANOVA test, where the authors
divided the population up into three age groups to see if there were any statistically significant
differences between them. Referring to the null hypothesis in the methods chapter, the results
show that there were five statements that rejected the null hypothesis, while the other seven
statements accepted the null hypothesis. Statement six, seven, eight, eleven and thirteen on
Appendix 2 were statistically significantly different which means that they rejected the null
hypotheses. This means that there was at least one age group in each statement that did not
concur with the other age groups.
Due to ICA Gruppen AB having a strong brand image, the data shows that
consumers expectations towards this company were high. External factors such as word-of-
mouth, in this case, had little influence on the consumer's expectations. Although the
expectations were naturally high, the data showed that the age groups experienced self-service
technologies quite differently from what they expected. The data recognized that even though
consumers of ICA Gruppen AB had high perceptions of quality towards self-service
technologies, it showed that there was at least one age group who will contemplate whether
using these technologies in the future.
From a theoretical point of view, the total perceived quality of services does in
fact get influenced by experience and expectation factors. This study has found that consumers’

28
perceptions of quality when using self-service technologies can vary between different age
groups. This study has grounded the fact that the image of a well-known company will normally
establish high expectations of their services, whereas the experience of these services can alter
the future expectations of the company in either a positive or negative manner.
8. Limitations and Future Research Although the survey sample was appropriate for this study and gave reliable
results, few limitations need to be discussed for future research. A limitation could be that
respondents of the survey might be new users of the technology in which they may not be able
to evaluate their total perceived quality. For instance, new users may have positive perceptions
of quality the first time they use the technology, but may re-evaluate their decisions later on
due to different circumstances. New users of these technologies may blame themselves when
problems of these services arise, thus providing bias answers to the questionnaires. Another
limitation would be the number of respondents. After the data collection, there was only 125
respondents which counted as valid data. For better results, the survey could have included
more respondents. The authors gathered the data through a face-to-face cooperation outside
ICA Gruppen AB stores and public places. This could hence reflect the respondents’ answers
since most respondents were in a rush, which could result in inaccurate responses as well. This
a component that the authors could not control during the data collection.
The results of this study showed that nearly all consumers expectations were high,
while many of their experiences differed. The results of this study were analysed through a
one-way ANOVA test which demonstrates that that there is at least one group mean that is
statistically significantly different from the others. However, the one-way ANOVA test does
not show which specific groups were different from the others. Future research could therefore
examine which specific group means are statistically significantly different from one another.
For example, using a Post Hoc test can analyse which specific group means are statistically
significantly different. In order to get a better comprehension of what these results mean, future
research could examine consumers’ satisfaction and dissatisfaction towards self-service
technologies. This could result in a better insight about consumers’ perceptions of these
technologies. Since technology is developing at an exponential rate, firms start adopting
various types of self-service technologies. Future research could explore different types of self-
service technologies such as mobile scanning which ICA Gruppen AB offers. Additionally,
this paper solely focuses on consumers who have used self-service technologies, future
research could explore consumers who are non-users of self-service technologies and their
reasons for why they do not use these services. This study had a prime focus on one case
company (ICA Gruppen AB), future research can explore this phenomenon in different types
of companies or industries. For instance, in the hotel industry where customers can checkout
from their hotel rooms or in the airline industry where ticketing and car rental machines are
present. Future research could also examine the motivation factors for why consumers use self-
service technologies. If firms manage to understand why consumers use these technologies,
firms may be able to adapt and develop new self-service technologies or other forms of service
concepts. Self-service technologies provide consumers the opportunity to avoid interaction
with employees. Future studies could therefore examine the concept of customer

29
personalization. This study focused on how age groups perceptions of quality can vary when
using self-service technologies. Subsequently, future research could examine the demographic
differences such as culture and gender towards using these self-service technologies.
References
Bell, E., & Bryman, A. (2005). Företagsekonomiska forskningsmetoder. Malmö: Liber
Ekonomi.
Bitner, M. J., Booms, B. H., & Tetreault, M. S. (1990). The service encounter: diagnosing
favorable and unfavorable incidents. The Journal of Marketing, 71-84.
Croteau, A. M., & Bergeron, F. (2001). An information technology trilogy: business strategy,
technological deployment and organizational performance. The journal of strategic
information systems, 10(2), 77-99.
Dabholkar, P. A. (1992). Role of affect and need for interaction in on-site service encounters.
NA-Advances in Consumer Research Volume 19.
Dabholkar, P. A. (1996). Consumer evaluations of new technology-based self-service
options: an investigation of alternative models of service quality. International Journal of
research in Marketing, 13(1), 29-51.
Dabholkar, P. A., & Bagozzi, R. P. (2002). An attitudinal model of technology-based self-
service: moderating effects of consumer traits and situational factors. Journal of the academy
of marketing science, 30(3), 184-201.
Dabholkar, P. A., Michelle Bobbitt, L., & Lee, E. J. (2003). Understanding consumer
motivation and behavior related to self-scanning in retailing: Implications for strategy and
research on technology-based self-service. International Journal of Service Industry
Management, 14(1), 59-95.
Dawes, J. G. (2012). Do data characteristics change according to the number of scale points
used? An experiment using 5 point, 7 point and 10 point scales.
Golafshani, N. (2003). Understanding reliability and validity in qualitative research. The
qualitative report, 8(4), 597-606.
Grönroos, C. (1984). A service quality model and its marketing implications. European
Journal of marketing, 18(4), 36-44.
Grönroos, C. (1988). Service quality: The six criteria of good perceived service. Review of
business, 9(3), 10.
30
Grönroos, C. (2007). Service management and marketing: customer management in service
competition.
Icagruppense. (2017). Icagruppense. Retrieved 21 April, 2017, from
http://www.icagruppen.se/en/about-ica-gruppen/
Icagruppense. (2017). Icagruppense. Retrieved 16 May, 2017, from
http://www.icagruppen.se/om-ica-gruppen/
Johnson, W. C., & Sirikit, A. (2002). Service quality in the Thai telecommunication industry:
a tool for achieving a sustainable competitive advantage. Management Decision, 40(7), 693-
701.
Kozinets, R. V., De Valck, K., Wojnicki, A. C., & Wilner, S. J. (2010). Networked
narratives: Understanding word-of-mouth marketing in online communities. Journal of
marketing, 74(2), 71-89.
Lewis, B. R., & Entwistle, T. W. (1990). Managing the service encounter: a focus on the
employee. International Journal of Service Industry Management, 1(3), 41-52.
Lind, D. A., Marchal, W. G., & Wathen, S. A. (2005). Statistical Techniques in Business and
Economics. McGraw-Hill Companies, Inc.
Marzocchi, G. L., & Zammit, A. (2006). Self-scanning technologies in retail: determinants of
adoption. The Service Industries Journal, 26(6), 651-669.
Meuter, M. L., Ostrom, A. L., Roundtree, R. I., & Bitner, M. J. (2000). Self-service
technologies: understanding customer satisfaction with technology-based service encounters.
Journal of marketing, 64(3), 50-64.
Meuter, M. L., Bitner, M. J., Ostrom, A. L., & Brown, S. W. (2005). Choosing among
alternative service delivery modes: An investigation of customer trial of self-service
technologies. Journal of marketing, 69(2), 61-83.
Morris, M. G., & Venkatesh, V. (2000). Age differences in technology adoption decisions:
Implications for a changing work force. Personnel psychology, 53(2), 375-403.
Orlikowski, W. J., & Gash, D. C. (1992). Changing frames: Understanding technological
change in organizations. Cambridge: Massachusetts Institute of Technology.
Pantano, E. (2014). Innovation drivers in retail industry. International Journal of Information
Management, 34(3), 344-350

31
Powell, P. (1992). Information technology evaluation: is it different?. Journal of the
operational research society, 43(1), 29-42.
Powell, T. C., & Dent-Micallef, A. (1997). Information technology as competitive advantage:
The role of human, business, and technology resources. Strategic management journal, 375-
405.
Rust, R. T., Zahorik, A. J., & Keiningham, T. L. (1995). Return on quality (ROQ): Making
service quality financially accountable. The Journal of Marketing, 58-70.
Saunders, M., & Lewis, P. (2016). In Thornhill Adrian. Research methods for business
students, 7.
Shostak, K. (1987). Planning the Service Encounter, In the Service Encounter, eds j.
Smyth, R. (2004). Exploring the usefulness of a conceptual framework as a research tool: a
researcher's reflections. Issues in educational research, 14(2), 167.
Surprenant, C. F., & Solomon, M. R. (1987). Predictability and personalization in the service
encounter. the Journal of Marketing, 86-96.
Weill, P. (1992). The relationship between investment in information technology and firm
performance: A study of the valve manufacturing sector. Information systems research, 3(4),
307-333.
Wwwicase. (2017). ICAse. Retrieved 21 April, 2017, from
https://www.ica.se/butiker/service-i-butiker/sjalvscanning/sjalvscanning/
Zagel, C. (2015). Service Fascination: Gaining Competitive Advantage through Experiential
Self-Service Systems. Springer.
Zahra, S. A., & Covin, J. G. (1993). Business strategy, technology policy and firm
performance. Strategic management journal, 14(6), 451-478.
Zeithaml, V. A., Berry, L. L., & Parasuraman, A. (1993). The nature and determinants of
customer expectations of service. Journal of the academy of Marketing Science, 21(1), 1-12.
Zeithaml, V. A., Berry, L. L., & Parasuraman, A. (1996). The behavioral consequences of
service quality. the Journal of Marketing, 31-46.

32
Appendix 1, Questionnaire
Purpose of this survey: The purpose of this survey is to examine how consumers’
experiences and expectations of self-service technologies (self-scanning with portable
scanners and self-checkouts) influence their perception of quality in terms of producing and
consuming the service themselves. The respondents of this survey are anonymous.
Rating system (PLEASE CIRCLE EACH ANSWER):
5 = Strongly Agrees
4 = Agrees
3 = Neither Agrees or Disagrees
2 = Disagrees
1 = Strongly Disagrees
AGE: 0-17 18-24 25-34 35-44
45-54 54-64 65+
Question 1: How did you first find out about self-service technologies in ICA Gruppen AB?
Answer 1: TV commercials Friends & Family Direct Mail
Encounters in store Website Social Media Other
Do not remember
Statement 2: After hearing about self-service technologies, you had high expectations of these
services.
Answer 2: 5 4 3 2 1
Statement 3: ICA AB’s brand gives you high expectations of their self-service technologies.
Answer 3: 5 4 3 2 1
Statement 4: Communication between friends and family about ICA Gruppen AB gives you
high expectations of their self-service technologies.
Answer 4: 5 4 3 2 1
Statement 5: When you hear negative things about self-scanning technologies, your
expectations of ICA Gruppen AB self-service technologies are still high.
Answer 5: 5 4 3 2 1

33
Statement 6: Your expectations of self-service technologies replacing traditional services
(receiving a service from an employee) are high.
Answer 6: 5 4 3 2 1
Statement 7: Self-service technologies are easy to use.
Answer 7: 5 4 3 2 1
Statement 8: Self-service technologies are faster than waiting lines (where a cashier
produces the service for you).
Answer 8: 5 4 3 2 1
Statement 9: Self-service technologies provide clear information of what you are purchasing.
For example, when you scan a product, it shows the price and quantity of that product.
Answer 9: 5 4 3 2 1
Statement 10: Self-service technologies are secure and reliable. For example, making
payments are trustworthy.
Answer 10: 5 4 3 2 1
Statement 11: Your experiences of using self-service technologies are positive.
Answer 11: 5 4 3 2 1
Statement 12: Through your expectations and experiences of self-service technologies, your
overall perception of quality in terms of these services are high/positive.
Answer 12: 5 4 3 2 1
Statement 13: You will continue to use these self-service technologies in the future.
Answer 13: 5 4 3 2 1

34
Appendix 2, one-way ANOVA test of the Questionnaire
Statement 2
Statement 3

35
Statement 4
Statement 5

36
Statement 6
Statement 7
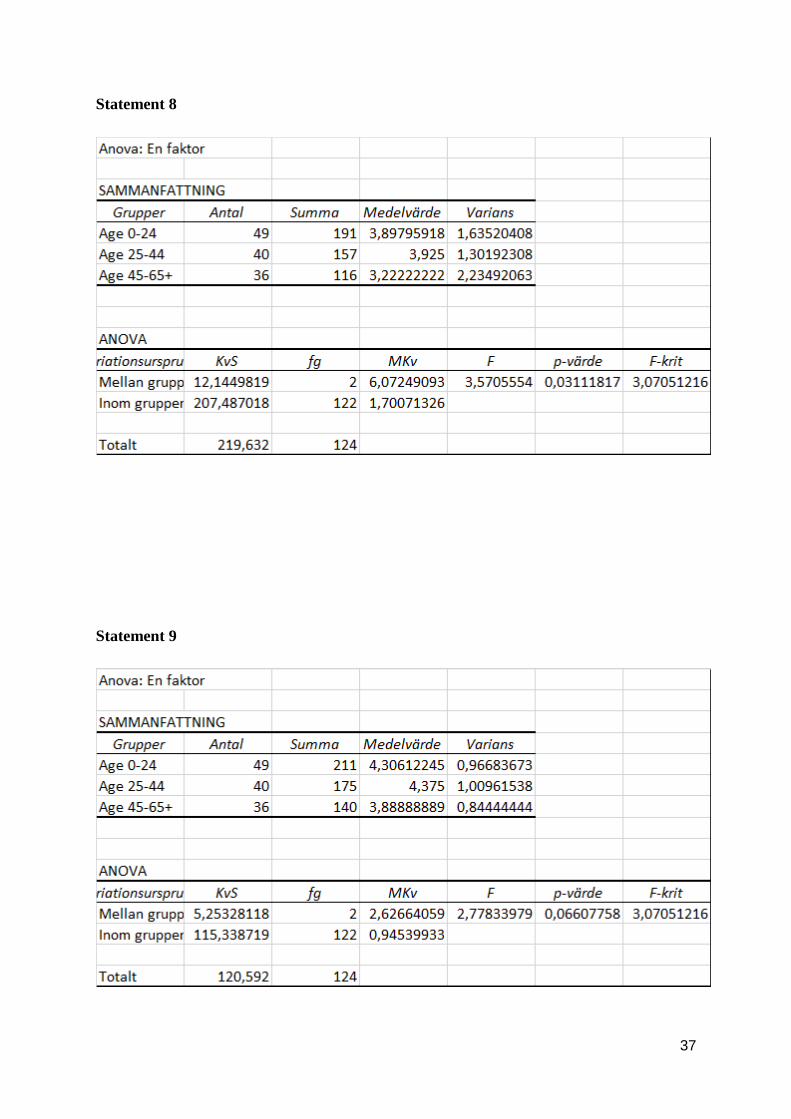
37
Statement 8
Statement 9

38
Statement 10
Statement 11

39
Statement 12
Statement 13