Embed Size (px)
Citation preview
IZA DP No. 4144
Self-Selection and Earnings of Emigrants from aWelfare State
Panu PoutvaaraMartin D. MunkMartin Junge
DI
SC
US
SI
ON
PA
PE
R S
ER
IE
S
Forschungsinstitutzur Zukunft der ArbeitInstitute for the Studyof Labor
April 2009
Self-Selection and Earnings of Emigrants from a Welfare State
Panu Poutvaara University of Helsinki
and IZA
Martin D. Munk Danish National Centre for Social Research (SFI)
Martin Junge
CEBR, Copenhagen Business School
Discussion Paper No. 4144 April 2009
IZA
P.O. Box 7240 53072 Bonn
Germany
Phone: +49-228-3894-0 Fax: +49-228-3894-180
E-mail: [email protected]
Any opinions expressed here are those of the author(s) and not those of IZA. Research published in this series may include views on policy, but the institute itself takes no institutional policy positions. The Institute for the Study of Labor (IZA) in Bonn is a local and virtual international research center and a place of communication between science, politics and business. IZA is an independent nonprofit organization supported by Deutsche Post Foundation. The center is associated with the University of Bonn and offers a stimulating research environment through its international network, workshops and conferences, data service, project support, research visits and doctoral program. IZA engages in (i) original and internationally competitive research in all fields of labor economics, (ii) development of policy concepts, and (iii) dissemination of research results and concepts to the interested public. IZA Discussion Papers often represent preliminary work and are circulated to encourage discussion. Citation of such a paper should account for its provisional character. A revised version may be available directly from the author.
IZA Discussion Paper No. 4144 April 2009
ABSTRACT
Self-Selection and Earnings of Emigrants from a Welfare State*
Following a seminal contribution by Borjas (1987), a large literature has analyzed how income distribution and redistribution are related to immigration to various rich countries. In this paper, we take a look at the other side of the coin. We analyze emigration from Denmark, which is one of the richest and most redistributive European Welfare States. Using comprehensive register data on full population and a unique new representative survey, we analyze whether Danes with relatively high earnings ability favor countries with more unequal income distribution and lower taxes, like the United States. JEL Classification: F22, J61, H2 Keywords: migration, emigration, redistribution, brain drain, education Corresponding author: Panu Poutvaara Department of Economics P.O. Box 17 (Arkadiankatu 7) FI-00014 University of Helsinki Finland E-mail: [email protected]
* An earlier version of this paper was presented at the Annual Meeting of Finnish Economists in Turku and in a seminar at VATT (Government Institute for Economic Research) in February 2008. We thank Mari Kangasniemi and other participants for helpful comments. We are grateful for financial support from the Danish Social Science Research Council (FSE), without implicating the sponsor for the views expressed. We thank Mette Foged, Peter Skov Olsen, and Esben R. Thomasen Bæk for excellent research assistance.
2
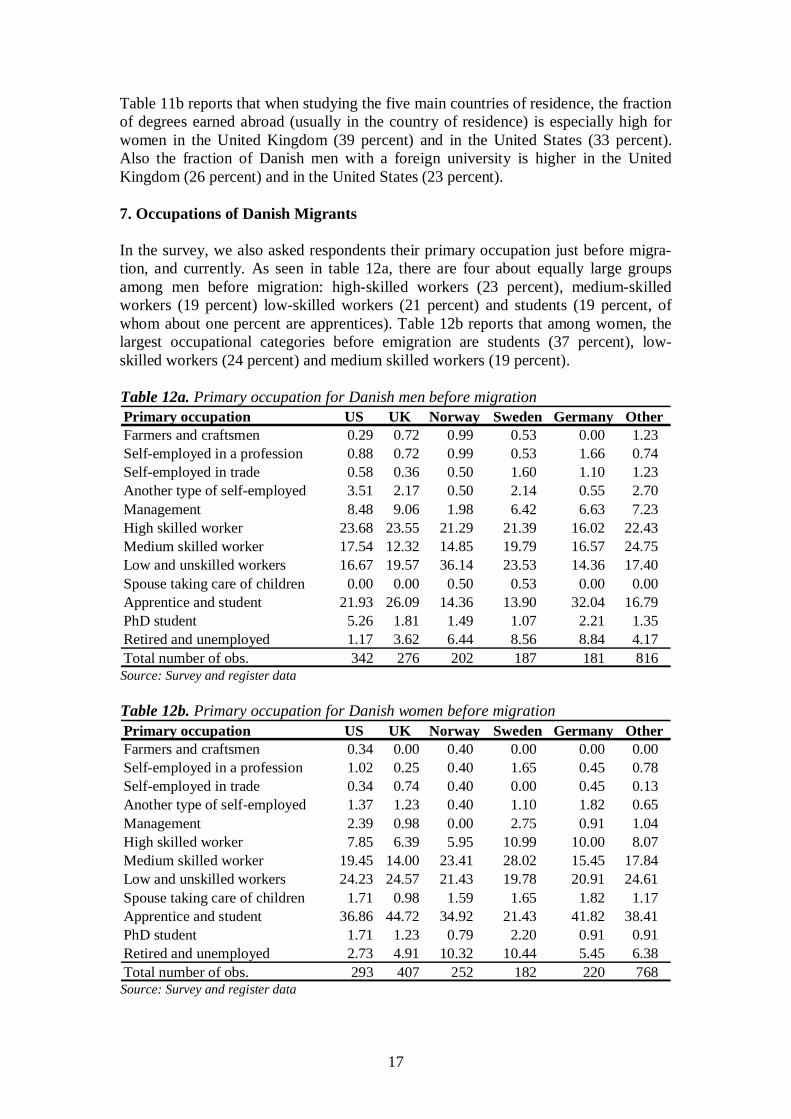
1. Introduction In a seminal contribution, Borjas (1987) analyzed the effect of cross-country differ-ences in income distribution on the self-selection and earnings of immigrants. His main thesis was that the immigrants to the United States tend to come from the upper end of the income distribution if there is a sufficiently high correlation between indi-vidual earnings in the country of origin and expected earnings in the United States, in case of migrating there, and if the country of origin has a more equal income distribu-tion than the United States. Subsequently, Dahl (2002) has analyzed self-selected mi-gration inside the United States and Chiquiar and Hanson (2005) migration from Mexico to the United States. All of these contributions use census data. Using micro panel data for Germany, Dustman (2003) presents and tests a model to analyze the optimal duration of stay for immigrants in Germany. Immigration flows into one country are, by definition, emigration flows for another country. In this paper, we explore this other side of the coin. We analyze emigration from Denmark, which is one of the richest and most redistributive European Welfare States. We compare the characteristics of Danish migrants into different destination countries. In part of the analysis, we compare migration to different country groups, in other parts, we focus on Germany, Norway, Sweden, the United Kingdom, and the United States, which together received 59.0 percent of Danes who emigrated between 1987 and 2002 and still stay abroad, and were aged 18 or more at the time of emigra-tion. Our first research question is to explore the main motivations for emigration for those Danes who stay abroad. The Borjas hypothesis suggests that those looking for higher salaries should be more likely to choose countries with a higher average level of earn-ings, and wider income differences, if they belong themselves on the upper end of earnings distribution. Higher wages and lower taxes should then be a more important motivation for those going to countries like the United States and the United King-dom, than among those choosing other Nordic countries or Western Europe. Corre-spondingly, other motivations should be more important among migrants to other Nordic countries or Western Europe. In our survey, we ask respondents for their main purpose for emigrating, including a higher salary, being posted by the employer, other work-related considerations, studies and improving language skills, family-related motivations and search for adventure. We also ask for a number of economic and pub-lic service considerations (standard of living, wage level, taxation, health care, old-age care and income transfers) whether they were a reason in favor of or against emi-grating. We take a look at gender differences, both generally and separately for main destination countries. Borjas (1987) analyzes only males. Second, how do Danes who have migrated to various destination countries differ from each other, in terms of education and occupation before and after migration? Are there differences in the occupational choices of Danes going to different destinations? Again, we also look for gender differences, and also control for cohort effects. The Borjas hypothesis suggests that migrants choosing the United States and the United Kingdom should be more likely to have higher education and work in managerial or high-skilled positions than those going to other Nordic countries and Continental Europe. Third, what is the earnings distribution of the Danes who emigrate and stay abroad in different countries?
3
The Borjas hypothesis suggests that the Danes who emigrate should come from the upper end of earnings distribution, at least when it comes to Danes who migrate to the United States and other countries with a lower level of redistribution and wider in-come differences than in Denmark. To test this, we compare the educational qualifica-tions and occupations of Danes living in various countries, most notably the United States, the United Kingdom, Sweden, Norway and Germany. Of these countries, the United States and the United Kingdom have lowest level of income redistribution and widest income differences, and are furthest away. Sweden and Norway are very close both culturally and geographically and also have extensive welfare states and narrow income distribution. The language spoken in those countries is very close to Danish. Germany is also a neighboring country, and locates between Scandinavian and Anglo-Saxon countries in the level of redistribution and earnings differences. We also compare earnings in 2007 for Danes who live in different destination coun-tries. Also this analysis is done separately for men and women, due to female average earnings being less than male average earnings in all countries we study. We also compare earnings when restricting the attention to those with Master’s level of educa-tion or more. The observed earnings differences are then likely to capture both unob-served ability differences and cross-country differences in returns to education. Our paper is organized as follows. Section 2 presents a literature review. Section 3 provides an overview of emigration and return migration of Danes from 1987 on-wards. We present total emigration flows for 1987 to 2007, and then study shorter (less than five years) and longer (more than five years) stays for those who emigrated from 1987 to 2003, the data period being chosen to correspond with the survey data. Section 4 summarizes our survey data. In section 5, we present survey results on the main motivation for emigration for Danes going to different destination countries. In section 6, we compare educational qualifications of Danes living in different destinations to each other and to Danes who live in Denmark in 2007. Section 7 reports primary occupations of Danish migrants who stay abroad before migration and in 2007. In Section 8, we use survey data to examine 2007 pre-tax incomes of Danes living in different countries. Section 9 concludes. 2. Earlier Literature Following classical contributions by Roy (1951) and Sjaastad (1962), Borjas (1987) and Chiquiar and Hanson (2005) applied the Roy model to international migration and Dahl (2002) to migration between US states. Borjas (1987) concludes that the theory predicts that the emigration rate is a negative function of mean income in the home country, and a positive function of the mean income in the United States. Empirical results confirm this. Furthermore, the theory proposed by Borjas predicts that the quality of migrants de-pends on the ratio of variances of the income distributions in the source and destina-tion countries. If the correlation between productivity at the countries of origin and the destination country is sufficiently high, then immigrants from countries with less
4
income inequality than in the destination country tend to be of higher quality than immigrants from countries with more income inequality than in the destination coun-try. Empirical analysis shows that while immigrants from countries with more income inequality have lower earnings when there is no control for GNP per capita, such rela-tionship vanishes when the control for GNP per capita is added. This reflects the high negative correlation between income inequality and GNP per capita, driven by the difference between Western Europe and developing countries. Chiquiar and Hanson (2005) test the theory further using US and Mexican census data. They conclude that if Mexican immigrants in the United States were paid according to current skill prices in Mexico, they would be concentrated in the middle of Mexico’s wage distribution. This is inconsistent with the negative selection hypothesis, contradicting findings in Borjas (1987) for immigration to the United States. Therefore, the empirical evidence is mixed. Dahl (2002) uses the Roy model to explain why observed returns to a college educa-tion in local labor markets in the United States vary widely even though workers are highly mobile. His results suggest that self-selection of higher educated individuals to states with higher returns to education plays an important role in explaining observed differences. Most of the literature on migration has focused on immigration into rich countries, or migration from poor to rich countries. Exceptions include Lundborg (1991), examin-ing migration flows from Denmark, Finland and Norway to Sweden from 1968 to 1985. He concludes that migration flows react positively (negatively) to real income and unemployment benefits in the destination (source) country and the unemployment rate in the source (destination) country. Pirttilä (2004) analyzes emigration from Finland. Controlling for a number of other characteristics, highly educated Finns were five times more likely to emigrate than individuals with secondary education only. Using panel data on the number of migrants to 20 OECD countries from 1990 to 2000, Pirttilä concludes that tax rates have a low power in explaining migration flows. 3. Danish Emigration and Return Migration Denmark is a Scandinavian welfare state with a relatively high standard of living, a low level of income inequality, and one of the highest tax rates worldwide. As a member state of the European Union, Denmark participates in the common European labor market, which implemented free mobility of labor in 1993. Nordic countries (Denmark, Finland, Iceland, Norway and Sweden) had implemented free mobility already in 1954. Figure 1 shows the number of emigrants with Danish citizenship in each year from 1987 to 2007. We restrict the attention to those who were aged 18 or more when they emigrated. As a background, one can notice that Denmark was in a recession from 1980’s to 1993 with a small recovery from 1984 to 1987. From 1993 onwards, there was a long boom with a small recession from 2000 to 2002.
5
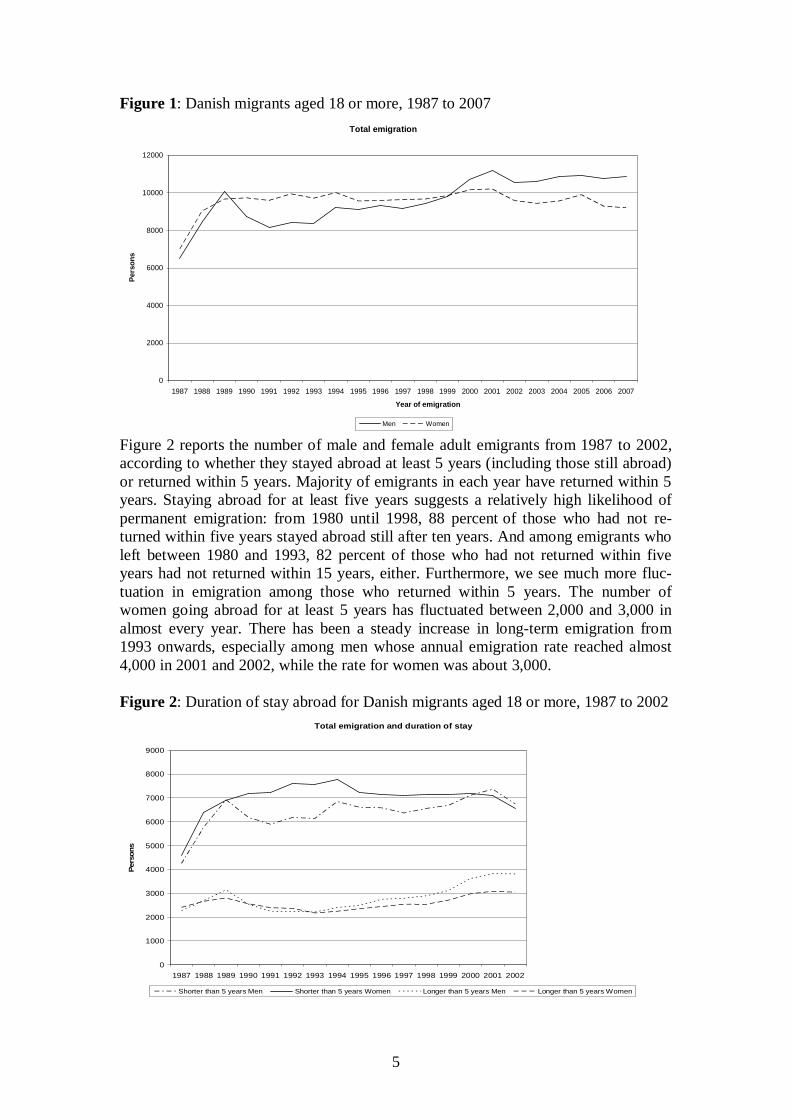
Figure 1: Danish migrants aged 18 or more, 1987 to 2007 Total emigration
0
2000
4000
6000
8000
10000
12000
1987 1988 1989 1990 1991 1992 1993 1994 1995 1996 1997 1998 1999 2000 2001 2002 2003 2004 2005 2006 2007
Year of emigration
Pers
ons
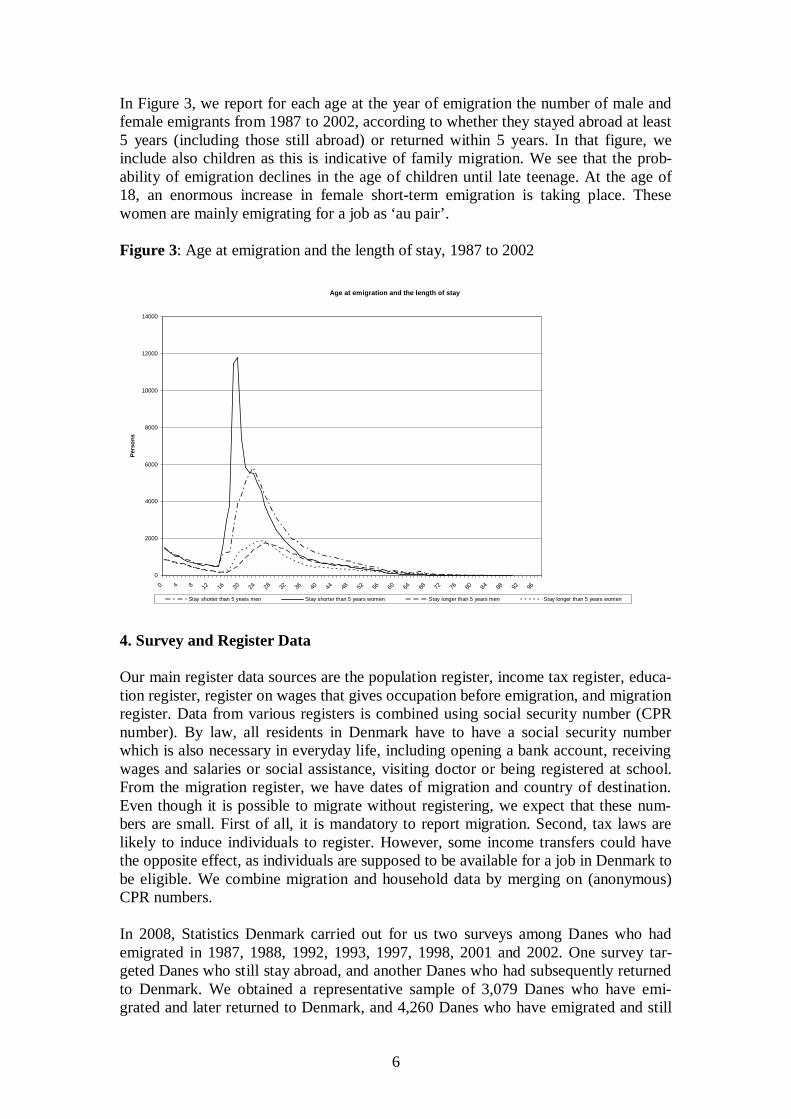
Men Women Figure 2 reports the number of male and female adult emigrants from 1987 to 2002, according to whether they stayed abroad at least 5 years (including those still abroad) or returned within 5 years. Majority of emigrants in each year have returned within 5 years. Staying abroad for at least five years suggests a relatively high likelihood of permanent emigration: from 1980 until 1998, 88 percent of those who had not re-turned within five years stayed abroad still after ten years. And among emigrants who left between 1980 and 1993, 82 percent of those who had not returned within five years had not returned within 15 years, either. Furthermore, we see much more fluc-tuation in emigration among those who returned within 5 years. The number of women going abroad for at least 5 years has fluctuated between 2,000 and 3,000 in almost every year. There has been a steady increase in long-term emigration from 1993 onwards, especially among men whose annual emigration rate reached almost 4,000 in 2001 and 2002, while the rate for women was about 3,000. Figure 2: Duration of stay abroad for Danish migrants aged 18 or more, 1987 to 2002
Total emigration and duration of stay
0
1000
2000
3000
4000
5000
6000
7000
8000
9000
1987 1988 1989 1990 1991 1992 1993 1994 1995 1996 1997 1998 1999 2000 2001 2002
Year of emigration
Pers
ons
Shorter than 5 years Men Shorter than 5 years Women Longer than 5 years Men Longer than 5 years Women
6
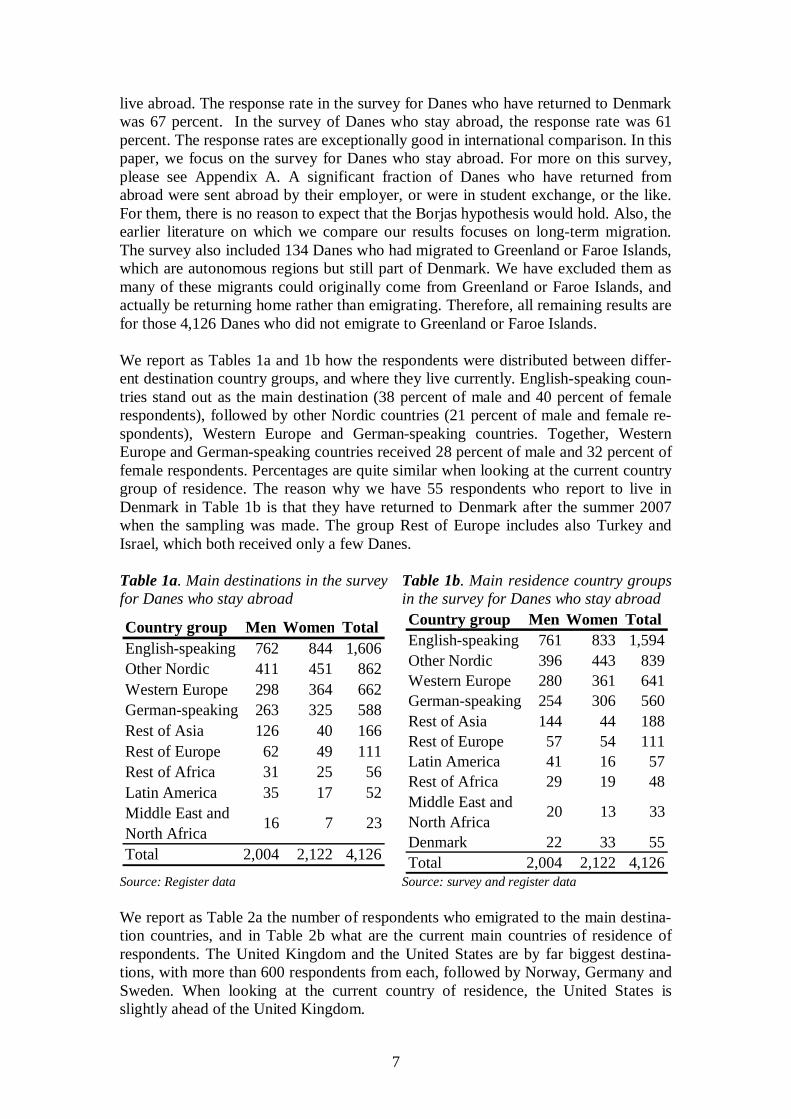
In Figure 3, we report for each age at the year of emigration the number of male and female emigrants from 1987 to 2002, according to whether they stayed abroad at least 5 years (including those still abroad) or returned within 5 years. In that figure, we include also children as this is indicative of family migration. We see that the prob-ability of emigration declines in the age of children until late teenage. At the age of 18, an enormous increase in female short-term emigration is taking place. These women are mainly emigrating for a job as ‘au pair’. Figure 3: Age at emigration and the length of stay, 1987 to 2002
Age at emigration and the length of stay
0
2000
4000
6000
8000
10000
12000
14000
0 4 8 12 16 20 24 28 32 36 40 44 48 52 56 60 64 68 72 76 80 84 88 92 96
Age
Pers
ons
Stay shorter than 5 years men Stay shorter than 5 years women Stay longer than 5 years men Stay longer than 5 years women
4. Survey and Register Data Our main register data sources are the population register, income tax register, educa-tion register, register on wages that gives occupation before emigration, and migration register. Data from various registers is combined using social security number (CPR number). By law, all residents in Denmark have to have a social security number which is also necessary in everyday life, including opening a bank account, receiving wages and salaries or social assistance, visiting doctor or being registered at school. From the migration register, we have dates of migration and country of destination. Even though it is possible to migrate without registering, we expect that these num-bers are small. First of all, it is mandatory to report migration. Second, tax laws are likely to induce individuals to register. However, some income transfers could have the opposite effect, as individuals are supposed to be available for a job in Denmark to be eligible. We combine migration and household data by merging on (anonymous) CPR numbers. In 2008, Statistics Denmark carried out for us two surveys among Danes who had emigrated in 1987, 1988, 1992, 1993, 1997, 1998, 2001 and 2002. One survey tar-geted Danes who still stay abroad, and another Danes who had subsequently returned to Denmark. We obtained a representative sample of 3,079 Danes who have emi-grated and later returned to Denmark, and 4,260 Danes who have emigrated and still
7
live abroad. The response rate in the survey for Danes who have returned to Denmark was 67 percent. In the survey of Danes who stay abroad, the response rate was 61 percent. The response rates are exceptionally good in international comparison. In this paper, we focus on the survey for Danes who stay abroad. For more on this survey, please see Appendix A. A significant fraction of Danes who have returned from abroad were sent abroad by their employer, or were in student exchange, or the like. For them, there is no reason to expect that the Borjas hypothesis would hold. Also, the earlier literature on which we compare our results focuses on long-term migration. The survey also included 134 Danes who had migrated to Greenland or Faroe Islands, which are autonomous regions but still part of Denmark. We have excluded them as many of these migrants could originally come from Greenland or Faroe Islands, and actually be returning home rather than emigrating. Therefore, all remaining results are for those 4,126 Danes who did not emigrate to Greenland or Faroe Islands. We report as Tables 1a and 1b how the respondents were distributed between differ-ent destination country groups, and where they live currently. English-speaking coun-tries stand out as the main destination (38 percent of male and 40 percent of female respondents), followed by other Nordic countries (21 percent of male and female re-spondents), Western Europe and German-speaking countries. Together, Western Europe and German-speaking countries received 28 percent of male and 32 percent of female respondents. Percentages are quite similar when looking at the current country group of residence. The reason why we have 55 respondents who report to live in Denmark in Table 1b is that they have returned to Denmark after the summer 2007 when the sampling was made. The group Rest of Europe includes also Turkey and Israel, which both received only a few Danes. Table 1a. Main destinations in the survey for Danes who stay abroad
Table 1b. Main residence country groups in the survey for Danes who stay abroad
Country group Men Women TotalEnglish-speaking 762 844 1,606Other Nordic 411 451 862Western Europe 298 364 662German-speaking 263 325 588Rest of Asia 126 40 166Rest of Europe 62 49 111Rest of Africa 31 25 56Latin America 35 17 52
Total 2,004 2,122 4,126
Middle East and North Africa 16 7 23
Country group Men Women TotalEnglish-speaking 761 833 1,594Other Nordic 396 443 839Western Europe 280 361 641German-speaking 254 306 560Rest of Asia 144 44 188Rest of Europe 57 54 111Latin America 41 16 57Rest of Africa 29 19 48
Denmark 22 33 55Total 2,004 2,122 4,126
Middle East and North Africa
20 13 33
Source: Register data Source: survey and register data We report as Table 2a the number of respondents who emigrated to the main destina-tion countries, and in Table 2b what are the current main countries of residence of respondents. The United Kingdom and the United States are by far biggest destina-tions, with more than 600 respondents from each, followed by Norway, Germany and Sweden. When looking at the current country of residence, the United States is slightly ahead of the United Kingdom.
8
For some countries, there are clear gender differences. Men are in majority among respondents from the United States, and women among respondents from France (64 percent), the United Kingdom (60 percent), Norway (57 percent), and Germany (55 percent). The number of male and female respondents is almost the same in Sweden, Switzerland, and Australia. Table 2a. Main destination countries in the survey for Danes who stay abroad
Table 2b. Main countries of residence in the survey for Danes who stay abroad
Country Men Women TotalUnited Kingdom 276 407 683United States 342 293 635Norway 202 252 454Germany 181 220 401Sweden 187 182 369France 66 106 172Switzerland 73 89 162Australia 79 73 152Spain 63 51 114Netherlands 53 60 113Other 482 389 871Total 2,004 2,122 4,126
Country Men Women TotalUnited States 360 294 654United Kingdom 255 393 648Norway 191 251 442Germany 161 200 361Sweden 182 177 359Switzerland 83 89 172Australia 85 82 167France 54 96 150Spain 62 59 121Netherlands 53 64 117Denmark 22 33 55Other 496 384 880Total 2,004 2,122 4,126
Source: Register data Source: survey and register data 5. Main Motivations to Emigrate and Stay Abroad 5.1. Main purpose of Emigration In our survey, we asked each respondent to pick his or her main motivation to emi-grate. We have combined different motivations into those related to own work (in-cludes being sent by employer, fixed-term appointment, obtaining a more interesting job, limited job opportunities in Denmark, or better pay abroad), studies and language, partner and other family considerations and other motivations (among which search for adventure was most prominent). In the table 3, we see that most Danes who emi-grated and stay abroad were motivated by either job or family considerations. We find a big gender difference in emigration motivations. Majority of men (53 percent) list considerations related to own work as main motivation to emigrate, and 19 percent list family considerations. For women, the results are almost the opposite: 22 percent list work-related motivations, and 47 percent family considerations. Studies were initially main motivation for 9 percent of men and 11 percent of women.
9
Table 3. Main purpose of emigration
Men WomenPct. Pct Freq. Pct.
Own work 53.44 21.91 1,536 37.23Being sent by employer 19.06 4.76 483 11.71Other work-related 34.38 17.15 1053 25.52
Partner and family 18.61 47.17 1,374 33.30Migrating to live with a partner 11.78 30.11 875 21.21Other family-related 6.84 17.06 499 12.09
Studies and language 9.28 11.07 421 10.20Adventure 11.63 11.88 485 11.75Other motivations 18.66 19.84 310 7.51Total number of obs. 2,004 2,122 4,126 4,126
TotalConsiderations related to:
Source: Survey data
In Tables 4a and 4b, we report the main motivations to emigrate according to the des-tination, again separately for men and women. There are marked differences between different regions. Own work stands out as main motivation especially for Africa, Asia and Latin America, where 73 percent of men and 34 percent of women pick it. Partner and family is most important for 29 percent of men going to other Nordic countries, 18 percent of men going to English-speaking countries and Western Europe, and less for other destinations. Among women, partner and family is picked by 55 percent in the small group going to the rest of Europe, and quite evenly by 45 to 49 percent among women emigrating to all other destination groups. Studies and language stand out with 13 percent among men going to English-speaking and German-speaking countries. Among women, studies and language are the main motivation for 15 per-cent going to English-speaking countries, and 13 percent going to Western Europe or German-speaking countries. Somewhat surprisingly, both male and female emigrants to English-speaking countries list adventure as main motivation more often than those going to other destinations. Table 4a. Main purpose of emigration for Danish men
MotivationsEnglish-speaking countries
Other Nordic
countries
Western Europe
German-speaking countries
Other European countries
Africa,Asia and Latin America
Own work 48.16 45.26 56.71 58.94 67.74 73.08Partner and family 18.24 29.20 18.12 13.31 14.52 7.69Studies and language 12.86 6.33 7.72 13.31 3.23 0.96Adventure 14.44 8.27 10.74 10.27 8.06 12.02Other motivations 6.30 10.95 6.71 4.18 6.45 6.25Total number of obs. 762 411 298 263 62 208 Source: Survey and register data
10
Table 4b. Main purpose of emigration for Danish women
MotivationsEnglish-speaking countries
Other Nordic
countries
Western Europe
German-speaking countries
Other European countries
Africa,Asia and Latin America
Own work 16.82 23.73 26.65 24.31 20.41 33.71Partner and family 45.50 48.56 46.15 49.23 55.10 48.31Studies and language 14.93 2.88 13.46 12.92 4.08 3.37Adventure 15.28 10.64 8.79 8.92 12.24 8.99Other motivations 7.46 14.19 4.95 4.62 8.16 5.62Total number of obs. 844 451 364 325 49 89 Source: Survey and register data If restricting the attention to emigrants who were in the work force before emigration, the general patterns do not change much, apart from a smaller fraction picking studies and language as the main motivation, and more picking work. Those tables are in Ap-pendix B. When restricting the attention to the main destination countries (Tables 5a and 5b), we also find big cross-country differences. Work-related considerations are especially pronounced for men going to the United Kingdom (60 percent), while among men going to Sweden and Norway, work was main motivation for only 43 percent, and family considerations for 27-30 percent. Family considerations were main motivation for 56 percent of women going to the United States, 53 percent of women going to Sweden, and 48 percent going to Germany. All in all, this suggests that the selection effects of the Borjas hypothesis should be much more important for men than for women. A similar pattern arises when analyzing only those emigrants who were in the work force before emigration, as can be seen from tables in Appendix B. Table 5a. Main purpose of emigration for Danish men Motivations US UK Norway Sweden Germany OtherOwn work 50.88 57.25 44.55 46.52 56.35 56.37Partner and family 19.88 10.51 29.21 27.27 12.15 17.65Studies and language 12.57 17.03 6.93 4.81 16.57 5.27Adventure 11.11 10.87 14.36 2.67 10.50 13.73Other motivations 5.56 4.35 4.95 18.72 4.42 6.99Total number of obs. 342 276 202 187 181 816 Source: Survey and register data Table 5b Main purpose of emigration for Danish women Motivations US UK Norway Sweden Germany OtherOwn work 17.06 17.20 26.59 19.78 25.00 24.35Partner and family 53.24 36.61 46.43 52.20 49.09 48.96Studies and language 11.95 20.15 2.78 3.30 13.18 9.90Adventure 9.56 17.94 15.08 3.85 7.73 11.59Other motivations 8.19 8.11 9.13 20.88 5.00 5.21Total number of obs. 293 407 252 182 220 768 Source: Survey and register data
11
We also asked respondents on a number of considerations whether they were a reason in favor of or against emigrating. We report below for a number of questions related to income distribution and the welfare state which fraction of respondents considered each issue an argument in favor of or against emigrating. Table 6a. Economic and public service considerations related to migration for Dan-ish men Considerations related to:
In favor of emigrating
Neutral Against emigrating
Not relevant
Total no. of obs.
Standard of living 47.36 28.84 7.04 16.77 2004Wage level 58.43 21.06 6.19 14.32 2004Taxation 54.84 20.66 2.45 22.06 2004Daycare 14.33 36.26 21.05 28.36 342Schools 32.75 32.75 18.71 15.79 342Health care 10.08 35.23 22.50 32.19 2004Old-age care 1.80 27.15 19.46 51.60 2004Public pensions 1.25 26.50 16.87 55.39 2004Other transfers 1.65 26.50 14.42 57.44 2004
Source: Survey data Table 6b. Economic and public service considerations related to migration for Dan-ish women Considerations related to:
In favor of emigrating
Neutral Against emigrating
Not relevant
Total no. of obs.
Standard of living 32.09 26.15 9.38 32.38 2122Wage level 28.84 25.78 12.91 32.47 2122Taxation 27.80 22.48 2.78 46.94 2122Daycare 16.82 26.79 22.12 34.27 321Schools 34.27 24.92 16.82 23.99 321Health care 9.05 26.25 18.57 46.14 2122Old-age care 1.46 21.21 17.44 59.90 2122Public pensions 0.80 20.69 16.02 62.49 2122Other transfers 1.18 21.87 11.59 65.36 2122
Source: Survey data For men, wages, taxation and the standard of living stand out as considerations in fa-vor of emigrating. These are also considerations in favor of emigration for women, though for a smaller fraction. The considerably larger fraction of women reporting these considerations as less relevant is related to a large fraction of women emigrating because of a partner. Tables 6a and 6b tell that the Danish welfare state is viewed as a reason against emi-grating especially when it comes to old-age care, public pensions and other transfers. Among both men and women, less than 2 percent see any of these as a reason in favor of emigrating, and 14-19 percent of men and 12-17 percent of women as a reason against emigrating. Concerning health care, opinions are more divided, with 23 per-
12
cent of men and 19 percent of women seeing health care as a motivation to stay in Denmark, and 10 percent of men and 9 percent of women seeing it as a motivation to emigrate. We also asked parents with children about schools and daycare. Here, the results for the Danish welfare state are less positive than concerning old-age care and transfers. 21 percent of men and 22 percent of women see daycare as an argument against emi-grating, and 14 percent of men and 17 percent of women as an argument in favor of emigrating. Schools are an argument in favor of emigrating for 33 percent of men and 34 percent of women, and an argument against emigrating for 19 percent of men and 17 percent of women. When interpreting the figures, it is important to highlight that these are opinions of Danes who stay abroad, and that the answers reflect the respon-dent’s personal situation. We also analyzed main economic and public service considerations, according to the destination country group. These are reported as Tables 7a and 7b. Table 7a. Economic and public service considerations related to migration for men according to destination
For Against For Against For Against For Against For Against For AgainstStandard of living 48.4 9.6 37.5 4.6 51.7 6.4 45.6 4.6 43.6 12.9 60.1 4.8Wage level 62.9 4.7 39.9 8.0 58.1 10.1 59.7 6.5 79.0 4.8 71.6 2.4Taxation 60.9 2.1 34.6 3.4 53.0 3.4 57.0 1.5 67.7 3.2 68.6 1.4Health care 5.9 31.4 13.1 7.3 15.4 20.1 16.4 10.7 3.2 35.5 5.8 34.6Old-age care 0.8 26.4 4.1 6.3 1.3 16.8 2.7 12.9 0.0 27.4 1.0 29.8Public pensions 0.8 23.6 3.2 3.9 1.3 16.1 0.8 10.7 0.0 27.4 0.0 23.6Other transfers 0.8 20.5 2.2 4.4 1.7 13.4 3.0 8.4 1.6 22.6 1.9 18.8
Considerations related to:
English-speaking countries
Other Nordic
countries
Western Europe
German-speaking countries
Other European countries
Africa,Asia and Latin America
Source: Survey and register data Table 7b. Economic and public service considerations for women according to des-tination
For Against For Against For Against For Against For Against For AgainstStandard of living 31.3 14.1 29.3 2.7 34.9 10.2 31.1 4.3 30.6 18.4 47.2 9.0Wage level 30.3 14.5 24.2 6.7 26.1 19.0 35.1 10.5 14.3 22.5 34.8 9.0Taxation 33.3 4.2 21.7 2.0 25.3 1.9 27.1 1.5 16.3 2.0 25.8 2.3Health care 5.2 30.8 6.9 5.1 13.7 15.7 18.2 6.8 4.08 22.5 6.7 23.6Old-age care 1.0 27.7 2.4 3.6 1.7 15.4 1.9 10.5 0.0 24.5 0.0 20.2Public pensions 0.1 26.3 1.6 2.9 1.1 14.0 1.2 8.9 2.0 24.5 0.0 14.6Other transfers 1.2 19.7 1.8 2.2 0.8 9.6 0.9 5.9 2.0 12.2 0.0 11.2
Considerations related to:
English-speaking countries
Other Nordic
countries
Western Europe
German-speaking countries
Other European countries
Africa,Asia and Latin America
Source: Survey and register data
Tables 7a and 7b reveal that the tax side is a consideration in favor of emigrating for more than half of men going to all other destinations than other Nordic countries, and
13
even among men going to other Nordic countries, 35 percent saw differences in taxa-tion as a reason to emigrate and 3 percent as a reason not to emigrate. For women, differences are smaller, taxation being a reason to emigrate for 33 percent and a rea-son against emigrating for 4 percent of women going to English-speaking countries. Old-age care, public pensions and other income transfers are seen as a reason against emigration for those going outside the Nordic countries. Opinions about health care are more mixed. Those going to other Nordic countries or German-speaking countries see health care more often as a reason in favor of than against emigration, while those going to English-speaking countries, rest of Europe or Africa, Asia and Latin America see health care predominantly as an argument against migration. Tables 8a and 8b present corresponding results for the 5 main destination countries. Table 8a. Economic and public service considerations for men according to destina-tion country
In favor Against In favor Against In favor Against In favor Against In favor Against
Standard of living56.43 4.39 40.58 17.39 33.66 3.47 43.85 6.42 39.23 6.08Wage level 69.30 2.63 65.94 5.80 50.50 2.48 31.55 12.83 53.04 8.84Taxation 60.23 2.05 61.59 2.54 41.58 3.96 27.81 3.21 51.93 2.21Health care 8.19 31.58 3.99 36.23 9.41 5.94 17.65 8.56 14.36 11.60Old-age care 0.58 27.49 1.09 27.90 2.48 5.45 5.88 6.42 1.66 14.36Public pensions 0.88 24.56 0.36 23.19 2.97 4.46 3.21 2.67 0.55 11.05Other transfers 0.58 19.59 0.72 21.74 2.48 3.96 2.14 3.74 2.21 6.63
Considerations related to:
US UK Norway Sweden Germany
Source: Survey and register data Table 8b. Economic and public service considerations for women according to desti-nation country
In favor Against In favor Against In favor Against In favor Against In favor Against
Standard of living41.30 6.83 20.39 20.88 23.81 1.19 39.01 4.40 26.82 4.09Wage level 35.15 7.17 30.22 17.20 32.14 0.79 14.84 14.29 29.55 12.73Taxation 32.76 3.07 32.19 5.16 22.22 1.19 21.98 3.30 24.55 1.36Health care 9.90 34.13 1.97 29.73 4.37 3.97 10.44 7.14 17.27 6.36Old-age care 1.02 31.06 0.74 26.78 2.38 3.17 2.75 4.40 2.27 11.36Public pensions 0.00 31.40 0.25 23.10 2.78 1.98 0.00 4.40 1.36 9.55Other transfers 2.39 22.87 0.49 18.67 2.38 1.19 1.10 3.85 1.36 6.36
Considerations related to:
US UK Norway Sweden Germany
Source: Survey and register data The standard of living is viewed more often as a reason to migrate to the United States than to the United Kingdom. Among men who migrated to the United States, 56 per-cent viewed the standard of living as a reason to migrate and 4 percent against migrat-ing, while the corresponding numbers to the United Kingdom were 41 and 17 percent. Among women who migrated to the United States, 41 percent viewed the standard of living as a reason to emigrate and 7 percent against emigrating, while the correspond-ing numbers to the United Kingdom were 20 and 21 percent. When comparing Swe-den and Norway, a larger fraction views the standard of living as a reason to migrate to Sweden, while a larger fraction views wage level and taxes as a reason to migrate to Norway.
14
6. Education of Danes Abroad and in Denmark How does skill distribution of emigrants to various countries differ? Do Danes with higher education tend to emigrate more to countries with larger income differences? To answer these questions, we have asked in our survey respondents to report also their current highest level of education. In Table 9a, we report the educational qualifi-cations of Danish men and women who stay abroad, and were aged at most 58. We decided to exclude three persons aged 61, 66, and 68, in order to have a narrower age group to compare with Danes living in Denmark. In Table 9b, we report the educa-tional qualifications of Danes aged 25 to 57 who stayed in Denmark in 2007. The age group is chosen to match closely the age range in table 9a; in the latter, there is just one respondent aged 24 and 3 aged 58, outside the range.
Table 9a. Education of Danes abroad in 2007; survey for stayers Highest level of education Men WomenBasic school 2.40 2.59General upper secondary 6.30 8.34Vocational upper secondary 3.80 4.01Vocational education and training 14.14 11.92Short higher 8.50 7.78Medium higher 6.80 17.15Bachelor degree 16.34 17.81Long higher 32.73 25.49Doctoral degree or equivalent 9.00 4.90Total 100.00 100.00 Source: Survey and register data
Table 9b. Education of Danes aged 25-57 in 2007 Highest level of education Men WomenBasic school 22.92 21.70General upper secondary 4.57 4.90Vocational upper secondary 2.06 2.10Vocational education and training 41.25 34.99Short higher 7.35 5.16Medium higher 9.87 20.67Bachelor degree 1.97 2.45Long higher 8.00 6.75Doctoral degree or equivalent 0.63 0.34Unknown 1.37 0.95Total number of obs. 1,165,570 1,140,658 Source: Register data
Comparing Tables 9a and 9b, we notice that the Danish respondents abroad are much better educated than the Danes who stay in Denmark. In Denmark, 23 percent of men and 22 percent of women aged 25-57 have only basic education. Among Danes abroad, the fraction is only 2-3 percent. At the other end, less than one percent of men and women aged 25 to 57 in Denmark have doctoral degree, and the total number of those with Master’s degree is 8 percent for men and 7 percent for women. Among
15
Danes abroad, 33 percent of men and 25 percent of women have Master’s degree and 9 percent of men and 5 percent of women doctoral degree. In Tables 10a and 10b, we report the distribution of highest completed education for Danish men and women who responded our survey and live abroad, according to where they live. For point of comparison, we have included as last column the group of Danes who have returned to Denmark, but still responded to our survey.
Table 10a. Education of Danish men abroad
Highest level of education
English-speaking countries
Other Nordic
countries
Western Europe
German-speaking countries
Other European countries
Africa,Asia and Latin America
DK
Basic school 1.97 5.05 2.52 0.79 1.75 1.29 0.00General upper secondary 6.18 5.56 5.04 4.72 3.51 11.59 9.09
Vocational upper secundary 4.20 3.28 3.60 4.33 1.75 3.43 4.55
Vocational education and training
12.35 21.72 8.27 12.99 26.32 13.73 0.00
Short higher 6.96 8.08 9.35 10.63 17.54 9.01 4.55Medium higher 3.81 11.62 10.43 6.30 5.26 4.72 9.09Bachelor degree 18.40 9.60 12.23 20.08 17.54 21.46 18.18Long higher 33.38 27.78 39.93 33.07 22.81 31.76 40.91Doctoral degree or equivalent 12.75 7.32 8.63 7.09 3.51 3.00 13.64
Total no. of obs. 761 396 278 254 57 233 22 Source: Survey and register data
Table 10b. Education of Danish women abroad
Highest level of education
English-speaking countries
Other Nordic
countries
Western Europe
German-speaking countries
Other European countries
Africa,Asia and Latin America
DK
Basic school 2.76 2.26 2.49 2.61 3.70 3.26 0.00General upper secondary 8.28 7.90 8.86 7.84 18.52 6.52 3.03
Vocational upper secundary 3.84 2.48 5.54 5.56 3.70 2.17 3.03
Vocational education and training
10.56 11.74 8.86 19.28 12.96 10.87 15.15
Short higher 7.80 6.32 9.14 8.82 7.41 4.35 12.12Medium higher 14.05 27.09 13.02 15.36 20.37 13.04 30.30Bachelor degree 24.13 12.87 16.62 10.78 16.67 17.39 6.06Long higher 22.09 23.48 33.24 27.12 16.67 35.87 24.24Doctoral degree or equivalent 6.48 5.87 2.22 2.61 0.00 6.52 6.06
Total no. of obs. 833 443 361 306 54 92 33 Source: Survey and register data
16
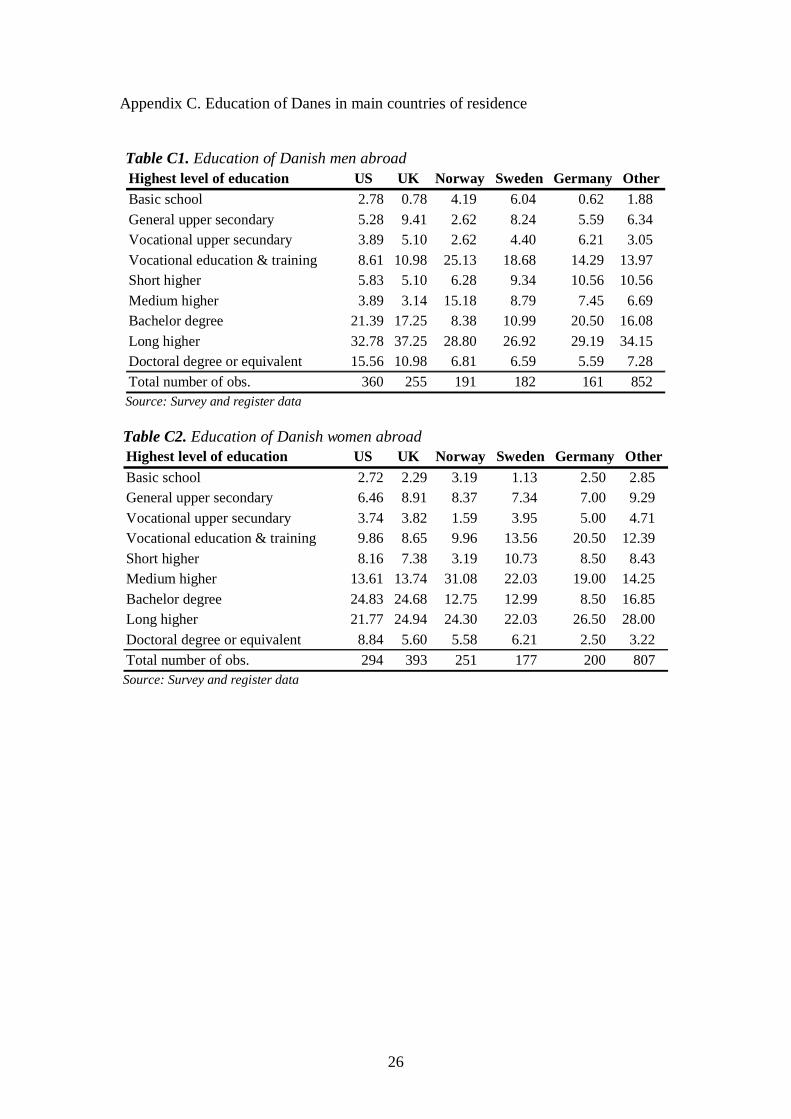
Interestingly, we find that those who have returned to Denmark have a somewhat higher level of education than those who stay abroad. This runs counter to what the theoretical model by Borjas and Bratsberg (1996) predicts and what their empirical analysis for the United States suggests, namely that return migration intensifies the type of selection that generated the immigrant flow in the first place. If that were the case, Danes who returned to Denmark should be of lower educational level than those who stay. Tables 10a and 10b suggest that there are big differences in the level of education of Danes abroad living in different countries. The differences are especially pronounced among men. Danish men in English-speaking countries, Western Europe and Ger-man-speaking countries are especially well educated. Among women, the fraction of those with doctoral degree or long higher education is, somewhat surprisingly, highest among those living in Africa, Asia and Latin America. However, the number of women living in those countries is only 92, while the number of men is 233. In all other destinations, gender differences are smaller, pointing to a strong selection effect. We report educational qualifications for Danish men and women in the five main des-tination countries in Appendix C. When taking into account both doctoral degrees and Master’s degree or corresponding, the fraction of Danish men with long higher educa-tion reaches 48 percent in the United States, 47 percent in the United Kingdom, and 34-36 percent in Norway, Sweden and Germany. Among women, the fraction varies from 31 percent in the United States and the United Kingdom to about 29 percent in Norway, Sweden and Germany. To sum up: the traction of Danes with higher educa-tion is clearly larger in the United States and in the United Kingdom than in Norway, Sweden and Germany, or in the rest of the world in average. The finding that the Danes with higher education are more likely to migrate to Anglo-Saxon countries with higher returns to education and less income redistribution is very much in line with the logic suggested by the Borjas model. In table 11a, we report for various country groups the fraction of men and women who have a university degree earned abroad. This fraction is especially high in Eng-lish-speaking countries, Western Europe, and Asia, Africa and Latin America. In all other country groups but the rest of Europe, consisting of Eastern European countries, Turkey and Israel, a larger fraction of women than of men have obtained a university degree abroad. Table 11a. Fraction of Danes with a university degree from abroad
English-speaking countries
Other Nordic
countries
Western Europe
German-speaking countries
Other European countries
Africa,Asia and Latin America
DK
Men 22.86 11.36 16.19 10.63 12.28 15.02 13.64Women 33.37 12.87 17.17 12.75 11.11 17.39 18.18 Source: Survey and register data
Table 11b. Fraction of Danes with a university degree from abroad
US UK Norway Sweden Germany OtherMen 23.06 25.88 8.90 13.19 8.70 15.49Women 33.33 38.68 10.76 14.12 13.00 16.85 Source: Survey and register data
17
Table 11b reports that when studying the five main countries of residence, the fraction of degrees earned abroad (usually in the country of residence) is especially high for women in the United Kingdom (39 percent) and in the United States (33 percent). Also the fraction of Danish men with a foreign university is higher in the United Kingdom (26 percent) and in the United States (23 percent). 7. Occupations of Danish Migrants In the survey, we also asked respondents their primary occupation just before migra-tion, and currently. As seen in table 12a, there are four about equally large groups among men before migration: high-skilled workers (23 percent), medium-skilled workers (19 percent) low-skilled workers (21 percent) and students (19 percent, of whom about one percent are apprentices). Table 12b reports that among women, the largest occupational categories before emigration are students (37 percent), low-skilled workers (24 percent) and medium skilled workers (19 percent). Table 12a. Primary occupation for Danish men before migration Primary occupation US UK Norway Sweden Germany OtherFarmers and craftsmen 0.29 0.72 0.99 0.53 0.00 1.23Self-employed in a profession 0.88 0.72 0.99 0.53 1.66 0.74Self-employed in trade 0.58 0.36 0.50 1.60 1.10 1.23Another type of self-employed 3.51 2.17 0.50 2.14 0.55 2.70Management 8.48 9.06 1.98 6.42 6.63 7.23High skilled worker 23.68 23.55 21.29 21.39 16.02 22.43Medium skilled worker 17.54 12.32 14.85 19.79 16.57 24.75Low and unskilled workers 16.67 19.57 36.14 23.53 14.36 17.40Spouse taking care of children 0.00 0.00 0.50 0.53 0.00 0.00Apprentice and student 21.93 26.09 14.36 13.90 32.04 16.79PhD student 5.26 1.81 1.49 1.07 2.21 1.35Retired and unemployed 1.17 3.62 6.44 8.56 8.84 4.17Total number of obs. 342 276 202 187 181 816 Source: Survey and register data Table 12b. Primary occupation for Danish women before migration Primary occupation US UK Norway Sweden Germany OtherFarmers and craftsmen 0.34 0.00 0.40 0.00 0.00 0.00Self-employed in a profession 1.02 0.25 0.40 1.65 0.45 0.78Self-employed in trade 0.34 0.74 0.40 0.00 0.45 0.13Another type of self-employed 1.37 1.23 0.40 1.10 1.82 0.65Management 2.39 0.98 0.00 2.75 0.91 1.04High skilled worker 7.85 6.39 5.95 10.99 10.00 8.07Medium skilled worker 19.45 14.00 23.41 28.02 15.45 17.84Low and unskilled workers 24.23 24.57 21.43 19.78 20.91 24.61Spouse taking care of children 1.71 0.98 1.59 1.65 1.82 1.17Apprentice and student 36.86 44.72 34.92 21.43 41.82 38.41PhD student 1.71 1.23 0.79 2.20 0.91 0.91Retired and unemployed 2.73 4.91 10.32 10.44 5.45 6.38Total number of obs. 293 407 252 182 220 768 Source: Survey and register data
18
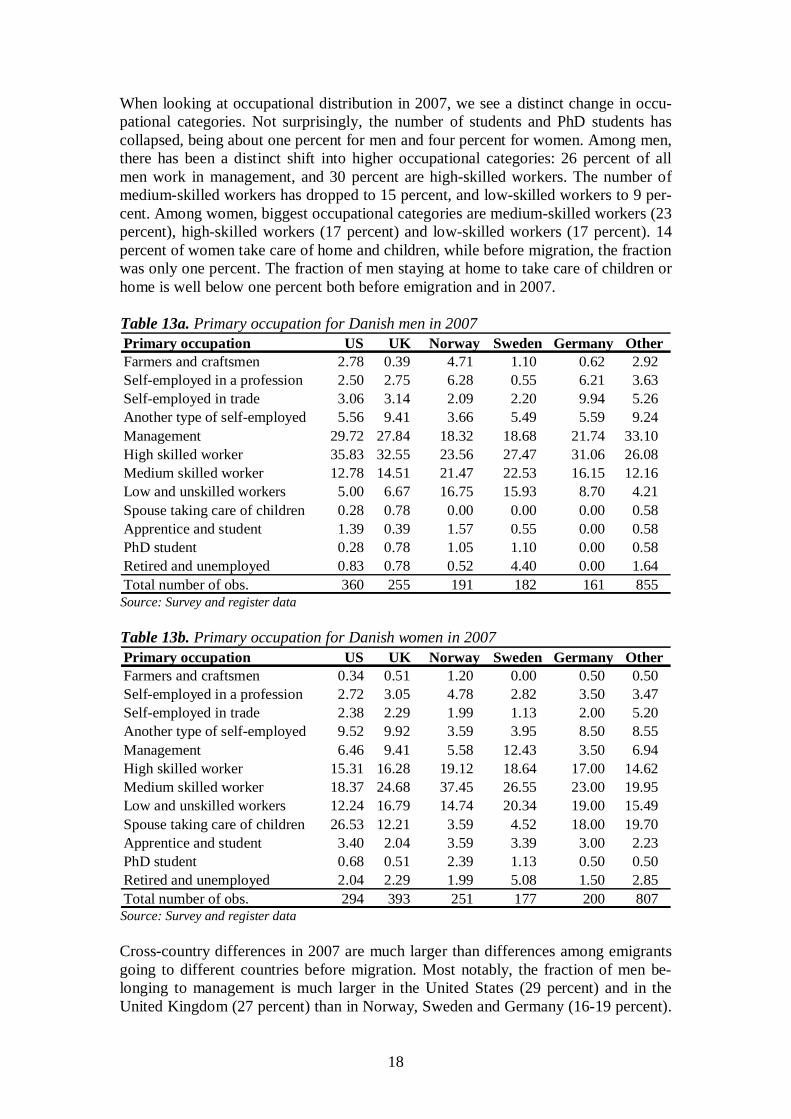
When looking at occupational distribution in 2007, we see a distinct change in occu-pational categories. Not surprisingly, the number of students and PhD students has collapsed, being about one percent for men and four percent for women. Among men, there has been a distinct shift into higher occupational categories: 26 percent of all men work in management, and 30 percent are high-skilled workers. The number of medium-skilled workers has dropped to 15 percent, and low-skilled workers to 9 per-cent. Among women, biggest occupational categories are medium-skilled workers (23 percent), high-skilled workers (17 percent) and low-skilled workers (17 percent). 14 percent of women take care of home and children, while before migration, the fraction was only one percent. The fraction of men staying at home to take care of children or home is well below one percent both before emigration and in 2007. Table 13a. Primary occupation for Danish men in 2007 Primary occupation US UK Norway Sweden Germany OtherFarmers and craftsmen 2.78 0.39 4.71 1.10 0.62 2.92Self-employed in a profession 2.50 2.75 6.28 0.55 6.21 3.63Self-employed in trade 3.06 3.14 2.09 2.20 9.94 5.26Another type of self-employed 5.56 9.41 3.66 5.49 5.59 9.24Management 29.72 27.84 18.32 18.68 21.74 33.10High skilled worker 35.83 32.55 23.56 27.47 31.06 26.08Medium skilled worker 12.78 14.51 21.47 22.53 16.15 12.16Low and unskilled workers 5.00 6.67 16.75 15.93 8.70 4.21Spouse taking care of children 0.28 0.78 0.00 0.00 0.00 0.58Apprentice and student 1.39 0.39 1.57 0.55 0.00 0.58PhD student 0.28 0.78 1.05 1.10 0.00 0.58Retired and unemployed 0.83 0.78 0.52 4.40 0.00 1.64Total number of obs. 360 255 191 182 161 855 Source: Survey and register data Table 13b. Primary occupation for Danish women in 2007 Primary occupation US UK Norway Sweden Germany OtherFarmers and craftsmen 0.34 0.51 1.20 0.00 0.50 0.50Self-employed in a profession 2.72 3.05 4.78 2.82 3.50 3.47Self-employed in trade 2.38 2.29 1.99 1.13 2.00 5.20Another type of self-employed 9.52 9.92 3.59 3.95 8.50 8.55Management 6.46 9.41 5.58 12.43 3.50 6.94High skilled worker 15.31 16.28 19.12 18.64 17.00 14.62Medium skilled worker 18.37 24.68 37.45 26.55 23.00 19.95Low and unskilled workers 12.24 16.79 14.74 20.34 19.00 15.49Spouse taking care of children 26.53 12.21 3.59 4.52 18.00 19.70Apprentice and student 3.40 2.04 3.59 3.39 3.00 2.23PhD student 0.68 0.51 2.39 1.13 0.50 0.50Retired and unemployed 2.04 2.29 1.99 5.08 1.50 2.85Total number of obs. 294 393 251 177 200 807 Source: Survey and register data Cross-country differences in 2007 are much larger than differences among emigrants going to different countries before migration. Most notably, the fraction of men be-longing to management is much larger in the United States (29 percent) and in the United Kingdom (27 percent) than in Norway, Sweden and Germany (16-19 percent).
19
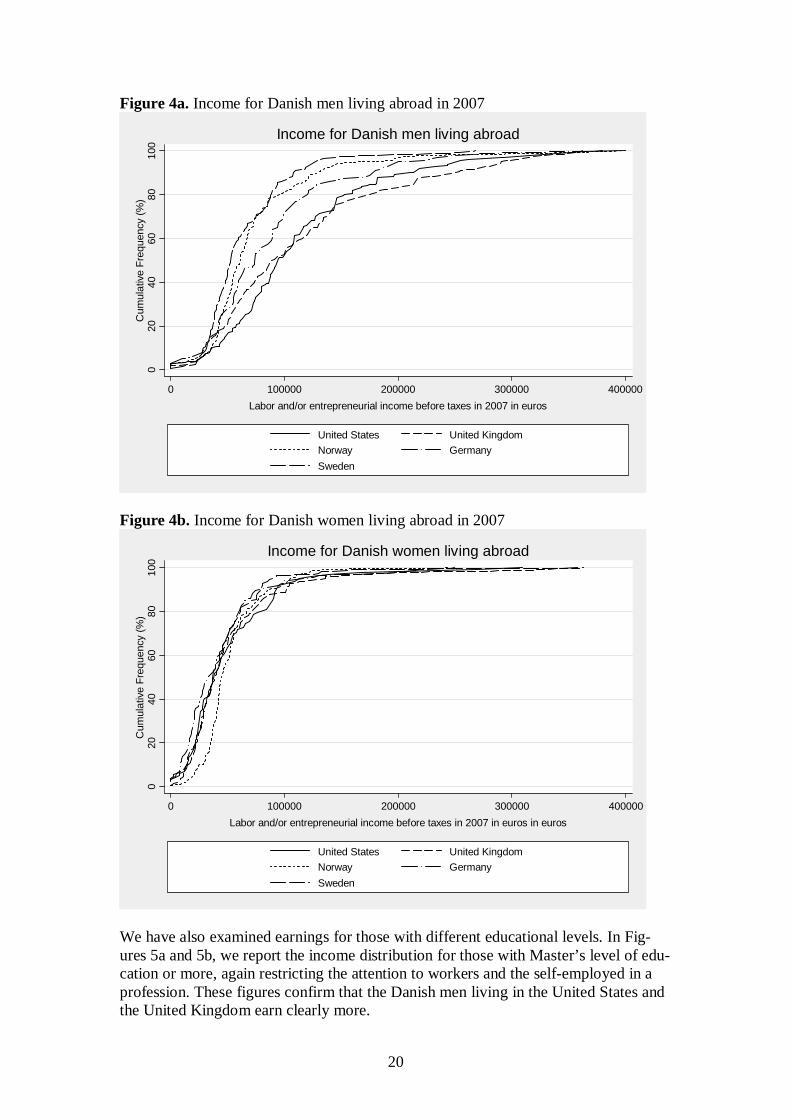
The fraction of high-skilled workers exceeds 30 percent in the United States (37 per-cent), the United Kingdom (32 percent) and Germany (31 percent), being 29 percent in Sweden and 25 percent in Norway. Also Danish men in all other countries work most often in management (29 percent) and as high-skilled workers (27 percent). Among women, largest cross-country differences are in whether to stay at home or not. 26 percent of Danish women living in the United States stay at home. In Ger-many, the fraction is 15 percent, in the United Kingdom, 12 percent, and in Norway and Sweden, 4 percent. The fraction of women belonging to management is largest in Sweden (11 percent), and only 3-6 percent in the United States, Norway and Ger-many. A notable different is also that 36 percent of women in Norway and are me-dium skilled, while the size of this group in the United Kingdom, Sweden, and Ger-many is 22-26 percent, and in the United States, 17 percent. This is driven mainly by nurses in Norway. 8. Earnings Distribution of Danes Abroad Our survey data allows us to test whether there are systematic earnings differences between Danes living in the United States, the United Kingdom, Germany, Sweden and Norway. In all countries, the earnings distribution of men dominates the earnings distribution of women. That is, for any income threshold, the fraction of women be-low it is larger than the fraction of men below it. Therefore, we study men and women separately when looking for cross-country differences. In Figures 4a and 4b, we report the cumulative earnings distribution of Danish men and women living in the five main destination countries in 2007, and being either workers (including management) or self-employed in a profession. For men, we find that the earnings distribution in the United States and in the United Kingdom domi-nates the earnings distribution in other countries, apart from the bottom decile in which the cumulative frequency curves are initially quite similar. In each income dec-ile apart from the two lowest, earnings in Germany exceed those in Sweden and Nor-way. For women, cross-country differences are much smaller. The most notable ex-ception is Norway, in which the earnings are higher than in the other countries for the bottom two thirds of income distribution.
20
Figure 4a. Income for Danish men living abroad in 2007
020
4060
8010
0C
umul
ativ
e Fr
eque
ncy
(%)
0 100000 200000 300000 400000Labor and/or entrepreneurial income before taxes in 2007 in euros
United States United KingdomNorway GermanySweden
Income for Danish men living abroad
Figure 4b. Income for Danish women living abroad in 2007
020
4060
8010
0C
umul
ativ
e Fr
eque
ncy
(%)
0 100000 200000 300000 400000Labor and/or entrepreneurial income before taxes in 2007 in euros in euros
United States United KingdomNorway GermanySweden
Income for Danish women living abroad
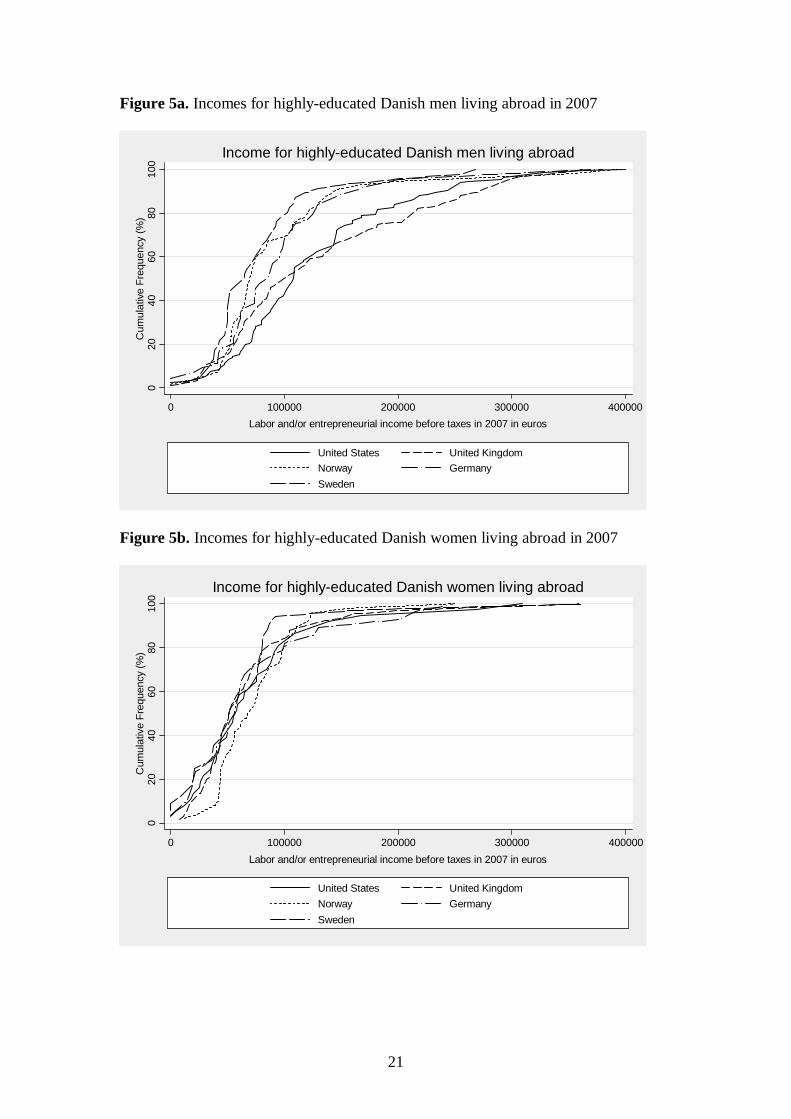
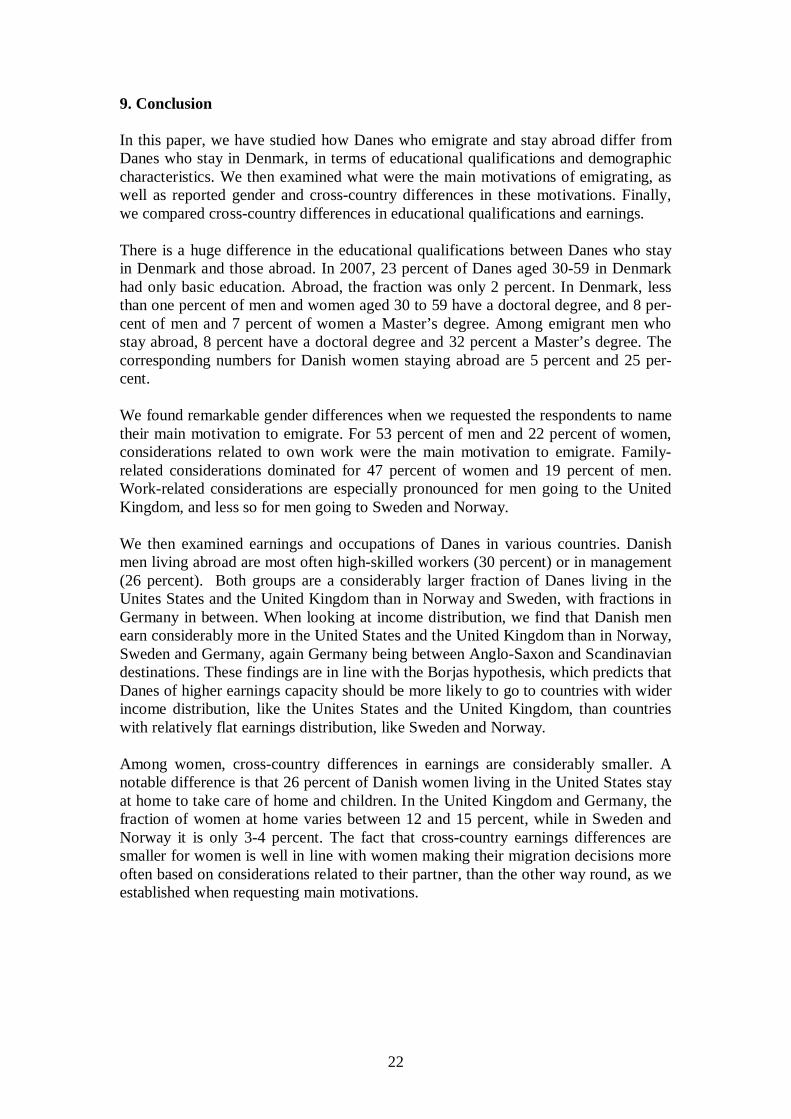
We have also examined earnings for those with different educational levels. In Fig-ures 5a and 5b, we report the income distribution for those with Master’s level of edu-cation or more, again restricting the attention to workers and the self-employed in a profession. These figures confirm that the Danish men living in the United States and the United Kingdom earn clearly more.
21
Figure 5a. Incomes for highly-educated Danish men living abroad in 2007
020
4060
8010
0C
umul
ativ
e Fr
eque
ncy
(%)
0 100000 200000 300000 400000Labor and/or entrepreneurial income before taxes in 2007 in euros
United States United KingdomNorway GermanySweden
Income for highly-educated Danish men living abroad
Figure 5b. Incomes for highly-educated Danish women living abroad in 2007
020
4060
8010
0C
umul
ativ
e Fr
eque
ncy
(%)
0 100000 200000 300000 400000Labor and/or entrepreneurial income before taxes in 2007 in euros
United States United KingdomNorway GermanySweden
Income for highly-educated Danish women living abroad
22
9. Conclusion In this paper, we have studied how Danes who emigrate and stay abroad differ from Danes who stay in Denmark, in terms of educational qualifications and demographic characteristics. We then examined what were the main motivations of emigrating, as well as reported gender and cross-country differences in these motivations. Finally, we compared cross-country differences in educational qualifications and earnings. There is a huge difference in the educational qualifications between Danes who stay in Denmark and those abroad. In 2007, 23 percent of Danes aged 30-59 in Denmark had only basic education. Abroad, the fraction was only 2 percent. In Denmark, less than one percent of men and women aged 30 to 59 have a doctoral degree, and 8 per-cent of men and 7 percent of women a Master’s degree. Among emigrant men who stay abroad, 8 percent have a doctoral degree and 32 percent a Master’s degree. The corresponding numbers for Danish women staying abroad are 5 percent and 25 per-cent. We found remarkable gender differences when we requested the respondents to name their main motivation to emigrate. For 53 percent of men and 22 percent of women, considerations related to own work were the main motivation to emigrate. Family-related considerations dominated for 47 percent of women and 19 percent of men. Work-related considerations are especially pronounced for men going to the United Kingdom, and less so for men going to Sweden and Norway. We then examined earnings and occupations of Danes in various countries. Danish men living abroad are most often high-skilled workers (30 percent) or in management (26 percent). Both groups are a considerably larger fraction of Danes living in the Unites States and the United Kingdom than in Norway and Sweden, with fractions in Germany in between. When looking at income distribution, we find that Danish men earn considerably more in the United States and the United Kingdom than in Norway, Sweden and Germany, again Germany being between Anglo-Saxon and Scandinavian destinations. These findings are in line with the Borjas hypothesis, which predicts that Danes of higher earnings capacity should be more likely to go to countries with wider income distribution, like the Unites States and the United Kingdom, than countries with relatively flat earnings distribution, like Sweden and Norway. Among women, cross-country differences in earnings are considerably smaller. A notable difference is that 26 percent of Danish women living in the United States stay at home to take care of home and children. In the United Kingdom and Germany, the fraction of women at home varies between 12 and 15 percent, while in Sweden and Norway it is only 3-4 percent. The fact that cross-country earnings differences are smaller for women is well in line with women making their migration decisions more often based on considerations related to their partner, than the other way round, as we established when requesting main motivations.
23
References Borjas, G.J. (1987). Self-Selection and the Earnings of Immigrants. American Eco-nomic Review 77: 531-553. Borjas, G.J. and Bratsberg B. (1996). Who leaves? The Outmigration of the foreign-born. Review of Economics and Statistics 78: 165–76. Chiquiar, D. and Hanson, G.H. (2005). International Migration, Self Selection, and the Distribution of Wages: Evidence from Mexico and the United States. Journal of Political Economy 113: 239-281. Dahl, G.B. (2002). Mobility and the Return to Education: Testing a Roy Model with Multiple Markets. Econometrica 70: 2367-2420. Dustmann, C. (2003). Return Migration, Wages Differentials and the Optimal Migra-tion Duration. European Economic Review 47: 353-367. Lundborg, P. (1991). Determinants of Migration in the Nordic Labor Market. Scandi-navian Journal of Economics 93: 363-375. Pirttilä, J. (2004). Is International Labour Mobility a Threat to the Welfare State? Evi-dence from Finland in the 1990s. Finnish Economic Papers 17: 18-34. Roy, A. (1951). Some Thoughts on the Distribution of Earnings. Oxford Economic Papers 3: 135-146. Sjaastad, L.A. (1962). The Cost and Returns of Human Migration. Journal of Politi-cal Economy 70(5, part 2): 80-93.
24
Appendix A. Survey. The stayers survey was designed with several step. First, Statistics Denmark contacted parents and siblings for those who in the summer of 2007 were emigrated in one of years 1987, 1988, 1992, 1993, 1997, 1998, 2001, 2002 registered being abroad at least 3 months. Emigrants are not registered less than three months. In the CPR-register is there information about destination country, and year of emi-gration. From the CPR- register is it possible to track emigrants through their parents and siblings, if parents and siblings still live in Denmark. Statistics Denmark has also a register with people who have returned from abroad. On the basis of this register and the eight selected years were all non-returned persons between 18-59 years drawn from the register. This selected group was then compared and connected to the CPR-register. Thereafter it was possible to contact at least one parent. If the two par-ents were not living together they were both contacted by Statistics Denmark. They mailed a letter containing information about the investigation to 16,000 parents and 500 siblings and obtained contact information for around 10,500 emigrants. Parents could either use the internet, mailbox or and an at-tached stamped envelope to send the information about their children, now grown up adults living abroad. However we had only valid email addresses for 7,075 people. In the final set up only 6,889 were available. Through email the asked to fill out a web based questionnaire constructed by us. 4,260 persons answered the web scheme from June 2008 to August 2008. Three reminders were sent out to obtain the best data quality. The response rate on 61 percent was quite high compared to similar kinds of investigations. The three tables below report response rates in percentages according to gender, country of residence, and year of emigration. Overall, the rates are remarkable similar. Therefore, the respondents are highly representative of the target population in the dimensions of gender, country of residence, and year of emigration. Table A1. Response rates of men and women Men Women Overall response rate 61 61 Table A2. Response rates of men and women in main destination countries Country Men Women USA 65 57 Great Britain 62 64 Norway 59 66 Sweden 54 62 Germany 63 62 Switzerland 70 68 Australia 66 53 France 66 52 All other countries 59 61
Table A3. Response rates of men and women according to the year of emigration Year Men Women 1987 61 56 1988 62 62 1992 61 63 1993 59 56 1997 60 58 1998 62 62 2001 60 64 2002 63 63
25
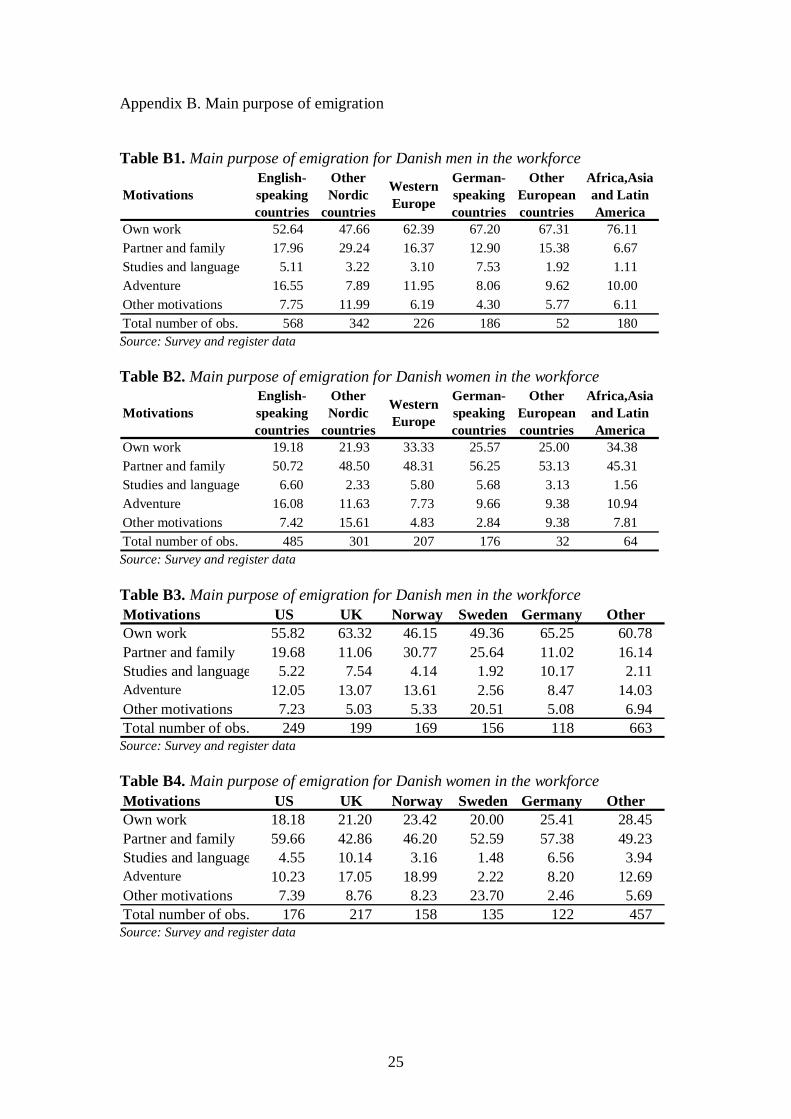
Appendix B. Main purpose of emigration Table B1. Main purpose of emigration for Danish men in the workforce
MotivationsEnglish-speaking countries
Other Nordic
countries
Western Europe
German-speaking countries
Other European countries
Africa,Asia and Latin America
Own work 52.64 47.66 62.39 67.20 67.31 76.11Partner and family 17.96 29.24 16.37 12.90 15.38 6.67Studies and language 5.11 3.22 3.10 7.53 1.92 1.11Adventure 16.55 7.89 11.95 8.06 9.62 10.00Other motivations 7.75 11.99 6.19 4.30 5.77 6.11Total number of obs. 568 342 226 186 52 180 Source: Survey and register data Table B2. Main purpose of emigration for Danish women in the workforce
MotivationsEnglish-speaking countries
Other Nordic
countries
Western Europe
German-speaking countries
Other European countries
Africa,Asia and Latin America
Own work 19.18 21.93 33.33 25.57 25.00 34.38Partner and family 50.72 48.50 48.31 56.25 53.13 45.31Studies and language 6.60 2.33 5.80 5.68 3.13 1.56Adventure 16.08 11.63 7.73 9.66 9.38 10.94Other motivations 7.42 15.61 4.83 2.84 9.38 7.81Total number of obs. 485 301 207 176 32 64 Source: Survey and register data Table B3. Main purpose of emigration for Danish men in the workforce Motivations US UK Norway Sweden Germany OtherOwn work 55.82 63.32 46.15 49.36 65.25 60.78Partner and family 19.68 11.06 30.77 25.64 11.02 16.14Studies and language 5.22 7.54 4.14 1.92 10.17 2.11Adventure 12.05 13.07 13.61 2.56 8.47 14.03Other motivations 7.23 5.03 5.33 20.51 5.08 6.94Total number of obs. 249 199 169 156 118 663 Source: Survey and register data Table B4. Main purpose of emigration for Danish women in the workforce Motivations US UK Norway Sweden Germany OtherOwn work 18.18 21.20 23.42 20.00 25.41 28.45Partner and family 59.66 42.86 46.20 52.59 57.38 49.23Studies and language 4.55 10.14 3.16 1.48 6.56 3.94Adventure 10.23 17.05 18.99 2.22 8.20 12.69Other motivations 7.39 8.76 8.23 23.70 2.46 5.69Total number of obs. 176 217 158 135 122 457 Source: Survey and register data
26
Appendix C. Education of Danes in main countries of residence Table C1. Education of Danish men abroad Highest level of education US UK Norway Sweden Germany OtherBasic school 2.78 0.78 4.19 6.04 0.62 1.88General upper secondary 5.28 9.41 2.62 8.24 5.59 6.34Vocational upper secundary 3.89 5.10 2.62 4.40 6.21 3.05Vocational education & training 8.61 10.98 25.13 18.68 14.29 13.97Short higher 5.83 5.10 6.28 9.34 10.56 10.56Medium higher 3.89 3.14 15.18 8.79 7.45 6.69Bachelor degree 21.39 17.25 8.38 10.99 20.50 16.08Long higher 32.78 37.25 28.80 26.92 29.19 34.15Doctoral degree or equivalent 15.56 10.98 6.81 6.59 5.59 7.28Total number of obs. 360 255 191 182 161 852 Source: Survey and register data
Table C2. Education of Danish women abroad Highest level of education US UK Norway Sweden Germany OtherBasic school 2.72 2.29 3.19 1.13 2.50 2.85General upper secondary 6.46 8.91 8.37 7.34 7.00 9.29Vocational upper secundary 3.74 3.82 1.59 3.95 5.00 4.71Vocational education & training 9.86 8.65 9.96 13.56 20.50 12.39Short higher 8.16 7.38 3.19 10.73 8.50 8.43Medium higher 13.61 13.74 31.08 22.03 19.00 14.25Bachelor degree 24.83 24.68 12.75 12.99 8.50 16.85Long higher 21.77 24.94 24.30 22.03 26.50 28.00Doctoral degree or equivalent 8.84 5.60 5.58 6.21 2.50 3.22Total number of obs. 294 393 251 177 200 807 Source: Survey and register data