Embed Size (px)
Citation preview
warwick.ac.uk/lib-publications
Original citation: Li, Dezhi, Chrysanthou, Andreas, Patel, Imran and Williams, Geraint J. (2016) Self-piercing riveting - a review. Working Paper. Coventry: University of Warwick WMG. (Unpublished) Permanent WRAP URL: http://wrap.warwick.ac.uk/79605 Copyright and reuse: The Warwick Research Archive Portal (WRAP) makes this work by researchers of the University of Warwick available open access under the following conditions. Copyright © and all moral rights to the version of the paper presented here belong to the individual author(s) and/or other copyright owners. To the extent reasonable and practicable the material made available in WRAP has been checked for eligibility before being made available. Copies of full items can be used for personal research or study, educational, or not-for-profit purposes without prior permission or charge. Provided that the authors, title and full bibliographic details are credited, a hyperlink and/or URL is given for the original metadata page and the content is not changed in any way. A note on versions: The version presented here is a working paper or pre-print that may be later published elsewhere. If a published version is known of, the above WRAP url will contain details on finding it. For more information, please contact the WRAP Team at: [email protected]
1
Self-Piercing Riveting-A review
Dezhi Li1*, Andreas Chrysanthou2, Imran Patel2, Geraint Williams1
1WMG, University of Warwick, Coventry, CV4 7AL, UK
2School of Engineering and Technology, University of Hertfordshire, Hatfield, AL10 9AB, UK
*Corresponding author, e-mail: [email protected]
Abstract
Self-Piercing Riveting (SPR) is a cold mechanical joining process used to join two or more sheets of
materials by driving a semitubular rivet piercing through the top sheet or the top and middle sheets
and subsequently lock into the bottom sheet under the guidance of a suitable die. SPR was originated
half century ago, but it only had significant progress in the last 25 years due to the requirement of
joining lightweight materials, such as aluminium alloy structures, aluminium-steel structures and
other mixed material structures, from the automotive industry. Compared with other conventional
joining methods, SPR has a lot of advantages including no predrilled holes required, no fume, no
spark and low noise, no surface treatment required, ability to join multilayer materials and mixed
materials, and ability to produce joint with high static and fatigue strengths etc. This publication
reviews research investigations that have been conducted in the area of self-piercing riveting. The
process is described and the effects of the process parameters are discussed. Mechanical properties
including static strength, fatigue and crash behaviour are reviewed. Corrosion behaviour is also
addressed, while reliable methods for accurate behaviour prediction, process monitoring and non-
destructive testing have been identified as the main challenges.
Keywords: Self-Piercing Riveting; Process parameters; Structure joining; Mechanical strength; Finite
element modelling
1. Introduction
Self-Piercing Riveting (SPR) originated in the 1960’s, but was only significantly developed in the
past 25 years due to requirements from the automotive industry. In 1972, Hulbert compared SPR with
traditional riveting, and the main difference between SPR and traditional riveting is that the former
does not require pre-punch and alignment [1]. In 1975, a SPR system the Bifurcated & Tubular Rivet
Co. Ltd. was successfully used to join the handle to the lid of a paint can, with water tight joints
2
without pre-punched holes [2]. In 1976, Gausden and Gunn [3] from the Bifurcated & Tubular Rivet
Co. Ltd. discussed the development of SPR, its advantages, suitable materials, and some applications.
They also demonstrated that the SPR process could be automated. However, significant SPR process
development, wide applications and research interest of the SPR process was not emerged until the
requirement to join lightweight aluminium alloy structures. The drive to reduce the weight of the
automotive vehicle body has led to the use of aluminium alloys to replace some traditional mild steel.
To join aluminium alloys and mixed material structures, traditional resistance spot welding met some
difficulties and problems, and as a result SPR was chosen as an alternative joining process. In 1983,
Sunday [4] reviewed the process and advantages of SPR, the application of SPR in the automotive
industry, and compared the strength of the SPR joints with that of the traditional spot welded joints. In
1992, Patrick and Sharp [5] compared various processes, including SPR, for joining automotive
aluminium body structures, from various aspects, including minimum flange width, minimum joint
space, process speed and cost etc. In the same year, Edwards [6] also introduced SPR (also referred to
Pierce-&Roll riveting), as an alternative joining process for spot welding. In 1993, Doo [7]
summarized the process and the developments of Henrob SPR system and discussed its application in
the automotive industry. Hill [8] reviewed the SPR process and equipment for automotive
applications. Bokhari [9] presented further developments and applications of SPR at Henrob Ltd. The
major developments of SPR since 1990s include rivet geometry, rivet inserting mechanism, rivet
feeding mechanism and automation.
The application areas of SPR include the automotive industry, the building industry [10, 11], road
signs [12], and white goods etc. The automotive industry has become the main application area of
SPR and also the main driving force of SPR development.
Traditional steel vehicles are normally joined by resistant spot welding (RSW). However, due to
environmental concerns, legislations from the US, Europe and other countries require new vehicles to
greatly reduce CO2 emissions. Research showed that a 10% reduction in a vehicle’s weight offers fuel
savings of 5 - 7%, if the vehicle’s powertrain is also downsized. In order to improve fuel efficiency
and reduce emissions, automotive manufacturers are trying to make vehicles lighter. Various ways
can be used to achieve vehicle weight reductions, including replacing steels with aluminium alloys or
with high-strength and advanced high-strength steels. An alternative solution is to use a combination
of aluminium alloys, high-strength steels and other lightweight materials. Research from the European
Aluminium Association [13] showed that depending on the specific application, the weight reduction
potential ranged between 25% and over 50% when replacing steels with aluminium alloys. Significant
weight reduction by using aluminium alloys was possible even when compared to a modern vehicle
body designed using advanced high-strength steels [13]. However, due to aluminium’s high thermal
conductivity, high electric conductivity and a strong and stable oxide film on the surface, to join
3
aluminium alloys with RSW, there are some challenges, such as electrode wear, frequent electrode
surface conditioning required and surface sensitivity etc. Generally, resistance spot welding of
aluminium alloys needs much more energy than resistance spot welding of steel due to a higher
current required. In addition, RSW cannot be used to join dissimilar materials. As a result, SPR is
used as an alternative joining method for joining aluminium alloys and mixed material structures in
automotive manufacturing.
Compared with some traditional joining technologies, SPR has some advantages, including:
1. It is environmentally friendly: no fume, no spark and low noise;
2. Ability to join similar and dissimilar materials;
3. No requirement for pre-drilled holes and alignment;
4. No surface pre-treatment required;
5. Ability to join with lubricants and adhesives;
6. Low energy requirement;
7. Long tool life, >200,000 operations before replacement;
8. Easy for automation and process monitoring;
9. Short cycle time, 1-4 seconds;
10. Ability to achieve water tight joints;
11. As a cold process, no side effect on the heat treatment of the substrate materials;
12. High static and fatigue joint strengths.
However, SPR also has its disadvantages, including:
1. Two-side access required (although a single side access self-piercing riveting process was
introduced by Liu et al. [14]);
2. A joint button left on one side;
3. Additional cost and weight from the rivets;
4. Possibility of galvanic corrosion between the steel rivets and the aluminium alloy substrate;
5. Not suitable for brittle materials, especially when used on the die side;
4
6. Relatively high force required.
SPR was first largely applied in the automotive industry by Audi in collaboration with Henrob in
Audi’s A8 model in 1993 [15] and it has since been widely used by several automotive companies.
The all-aluminium Audi A8 used about 1100 self-piercing rivets; for Audi’s second generation of
Audi space frame, the all-aluminium Audi A2 used about 1800 self-piercing rivets with spot welds
totally replaced [16]. SPR was also applied in the Audi TT, with about 1600 self-piercing rivets being
used in the coupe model [17]. The largest application of SPR in automotive was by Jaguar Land
Rover (JLR), as detailed by Mortimer for the Jaguar XJ [18] and later for the Jaguar XJ and XK [19].
JLR uses a monocoque structure design for its XJ and XK all-aluminium models. About 3600 self-
piercing rivets are used in the XJ, and about 2400-2600 self-piercing rivets are used in the XK. JLR
also developed all-aluminium structures for its new Range Rover models with about 3800 self-
piercing rivets being applied. Due to its superior fatigue strength, SPR is used by Volvo to replace
RSW for joining some high strength steels in the cab of FH series trucks [20]. SPR is also the main
joining technology for the aluminium alloy structures used by BMW and Daimler [21]. SPR has been
used by Ford for many years. Recently, the application of SPR in Ford’s F150 pick-up truck, with
2200 to 2700 rivets used, is a new large application away from luxury cars [22, 23].
SPR has been the subject of previous reviews [4, 24-27]. For example, Sunday [4] reviewed SPR
systems, rivets and dies, and addressed issues related to the mechanical strength of the SPR joints and
the influential parameters. He et al. [25] reviewed the research and development of the SPR process
up to that time, including the SPR setting process, process monitoring, joint failure mechanics, static
and fatigue behaviour, assembly dimension prediction, finite element analysis, and process cost, while
Cacko [27] reviewed the different material separation criteria used in the SPR modelling. He et al.
[24] further reviewed the development of numerical modelling of SPR. However, since the publishing
of these reviews the number of publications on SPR has steadily increased in the last decade, and
there have been new developments on the SPR process, new applications on emerged materials and
new researches addressing more fundamental issues. There are also areas not covered in these
reviews, such as SPR process parameters. There is also a book on SPR edited by Andreas
Chrysanthou and Xin Sun [28], but the chapters are mainly reviews of the authors’ own work. In order
to facilitate further application of SPR and stimulate further research on SPR, it is believed that a
comprehensive review on this topic is urgently required.
The objectives of the current review are to give a comprehensive account of the progress made in
the past 25 years on the conventional SPR process, the process parameters, applications of SPR, the
mechanical performance of SPR joints and the finite element modelling of SPR etc. Although there
are research and development on other types of SPR, such as solid SPR [29, 30] or clinch
5
riveting[31], single-sided SPR (SSPR) [14], gun-powder driving SPR [32], friction SPR [33] and
rivet-welding [34], they are not the main stream and therefore not reviewed in detail in this paper.
2. SPR joining process
SPR is a cold mechanical joining process used to join two or more sheets of materials by driving a
semitubular rivet piercing through the top sheet or the top and middle sheets and partially piercing and
locking into the bottom sheet to form a mechanical joint. During a SPR process, the spreading of the
rivet skirt during piercing is guided by a suitable die, and the punched slug from the top sheet or the
top and middle sheets is embedded into the rivet shank (blind semi-tubular cavity).
Compared with the traditional riveting process, SPR eliminates the requirement for pre-
drilled/punched holes and the need for accurate alignment between components before joining. Unlike
fusion welding process, SPR relies on mechanical interlocking rather than fusion to form the joint
strength, so it can be used to join similar and dissimilar materials without the need of surface
treatments, and it will not degrade the material strength by heating. SPR can also be used in
combination with adhesives to increase joint stiffness and improve the noise, vibration and harshness
(NVH) performance.
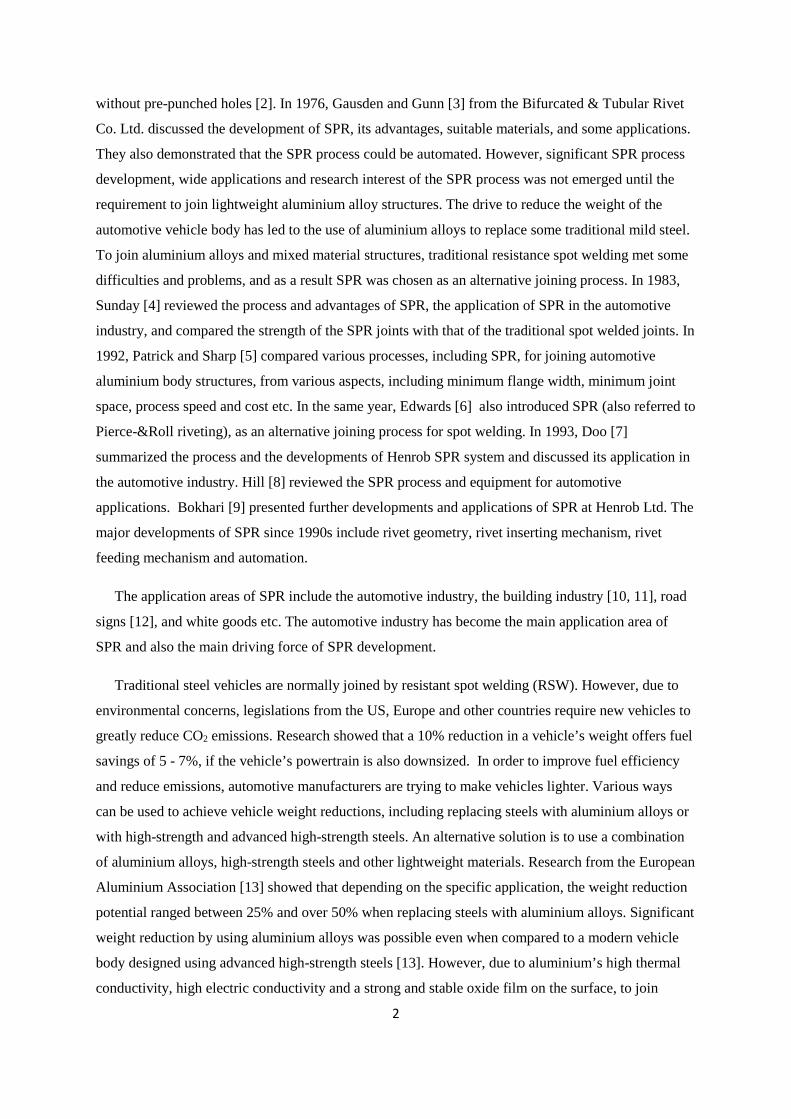
FIGURE 1. ―A SPR system for laboratory use.
The most commonly used SPR system consists of a power and control unit, a C-frame, a die, a
punch with a driving system and a rivet feeding system, as shown in Fig. 1. Some of the modern
systems also have a process monitoring system, which can be used to control some of the joint quality
and process parameters, such as stack thickness, rivet length, punch displacement and setting force. If
any of these parameters lie outside the tolerance, a warning will be generated. Most SPR systems are
C frame
Driving
system
Punch
inside
Rivet feeding
system
Die
Control
unit
6
hydraulic or servo driven, but there are some systems driven by other methods, such as gun powder as
reported by Wang et al. [32]. Most SPR systems that are used in automotive productions are servo-
driven, because these systems are much lighter than the hydraulic driven systems and are much easier
to be automated. Research has been conducted to develop a light-weight (by using steels and
composites) long-reach C-frame for easy automation [35]. For servo driven SPR systems, the way that
rivets are set can be “pushing” or “punching”. In a “push” process, a gradually increasing force is
applied to the punch to push the rivet into the work-piece until the rivet reaches a satisfactory
position; in a “punch” process, the punch is accelerated to a certain speed and hits the rivet with an
impact to set the rivet to a satisfactory position. Our research showed that a “push” process will cause
more local distortions than a “punch” process, which is consistent with the results reported by Wang
et al. [32]. In their research, they observed that the joints made by their gun-powder-driven impact
SPR system had fewer local distortions than those made by a hydraulic driven SPR system.
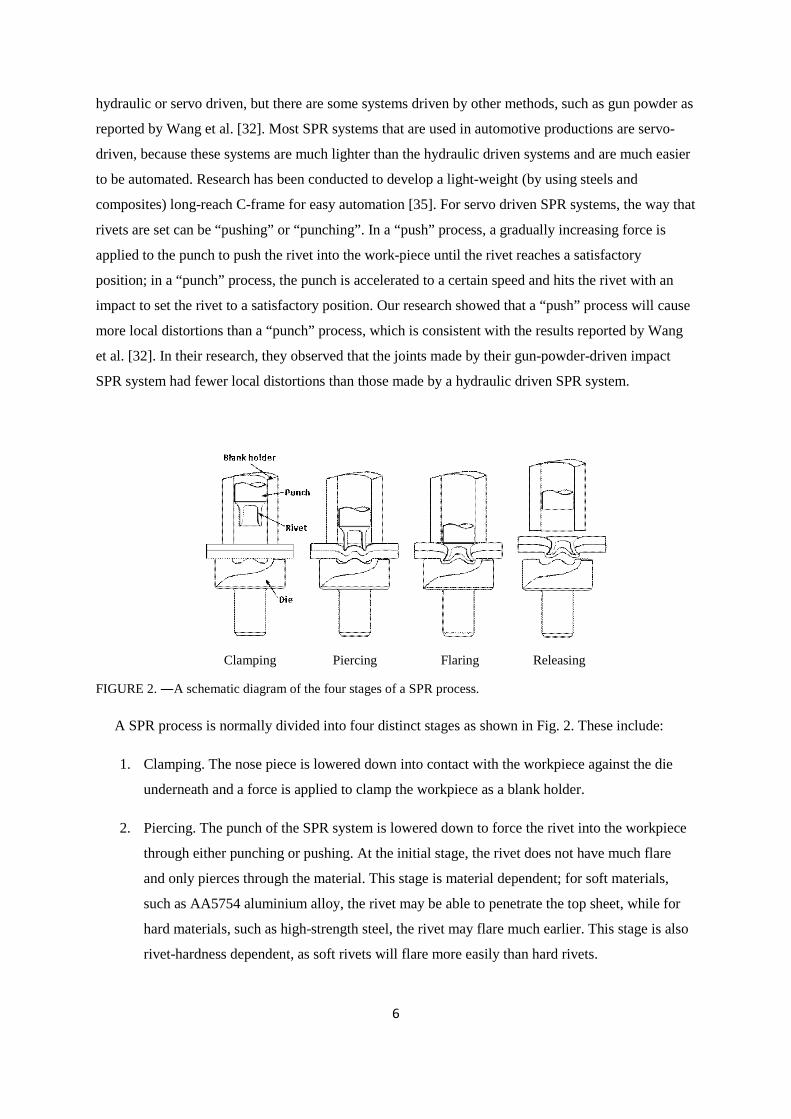
FIGURE 2. ―A schematic diagram of the four stages of a SPR process.
A SPR process is normally divided into four distinct stages as shown in Fig. 2. These include:
1. Clamping. The nose piece is lowered down into contact with the workpiece against the die
underneath and a force is applied to clamp the workpiece as a blank holder.
2. Piercing. The punch of the SPR system is lowered down to force the rivet into the workpiece
through either punching or pushing. At the initial stage, the rivet does not have much flare
and only pierces through the material. This stage is material dependent; for soft materials,
such as AA5754 aluminium alloy, the rivet may be able to penetrate the top sheet, while for
hard materials, such as high-strength steel, the rivet may flare much earlier. This stage is also
rivet-hardness dependent, as soft rivets will flare more easily than hard rivets.
Clamping Piercing Flaring Releasing
7
3. Flaring. The rivet will be punched or pushed further into the workpiece and starts to flare to
form a mechanical interlock to hold all the sheets in the workpiece together. The flare of the
rivet is caused by the piercing resistance from the workpiece with support and constraint from
the die. During the piercing and flaring stages, gaps between the sheet materials may be
generated due to the different deformation processes from different sheets, but these gaps will
be closed up or reduced during further rivet setting. The punch will stop when it reaches the
predetermined force or stroke.
4. Releasing. The punch and the nose piece of the SPR system will retreat to the working
position and the workpiece will be released from the die.
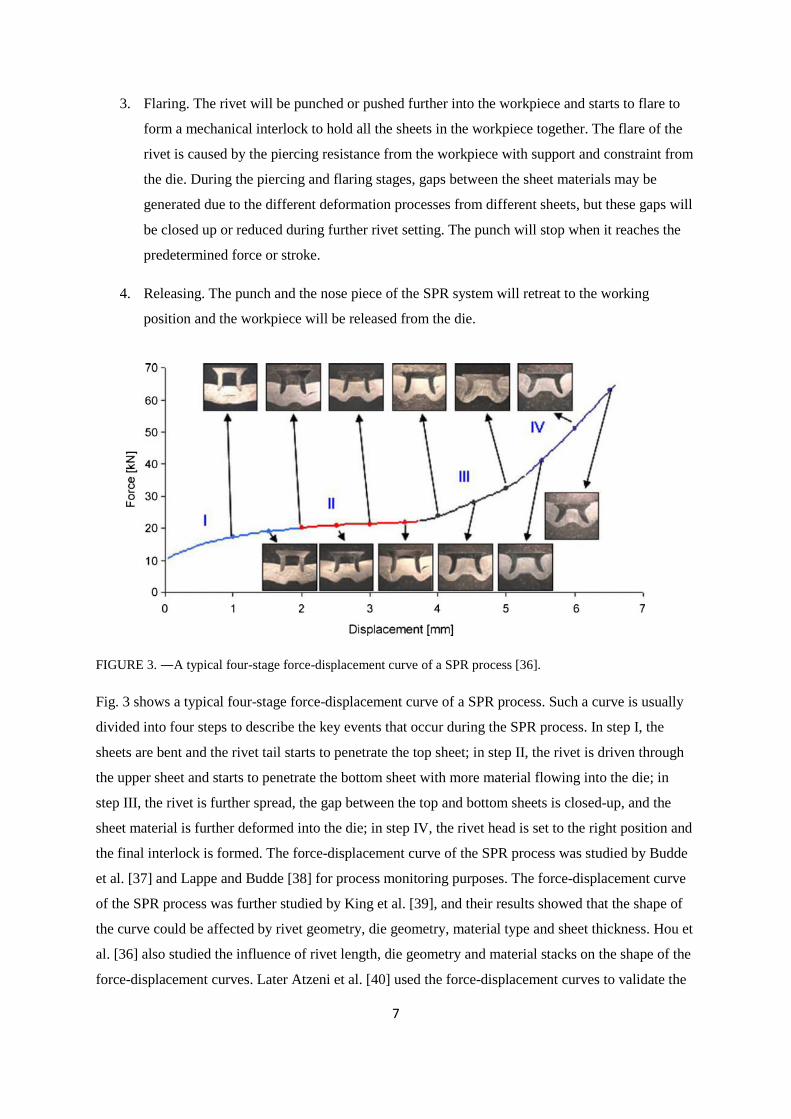
FIGURE 3. ―A typical four-stage force-displacement curve of a SPR process [36].
Fig. 3 shows a typical four-stage force-displacement curve of a SPR process. Such a curve is usually
divided into four steps to describe the key events that occur during the SPR process. In step I, the
sheets are bent and the rivet tail starts to penetrate the top sheet; in step II, the rivet is driven through
the upper sheet and starts to penetrate the bottom sheet with more material flowing into the die; in
step III, the rivet is further spread, the gap between the top and bottom sheets is closed-up, and the
sheet material is further deformed into the die; in step IV, the rivet head is set to the right position and
the final interlock is formed. The force-displacement curve of the SPR process was studied by Budde
et al. [37] and Lappe and Budde [38] for process monitoring purposes. The force-displacement curve
of the SPR process was further studied by King et al. [39], and their results showed that the shape of
the curve could be affected by rivet geometry, die geometry, material type and sheet thickness. Hou et
al. [36] also studied the influence of rivet length, die geometry and material stacks on the shape of the
force-displacement curves. Later Atzeni et al. [40] used the force-displacement curves to validate the
8
SPR process simulation. Recently, Haque et al. [41] systematically studied the curves with different
sheet material thickness and different rivet hardness. From the curve, it can be seen that much higher
forces are required during steps III and IV, because during these stages the rivet encounters a much
higher resistance for penetration and deformation. The force-displacement curve will be different for
different material stacks with different rivet setting parameters, and it can be used as a fingerprint to
monitor the SPR setting process. The strength and thickness of the materials to be joined, the rivet
length and hardness, the die geometry, the number of sheets in the stack and the order of the materials
in the stack will all affect the shape of the curve.
3. Process parameters for SPR
The SPR process parameters include rivet, die, setting force and C-frame. These parameters will
influence the joint quality and strength. Understanding these parameters is very important for SPR
applications, such as selecting the right parameters for different material stacks.
Through experiment and statistical analysis, Xu [42] studied the influence of some rivets, die and
sheet combinations on the joint features: the minimum remaining bottom material thickness (Tmin) and
the interlock and flare distances of rivet tail. He demonstrated that the joints produced with longer
rivets had larger flare and interlock distances but thinner Tmin, and he also concluded that the joints
produced with dies of different geometries or different sheet combinations had different joint features.
The details of the influence of the process parameters are further discussed below.
3.1. Rivet
There has been some significant development on rivets in SPR’s development history. In 1970s,
the SPR rivets were ‘Trifurcating rivets’ (A solid rivet pierces through the stack and is split into three
legs and flared by a fluted die); in 1980s, semi-tubular SPR rivets with basic tip geometry were
developed, and rivet tips started to be contained within the joint button (with ability to achieve water-
tight); since 1990s, the SPR rivets was further developed with reduced web thickness and engineered
tip geometry to produce uniform rivet flaring and consistent joint strength [23]. Nowadays, Self-
piercing rivets are normally semi-hollow and manufactured from metal wires by a multi-blow cold-
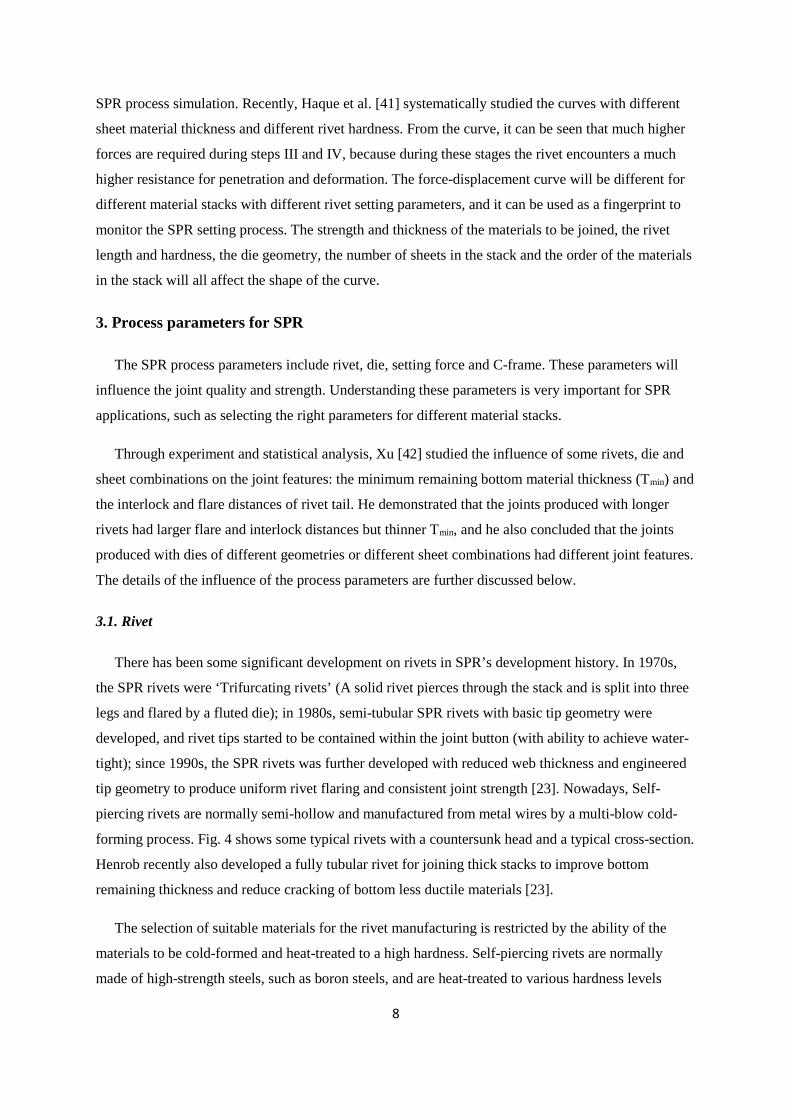
forming process. Fig. 4 shows some typical rivets with a countersunk head and a typical cross-section.
Henrob recently also developed a fully tubular rivet for joining thick stacks to improve bottom
remaining thickness and reduce cracking of bottom less ductile materials [23].
The selection of suitable materials for the rivet manufacturing is restricted by the ability of the
materials to be cold-formed and heat-treated to a high hardness. Self-piercing rivets are normally
made of high-strength steels, such as boron steels, and are heat-treated to various hardness levels
9
depending on the application. Rivets can also be made from aluminium alloys, copper, brass and
stainless steels, but their applications are very limited because these materials either cannot be heat-
treated to improve their piercing ability or their performance after hardening is poor [7]. In order to
increase the recyclability and reduce the galvanic corrosion potential, aluminium rivets were used for
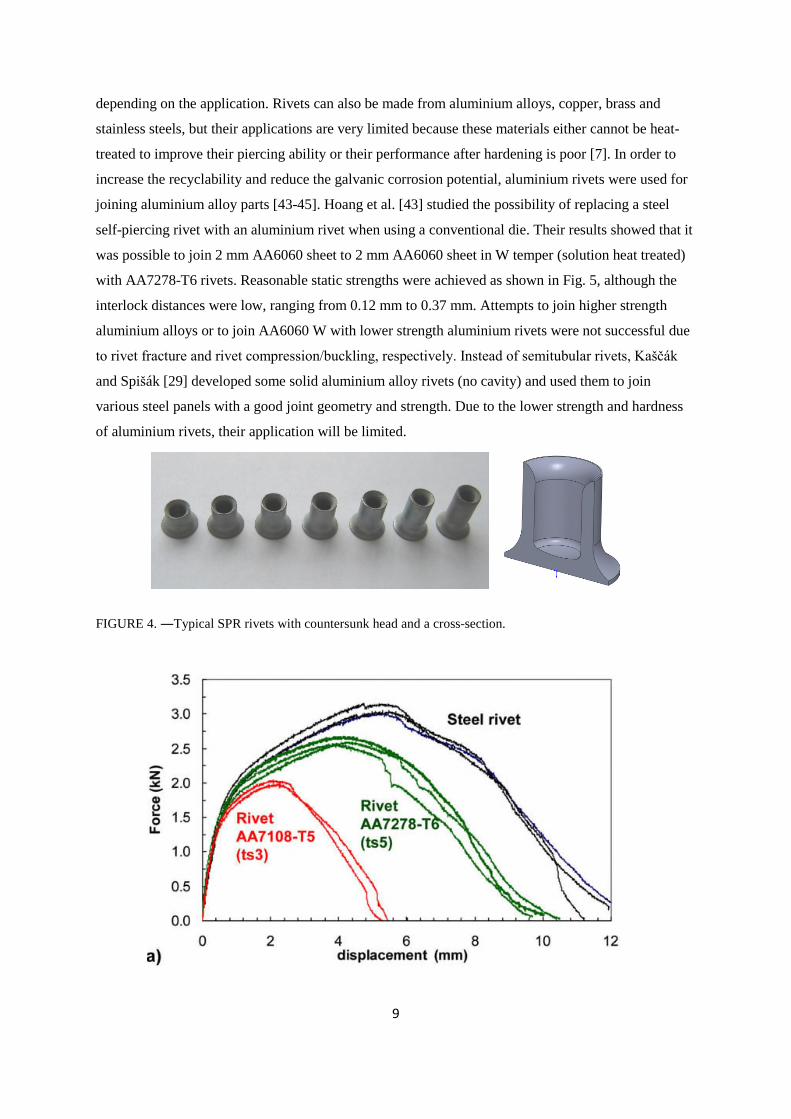
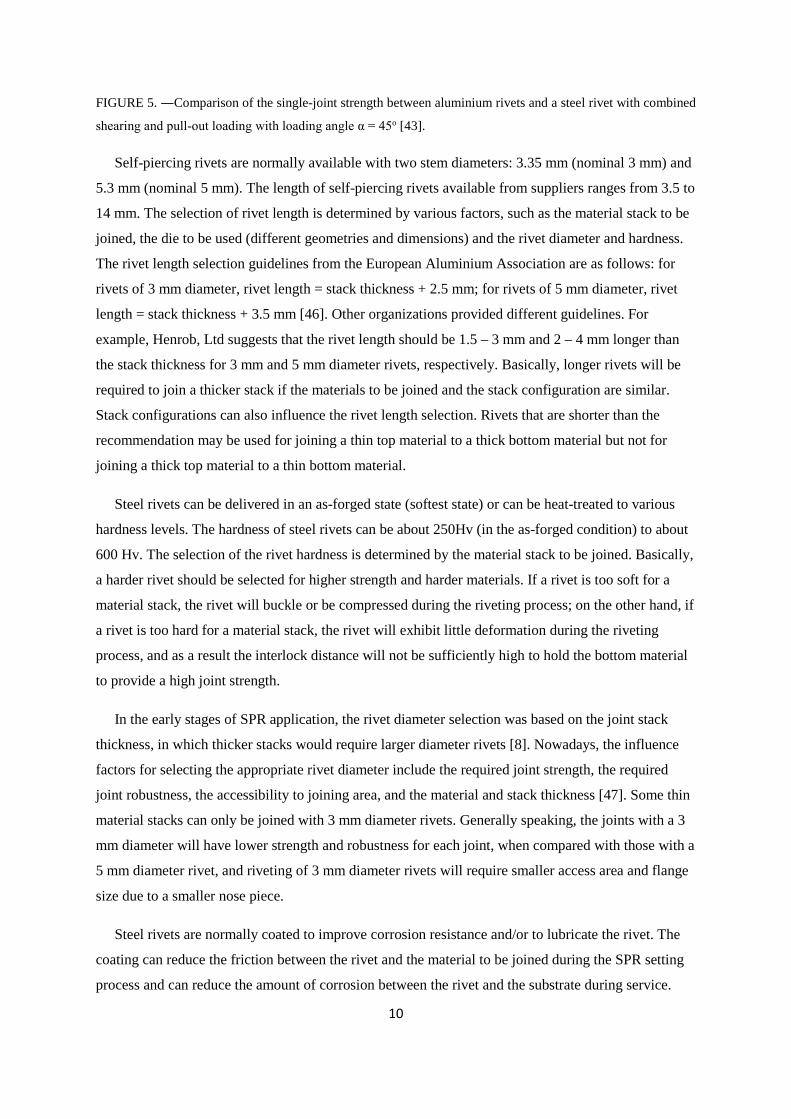
joining aluminium alloy parts [43-45]. Hoang et al. [43] studied the possibility of replacing a steel
self-piercing rivet with an aluminium rivet when using a conventional die. Their results showed that it
was possible to join 2 mm AA6060 sheet to 2 mm AA6060 sheet in W temper (solution heat treated)
with AA7278-T6 rivets. Reasonable static strengths were achieved as shown in Fig. 5, although the
interlock distances were low, ranging from 0.12 mm to 0.37 mm. Attempts to join higher strength
aluminium alloys or to join AA6060 W with lower strength aluminium rivets were not successful due
to rivet fracture and rivet compression/buckling, respectively. Instead of semitubular rivets, Kaščák
and Spišák [29] developed some solid aluminium alloy rivets (no cavity) and used them to join
various steel panels with a good joint geometry and strength. Due to the lower strength and hardness
of aluminium rivets, their application will be limited.
FIGURE 4. ―Typical SPR rivets with countersunk head and a cross-section.
10
FIGURE 5. ―Comparison of the single-joint strength between aluminium rivets and a steel rivet with combined
shearing and pull-out loading with loading angle α = 45o [43].
Self-piercing rivets are normally available with two stem diameters: 3.35 mm (nominal 3 mm) and
5.3 mm (nominal 5 mm). The length of self-piercing rivets available from suppliers ranges from 3.5 to
14 mm. The selection of rivet length is determined by various factors, such as the material stack to be
joined, the die to be used (different geometries and dimensions) and the rivet diameter and hardness.
The rivet length selection guidelines from the European Aluminium Association are as follows: for
rivets of 3 mm diameter, rivet length = stack thickness + 2.5 mm; for rivets of 5 mm diameter, rivet
length = stack thickness + 3.5 mm [46]. Other organizations provided different guidelines. For
example, Henrob, Ltd suggests that the rivet length should be 1.5 – 3 mm and 2 – 4 mm longer than
the stack thickness for 3 mm and 5 mm diameter rivets, respectively. Basically, longer rivets will be
required to join a thicker stack if the materials to be joined and the stack configuration are similar.
Stack configurations can also influence the rivet length selection. Rivets that are shorter than the
recommendation may be used for joining a thin top material to a thick bottom material but not for
joining a thick top material to a thin bottom material.
Steel rivets can be delivered in an as-forged state (softest state) or can be heat-treated to various
hardness levels. The hardness of steel rivets can be about 250Hv (in the as-forged condition) to about
600 Hv. The selection of the rivet hardness is determined by the material stack to be joined. Basically,
a harder rivet should be selected for higher strength and harder materials. If a rivet is too soft for a
material stack, the rivet will buckle or be compressed during the riveting process; on the other hand, if
a rivet is too hard for a material stack, the rivet will exhibit little deformation during the riveting
process, and as a result the interlock distance will not be sufficiently high to hold the bottom material
to provide a high joint strength.
In the early stages of SPR application, the rivet diameter selection was based on the joint stack
thickness, in which thicker stacks would require larger diameter rivets [8]. Nowadays, the influence
factors for selecting the appropriate rivet diameter include the required joint strength, the required
joint robustness, the accessibility to joining area, and the material and stack thickness [47]. Some thin
material stacks can only be joined with 3 mm diameter rivets. Generally speaking, the joints with a 3
mm diameter will have lower strength and robustness for each joint, when compared with those with a
5 mm diameter rivet, and riveting of 3 mm diameter rivets will require smaller access area and flange
size due to a smaller nose piece.
Steel rivets are normally coated to improve corrosion resistance and/or to lubricate the rivet. The
coating can reduce the friction between the rivet and the material to be joined during the SPR setting
process and can reduce the amount of corrosion between the rivet and the substrate during service.
11
Common coatings include mechanical tin/zinc coatings, mechanical zinc coatings, mechanical Almac
(aluminium and zinc), electric zinc plating, electric tin plating, Kal-gard and epoxy painting for rivet
head etc.
Simulation can be used to design rivets for SPR applications. Xu [48] simulated the influence of
yield strength of the rivet material on the setting process. His results showed that when the yield
strength of a self-piercing rivet material was too low, the rivet deformed before it could pierce the top
sheet, and when the yield strength of the rivet material was too high, the rivet could not be deformed,
such that it could not form an interlock within the sheets. To use the advantage of SPR as a cold
joining process and to make it suitable for joining small structures, Presz and Cacko [49] scaled down
the size of a normal 5 mm diameter self-piercing rivet to a micro-rivet with diameter of 0.7 mm. They
simulated the forming process of 4 different types of micro-rivets, and based on the properties of these
rivets they simulated the micro-SPR joining process. Their results showed that these rivets were
strong enough to obtain micro-SPR joints with a good joint quality.
3.2. Die
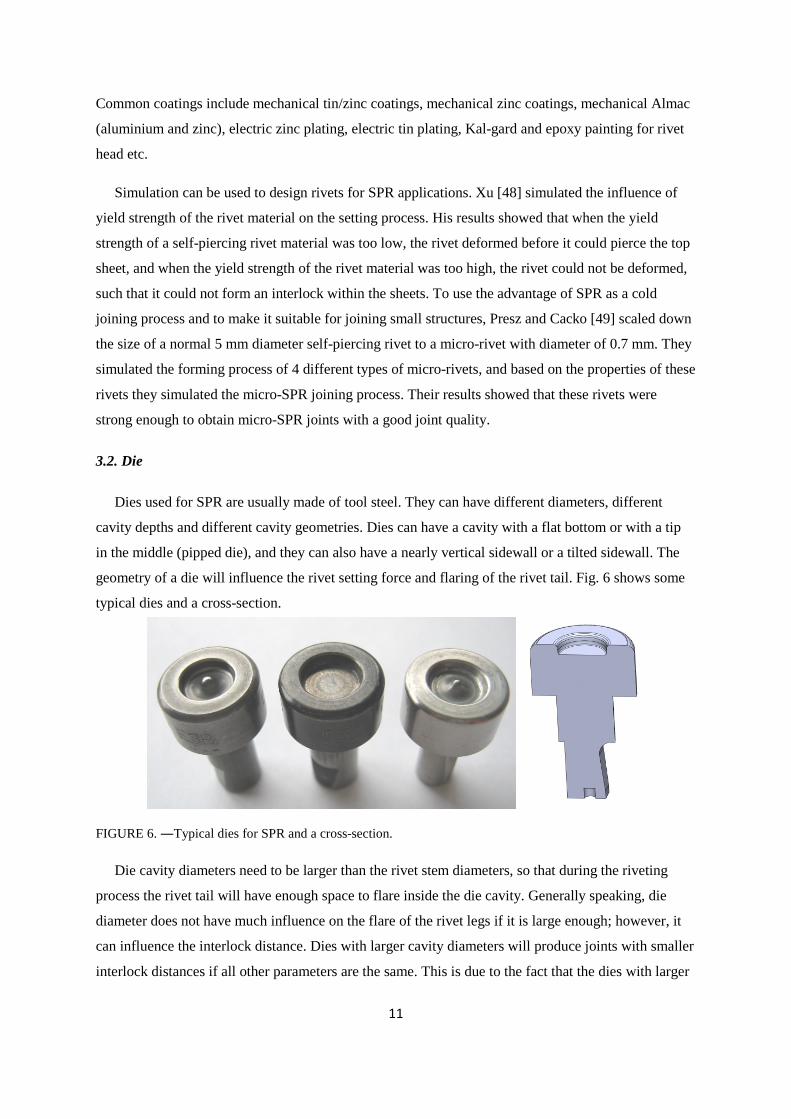
Dies used for SPR are usually made of tool steel. They can have different diameters, different
cavity depths and different cavity geometries. Dies can have a cavity with a flat bottom or with a tip
in the middle (pipped die), and they can also have a nearly vertical sidewall or a tilted sidewall. The
geometry of a die will influence the rivet setting force and flaring of the rivet tail. Fig. 6 shows some
typical dies and a cross-section.
FIGURE 6. ―Typical dies for SPR and a cross-section.
Die cavity diameters need to be larger than the rivet stem diameters, so that during the riveting
process the rivet tail will have enough space to flare inside the die cavity. Generally speaking, die
diameter does not have much influence on the flare of the rivet legs if it is large enough; however, it
can influence the interlock distance. Dies with larger cavity diameters will produce joints with smaller
interlock distances if all other parameters are the same. This is due to the fact that the dies with larger
12
cavity diameters have less constraint on the bottom material. So the diameter of the die cavity cannot
be too large. Normally, 3 mm diameter rivets need smaller diameter dies, such as dies with a cavity
diameter of 6 mm or 7 mm, and 5 mm diameter rivets need larger diameter dies, such as dies with a
cavity diameter no less than 8 mm.
Dies for SPR may have a cavity with a flat bottom or a pip in the middle with different geometries
and dimensions. Normally, a pip in the die can enhance rivet deformation and increase the interlock
distance, but it will also introduce larger plastic deformation of the bottom sheet and will require a
larger setting force. So a die with a pip will produce more severe cracks when a less ductile material is
used as the bottom material.
Dies for SPR may have different cavity depth. Normally, a deeper die will provide less support to
the bottom material, and as a result, less force will be required to set the rivet, but a smaller interlock
distance will be generated. In addition, a deeper die will introduce larger plastic deformation in the
bottom sheet and may introduce necking problems at the joint button and cracking issue for less
ductile materials. Consequently, in order to avoid severe cracking, a deep die will not be suitable
when a less ductile material is used as the bottom material.
Research by Li et al. [50] showed that when a less ductile metal is used as the bottom material, it is
better to use dies with a shallow cavity and if possible use dies with a tilted sidewall to avoid
excessive plastic deformation and cracking. They demonstrated that even though the high strength
aluminium alloy AA6008 had good ductility with elongation of more than 20%, when it was joined as
the bottom material using a die with a vertical sidewall and a depth of 2 mm, severe cracks were
generated at the joint button. To reduce the size and number of cracks to an acceptable level, a die
with a more shallow depth and a tilted sidewall was required to join the AA6008 as the bottom
material. Apart from reducing cracking, Sunday [4] also pointed out that a tilted sidewall in a die can
facilitate the die release at the end of riveting.
Proper die design can be used to improve the rivetability of some material stacks. Iguchi and Ohmi
[51] tried to improve the capability of the SPR process. They designed a die that has the capability to
join a thick sheet to a thin and less ductile sheet as the bottom material. By using a spring-loaded
sliding pin in the centre of the die, the excess denting of the top thick sheet could be prevented and the
penetration of rivet into the bottom sheet was increased.
Simulation can also be used to optimise the profile of the die for a particular stack. Mori et al. [52]
conducted simulation using LS-DYNA to optimize the profile of the die to join an ultra-high strength
steel to an aluminium alloy.
13
3.3. Setting force
During the SPR process, a relatively high force, ranging from 20 kN to 100 kN, is required to set a
rivet into a material stack to form a joint through pushing, punching or other methods. The joint will
need to satisfy all the geometry and strength criteria, such as lap shear strength, T-peel strength, rivet
head height, interlock distance and minimum remaining bottom material thickness, so the force cannot
be too high or too low. If the force is too low, the rivet head may protrude out of the top flush surface
that is not good for cosmetics. It may also facilitate corrosion due to the existence of a big gap, into
which water may penetrate. In addition, a low setting-force may lead to a short interlock distance,
which will lead to a joint with low strength. If the force is too high, the indentation caused by the rivet
head may be too large and the minimum remaining bottom material thickness may be too small. A
large indentation may damage the top sheet and reduce the strength of the top sheet to resist the rivet
from being pulled out.
Hill [8] reviewed the parameters that could influence the rivet setting force. The parameters
discussed include the rivet shank diameter, the rivet shank end form (tip geometry), the friction
between rivet and sheet materials, the die shape, the sheet material thickness and hardness, and the
rivet hardness. Hou et al. [36] also studied the parameters that could affect the setting force, including
the die geometry, the rivet length, the material stack, the planar misalignment (gap between the sheet
materials) and the axial misalignment (between the rivet gun and the die). Their results showed that
planar misalignment could change the joint features and reduce the setting force, but slight axial
misalignment did not have obvious influence on the setting force. It is widely agreed that the value of
the setting force depends on the sheet material strength, the material and stack thickness, the rivet
length, the rivet tip geometry, the rivet coating, the rivet hardness and the die geometry etc. Generally
speaking, if other parameters are kept the same, harder/stronger sheet materials, more shallow dies or
dies with a pip, larger rivet diameters, higher friction between rivet and sheet materials, longer or
harder rivets and rivets with blunter tip geometries will require higher setting forces.
3.4. C-frame
The SPR process needs a high setting force typically around 10 times of those used for spot-
welding. Tool alignment for a SPR system also needs to be better than that for spot-welding. As a
result, the C-frame needs to be stronger and more rigid. Information provided by industry suggested
that the deformation of a C-frame during a setting process needed to be restricted within 7 mm along
the loading line with an angular deflection less than 1° [35]. Other parameters that are important for
the C-frame include the throat depth and weight. The throat depth of a C-frame determines the lateral
access ability, and the weight of a C-frame will determine its automation ability, the mobility of the
14
robot with the C-frame is mounted on and the cost of automation. For easy automation, research has
been undertaken to reduce the weight of the C- frame. Westgate et al. [35] developed a lightweight
deep throat C-frame for an early robot-mounted hydraulic SPR system. Nowadays, electric-servo SPR
systems are preferred, which are much lighter than hydraulic SPR systems and also eliminate the need
for connections to high pressure hoses. As a result, the requirement on the weight of the C-frame is
reduced and the automation of the SPR process becomes easier and less costly.
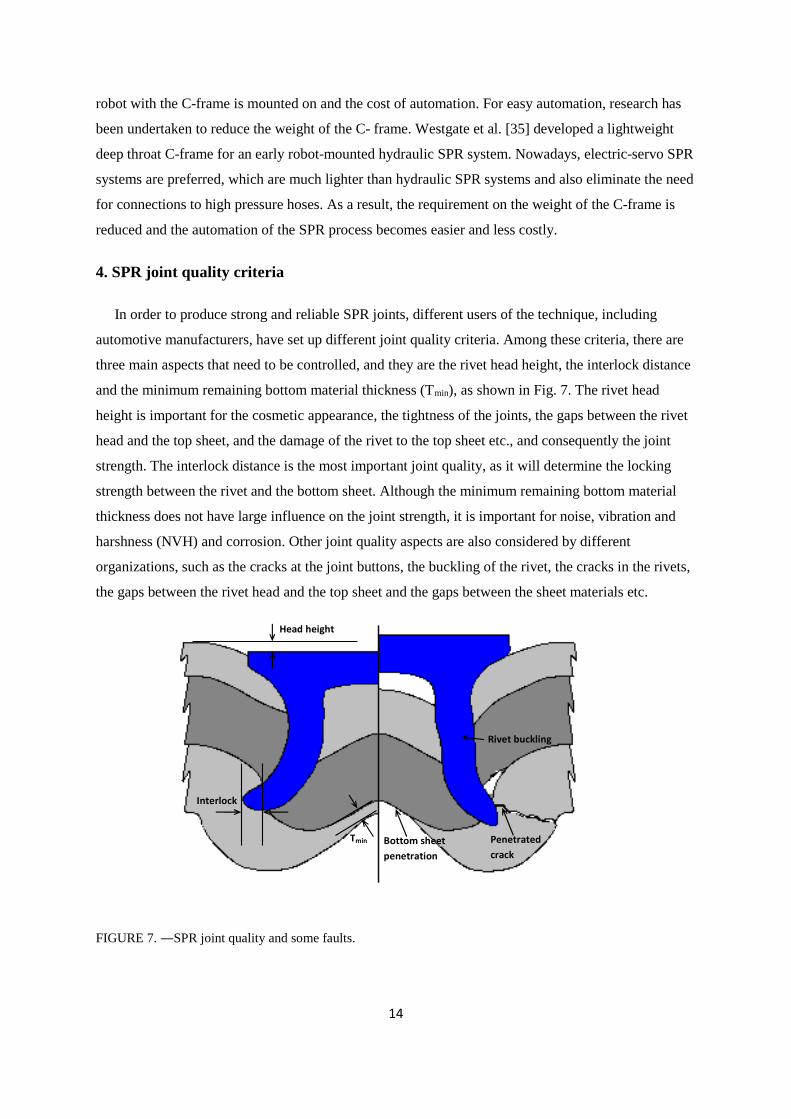
4. SPR joint quality criteria
In order to produce strong and reliable SPR joints, different users of the technique, including
automotive manufacturers, have set up different joint quality criteria. Among these criteria, there are
three main aspects that need to be controlled, and they are the rivet head height, the interlock distance
and the minimum remaining bottom material thickness (Tmin), as shown in Fig. 7. The rivet head
height is important for the cosmetic appearance, the tightness of the joints, the gaps between the rivet
head and the top sheet, and the damage of the rivet to the top sheet etc., and consequently the joint
strength. The interlock distance is the most important joint quality, as it will determine the locking
strength between the rivet and the bottom sheet. Although the minimum remaining bottom material
thickness does not have large influence on the joint strength, it is important for noise, vibration and
harshness (NVH) and corrosion. Other joint quality aspects are also considered by different
organizations, such as the cracks at the joint buttons, the buckling of the rivet, the cracks in the rivets,
the gaps between the rivet head and the top sheet and the gaps between the sheet materials etc.
FIGURE 7. ―SPR joint quality and some faults.
Head height
Interlock
Tmin Bottom sheet
penetration
Penetrated
crack
Rivet buckling
15
Joint quality criteria are substrate material related. For a joint with steel as the bottom
sheet/locking sheet, the minimum required interlock distance can be reduced, because steel is stronger
than aluminium [53]. According to a leading automotive manufacturer, the joint quality criteria
include a rivet head height between 0.3 mm to -0.5 mm (a negative rivet head height implies that the
rivet head is below the flush surface of the top sheet), an interlock distance of at least 0.4 mm for
joints with an aluminium alloy as the bottom sheet and at least 0.2 mm for joints with a steel as the
bottom sheet, and a Tmin of at least 0.2 mm (Han et al. 2010a). Generally speaking, the lower the rivet
head height, the higher the interlock distance will be, as reported by Han et al. [54] for mixed
aluminium alloy and steel joints and Li et al. [53] for aluminium alloy joints.
5. Suitable materials for joining using SPR
One of the advantages of SPR is that it can be used to join similar and dissimilar materials. While
SPR is widely applied for joining aluminium structures, it can also be used to join other materials and
mixed materials, including aluminium, steel, magnesium, copper, plastics, wood and composites etc.
Aluminium alloys that can be joined by SPR can be from wrought, extruded and cast alloys. The
grades of wrought aluminium alloys used in automotive body applications include 5xxx and 6xxx etc.
Steels that can be joined by SPR include mild steel, high-strength steels and advanced high-strength
steels.
The general requirements for materials that can be joined by SPR include the following: (i)
materials need to have sufficient ductility, especially for bottom materials that are next to the die, so
severe cracks will not be generated at the joint buttons; (ii) materials need to have a hardness/strength
much less than that of the rivet, so that the rivet can pierce through/into the material and form a
sufficiently high interlock distance without excessive compression or buckling. Brittle materials may
be able to be joined when used as the top or middle material, but not as the bottom material on the die
side without assistance from other sources, such as heating.
For a stack with two layers, the ratio between the thickness of the top and bottom materials can
influence the rivetability of the stack and the strength of the joint. Normally, better rivetability and
strength will be achieved when a thinner sheet is used as the top material and a thicker sheet is used as
the bottom material. However, due to access limitations and other issues, sometimes rivets can only
be pierced from the thicker sheet side, and in this case careful design/selection of rivets and dies is
required to achieve the desired joint quality.
The study of the rivetability of various material combinations has been the subject of several
investigations. Abe et al. [15] studied the joinability of an aluminium alloy to mild steel, and their
results showed that to join the aluminium alloy as the top sheet and the steel as the bottom sheet, the
16
top sheet needed to be thinner than the bottom sheet. They also demonstrated that to join the steel as
the top sheet and the aluminium alloy as the bottom sheet, a better joinability can be achieved than to
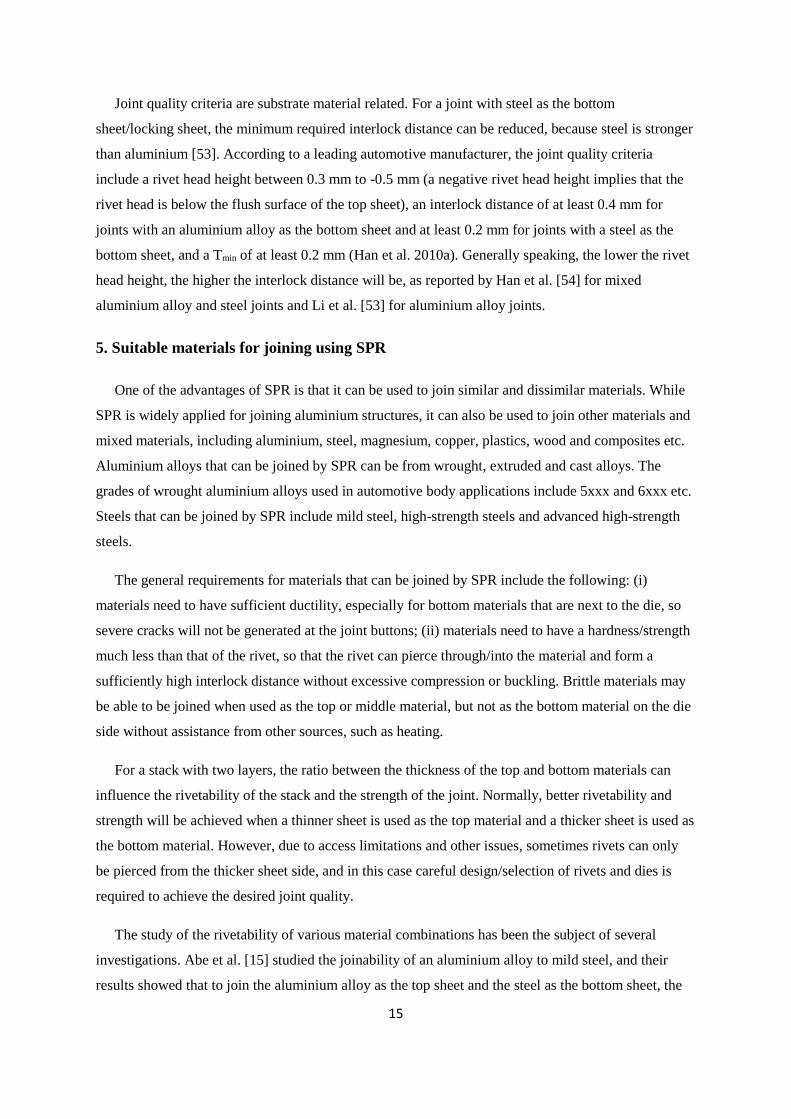
join the aluminium alloy as the top sheet and the steel as the bottom sheet. Mori et al. [52] studied the
feasibility of joining an ultra-high strength steel to an aluminium alloy using SPR. They found that if
the rivet was not hard enough, joint defects from rivets could occur, such as the rivet fracture, the rivet
compression and the rivet bending, as shown in Fig. 8. These rivet defects will normally occur when
the rivet is too soft for the materials to be joined. With the optimized rivets and dies, they then
successfully joined the SPFC980 ultra-high strength steel (tensile strength around 980 MPa) to
AA5052-H34. Another example of rivet failure by compression and fracture during the riveting
process was shown by Hoang et al. [43], when they joined aluminium alloys with aluminium rivets.
FIGURE 8. ―Possible joint defects for joining an ultra-high strength steel to an aluminium alloy by SPR [52].
The joining of magnesium alloys using SPR has been studied by various researchers. Magnesium
alloys have low ductility at room temperature due to their hexagonal lattice structure, but their
ductility increases with the increase of temperature. Research by Hahn and Horstmann [55] showed
that after locally heating magnesium alloy AZ31 to 280oC using induction heating, it was possible to
join AZ31 as the top and/or bottom materials by SPR and clinching. Durandet et al. [56] proposed to
use laser assisted SPR to join magnesium alloys. When wrought strips of AZ31B-H24 magnesium
alloy with a thickness of 2.35 mm and 3.2 mm were heated above 200oC, the AZ31 could be
successfully self-piercing riveted without cracks.
Sjöström [57] studied the possibility of self-piercing riveting a cast magnesium alloy (AM60B) to
an ultra-high strength steel (Dogal DP800). They found that the ductility of the magnesium alloy
limited the use of SPR; severe cracking of the magnesium alloy sheet occurred in all tested
configurations, but the number of cracks could be reduced by local heating of the magnesium alloy
substrate. Local heating of the magnesium alloy substrate not only suppressed the cracking of the
magnesium alloy when it was used as the bottom sheet, but also improved the setting of the rivet head
and promoted the interlocking. To achieve sufficient interlocking between the rivet and the sheet
(a) Good joining (b) Leg compression (c)Leg fracture (d) Leg bending
17
materials and obtain an optimal joint strength, the thicker magnesium alloy substrate needed to be
placed on the die-side.
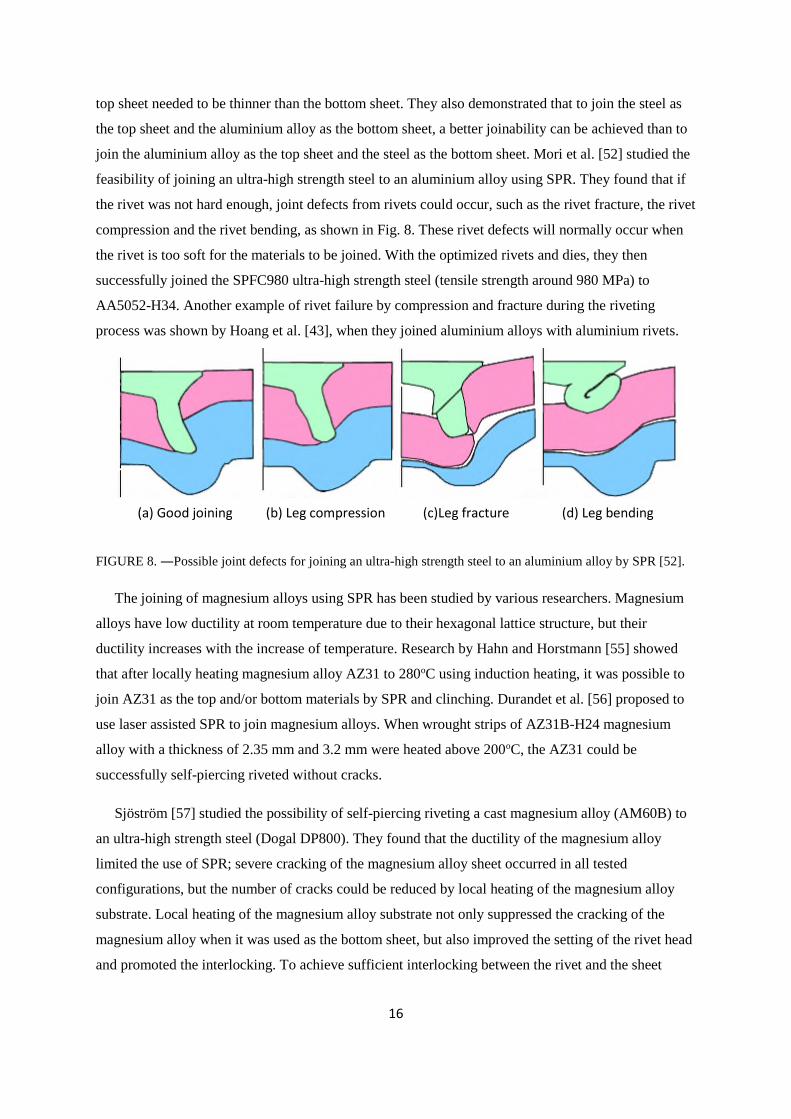
Table 1. ―Typical mechanical properties of the aluminium and magnesium alloys [58].
Alloy Yield Strength, Mpa Tensile strength, Mpa Elongation, %
Extruded AA6063-T6 215 240 12
Die cast AM50 125 210 10
Sheet AA5754-O 100 220 26
Sheet AZ31B-O 150 255 21
FIGURE 9. ―The cross-section of a SPR joint with extruded AA6063 and die-cast magnesium alloy AM50
[58].
Luo et al. [58] studied the rivetability of magnesium alloys to aluminium alloys. Table 1 shows the
mechanical properties of the alloys that were used. The results showed that when used as the top
material, the die-cast magnesium alloy AM50 could be self-piercing riveted to the extruded AA6063,
but when the AM50 was joined as the bottom material, severe cracks occurred at the joint buttons, as
shown in Fig. 9. However, it was possible to join the extruded AA6063 as the bottom material due to
its better ductility. Because AA5754 and wrought magnesium alloy AZ31 had large elongations, 26%
and 21%, respectively, it was possible to join both AA5754 and AZ31 as the top and bottom
materials.
Apart from the influence of local heating on the rivetability of magnesium alloys, Wang et al. [59]
also studied the influence of local heating on the joint strength and the failure modes. They found that
when riveting 2 mm AZ31 to 2 mm AZ31 at room temperature, severe cracking occurred at the joint
button, but when the AZ31 was pre-heated to 180oC or above, the cracks were eliminated. They also
18
observed that by pre-heating the AZ31, the lap shear strength of the joints could be increased and the
failure of joints during lap shear tests changed from tearing of the bottom sheet to rivet being pulled
out from the bottom sheet. SPR can also be used in combination with adhesive to join magnesium
alloys to achieve a higher joint strength [60].
The variation in the results presented by different researchers on the rivetability of magnesium
alloy AZ31 may be caused by the different mechanical properties of the alloy. AZ31 can be produced
through different processes, such as die-casting, extrusion and rolling, resulting in different ductility.
Copper sheets have excellent ductility. SPR has been successfully used to join aluminium to
copper [61] and copper to copper [62].
SPR has also been tried to join sandwich materials. Pickin et al. [63] demonstrated that it was
possible to join a sandwich material (0.2 mm steel+1.6 mm polymer+0.2 mm steel) to a 2 mm thick
aluminium alloy using SPR. Unpublished results from the University of Warwick also showed that it
was possible to join steel/polymer sandwich materials to achieve a high joint strength.
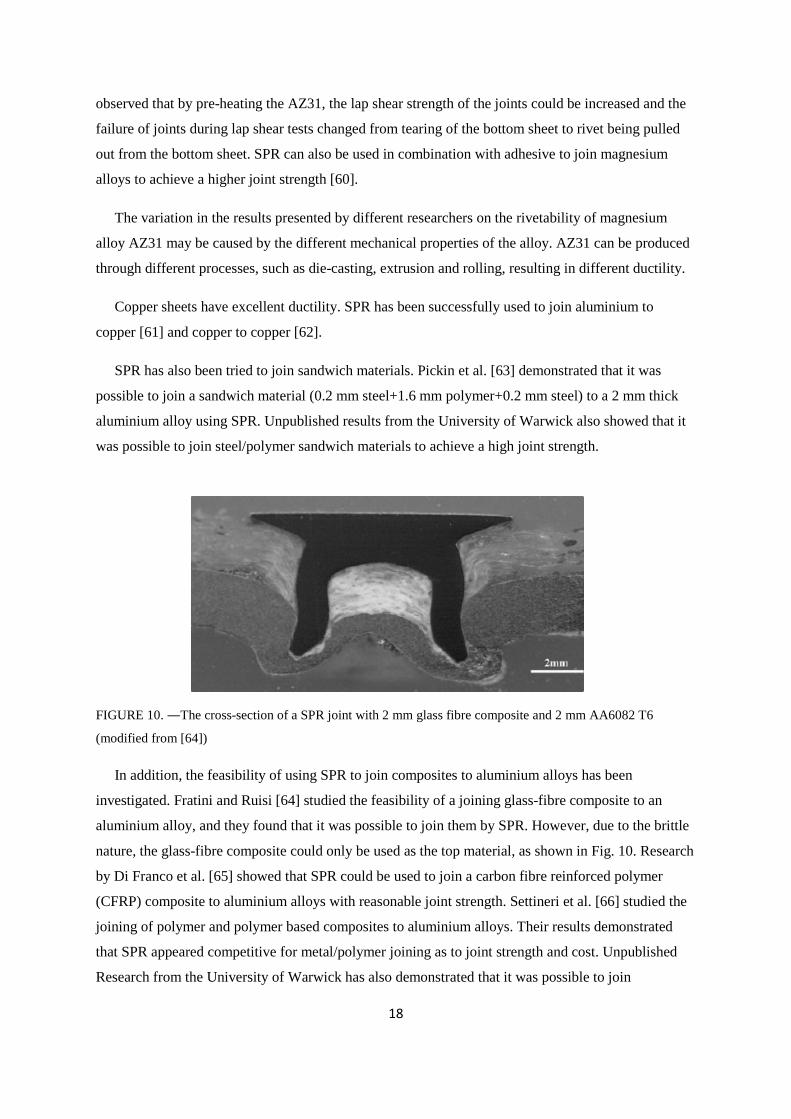
FIGURE 10. ―The cross-section of a SPR joint with 2 mm glass fibre composite and 2 mm AA6082 T6
(modified from [64])
In addition, the feasibility of using SPR to join composites to aluminium alloys has been
investigated. Fratini and Ruisi [64] studied the feasibility of a joining glass-fibre composite to an
aluminium alloy, and they found that it was possible to join them by SPR. However, due to the brittle
nature, the glass-fibre composite could only be used as the top material, as shown in Fig. 10. Research
by Di Franco et al. [65] showed that SPR could be used to join a carbon fibre reinforced polymer
(CFRP) composite to aluminium alloys with reasonable joint strength. Settineri et al. [66] studied the
joining of polymer and polymer based composites to aluminium alloys. Their results demonstrated
that SPR appeared competitive for metal/polymer joining as to joint strength and cost. Unpublished
Research from the University of Warwick has also demonstrated that it was possible to join
19
composites to aluminium alloys by SPR and by a combination of SPR and adhesive. Di Franco et al.
[67] demonstrated that by combining SPR and adhesive bonding, a high strength, a high stiffness and
high energy absorption could be achieved. Fiore et al. [68] studied the mechanical performance of a
Basalt Fiber Reinforced Polymer to aluminum alloy AA6086 mixed joints. Their results showed that
the strength of the self-piercing riveted joints was lower than that of the adhesive bonded joints.
The SPR process for joining composites to aluminium alloys was also studied through experiments
and simulation. Di Franco et al. [69] studied the SPR process for joining a CFRP to an aluminium
alloy through experiments and finite element modelling. Later, they reviewed their research with
additional emphasis on understanding the failure mechanisms [65, 70]. Results showed that applied
oil pressure of the electro-hydraulic riveting system had significant influence on the joint strength.
They found that the SPR process could be simulated using the finite element code DEFORMTM 2D,
and the predicted joint features and force–displacement curve matched well with the experimental
results. Mechanical tests showed that during static lap shear tests, all specimens failed by rivet being
pulled out from the top CFRP panel, and during a lap shear fatigue test, specimens failed at the top
CFRP panel around the rivet head or at the bottom aluminium alloy sheet along the joint button.
SPR can be used to join composites, as top or middle material, to metal materials. However, it is
clear that the SPR process can damage the reinforcing fibres and cause delamination during the
riveting process, which will reduce the strength of the composite. The standard SPR process is
believed not suitable for joining composites to composites because of the brittle nature of composites
and delamination. Researchers are trying to solve the issues faced by SPR when joining plastics and
composites. Henrob Ltd. [71] developed a new SPR process using a predrilled washer between the
rivet head and the top sheet and a non-drilled washer below the bottom sheet; in this process, the rivet
pierces through both the top and bottom sheets and flares into the lower washer. This process was
used to join Lotus Elan’s glass-fibre reinforced plastics (GRP) floor pan. Ueda et al. [72] introduced a
modified SPR process, in which two predrilled washers were introduced, with one between the rivet
head and the top of the stack and the other between the bottom of the stack and the bended rivet skirt.
By setting the rivets this way, the delamination of the composites was sufficiently suppressed;
however, there might be issues for aligning the rivet with the washers and the additional weight and
cost of the washers.
6. Mechanical performance of SPR joints
6.1. Contributing elements of static strength
Knowing the contributing elements of the static strengths of a SPR joint is very important for
understanding and improving the joint strength. Hill [8] proposed that the lap shear strength of a SPR
20
joint should be a combination of a direct shear force and a frictional force at the sheet interface.
However, he also suggested that the strength of a SPR joint was difficult to predict, because the
compression force in SPR joints, essential for friction, was not high and would be unpredictable.
A number of other researchers have also suggested that the frictional forces between the sheet
materials and between the rivet and the sheet materials are very important in the determination of the
static strength of SPR joints. Han and Chrysanthou [73] demonstrated that the residual compression
pressure from the rivet setting process could influence the frictional force between the rivet and the
sheet material, and consequently the static strength. Results from Han et al. [73, 74] also showed that
sheets with different surface conditions would require different rivet setting forces and result in
different joint strength and failure modes due to different friction behaviour at the interfaces. Later, Li
et al. [75, 76] pointed out that the friction between the top and bottom sheets, around the tip of the
punched hole in the top sheet, was very important for the static lap shear strength.
In the case of SPR with two layer of materials, it is believed that the strength of a SPR joint is a
combination of (i) the force to deform the top material underneath the rivet head or the bottom
material locked by the rivet tail, (ii) the frictional force between the rivet head and the top sheet or
between the rivet tail and the locked bottom sheet, and (iii) the frictional force between the top and
bottom sheets, especially around the tip of the punched hole in the top sheet. However, the influence
of the frictional force between the top and bottom sheets on T-peel and cross-tension strength is not
significant.
6.2. Influence of rivets, dies, sheet materials and stack orientations
Han et al. [77] demonstrated that the strength of SPR joints was affected by the selection of rivets,
dies and sheet materials due to the different joint features and materials strength. Hill [8] studied the
static lap shear and cross-tension strengths of the SPR joints for steel and an aluminium alloy and
presented some typical strength of single-rivet joints with various stack thickness.
The influence of the sheet materials on joint strength can be from the sheet thickness, the stack
thickness and the material strength. Madasamy et al. [78] studied the static and impact behaviours of
some aluminium alloy SPR joints, where the sheet thickness was 1 mm, 2 mm and 3 mm. They found
that the joint strength was sensitive on the thickness of the top sheet. Further studies from Madasamy
et al. [79] investigated the crash performance of the aluminium alloy and steel rails joined by SPR. It
was found that for the aluminium alloy crash rails, the thickness of the sheet material was the main
factor that influenced the performance, and for the steel crash rails, the sheet material thickness, the
impact speed and the temperature all had significant influence on the impact performance.
21
Research by Hill [8] showed that for both the steel and aluminium alloy SPR joints, the lap shear
and cross-tension strength increased with the increase of the stack thickness, and research by Taylor
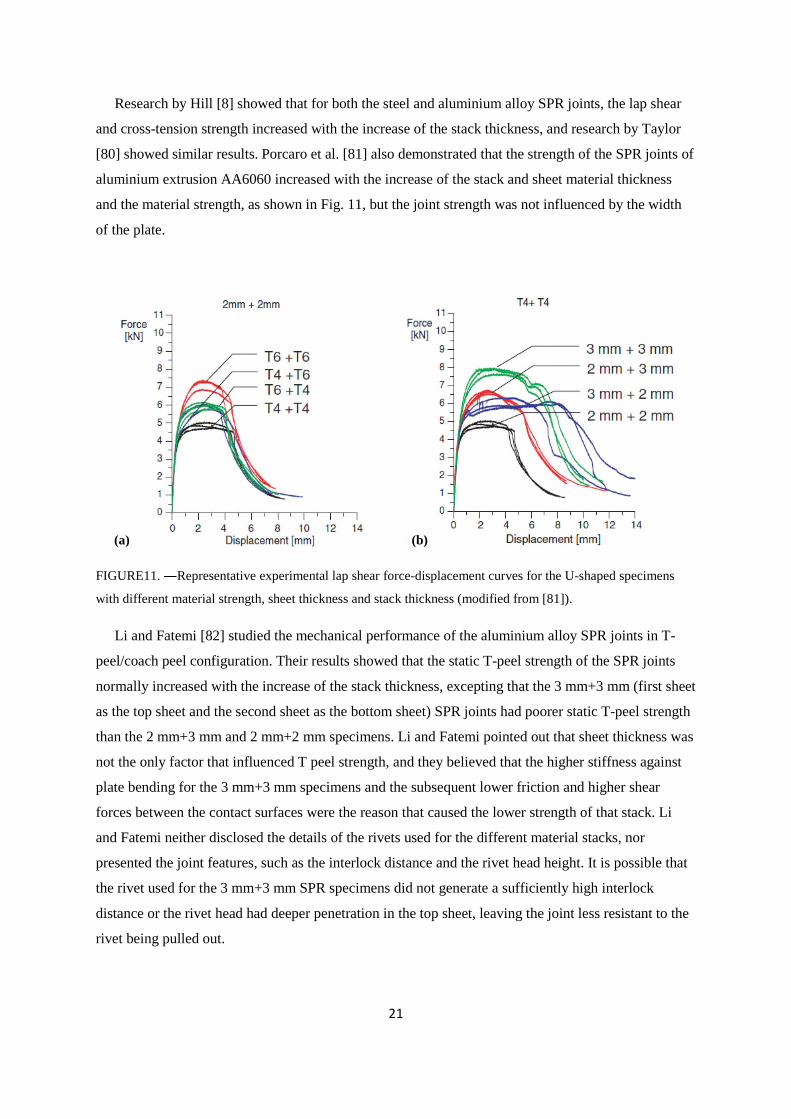
[80] showed similar results. Porcaro et al. [81] also demonstrated that the strength of the SPR joints of
aluminium extrusion AA6060 increased with the increase of the stack and sheet material thickness
and the material strength, as shown in Fig. 11, but the joint strength was not influenced by the width
of the plate.
FIGURE11. ―Representative experimental lap shear force-displacement curves for the U-shaped specimens
with different material strength, sheet thickness and stack thickness (modified from [81]).
Li and Fatemi [82] studied the mechanical performance of the aluminium alloy SPR joints in T-
peel/coach peel configuration. Their results showed that the static T-peel strength of the SPR joints
normally increased with the increase of the stack thickness, excepting that the 3 mm+3 mm (first sheet
as the top sheet and the second sheet as the bottom sheet) SPR joints had poorer static T-peel strength
than the 2 mm+3 mm and 2 mm+2 mm specimens. Li and Fatemi pointed out that sheet thickness was
not the only factor that influenced T peel strength, and they believed that the higher stiffness against
plate bending for the 3 mm+3 mm specimens and the subsequent lower friction and higher shear
forces between the contact surfaces were the reason that caused the lower strength of that stack. Li
and Fatemi neither disclosed the details of the rivets used for the different material stacks, nor
presented the joint features, such as the interlock distance and the rivet head height. It is possible that
the rivet used for the 3 mm+3 mm SPR specimens did not generate a sufficiently high interlock
distance or the rivet head had deeper penetration in the top sheet, leaving the joint less resistant to the
rivet being pulled out.
(a) (b)
22
Khanna et al. [83] studied the mechanical properties of self-piercing riveted AA6111 aluminium
alloy joints of various thickness combinations. Their results showed that for joints with equal
thickness for the top and bottom sheets, the static and fatigue strength (lap shear and T-peel) both
increased with the increase of sheet material thickness. For joints with unequal top and bottom sheet
thickness, the strength of the joints was greatly determined by the thinner sheet.
Li et al. [50] evaluated the joint quality and the mechanical strength of a high strength aluminium
alloy SPR joints. The results showed that the static lap shear and T-peel strength of the joints
increased greatly with the increase of the top material (AA5754) thickness, but the increase of bottom
material (AA6008) strength, from 195 MPa to 250 MPa, only had marginal influence on the static
joint strength. It was also demonstrated that when the AA6008 sheet was joined as the bottom
material, a thinner top material could make the cracking of the bottom AA6008 more severe than a
thicker top material.
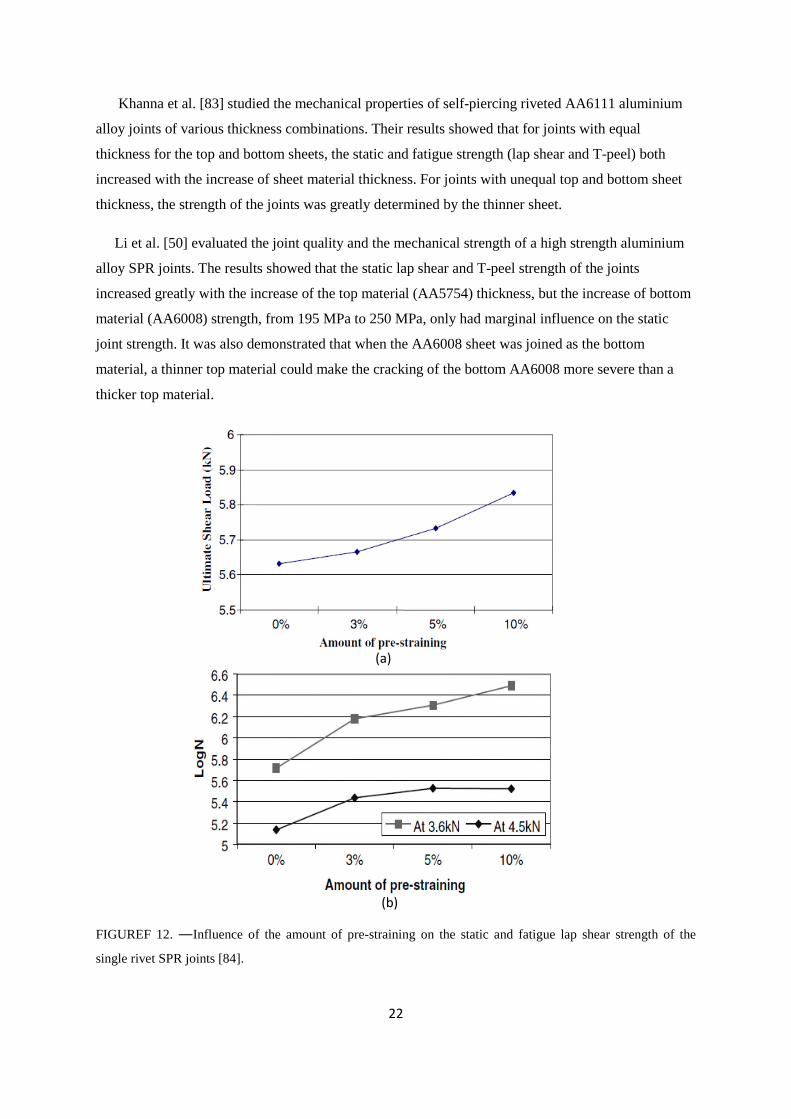
FIGUREF 12. ―Influence of the amount of pre-straining on the static and fatigue lap shear strength of the
single rivet SPR joints [84].
(a)
(b)
23
Many parts used in automotive body structures are stamped, and during the stamping process
materials are strained. In order to determine the influence of stamping, Han et al. [84] studied the
influence of pre-straining on the mechanical behaviour of aluminium alloy joints. The stack they
studied had 2 mm AA5754 as both the top and bottom sheets, and they compared the static and
fatigue lap shear strength of the specimens with the original AA5754 and the AA5754 with 3%, 5%
and 10% pre-strain. They found that the pre-straining improved both the static and fatigue strength of
the joints, as shown in Fig. 12.
SPR joints with different rivets may have different joint strength due to the different rivet
diameters, rivet hardness, and rivet lengths. The influence of the rivet tip geometry on joint strength
will be discussed separately in a later section. Results from Hill [8] and Taylor [80] showed that for
both steel and aluminium alloy SPR joints, the joints with larger diameter rivets exhibited higher
shear and tension strength. Madasamy et al. [78] demonstrated that the joints with 5 mm diameter
rivets had higher strength and higher energy absorption than the joints with 3 mm diameter rivets.
These observations are probably due to the increased strength of rivet itself, the increase interlock
distance and the increased rivet head size. Influence of the rivet length on joint strength is mainly
caused by different joint features, such as the rivet head height, the interlock distance and the
minimum remaining bottom material thickness (Tmin). SPR joints with longer rivets normally have
higher joint strength and energy absorption due to a larger interlock distance, providing that the rivet
head height and Tmin are similar.
The influence of the stack orientation (rivet setting direction) on joint strength is mainly due to the
resulting different joint features and for mixed material stacks, the strength difference of the top and
bottom materials. Madasamy et al. [78] studied the influence of stack orientation on the joint strength
of aluminium stacks. An aluminium alloy with different thickness of 1 mm, 2 mm and 3 mm was
used, and their results showed that with the same stack thickness, setting the rivet through the thinner
sheet side would result in the joint having higher strength and energy absorption. Similarly, Porcaro et
al. [81] presented that the use of a thicker material as the bottom sheet would normally produce the
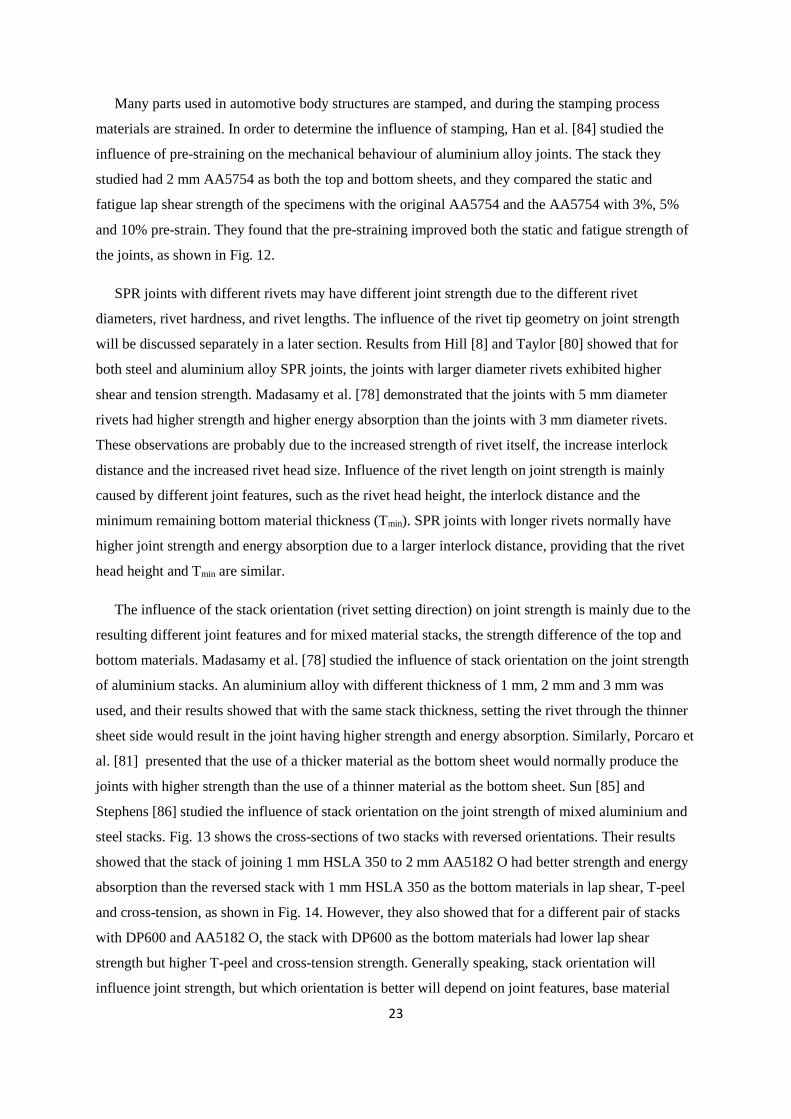
joints with higher strength than the use of a thinner material as the bottom sheet. Sun [85] and
Stephens [86] studied the influence of stack orientation on the joint strength of mixed aluminium and
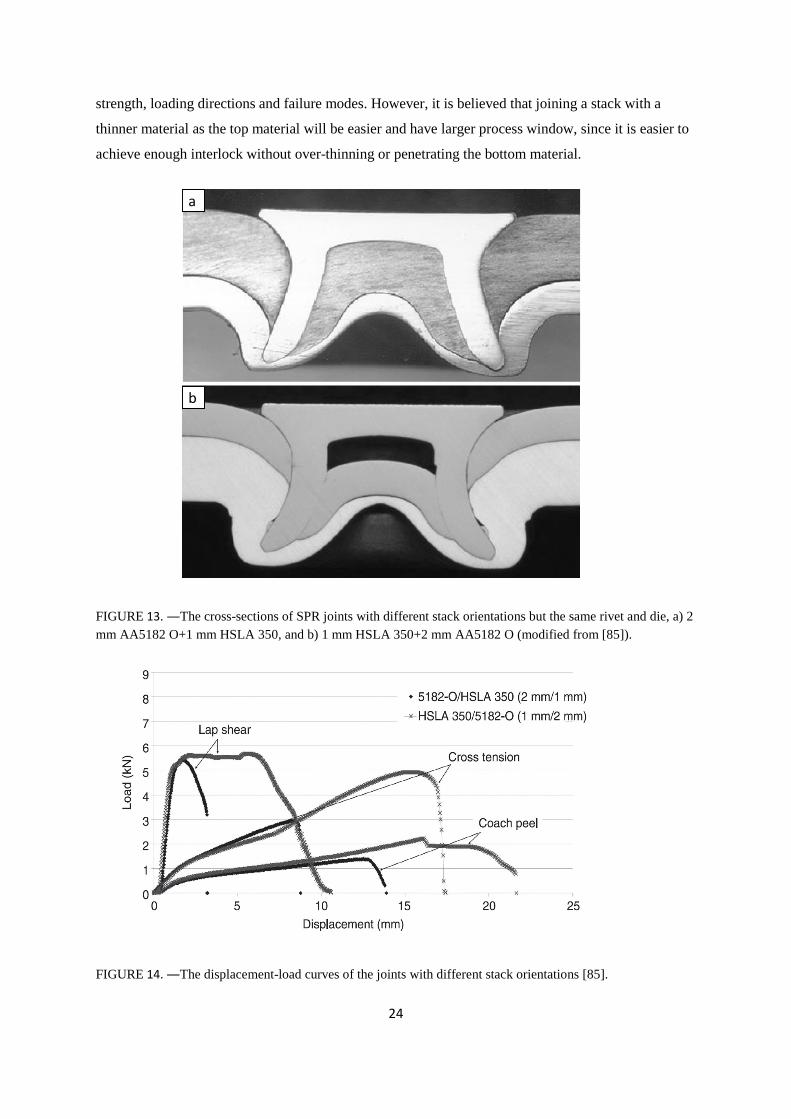
steel stacks. Fig. 13 shows the cross-sections of two stacks with reversed orientations. Their results
showed that the stack of joining 1 mm HSLA 350 to 2 mm AA5182 O had better strength and energy
absorption than the reversed stack with 1 mm HSLA 350 as the bottom materials in lap shear, T-peel
and cross-tension, as shown in Fig. 14. However, they also showed that for a different pair of stacks
with DP600 and AA5182 O, the stack with DP600 as the bottom materials had lower lap shear
strength but higher T-peel and cross-tension strength. Generally speaking, stack orientation will
influence joint strength, but which orientation is better will depend on joint features, base material
24
strength, loading directions and failure modes. However, it is believed that joining a stack with a
thinner material as the top material will be easier and have larger process window, since it is easier to
achieve enough interlock without over-thinning or penetrating the bottom material.
FIGURE 13. ―The cross-sections of SPR joints with different stack orientations but the same rivet and die, a) 2
mm AA5182 O+1 mm HSLA 350, and b) 1 mm HSLA 350+2 mm AA5182 O (modified from [85]).
FIGURE 14. ―The displacement-load curves of the joints with different stack orientations [85].
a
b
25
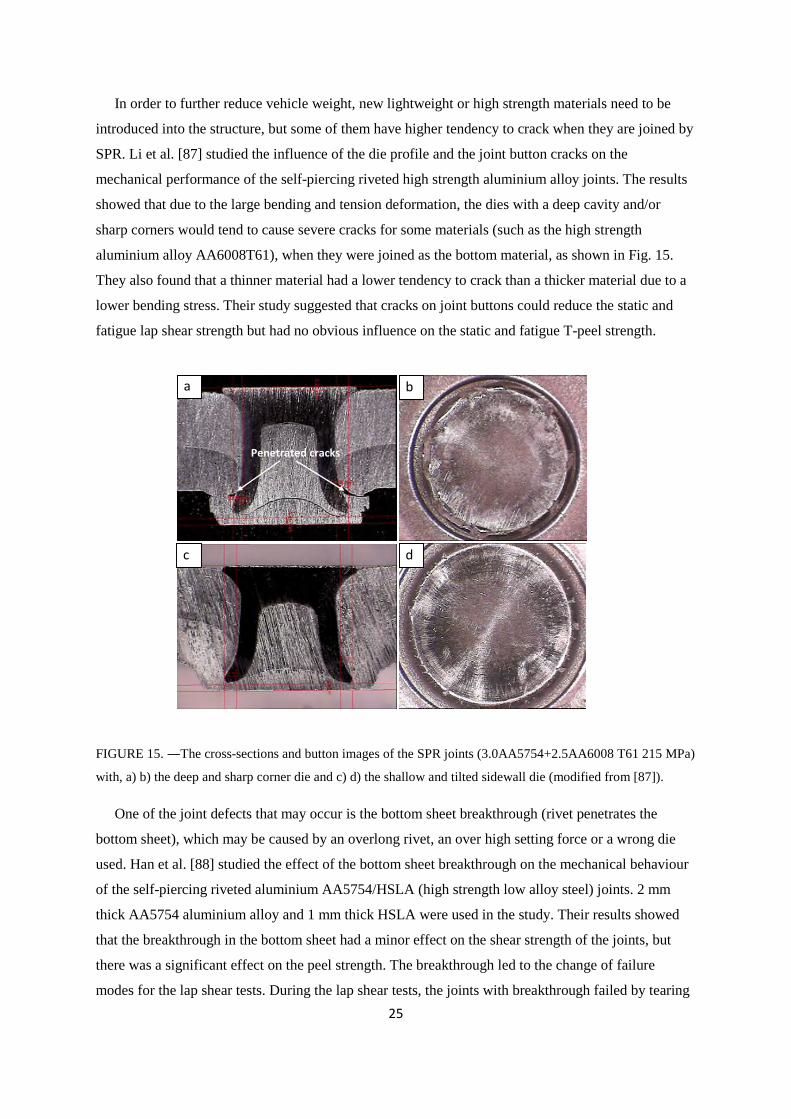
In order to further reduce vehicle weight, new lightweight or high strength materials need to be
introduced into the structure, but some of them have higher tendency to crack when they are joined by
SPR. Li et al. [87] studied the influence of the die profile and the joint button cracks on the
mechanical performance of the self-piercing riveted high strength aluminium alloy joints. The results
showed that due to the large bending and tension deformation, the dies with a deep cavity and/or
sharp corners would tend to cause severe cracks for some materials (such as the high strength
aluminium alloy AA6008T61), when they were joined as the bottom material, as shown in Fig. 15.
They also found that a thinner material had a lower tendency to crack than a thicker material due to a
lower bending stress. Their study suggested that cracks on joint buttons could reduce the static and
fatigue lap shear strength but had no obvious influence on the static and fatigue T-peel strength.
FIGURE 15. ―The cross-sections and button images of the SPR joints (3.0AA5754+2.5AA6008 T61 215 MPa)
with, a) b) the deep and sharp corner die and c) d) the shallow and tilted sidewall die (modified from [87]).
One of the joint defects that may occur is the bottom sheet breakthrough (rivet penetrates the
bottom sheet), which may be caused by an overlong rivet, an over high setting force or a wrong die
used. Han et al. [88] studied the effect of the bottom sheet breakthrough on the mechanical behaviour
of the self-piercing riveted aluminium AA5754/HSLA (high strength low alloy steel) joints. 2 mm
thick AA5754 aluminium alloy and 1 mm thick HSLA were used in the study. Their results showed
that the breakthrough in the bottom sheet had a minor effect on the shear strength of the joints, but
there was a significant effect on the peel strength. The breakthrough led to the change of failure
modes for the lap shear tests. During the lap shear tests, the joints with breakthrough failed by tearing
Penetrated cracks
a
dc
b
26
of the bottom sheet, and the joints without breakthrough failed by the rivet being pulled out from the
bottom sheet; during T-peel tests, all specimens failed by the rivet being pulled out from the bottom
sheet. The joints with breakthrough had larger interlock distances that determined the rivet pull-out
strength from the bottom sheet, but reduced the strength of bottom sheet against tearing. As a result,
the joints with breakthrough had slightly lower lap shear strength, but much higher T-peel strength.
Their results also showed that the breakthrough slightly affected the fatigue life and accelerated the
corrosion behaviour of the self-piercing riveted joints, because the breakthrough facilitated the
penetration of corrosion media through the broken bottom sheet.
In order to increase the SPR joint strength of a thicker aluminium joined to a thinner steel, Lou et
al. [34] used resistance spot-welding after SPR. Their results showed that by doing this a 12% lap
shear strength increase could be achieved.
Based on the reported research, the actual strength of a SPR joint will depend on the stack
orientations (rivet setting direction), the material and stack thickness, the top and bottom material
thickness ratio, the combination of rivet and die used, and the rivet setting force etc. Generally
speaking, joints with larger diameter rivets normally have larger strength than those with smaller
diameter rivets, since rivets with a larger diameter will have larger contact areas with the sheet
materials, which will make the deformation of the sheet materials more difficult and the frictional
force between the rivet and the sheet material larger. Rivets with a larger diameter are also more
difficult to be deformed. When a different rivet and die are used to produce a joint, the joint will have
different joint features, such as interlock distance, rivet head height and Tmin, and as a result the joint
will have different strength. Typically, SPR joint strength increases with the increase of the sheet
material thickness or the stack thickness. For joints with unequal top and bottom sheet thickness, the
strength of the joints will be greatly determined by the thinner sheet and the joint strength will
normally be higher if the thick material is used as the bottom material. When materials with different
strength are used, for a similar stack configuration, the joints with higher strength materials will
normally have higher strength, and similarly pre-straining of materials can also increase the joint
strength.
6.3. Influence of setting force
In order to satisfy the joint quality criteria, for a specific combination of a material stack, a rivet
and a die, only certain range of setting force can be used. Different setting forces will produce joints
with different joint qualities, and as a result with different mechanical performances. Researches have
been conducted to investigate the influence of setting force on the mechanical performances of SPR
joints.
27
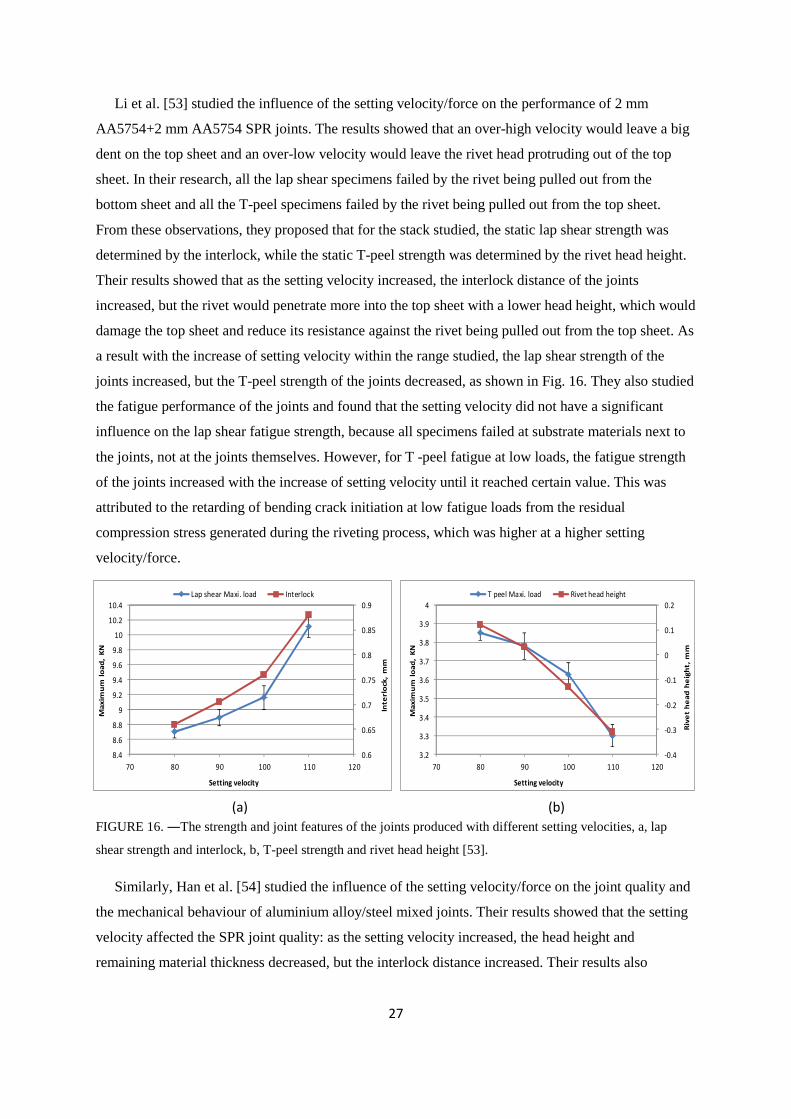
Li et al. [53] studied the influence of the setting velocity/force on the performance of 2 mm
AA5754+2 mm AA5754 SPR joints. The results showed that an over-high velocity would leave a big
dent on the top sheet and an over-low velocity would leave the rivet head protruding out of the top
sheet. In their research, all the lap shear specimens failed by the rivet being pulled out from the
bottom sheet and all the T-peel specimens failed by the rivet being pulled out from the top sheet.
From these observations, they proposed that for the stack studied, the static lap shear strength was
determined by the interlock, while the static T-peel strength was determined by the rivet head height.
Their results showed that as the setting velocity increased, the interlock distance of the joints
increased, but the rivet would penetrate more into the top sheet with a lower head height, which would
damage the top sheet and reduce its resistance against the rivet being pulled out from the top sheet. As
a result with the increase of setting velocity within the range studied, the lap shear strength of the
joints increased, but the T-peel strength of the joints decreased, as shown in Fig. 16. They also studied
the fatigue performance of the joints and found that the setting velocity did not have a significant
influence on the lap shear fatigue strength, because all specimens failed at substrate materials next to
the joints, not at the joints themselves. However, for T -peel fatigue at low loads, the fatigue strength
of the joints increased with the increase of setting velocity until it reached certain value. This was
attributed to the retarding of bending crack initiation at low fatigue loads from the residual
compression stress generated during the riveting process, which was higher at a higher setting
velocity/force.
FIGURE 16. ―The strength and joint features of the joints produced with different setting velocities, a, lap
shear strength and interlock, b, T-peel strength and rivet head height [53].
Similarly, Han et al. [54] studied the influence of the setting velocity/force on the joint quality and
the mechanical behaviour of aluminium alloy/steel mixed joints. Their results showed that the setting
velocity affected the SPR joint quality: as the setting velocity increased, the head height and
remaining material thickness decreased, but the interlock distance increased. Their results also
(b)(a)
-0.4
-0.3
-0.2
-0.1
0
0.1
0.2
3.2
3.3
3.4
3.5
3.6
3.7
3.8
3.9
4
70 80 90 100 110 120
Riv
et
he
ad
he
igh
t,m
m
Ma
xim
um
loa
d,
KN
Setting velocity
T peel Maxi. load Rivet head height
0.6
0.65
0.7
0.75
0.8
0.85
0.9
8.4
8.6
8.8
9
9.2
9.4
9.6
9.8
10
10.2
10.4
70 80 90 100 110 120
Inte
rlo
ck,
mm
Ma
xim
um
loa
d,
KN
Setting velocity
Lap shear Maxi. load Interlock
28
showed that a higher setting velocity would lead to a higher lap shear joint strength but a lower T-peel
strength.
An earlier investigation by Fu and Mallick [89] showed that the joints produced using a higher
rivet setting pressure had a higher static lap shear strength, but the rivet setting pressure did not have
an obvious influence on the fatigue strength. When the rivet setting pressure was over 95 bar, the
influence of setting pressure on the lap shear strength became insignificant. Considering that the rivet
setting pressure is a process parameter that controls the rivet setting force, Fu and Mallick’s results are
consistent with those reported by Li et al. [53].
6.4. Comparison of SPR joints with joints from other processes
Resistance spot-welding has been widely used in the automotive industry for steel body-in-white
structures for decades, but when it came to the joining of aluminium alloys, pre-finished materials and
dissimilar materials, spot-welding became less attractive and has been replaced by SPR. Since spot
welding is an established welding process for automotive structures, a large amount of research has
been conducted to compare the performance of the SPR joints with that of the spot welded joints.
Most of the comparisons were conducted for aluminium alloy joints due to the increased
application of aluminium alloys in the automotive body structures. Sunday [4] compared the
mechanical strength of various SPR and resistance spot-welded (RSW) aluminium alloy joints. In his
study, steel rivets with a stem diameter of 4.76 mm were used for SPR, while the joint nugget
diameter of the spot-welded joints ranged from 4.67-5.67 times of the square root of the thinner sheet
material thickness. The results showed that the SPR joints could have higher or lower lap shear
strength than the spot-welded joints for different material stacks, and the SPR joints had lower tension
strength than the spot-welded joints. Even though the SPR joints for the 2.16 mm AA5182+2.16 mm
AA5182 stack had a lower static lap shear strength than the spot-welded equivalent joints, the SPR
joints had superior fatigue strength. This fatigue behaviour was in agreement with the results
presented by Partrick and Sharp [5]. Similar results were also reported by Khanna et al. [83] for
AA6111 joints and Blacket [90] for AlMg3W19 joints. Riches et al. [91] compared the static peel and
shear strength of the SPR riveted, spot-welded and clinched 1.6 mm AA5182+1.6 mm AA5182 joints.
They found that the strength of the spot-welded joints were higher than that of the clinched joints but
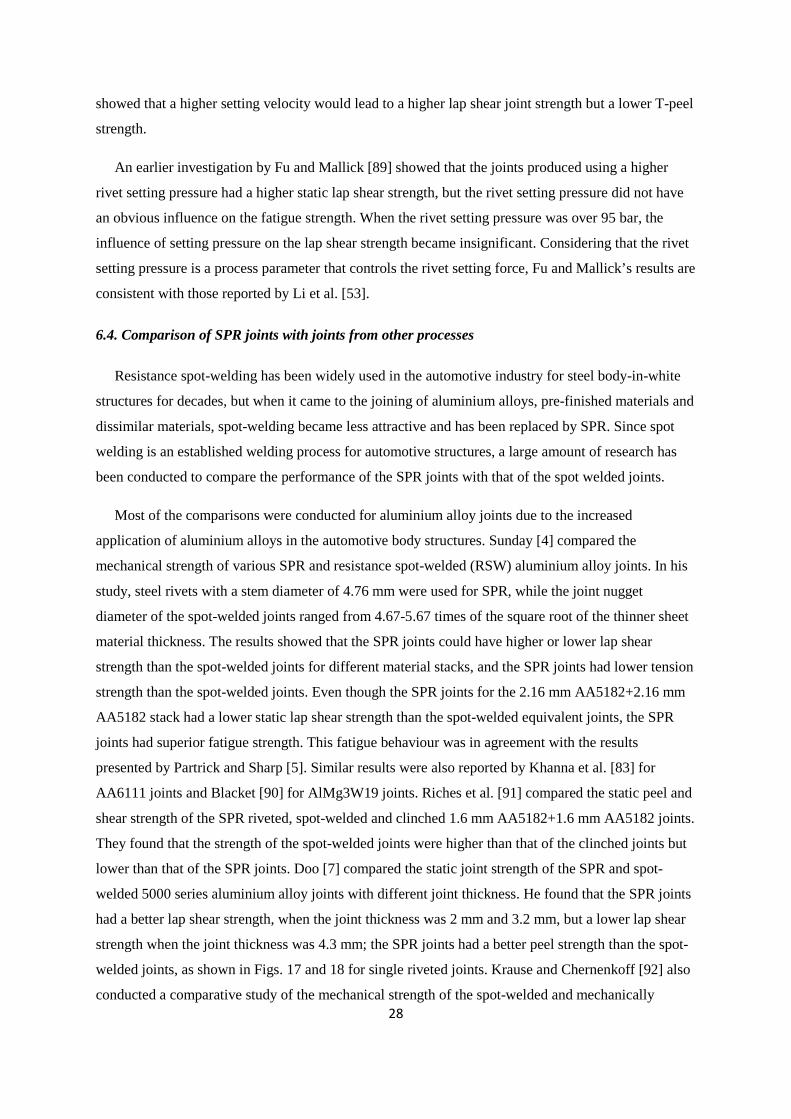
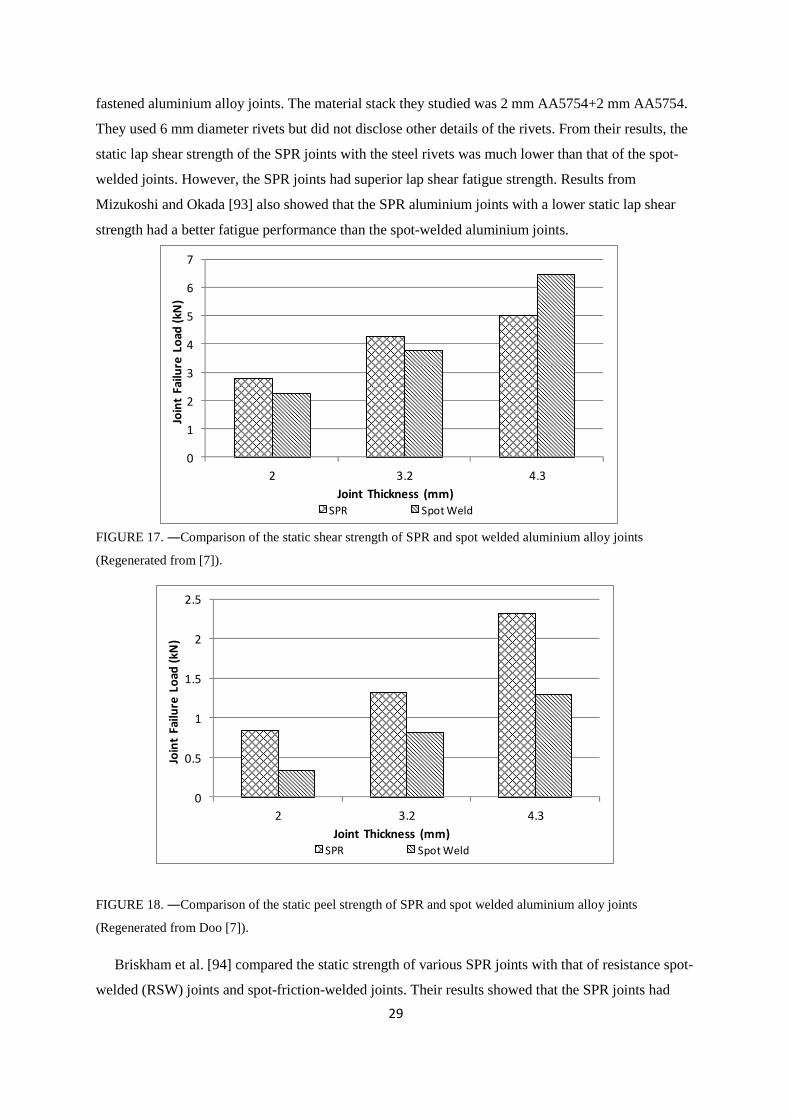
lower than that of the SPR joints. Doo [7] compared the static joint strength of the SPR and spot-
welded 5000 series aluminium alloy joints with different joint thickness. He found that the SPR joints
had a better lap shear strength, when the joint thickness was 2 mm and 3.2 mm, but a lower lap shear
strength when the joint thickness was 4.3 mm; the SPR joints had a better peel strength than the spot-
welded joints, as shown in Figs. 17 and 18 for single riveted joints. Krause and Chernenkoff [92] also
conducted a comparative study of the mechanical strength of the spot-welded and mechanically
29
fastened aluminium alloy joints. The material stack they studied was 2 mm AA5754+2 mm AA5754.
They used 6 mm diameter rivets but did not disclose other details of the rivets. From their results, the
static lap shear strength of the SPR joints with the steel rivets was much lower than that of the spot-
welded joints. However, the SPR joints had superior lap shear fatigue strength. Results from
Mizukoshi and Okada [93] also showed that the SPR aluminium joints with a lower static lap shear
strength had a better fatigue performance than the spot-welded aluminium joints.
FIGURE 17. ―Comparison of the static shear strength of SPR and spot welded aluminium alloy joints
(Regenerated from [7]).
FIGURE 18. ―Comparison of the static peel strength of SPR and spot welded aluminium alloy joints
(Regenerated from Doo [7]).
Briskham et al. [94] compared the static strength of various SPR joints with that of resistance spot-
welded (RSW) joints and spot-friction-welded joints. Their results showed that the SPR joints had
0
1
2
3
4
5
6
7
2 3.2 4.3
Join
tFa
ilure
Load
(kN
)
Joint Thickness (mm)SPR Spot Weld
0
0.5
1
1.5
2
2.5
2 3.2 4.3
Join
tFa
ilure
Load
(kN
)
Joint Thickness (mm)SPR Spot Weld
30
similar or better lap shear and T-peel strengths than the equivalent spot welded joints. However,
further research from Han et al. [95] showed that the strength of SPR joints and spot welded joints
was material stack and process parameters related. Their results showed that when different joint
stacks were studied or when different process parameters were used, the static strength of the SPR
joints could be higher or lower than that of the RSW joints, but generally speaking SPR joints had a
better T-peel strength and RSW joints had a better cross-tension strength, which matched well with
the results from Doo [7].
Comparison was also made for steel joints and mixed material joints. Booth et al. [96] investigated
the mechanical strength of steel (with and without zinc coating) and aluminium alloy joints joined by
SPR and RSW. Both a low carbon steel and a high strength steel were studied. Steel rivets with 5 mm
diameter were used and the spot nugget diameter was about 5 times of the square root of the thinner
sheet thickness. Their results showed that the static strength of the RSW joints was greater than that of
the SPR joints; however, as to fatigue strength the SPR joints were superior to the RSW joints.
Research by Bonde and Grange-Jasson [20] showed that when SPR was used to join 1.5 mm
RP220 to 1.2 mm IFHS180, the static lap shear strength of the steel SPR joints was slightly lower
than that of the spot-welded joints, but the fatigue strength of the SPR joints was much better than that
of the spot-welded equivalents. Galtier and Gacel [97] compared the fatigue performance of high
strength steel joints produced by SPR and resistance spot welding (RSW). Their results showed that
the fatigue strength of the SPR joints increased with the increase of steel strength, but the fatigue
strength of the RSW joints did not. As a result, for high strength steels with a yield strength higher
than 300 MPa, the SPR joints had better fatigue strength than the equivalent RSW joints. As to the
static strength, research from Westgate [98] showed that when RSW was used to weld high strength
steels, the influence of substrate strength on the joint strength was marginal. However, results from
Galtier and Gacel [97] showed that when SPR was used to join high strength steels, the joint strength
increased significantly with the increase of substrate strength. Due to this reason, Dannbauer et al.
[99] believed that SPR is better than RSW for joining high strength steels. Svensson and Larsson
[100] summarized the strength of various high strength steel joints, and they demonstrated that the
SPR joints had better lap shear and peel fatigue strength than the RSW joints in the entire strength
range of high strength steels.
Westgate and Whittaker [101] studied the mechanical joining of various sheet materials, including
steels, an aluminium alloy and an aluminium/polypropylene/ aluminium sandwich material. They
found that the relationship between the joint strength and the joining technique was highly material
dependent and the strength of spot-welds was exceeded in some cases by that of the mechanically
fastened joints. Later, Razmjoo and Westgate [102] also studied the static and fatigue strength of
31
mechanical fastened and spot-welded joints, using 1.2 mm thick aluminium alloy AA5754 and 1.2
mm thick iron/zinc alloy (IZ) coated low carbon steel. Their results showed that the fatigue strength of
SPR joints was better than that of spot-welded joints.
In summary, for SPR, when different rivet/die and setting force combinations are applied for a
specific joint stack, the joints will have different joint features, such as rivet head height, interlock
distance, and as a result they will have different strengths. For RSW, when different process
parameters (such as clamping force, welding current and welding duration) are used, the joints will
have different sizes of joint nugget, and consequently they will have different strength. So whether or
not a SPR joint will have higher static strength than the equivalent RSW joint will depend on the
parameters used for the two processes. On the other hand, it is generally agreed that the SPR joints
have better fatigue strength than the RSW joints.
Mori et al. [103] studied the mechanisms behind the superior fatigue strength of aluminium alloy
joints joined by mechanical clinching and self-pierce riveting. Among the three groups of joints they
studied, the SPR joints had the highest static and fatigue strength; although the static strength of the
mechanical clinched joints was about half of that of the RSW joints, the fatigue strength was almost
similar. They believed that there were two joint features that made SPR joints and clinched joints
superior in fatigue: one is stress relaxation through the slight slip at the joint interface and the other is
the sheet material strength increase by work hardening. On the other hand, for RSW joints, the stress
concentrates at the edge of the weld nugget due to the complete bonding, and the material around the
nugget may be weakened due to the existence of a heat affected zone.
Apart from RSW joints, the strength of SPR joints has also been compared with joints made by
other joining technologies. Blundell et al. [104] compared the strength and performance of the SPR
and spot-friction joined joints. Their results showed that the SPR joints demonstrated a higher joint
strength with a more ductile failure mode in both the lap shear and T-peel tests. A comparison study
by Briskham et al. [94] also showed that the SPR joints had a higher static strength and energy
absorption than the spot friction joined joints. Mizukoshi and Okada [93] compared the strength of
various aluminium alloy joints by clinching and SPR and their results showed that the SPR joints had
better static and fatigue strength than the clinched joints. Galtier and Gacel [97] studied the strength of
thin gauge steel joints, and their results showed that for joints with 2 layers of 1.4mm steel (DDQ or
S315), the fatigue endurance of the SPR joints was better than that of the clinched joints. It is
believed that the larger interlock distance and the high strength rivet at the interlock in the SPR joints
make their strength higher than that of clinched joints. Li and Fatemi [82] compared the mechanical
performance of T-peel SPR specimens with equivalent pop rivet specimens. Their results showed that
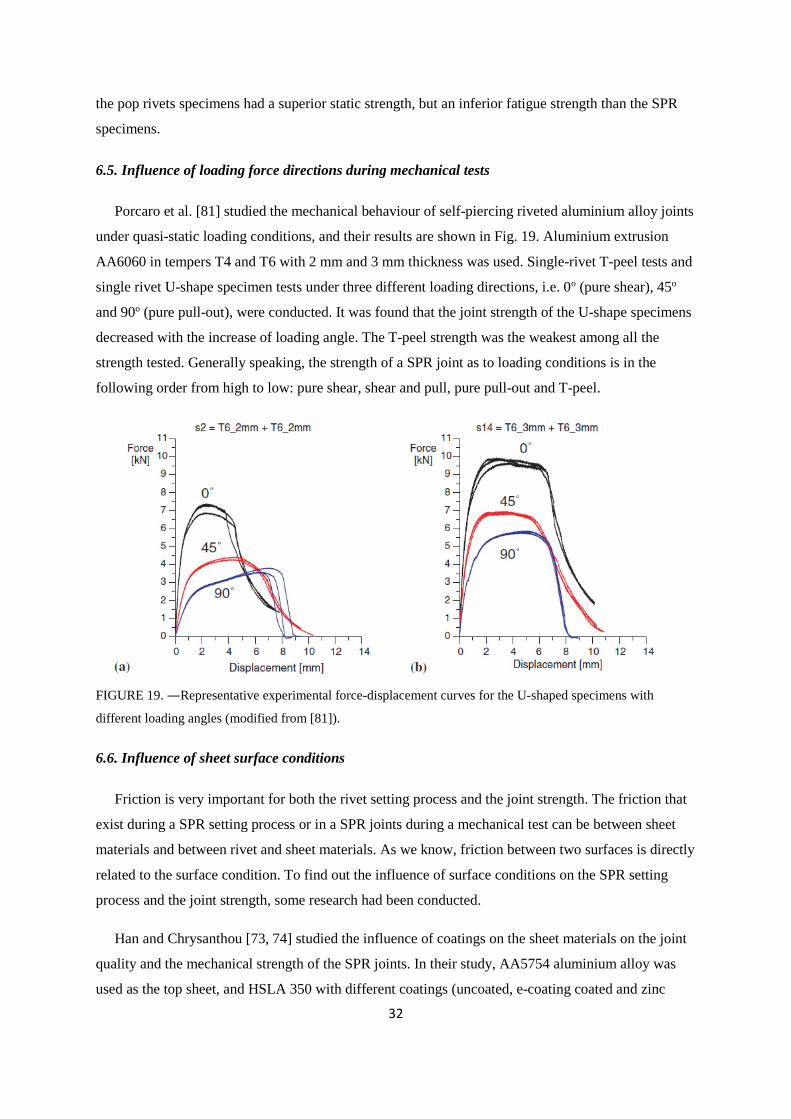
32
the pop rivets specimens had a superior static strength, but an inferior fatigue strength than the SPR
specimens.
6.5. Influence of loading force directions during mechanical tests
Porcaro et al. [81] studied the mechanical behaviour of self-piercing riveted aluminium alloy joints
under quasi-static loading conditions, and their results are shown in Fig. 19. Aluminium extrusion
AA6060 in tempers T4 and T6 with 2 mm and 3 mm thickness was used. Single-rivet T-peel tests and
single rivet U-shape specimen tests under three different loading directions, i.e. 0o (pure shear), 45o
and 90o (pure pull-out), were conducted. It was found that the joint strength of the U-shape specimens
decreased with the increase of loading angle. The T-peel strength was the weakest among all the
strength tested. Generally speaking, the strength of a SPR joint as to loading conditions is in the
following order from high to low: pure shear, shear and pull, pure pull-out and T-peel.
FIGURE 19. ―Representative experimental force-displacement curves for the U-shaped specimens with
different loading angles (modified from [81]).
6.6. Influence of sheet surface conditions
Friction is very important for both the rivet setting process and the joint strength. The friction that
exist during a SPR setting process or in a SPR joints during a mechanical test can be between sheet
materials and between rivet and sheet materials. As we know, friction between two surfaces is directly
related to the surface condition. To find out the influence of surface conditions on the SPR setting
process and the joint strength, some research had been conducted.
Han and Chrysanthou [73, 74] studied the influence of coatings on the sheet materials on the joint
quality and the mechanical strength of the SPR joints. In their study, AA5754 aluminium alloy was
used as the top sheet, and HSLA 350 with different coatings (uncoated, e-coating coated and zinc
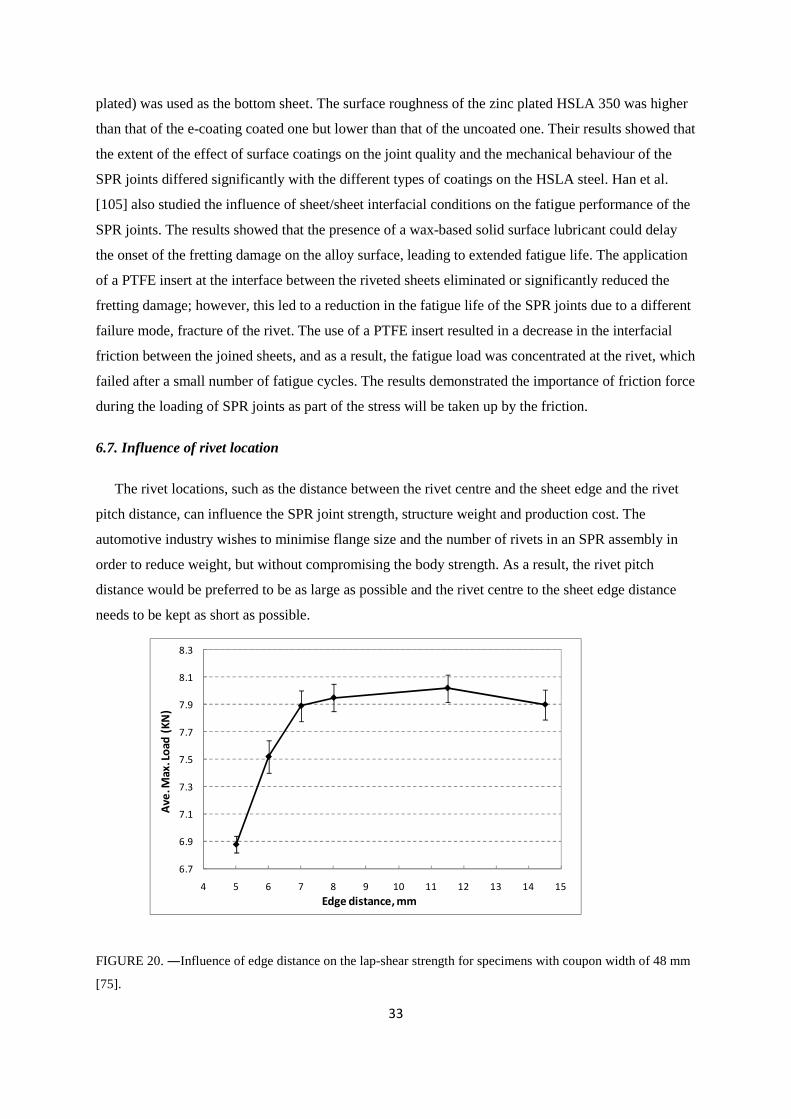
33
plated) was used as the bottom sheet. The surface roughness of the zinc plated HSLA 350 was higher
than that of the e-coating coated one but lower than that of the uncoated one. Their results showed that
the extent of the effect of surface coatings on the joint quality and the mechanical behaviour of the
SPR joints differed significantly with the different types of coatings on the HSLA steel. Han et al.
[105] also studied the influence of sheet/sheet interfacial conditions on the fatigue performance of the
SPR joints. The results showed that the presence of a wax-based solid surface lubricant could delay
the onset of the fretting damage on the alloy surface, leading to extended fatigue life. The application
of a PTFE insert at the interface between the riveted sheets eliminated or significantly reduced the
fretting damage; however, this led to a reduction in the fatigue life of the SPR joints due to a different
failure mode, fracture of the rivet. The use of a PTFE insert resulted in a decrease in the interfacial
friction between the joined sheets, and as a result, the fatigue load was concentrated at the rivet, which
failed after a small number of fatigue cycles. The results demonstrated the importance of friction force
during the loading of SPR joints as part of the stress will be taken up by the friction.
6.7. Influence of rivet location
The rivet locations, such as the distance between the rivet centre and the sheet edge and the rivet
pitch distance, can influence the SPR joint strength, structure weight and production cost. The
automotive industry wishes to minimise flange size and the number of rivets in an SPR assembly in
order to reduce weight, but without compromising the body strength. As a result, the rivet pitch
distance would be preferred to be as large as possible and the rivet centre to the sheet edge distance
needs to be kept as short as possible.
FIGURE 20. ―Influence of edge distance on the lap-shear strength for specimens with coupon width of 48 mm
[75].
6.7
6.9
7.1
7.3
7.5
7.7
7.9
8.1
8.3
4 5 6 7 8 9 10 11 12 13 14 15
Ave
.Max
.Lo
ad(K
N)
Edge distance, mm
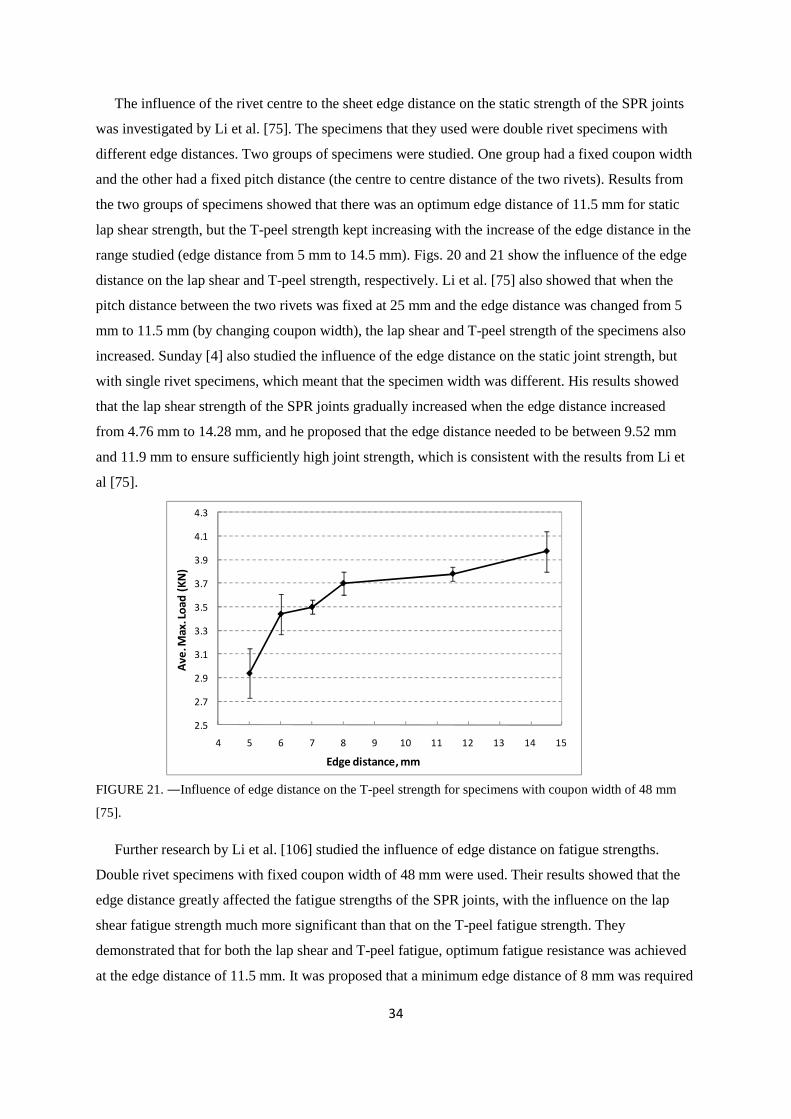
34
The influence of the rivet centre to the sheet edge distance on the static strength of the SPR joints
was investigated by Li et al. [75]. The specimens that they used were double rivet specimens with
different edge distances. Two groups of specimens were studied. One group had a fixed coupon width
and the other had a fixed pitch distance (the centre to centre distance of the two rivets). Results from
the two groups of specimens showed that there was an optimum edge distance of 11.5 mm for static
lap shear strength, but the T-peel strength kept increasing with the increase of the edge distance in the
range studied (edge distance from 5 mm to 14.5 mm). Figs. 20 and 21 show the influence of the edge
distance on the lap shear and T-peel strength, respectively. Li et al. [75] also showed that when the
pitch distance between the two rivets was fixed at 25 mm and the edge distance was changed from 5
mm to 11.5 mm (by changing coupon width), the lap shear and T-peel strength of the specimens also
increased. Sunday [4] also studied the influence of the edge distance on the static joint strength, but
with single rivet specimens, which meant that the specimen width was different. His results showed
that the lap shear strength of the SPR joints gradually increased when the edge distance increased
from 4.76 mm to 14.28 mm, and he proposed that the edge distance needed to be between 9.52 mm
and 11.9 mm to ensure sufficiently high joint strength, which is consistent with the results from Li et
al [75].
FIGURE 21. ―Influence of edge distance on the T-peel strength for specimens with coupon width of 48 mm
[75].
Further research by Li et al. [106] studied the influence of edge distance on fatigue strengths.
Double rivet specimens with fixed coupon width of 48 mm were used. Their results showed that the
edge distance greatly affected the fatigue strengths of the SPR joints, with the influence on the lap
shear fatigue strength much more significant than that on the T-peel fatigue strength. They
demonstrated that for both the lap shear and T-peel fatigue, optimum fatigue resistance was achieved
at the edge distance of 11.5 mm. It was proposed that a minimum edge distance of 8 mm was required
2.5
2.7
2.9
3.1
3.3
3.5
3.7
3.9
4.1
4.3
4 5 6 7 8 9 10 11 12 13 14 15
Ave
.Max
.Lo
ad(K
N)
Edge distance, mm
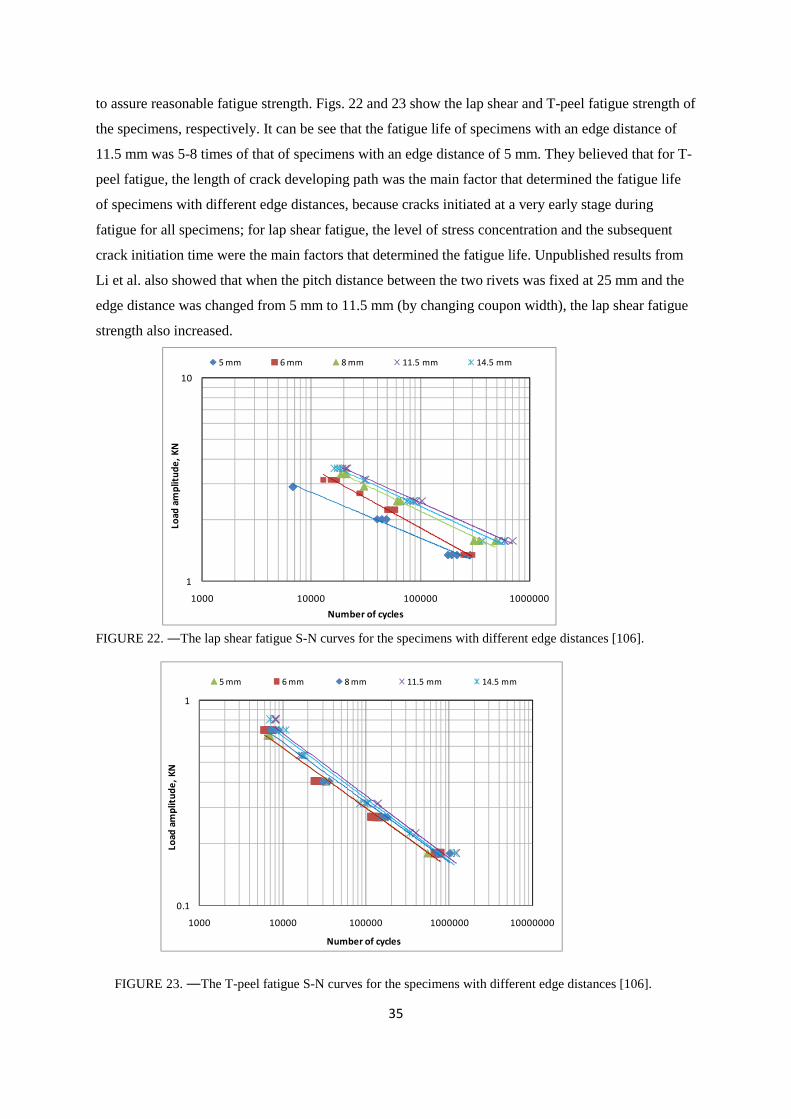
35
to assure reasonable fatigue strength. Figs. 22 and 23 show the lap shear and T-peel fatigue strength of
the specimens, respectively. It can be see that the fatigue life of specimens with an edge distance of
11.5 mm was 5-8 times of that of specimens with an edge distance of 5 mm. They believed that for T-
peel fatigue, the length of crack developing path was the main factor that determined the fatigue life
of specimens with different edge distances, because cracks initiated at a very early stage during
fatigue for all specimens; for lap shear fatigue, the level of stress concentration and the subsequent
crack initiation time were the main factors that determined the fatigue life. Unpublished results from
Li et al. also showed that when the pitch distance between the two rivets was fixed at 25 mm and the
edge distance was changed from 5 mm to 11.5 mm (by changing coupon width), the lap shear fatigue
strength also increased.
FIGURE 22. ―The lap shear fatigue S-N curves for the specimens with different edge distances [106].
FIGURE 23. ―The T-peel fatigue S-N curves for the specimens with different edge distances [106].
1
10
1000 10000 100000 1000000
Load
amp
litu
de
,K
N
Number of cycles
5 mm 6 mm 8 mm 11.5 mm 14.5 mm
0.1
1
1000 10000 100000 1000000 10000000
Load
amp
litu
de
,K
N
Number of cycles
5 mm 6 mm 8 mm 11.5 mm 14.5 mm
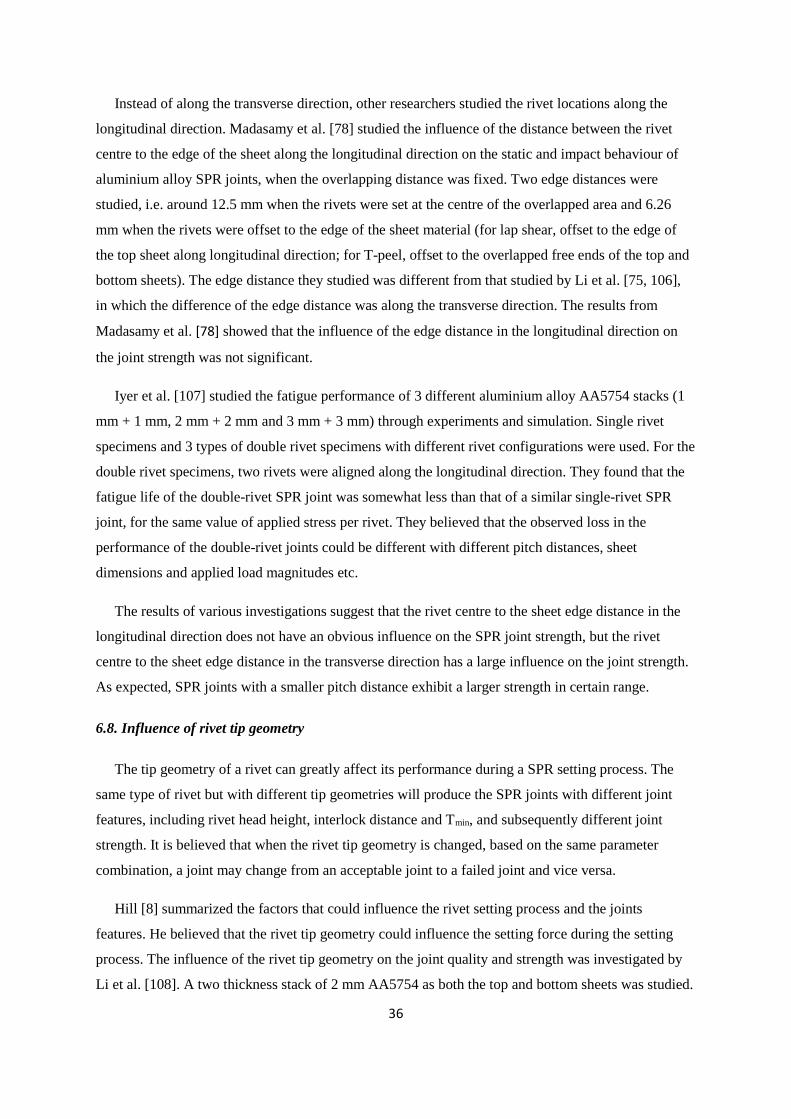
36
Instead of along the transverse direction, other researchers studied the rivet locations along the
longitudinal direction. Madasamy et al. [78] studied the influence of the distance between the rivet
centre to the edge of the sheet along the longitudinal direction on the static and impact behaviour of
aluminium alloy SPR joints, when the overlapping distance was fixed. Two edge distances were
studied, i.e. around 12.5 mm when the rivets were set at the centre of the overlapped area and 6.26
mm when the rivets were offset to the edge of the sheet material (for lap shear, offset to the edge of
the top sheet along longitudinal direction; for T-peel, offset to the overlapped free ends of the top and
bottom sheets). The edge distance they studied was different from that studied by Li et al. [75, 106],
in which the difference of the edge distance was along the transverse direction. The results from
Madasamy et al. [78] showed that the influence of the edge distance in the longitudinal direction on
the joint strength was not significant.
Iyer et al. [107] studied the fatigue performance of 3 different aluminium alloy AA5754 stacks (1
mm + 1 mm, 2 mm + 2 mm and 3 mm + 3 mm) through experiments and simulation. Single rivet
specimens and 3 types of double rivet specimens with different rivet configurations were used. For the
double rivet specimens, two rivets were aligned along the longitudinal direction. They found that the
fatigue life of the double-rivet SPR joint was somewhat less than that of a similar single-rivet SPR
joint, for the same value of applied stress per rivet. They believed that the observed loss in the
performance of the double-rivet joints could be different with different pitch distances, sheet
dimensions and applied load magnitudes etc.
The results of various investigations suggest that the rivet centre to the sheet edge distance in the
longitudinal direction does not have an obvious influence on the SPR joint strength, but the rivet
centre to the sheet edge distance in the transverse direction has a large influence on the joint strength.
As expected, SPR joints with a smaller pitch distance exhibit a larger strength in certain range.
6.8. Influence of rivet tip geometry
The tip geometry of a rivet can greatly affect its performance during a SPR setting process. The
same type of rivet but with different tip geometries will produce the SPR joints with different joint
features, including rivet head height, interlock distance and Tmin, and subsequently different joint
strength. It is believed that when the rivet tip geometry is changed, based on the same parameter
combination, a joint may change from an acceptable joint to a failed joint and vice versa.
Hill [8] summarized the factors that could influence the rivet setting process and the joints
features. He believed that the rivet tip geometry could influence the setting force during the setting
process. The influence of the rivet tip geometry on the joint quality and strength was investigated by
Li et al. [108]. A two thickness stack of 2 mm AA5754 as both the top and bottom sheets was studied.
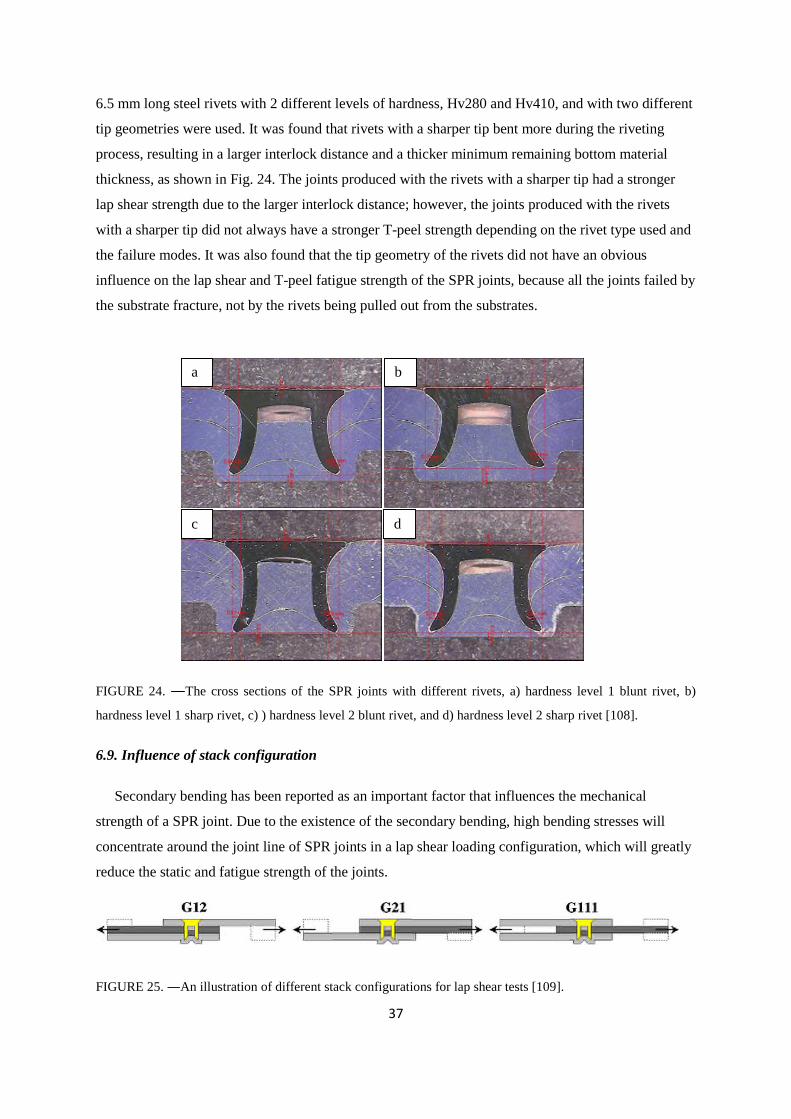
37
6.5 mm long steel rivets with 2 different levels of hardness, Hv280 and Hv410, and with two different
tip geometries were used. It was found that rivets with a sharper tip bent more during the riveting
process, resulting in a larger interlock distance and a thicker minimum remaining bottom material
thickness, as shown in Fig. 24. The joints produced with the rivets with a sharper tip had a stronger
lap shear strength due to the larger interlock distance; however, the joints produced with the rivets
with a sharper tip did not always have a stronger T-peel strength depending on the rivet type used and
the failure modes. It was also found that the tip geometry of the rivets did not have an obvious
influence on the lap shear and T-peel fatigue strength of the SPR joints, because all the joints failed by
the substrate fracture, not by the rivets being pulled out from the substrates.
FIGURE 24. ―The cross sections of the SPR joints with different rivets, a) hardness level 1 blunt rivet, b)
hardness level 1 sharp rivet, c) ) hardness level 2 blunt rivet, and d) hardness level 2 sharp rivet [108].
6.9. Influence of stack configuration
Secondary bending has been reported as an important factor that influences the mechanical
strength of a SPR joint. Due to the existence of the secondary bending, high bending stresses will
concentrate around the joint line of SPR joints in a lap shear loading configuration, which will greatly
reduce the static and fatigue strength of the joints.
FIGURE 25. ―An illustration of different stack configurations for lap shear tests [109].
a b
c d
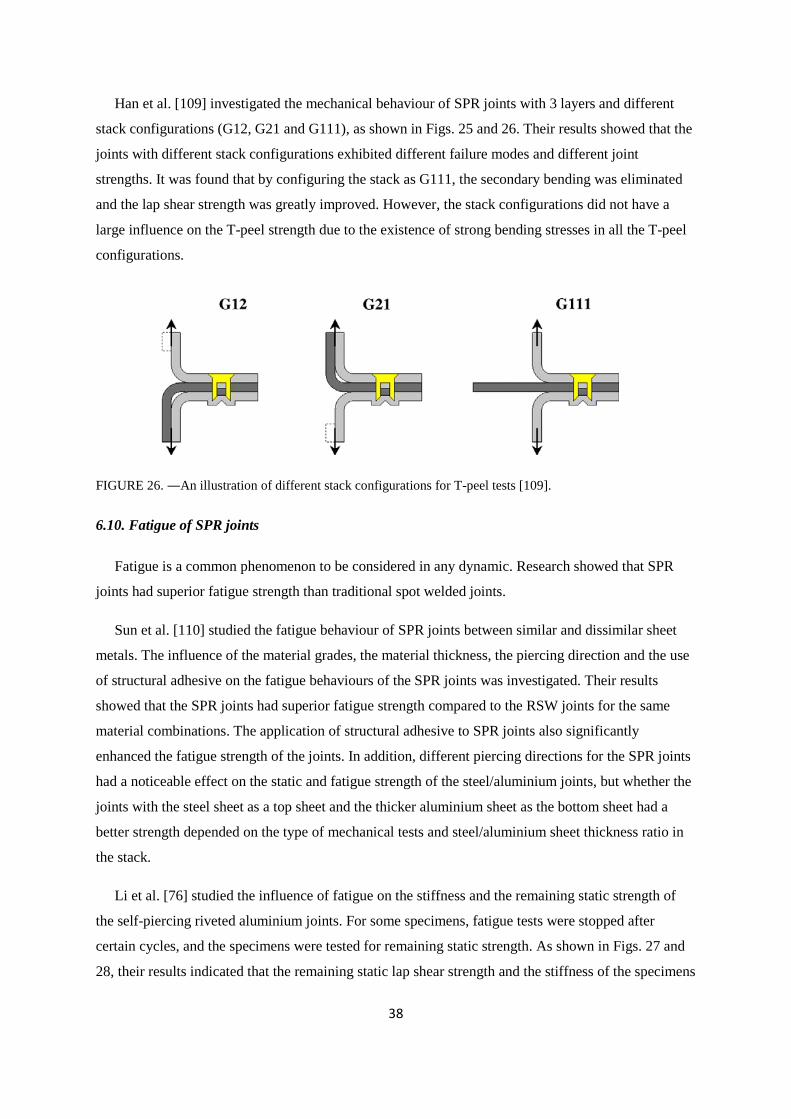
38
Han et al. [109] investigated the mechanical behaviour of SPR joints with 3 layers and different
stack configurations (G12, G21 and G111), as shown in Figs. 25 and 26. Their results showed that the
joints with different stack configurations exhibited different failure modes and different joint
strengths. It was found that by configuring the stack as G111, the secondary bending was eliminated
and the lap shear strength was greatly improved. However, the stack configurations did not have a
large influence on the T-peel strength due to the existence of strong bending stresses in all the T-peel
configurations.
FIGURE 26. ―An illustration of different stack configurations for T-peel tests [109].
6.10. Fatigue of SPR joints
Fatigue is a common phenomenon to be considered in any dynamic. Research showed that SPR
joints had superior fatigue strength than traditional spot welded joints.
Sun et al. [110] studied the fatigue behaviour of SPR joints between similar and dissimilar sheet
metals. The influence of the material grades, the material thickness, the piercing direction and the use
of structural adhesive on the fatigue behaviours of the SPR joints was investigated. Their results
showed that the SPR joints had superior fatigue strength compared to the RSW joints for the same
material combinations. The application of structural adhesive to SPR joints also significantly
enhanced the fatigue strength of the joints. In addition, different piercing directions for the SPR joints
had a noticeable effect on the static and fatigue strength of the steel/aluminium joints, but whether the
joints with the steel sheet as a top sheet and the thicker aluminium sheet as the bottom sheet had a
better strength depended on the type of mechanical tests and steel/aluminium sheet thickness ratio in
the stack.
Li et al. [76] studied the influence of fatigue on the stiffness and the remaining static strength of
the self-piercing riveted aluminium joints. For some specimens, fatigue tests were stopped after
certain cycles, and the specimens were tested for remaining static strength. As shown in Figs. 27 and
28, their results indicated that the remaining static lap shear strength and the stiffness of the specimens
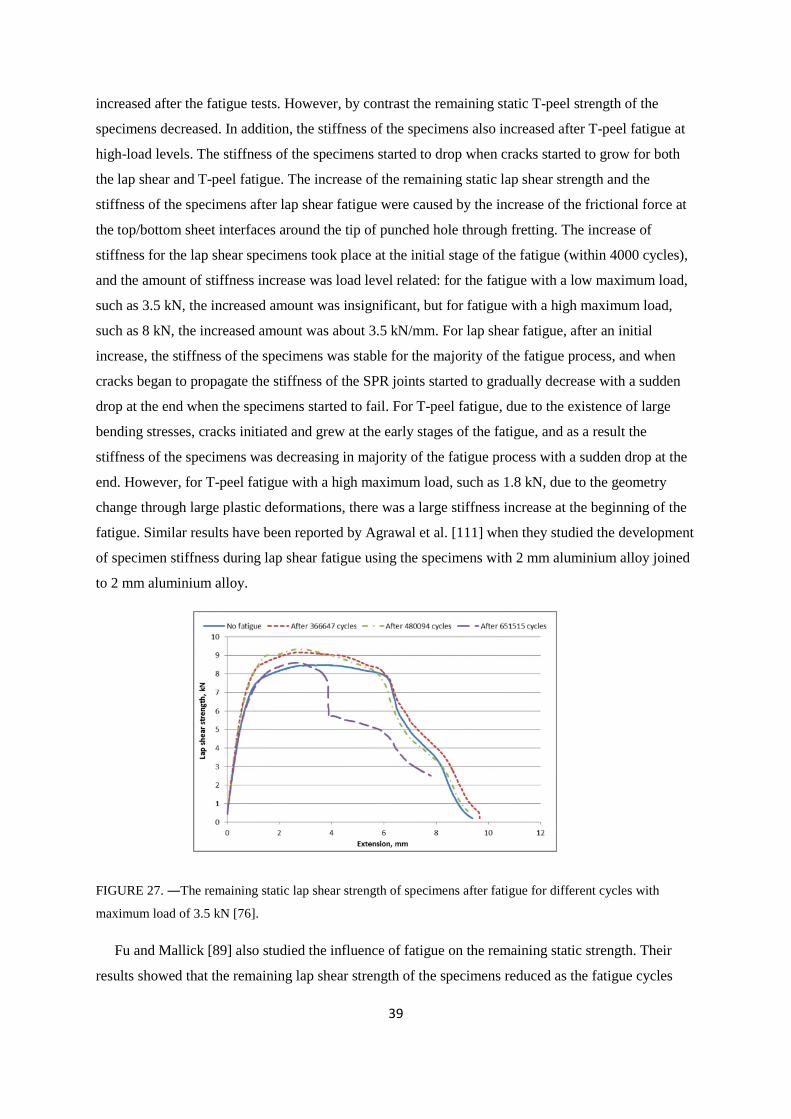
39
increased after the fatigue tests. However, by contrast the remaining static T-peel strength of the
specimens decreased. In addition, the stiffness of the specimens also increased after T-peel fatigue at
high-load levels. The stiffness of the specimens started to drop when cracks started to grow for both
the lap shear and T-peel fatigue. The increase of the remaining static lap shear strength and the
stiffness of the specimens after lap shear fatigue were caused by the increase of the frictional force at
the top/bottom sheet interfaces around the tip of punched hole through fretting. The increase of
stiffness for the lap shear specimens took place at the initial stage of the fatigue (within 4000 cycles),
and the amount of stiffness increase was load level related: for the fatigue with a low maximum load,
such as 3.5 kN, the increased amount was insignificant, but for fatigue with a high maximum load,
such as 8 kN, the increased amount was about 3.5 kN/mm. For lap shear fatigue, after an initial
increase, the stiffness of the specimens was stable for the majority of the fatigue process, and when
cracks began to propagate the stiffness of the SPR joints started to gradually decrease with a sudden
drop at the end when the specimens started to fail. For T-peel fatigue, due to the existence of large
bending stresses, cracks initiated and grew at the early stages of the fatigue, and as a result the
stiffness of the specimens was decreasing in majority of the fatigue process with a sudden drop at the
end. However, for T-peel fatigue with a high maximum load, such as 1.8 kN, due to the geometry
change through large plastic deformations, there was a large stiffness increase at the beginning of the
fatigue. Similar results have been reported by Agrawal et al. [111] when they studied the development
of specimen stiffness during lap shear fatigue using the specimens with 2 mm aluminium alloy joined
to 2 mm aluminium alloy.
FIGURE 27. ―The remaining static lap shear strength of specimens after fatigue for different cycles with
maximum load of 3.5 kN [76].
Fu and Mallick [89] also studied the influence of fatigue on the remaining static strength. Their
results showed that the remaining lap shear strength of the specimens reduced as the fatigue cycles
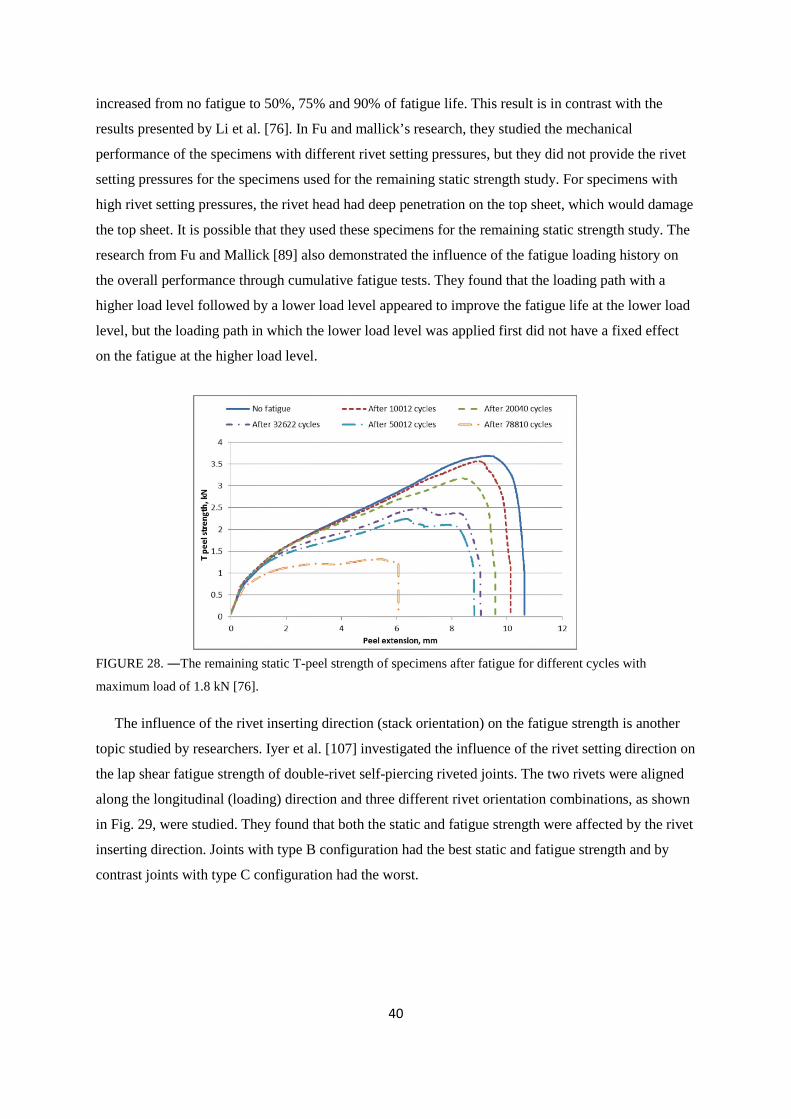
40
increased from no fatigue to 50%, 75% and 90% of fatigue life. This result is in contrast with the
results presented by Li et al. [76]. In Fu and mallick’s research, they studied the mechanical
performance of the specimens with different rivet setting pressures, but they did not provide the rivet
setting pressures for the specimens used for the remaining static strength study. For specimens with
high rivet setting pressures, the rivet head had deep penetration on the top sheet, which would damage
the top sheet. It is possible that they used these specimens for the remaining static strength study. The
research from Fu and Mallick [89] also demonstrated the influence of the fatigue loading history on
the overall performance through cumulative fatigue tests. They found that the loading path with a
higher load level followed by a lower load level appeared to improve the fatigue life at the lower load
level, but the loading path in which the lower load level was applied first did not have a fixed effect
on the fatigue at the higher load level.
FIGURE 28. ―The remaining static T-peel strength of specimens after fatigue for different cycles with
maximum load of 1.8 kN [76].
The influence of the rivet inserting direction (stack orientation) on the fatigue strength is another
topic studied by researchers. Iyer et al. [107] investigated the influence of the rivet setting direction on
the lap shear fatigue strength of double-rivet self-piercing riveted joints. The two rivets were aligned
along the longitudinal (loading) direction and three different rivet orientation combinations, as shown
in Fig. 29, were studied. They found that both the static and fatigue strength were affected by the rivet
inserting direction. Joints with type B configuration had the best static and fatigue strength and by
contrast joints with type C configuration had the worst.
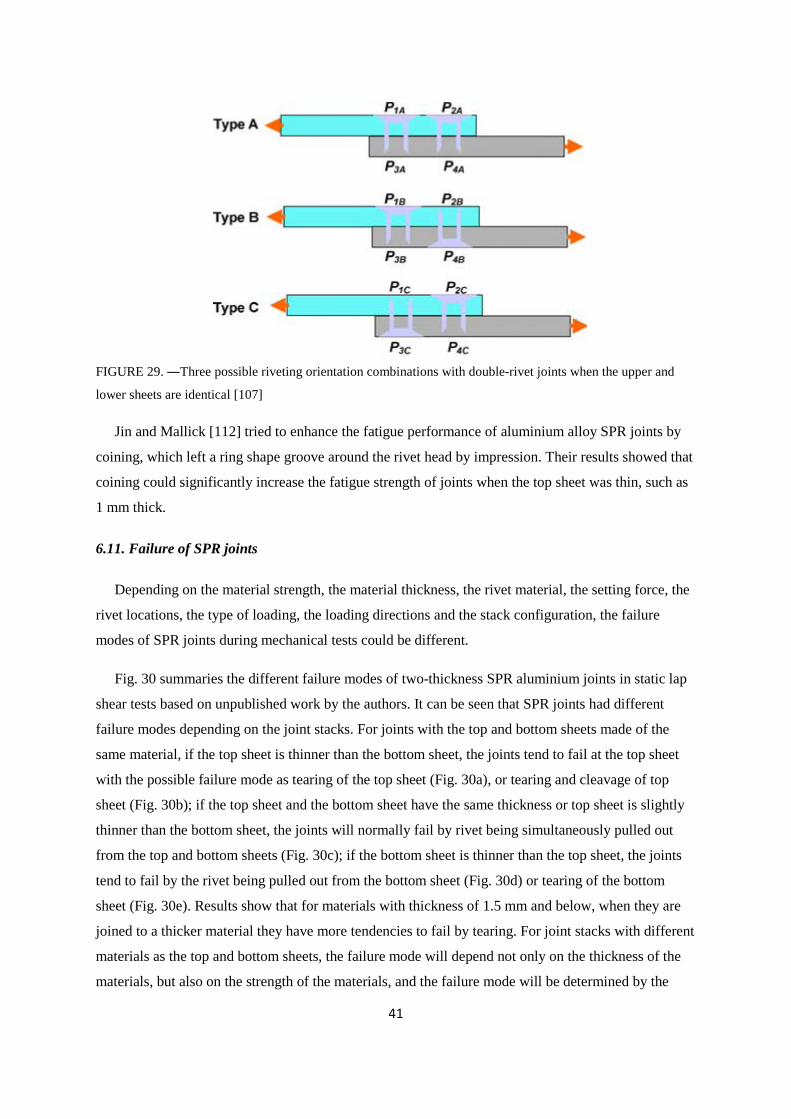
41
FIGURE 29. ―Three possible riveting orientation combinations with double-rivet joints when the upper and
lower sheets are identical [107]
Jin and Mallick [112] tried to enhance the fatigue performance of aluminium alloy SPR joints by
coining, which left a ring shape groove around the rivet head by impression. Their results showed that
coining could significantly increase the fatigue strength of joints when the top sheet was thin, such as
1 mm thick.
6.11. Failure of SPR joints
Depending on the material strength, the material thickness, the rivet material, the setting force, the
rivet locations, the type of loading, the loading directions and the stack configuration, the failure
modes of SPR joints during mechanical tests could be different.
Fig. 30 summaries the different failure modes of two-thickness SPR aluminium joints in static lap
shear tests based on unpublished work by the authors. It can be seen that SPR joints had different
failure modes depending on the joint stacks. For joints with the top and bottom sheets made of the
same material, if the top sheet is thinner than the bottom sheet, the joints tend to fail at the top sheet
with the possible failure mode as tearing of the top sheet (Fig. 30a), or tearing and cleavage of top
sheet (Fig. 30b); if the top sheet and the bottom sheet have the same thickness or top sheet is slightly
thinner than the bottom sheet, the joints will normally fail by rivet being simultaneously pulled out
from the top and bottom sheets (Fig. 30c); if the bottom sheet is thinner than the top sheet, the joints
tend to fail by the rivet being pulled out from the bottom sheet (Fig. 30d) or tearing of the bottom
sheet (Fig. 30e). Results show that for materials with thickness of 1.5 mm and below, when they are
joined to a thicker material they have more tendencies to fail by tearing. For joint stacks with different
materials as the top and bottom sheets, the failure mode will depend not only on the thickness of the
materials, but also on the strength of the materials, and the failure mode will be determined by the
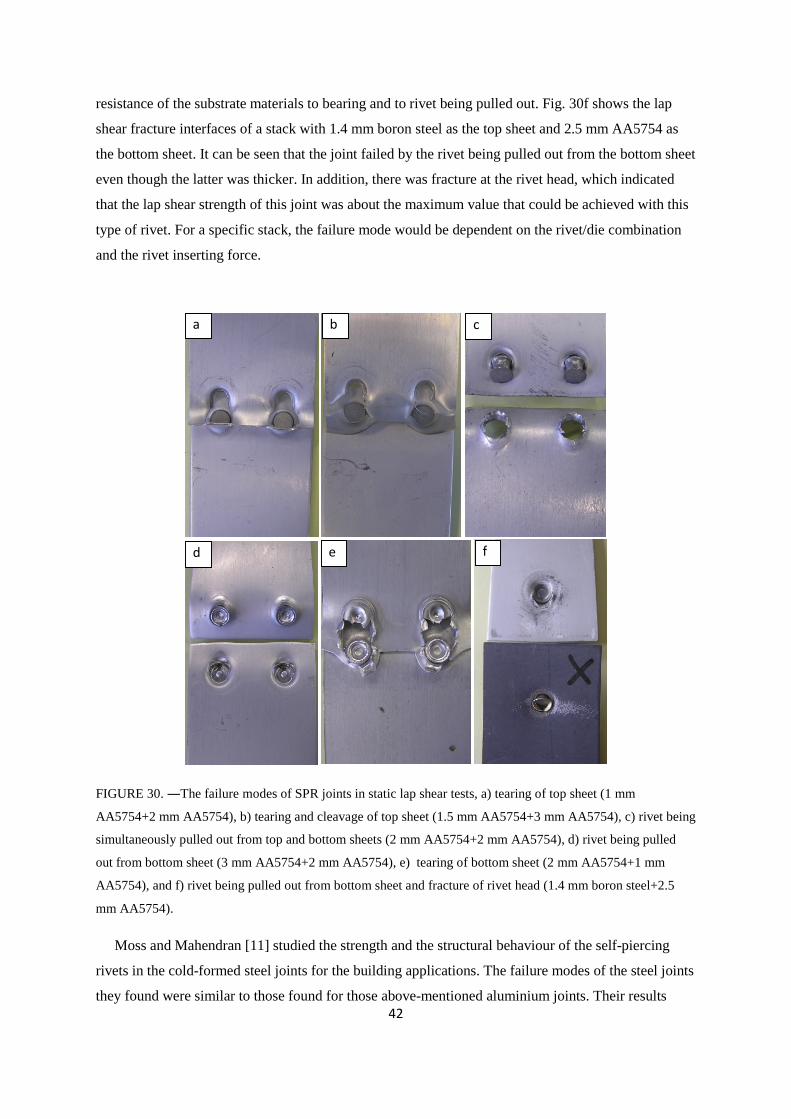
42
resistance of the substrate materials to bearing and to rivet being pulled out. Fig. 30f shows the lap
shear fracture interfaces of a stack with 1.4 mm boron steel as the top sheet and 2.5 mm AA5754 as
the bottom sheet. It can be seen that the joint failed by the rivet being pulled out from the bottom sheet
even though the latter was thicker. In addition, there was fracture at the rivet head, which indicated
that the lap shear strength of this joint was about the maximum value that could be achieved with this
type of rivet. For a specific stack, the failure mode would be dependent on the rivet/die combination
and the rivet inserting force.
FIGURE 30. ―The failure modes of SPR joints in static lap shear tests, a) tearing of top sheet (1 mm
AA5754+2 mm AA5754), b) tearing and cleavage of top sheet (1.5 mm AA5754+3 mm AA5754), c) rivet being
simultaneously pulled out from top and bottom sheets (2 mm AA5754+2 mm AA5754), d) rivet being pulled
out from bottom sheet (3 mm AA5754+2 mm AA5754), e) tearing of bottom sheet (2 mm AA5754+1 mm
AA5754), and f) rivet being pulled out from bottom sheet and fracture of rivet head (1.4 mm boron steel+2.5
mm AA5754).
Moss and Mahendran [11] studied the strength and the structural behaviour of the self-piercing
rivets in the cold-formed steel joints for the building applications. The failure modes of the steel joints
they found were similar to those found for those above-mentioned aluminium joints. Their results
a
e
cb
fd
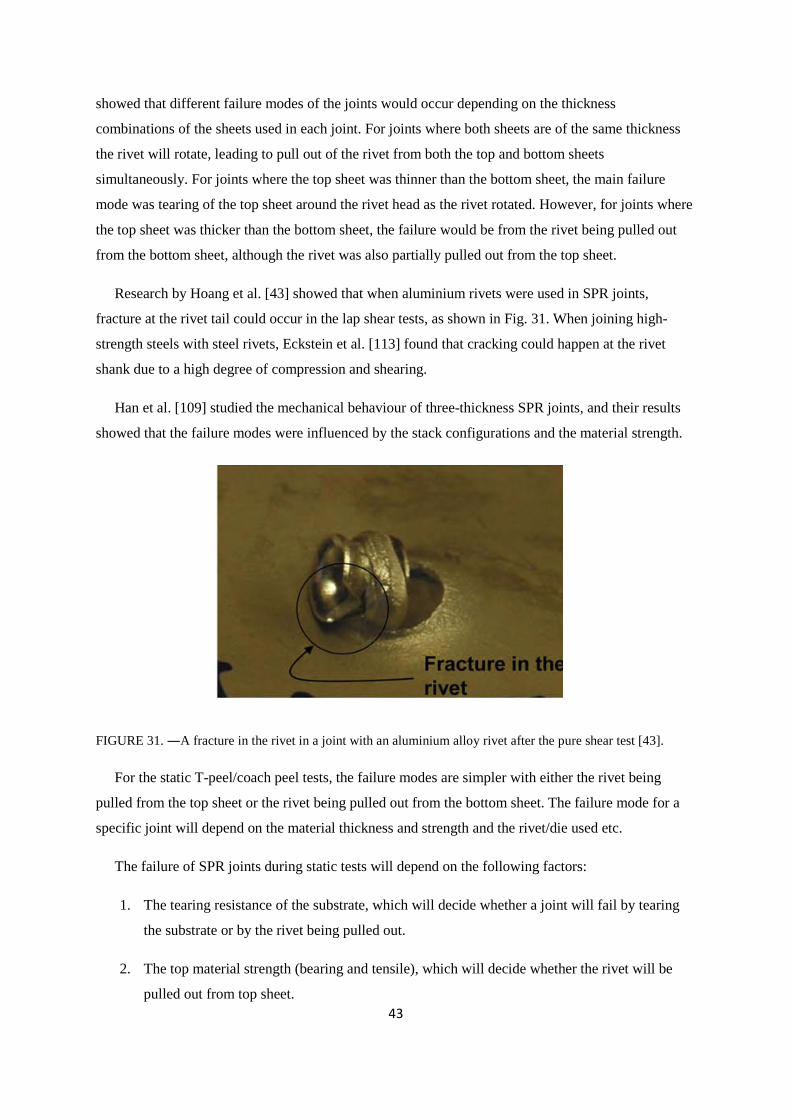
43
showed that different failure modes of the joints would occur depending on the thickness
combinations of the sheets used in each joint. For joints where both sheets are of the same thickness
the rivet will rotate, leading to pull out of the rivet from both the top and bottom sheets
simultaneously. For joints where the top sheet was thinner than the bottom sheet, the main failure
mode was tearing of the top sheet around the rivet head as the rivet rotated. However, for joints where
the top sheet was thicker than the bottom sheet, the failure would be from the rivet being pulled out
from the bottom sheet, although the rivet was also partially pulled out from the top sheet.
Research by Hoang et al. [43] showed that when aluminium rivets were used in SPR joints,
fracture at the rivet tail could occur in the lap shear tests, as shown in Fig. 31. When joining high-
strength steels with steel rivets, Eckstein et al. [113] found that cracking could happen at the rivet
shank due to a high degree of compression and shearing.
Han et al. [109] studied the mechanical behaviour of three-thickness SPR joints, and their results
showed that the failure modes were influenced by the stack configurations and the material strength.
FIGURE 31. ―A fracture in the rivet in a joint with an aluminium alloy rivet after the pure shear test [43].
For the static T-peel/coach peel tests, the failure modes are simpler with either the rivet being
pulled from the top sheet or the rivet being pulled out from the bottom sheet. The failure mode for a
specific joint will depend on the material thickness and strength and the rivet/die used etc.
The failure of SPR joints during static tests will depend on the following factors:
1. The tearing resistance of the substrate, which will decide whether a joint will fail by tearing
the substrate or by the rivet being pulled out.
2. The top material strength (bearing and tensile), which will decide whether the rivet will be
pulled out from top sheet.
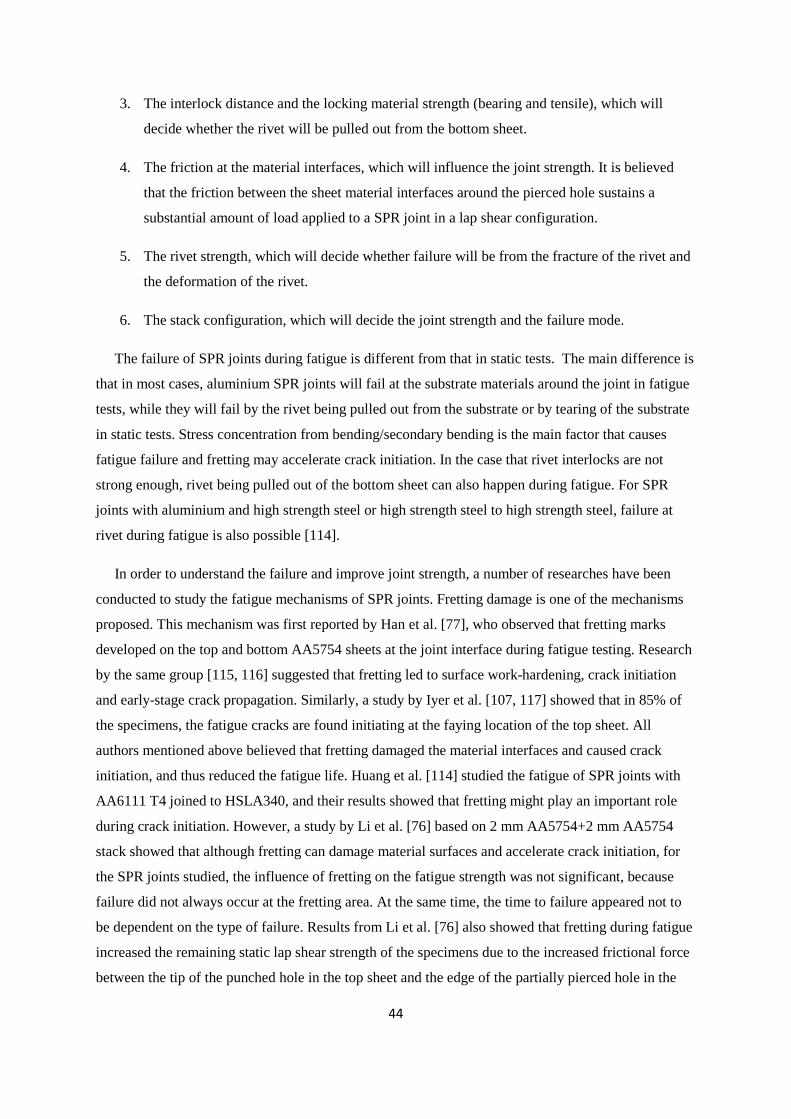
44
3. The interlock distance and the locking material strength (bearing and tensile), which will
decide whether the rivet will be pulled out from the bottom sheet.
4. The friction at the material interfaces, which will influence the joint strength. It is believed
that the friction between the sheet material interfaces around the pierced hole sustains a
substantial amount of load applied to a SPR joint in a lap shear configuration.
5. The rivet strength, which will decide whether failure will be from the fracture of the rivet and
the deformation of the rivet.
6. The stack configuration, which will decide the joint strength and the failure mode.
The failure of SPR joints during fatigue is different from that in static tests. The main difference is
that in most cases, aluminium SPR joints will fail at the substrate materials around the joint in fatigue
tests, while they will fail by the rivet being pulled out from the substrate or by tearing of the substrate
in static tests. Stress concentration from bending/secondary bending is the main factor that causes
fatigue failure and fretting may accelerate crack initiation. In the case that rivet interlocks are not
strong enough, rivet being pulled out of the bottom sheet can also happen during fatigue. For SPR
joints with aluminium and high strength steel or high strength steel to high strength steel, failure at
rivet during fatigue is also possible [114].
In order to understand the failure and improve joint strength, a number of researches have been
conducted to study the fatigue mechanisms of SPR joints. Fretting damage is one of the mechanisms
proposed. This mechanism was first reported by Han et al. [77], who observed that fretting marks
developed on the top and bottom AA5754 sheets at the joint interface during fatigue testing. Research
by the same group [115, 116] suggested that fretting led to surface work-hardening, crack initiation
and early-stage crack propagation. Similarly, a study by Iyer et al. [107, 117] showed that in 85% of
the specimens, the fatigue cracks are found initiating at the faying location of the top sheet. All
authors mentioned above believed that fretting damaged the material interfaces and caused crack
initiation, and thus reduced the fatigue life. Huang et al. [114] studied the fatigue of SPR joints with
AA6111 T4 joined to HSLA340, and their results showed that fretting might play an important role
during crack initiation. However, a study by Li et al. [76] based on 2 mm AA5754+2 mm AA5754
stack showed that although fretting can damage material surfaces and accelerate crack initiation, for
the SPR joints studied, the influence of fretting on the fatigue strength was not significant, because
failure did not always occur at the fretting area. At the same time, the time to failure appeared not to
be dependent on the type of failure. Results from Li et al. [76] also showed that fretting during fatigue
increased the remaining static lap shear strength of the specimens due to the increased frictional force
between the tip of the punched hole in the top sheet and the edge of the partially pierced hole in the
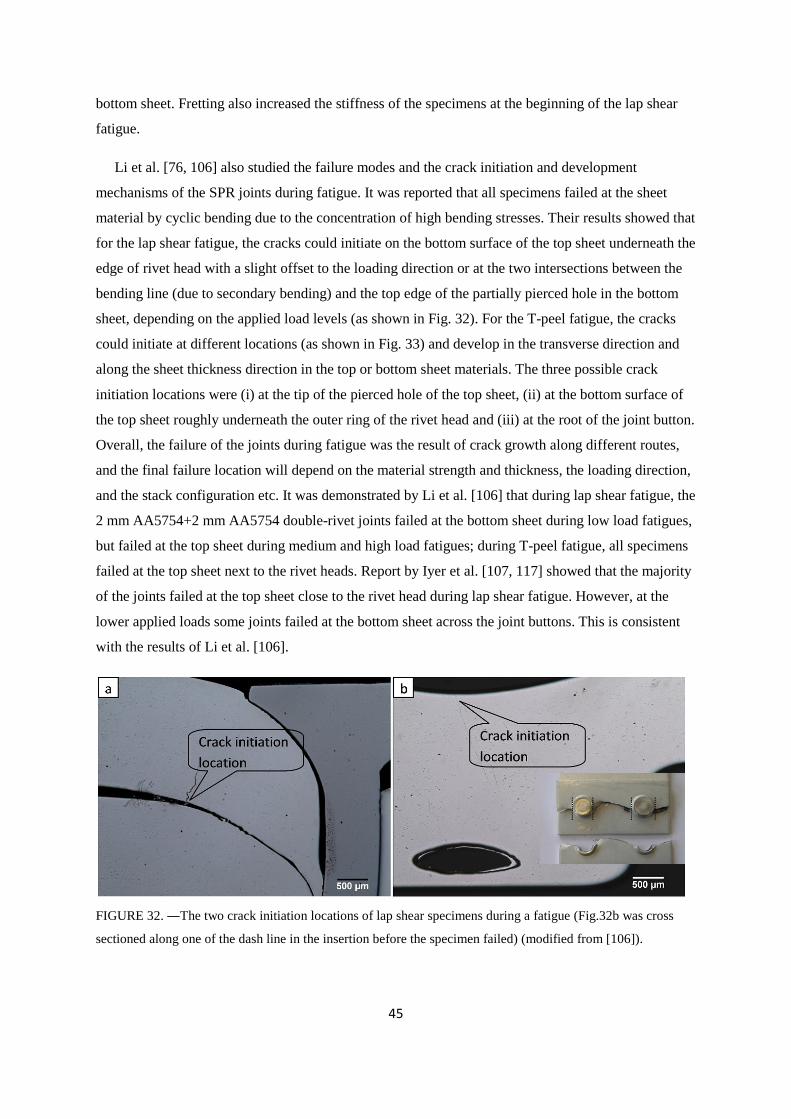
45
bottom sheet. Fretting also increased the stiffness of the specimens at the beginning of the lap shear
fatigue.
Li et al. [76, 106] also studied the failure modes and the crack initiation and development
mechanisms of the SPR joints during fatigue. It was reported that all specimens failed at the sheet
material by cyclic bending due to the concentration of high bending stresses. Their results showed that
for the lap shear fatigue, the cracks could initiate on the bottom surface of the top sheet underneath the
edge of rivet head with a slight offset to the loading direction or at the two intersections between the
bending line (due to secondary bending) and the top edge of the partially pierced hole in the bottom
sheet, depending on the applied load levels (as shown in Fig. 32). For the T-peel fatigue, the cracks
could initiate at different locations (as shown in Fig. 33) and develop in the transverse direction and
along the sheet thickness direction in the top or bottom sheet materials. The three possible crack
initiation locations were (i) at the tip of the pierced hole of the top sheet, (ii) at the bottom surface of
the top sheet roughly underneath the outer ring of the rivet head and (iii) at the root of the joint button.
Overall, the failure of the joints during fatigue was the result of crack growth along different routes,
and the final failure location will depend on the material strength and thickness, the loading direction,
and the stack configuration etc. It was demonstrated by Li et al. [106] that during lap shear fatigue, the
2 mm AA5754+2 mm AA5754 double-rivet joints failed at the bottom sheet during low load fatigues,
but failed at the top sheet during medium and high load fatigues; during T-peel fatigue, all specimens
failed at the top sheet next to the rivet heads. Report by Iyer et al. [107, 117] showed that the majority
of the joints failed at the top sheet close to the rivet head during lap shear fatigue. However, at the
lower applied loads some joints failed at the bottom sheet across the joint buttons. This is consistent
with the results of Li et al. [106].
FIGURE 32. ―The two crack initiation locations of lap shear specimens during a fatigue (Fig.32b was cross
sectioned along one of the dash line in the insertion before the specimen failed) (modified from [106]).
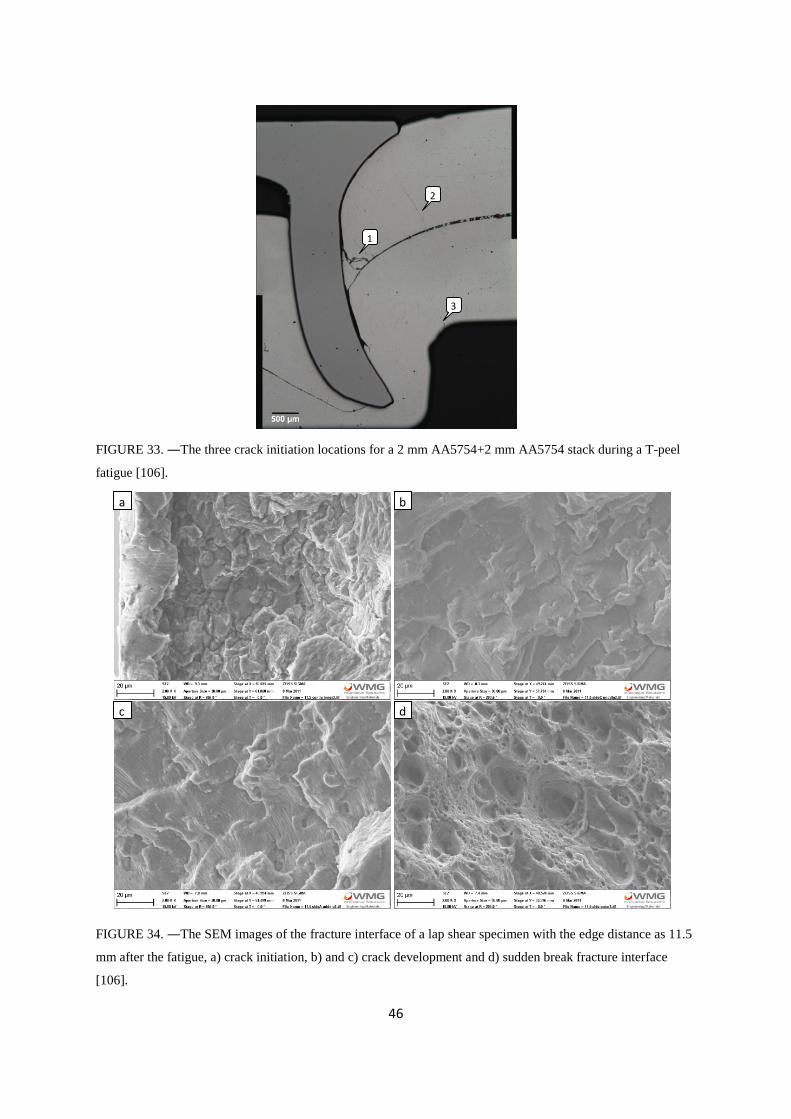
46
FIGURE 33. ―The three crack initiation locations for a 2 mm AA5754+2 mm AA5754 stack during a T-peel
fatigue [106].
FIGURE 34. ―The SEM images of the fracture interface of a lap shear specimen with the edge distance as 11.5
mm after the fatigue, a) crack initiation, b) and c) crack development and d) sudden break fracture interface
[106].
a
dc
b
1
2
3
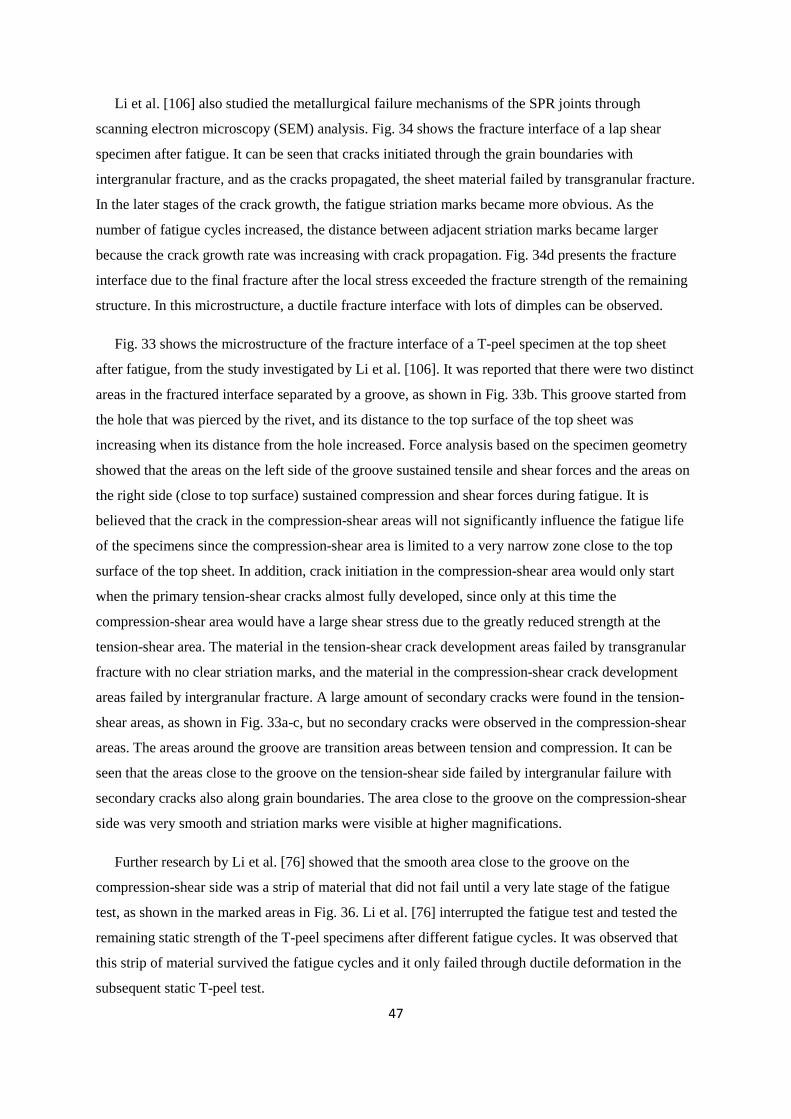
47
Li et al. [106] also studied the metallurgical failure mechanisms of the SPR joints through
scanning electron microscopy (SEM) analysis. Fig. 34 shows the fracture interface of a lap shear
specimen after fatigue. It can be seen that cracks initiated through the grain boundaries with
intergranular fracture, and as the cracks propagated, the sheet material failed by transgranular fracture.
In the later stages of the crack growth, the fatigue striation marks became more obvious. As the
number of fatigue cycles increased, the distance between adjacent striation marks became larger
because the crack growth rate was increasing with crack propagation. Fig. 34d presents the fracture
interface due to the final fracture after the local stress exceeded the fracture strength of the remaining
structure. In this microstructure, a ductile fracture interface with lots of dimples can be observed.
Fig. 33 shows the microstructure of the fracture interface of a T-peel specimen at the top sheet
after fatigue, from the study investigated by Li et al. [106]. It was reported that there were two distinct
areas in the fractured interface separated by a groove, as shown in Fig. 33b. This groove started from
the hole that was pierced by the rivet, and its distance to the top surface of the top sheet was
increasing when its distance from the hole increased. Force analysis based on the specimen geometry
showed that the areas on the left side of the groove sustained tensile and shear forces and the areas on
the right side (close to top surface) sustained compression and shear forces during fatigue. It is
believed that the crack in the compression-shear areas will not significantly influence the fatigue life
of the specimens since the compression-shear area is limited to a very narrow zone close to the top
surface of the top sheet. In addition, crack initiation in the compression-shear area would only start
when the primary tension-shear cracks almost fully developed, since only at this time the
compression-shear area would have a large shear stress due to the greatly reduced strength at the
tension-shear area. The material in the tension-shear crack development areas failed by transgranular
fracture with no clear striation marks, and the material in the compression-shear crack development
areas failed by intergranular fracture. A large amount of secondary cracks were found in the tension-
shear areas, as shown in Fig. 33a-c, but no secondary cracks were observed in the compression-shear
areas. The areas around the groove are transition areas between tension and compression. It can be
seen that the areas close to the groove on the tension-shear side failed by intergranular failure with
secondary cracks also along grain boundaries. The area close to the groove on the compression-shear
side was very smooth and striation marks were visible at higher magnifications.
Further research by Li et al. [76] showed that the smooth area close to the groove on the
compression-shear side was a strip of material that did not fail until a very late stage of the fatigue
test, as shown in the marked areas in Fig. 36. Li et al. [76] interrupted the fatigue test and tested the
remaining static strength of the T-peel specimens after different fatigue cycles. It was observed that
this strip of material survived the fatigue cycles and it only failed through ductile deformation in the
subsequent static T-peel test.
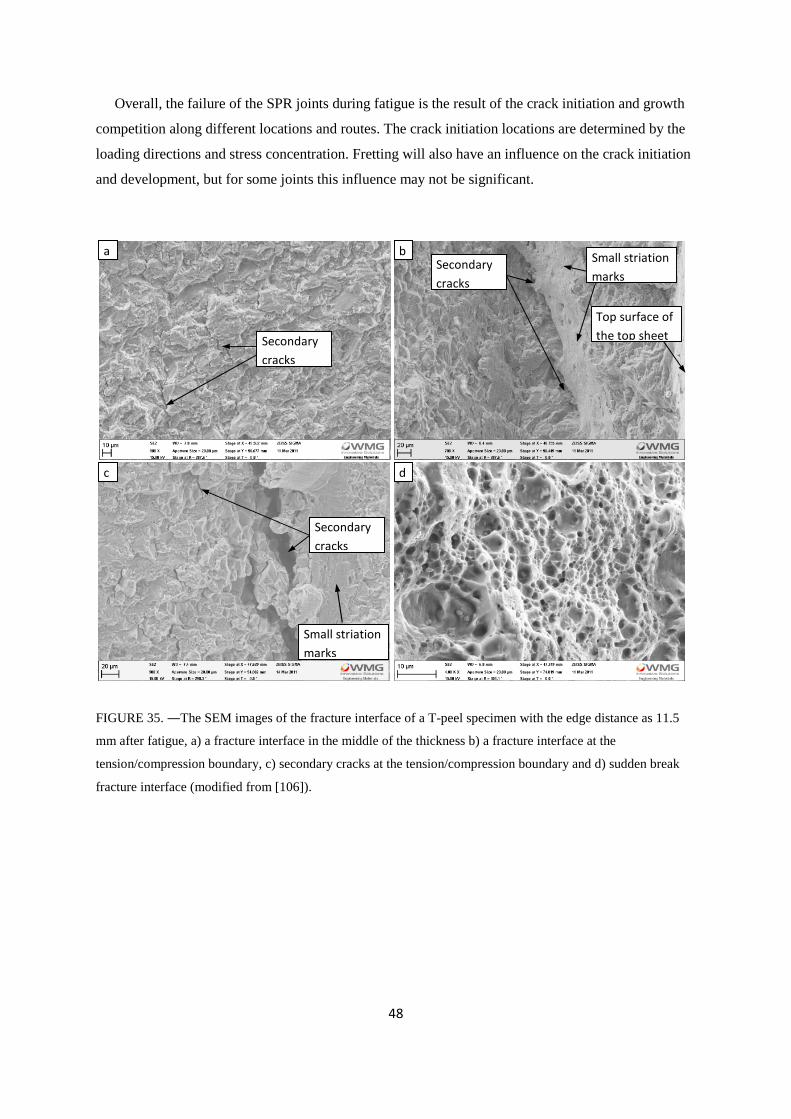
48
Overall, the failure of the SPR joints during fatigue is the result of the crack initiation and growth
competition along different locations and routes. The crack initiation locations are determined by the
loading directions and stress concentration. Fretting will also have an influence on the crack initiation
and development, but for some joints this influence may not be significant.
FIGURE 35. ―The SEM images of the fracture interface of a T-peel specimen with the edge distance as 11.5
mm after fatigue, a) a fracture interface in the middle of the thickness b) a fracture interface at the
tension/compression boundary, c) secondary cracks at the tension/compression boundary and d) sudden break
fracture interface (modified from [106]).
a
Secondary
cracks
bSecondary
cracks
Small striation
marks
Top surface of
the top sheet
d
Small striation
marks
c
Secondary
cracks
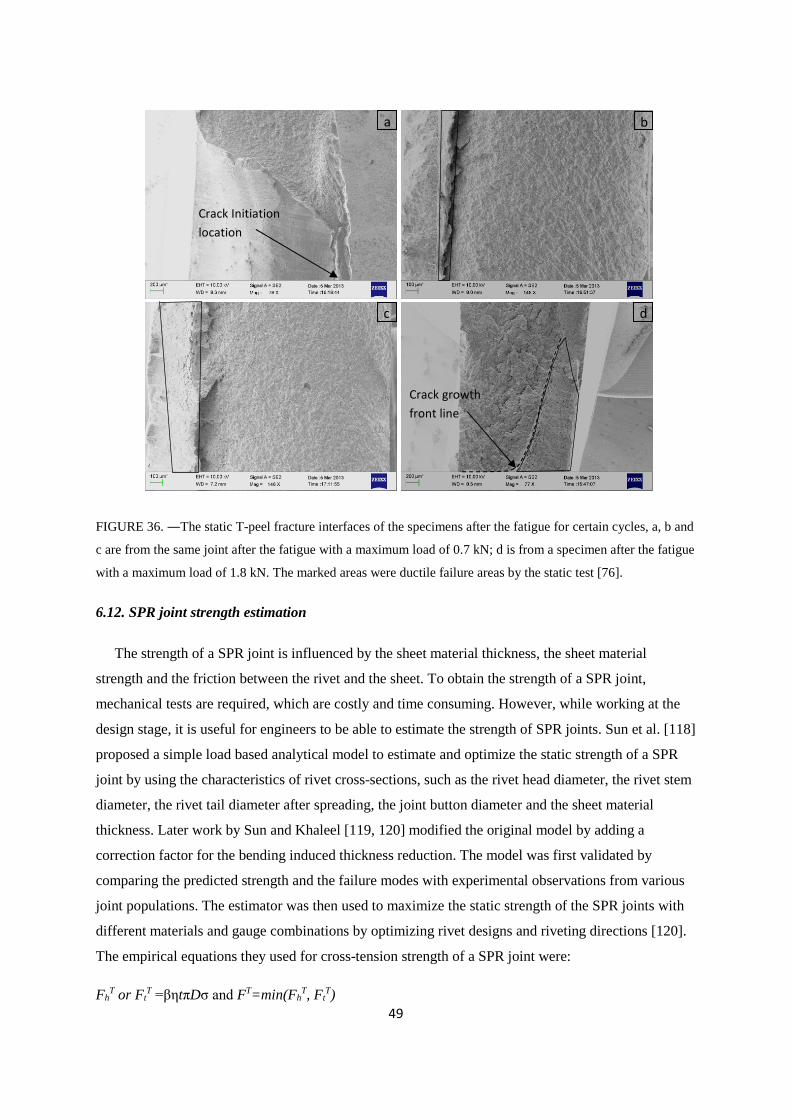
49
FIGURE 36. ―The static T-peel fracture interfaces of the specimens after the fatigue for certain cycles, a, b and
c are from the same joint after the fatigue with a maximum load of 0.7 kN; d is from a specimen after the fatigue
with a maximum load of 1.8 kN. The marked areas were ductile failure areas by the static test [76].
6.12. SPR joint strength estimation
The strength of a SPR joint is influenced by the sheet material thickness, the sheet material
strength and the friction between the rivet and the sheet. To obtain the strength of a SPR joint,
mechanical tests are required, which are costly and time consuming. However, while working at the
design stage, it is useful for engineers to be able to estimate the strength of SPR joints. Sun et al. [118]
proposed a simple load based analytical model to estimate and optimize the static strength of a SPR
joint by using the characteristics of rivet cross-sections, such as the rivet head diameter, the rivet stem
diameter, the rivet tail diameter after spreading, the joint button diameter and the sheet material
thickness. Later work by Sun and Khaleel [119, 120] modified the original model by adding a
correction factor for the bending induced thickness reduction. The model was first validated by
comparing the predicted strength and the failure modes with experimental observations from various
joint populations. The estimator was then used to maximize the static strength of the SPR joints with
different materials and gauge combinations by optimizing rivet designs and riveting directions [120].
The empirical equations they used for cross-tension strength of a SPR joint were:
FhT or Ft
T =βηtπDσ and FT=min(FhT, Ft
T)
a b
c d
Crack Initiation
location
Crack growth
front line
50
where, FhT is the cross tension rivet head pull-out strength from the top sheet;
FtT is the cross tension rivet tail pull-out strength from the bottom sheet;
FT is the cross-tension strength;
β is empirical coefficient for sheet (top or bottom) bending induced thickness reduction;
η is empirical coefficient for the parent material (top or bottom) degradation due to the riveting
process;
t is the top or bottom material effective thickness;
D is the rivet head diameter (for FhT ) or flared rivet tail diameter (for Ft
T );
σ is the material yield strength (top or bottom).
The authors also related the lap shear strength and the T-peel strength of the SPR joints to the
cross-tension strength as follows: the lap shear strength is about 1.5 times of the cross-tension strength
and the T-peel strength is about 0.4 time of the cross-tension strength. Although the relationship
between different strength of a SPR joint varies with different joint stacks, the values stated by these
authors are reasonable.
Strength estimation method was also used for fatigue strength prediction. Agrawal et al. [111]
studied the fatigue life of the SPR joints in the car body. A damage model of the SPR fatigue life was
developed using a global-local approach, in which the local residual stress was applied in the cold-
worked zone in the global system to include the influence from the riveting process. The model was
validated through experiments, and the fatigue life of aluminium car bodies was predicted using a
Ford-developed tool based on the damage model.
7. Crashworthiness of SPR joints
Several studies have been conducted to study the crashworthiness of the SPR joints. Lee et al.
(2006b) compared the crash performance of the resistance spot welded steel double hat-shaped
members with the adhesive-bonded and self-piercing riveted aluminium-steel hybrid double hat-
shaped members. They found that during crash the self-piercing riveted and bonded hybrid members
had a slightly lower energy absorption, lower mean and maximum crash loads, a higher deformation
distance and a higher specific energy absorption (energy absorption divided by weight). Lee et al.
[121] suggested that the hybrid SPR and bonded parts could be used to replace the spot-welded steel
parts. Self-piercing riveted aluminium alloy crush tubes have been widely tested by some automotive
manufacturers and it was proved that the self-piercing riveted aluminium alloy crush tubes performed
51
very well during the crush. During crush, the rivets could hold the parts together without detachment
and the tube could be folded nicely during the crush to absorb energy.
The influence of the test speeds during dynamic impact on the crush performance of the SPR joints
has also been studied by some researchers. The mechanical behaviour of metals at high-strain rates is
usually considerably different from those observed at quasi-static strain rates. The difference can be
attributed to the activation of different slip systems and differences in the mobility and the pile up and
accommodation processes of dislocations under different strain rates. An important difference
between static and impact resistant design is that statically loaded parts must be designed to carry
loads, whereas parts subjected to dynamic impact must also be designed to absorb energy [122]. It is
believed that the dynamic performance of a joint, especially a mechanical joint, will be different from
that of a single material, because of the existence of complex structures and stress concentrations in a
joint.
The reported results concerning impact velocity/test speed on the mechanical performance of SPR
joints were divided. Some research demonstrated that the high test speeds during dynamic tests could
increase the joint strength. Sun and Khaleel [122] studied the dynamic performance of 13 different
joints with aluminium alloys or aluminium alloys and steels joined by SPR and RSW. The loading
rates they used were quasi-static, 4.47 m/s and 8.94 m/s. A piezoelectric load cell with 100 kHz
natural frequency was employed and unfiltered data was used in the study. Their results showed that
for most of the SPR joints the main joint strength increase happened when the loading rate changed
from static to 4.47 m/s. When the loading rate increased further to 8.94 m/s, only the lap shear
strength increased further, while the cross-tension and coach peel strengths did not have any obvious
change. It was also observed that the increase of the lap shear strength was higher than that of the
cross-tension strength and coach peel strength when the joints were tested under dynamic conditions
and the strength changes were joint-related. For one joint, the joint strength was reduced at dynamic
tests, and for other joints, the joint strength increase ranged from 0% to 80%. Madasamy et al. [78]
reported that with the increasing of test speed, for the aluminium SPR joints with adhesive, the joint
strength increased by 123% to 245% depending on the test type, and for the aluminium SPR joints
without adhesive, only the lap shear strength increased by 29%.
However, other research suggested that the influence of high test speeds on the mechanical
performance of SPR joints was negligible or very small. For example, Porcaro et al. [123] studied the
mechanical behaviour of the SPR aluminium alloy double-hat crush tubes during quasi-static and
crush tests. For the crush test, the weight of the impacting mass was 600 kg and the initial velocity
was 10.4 m/s. Their results showed that the maximum and average forces from the crush test were
slightly higher than those from the static test. Porcaro et al. [124] also studied the mechanical
52
behaviour of the SPR aluminium alloy joints under quasi-static and dynamic conditions using a split
Hopkinson pressure bar. Three velocities of approximately 10, 15 and 20 m/s, were used for the
dynamic tests. Their results showed that the effect of impact velocity on the force–displacement curve
as well as on the deformation mode was almost negligible for the pull-out tests. Wood et al. [125]
studied the dynamic mechanical performance of the SPR aluminium alloy (AA5754) joints in the lap
shear, T-peel and cross-tension configurations. The test speeds they studied included: 0.01 m/s, 0.1
m/s, 0.5 m/s, 2 m/s and 5 m/s. Filtered data was used in this study. Whilst the strength of aluminium
alloys was not strain rate sensitive, the test results showed that the cross tension and lap shear
strengths of the SPR joints had measurable (but very small) reduction at the higher test speeds.
However, the T-peel strength of the SPR joints was not affected by the test speed. The reduction in
joint performance for the tension and shear specimens at higher test speeds may be explained by the
reduction of the frictional force between the rivet and the locking sheet. It is known that friction
decreases with increasing sliding velocity for many combinations of metallic materials.
Some simulation work was conducted to study the influence of high impact speeds on the joint
performance during crush test. Westerberg [126] simulated the T-peel strength of 1.15 mm +1.15 mm
steel (DDQ or DP600) stacks using the finite element software ABAQUS/Explicit. In his research,
various test speeds from 1 m/s to 100 m/s were applied to examine the influence on mechanical
performance. The results showed that the mechanical performance was similar at 1, 10 and 25 m/s,
but the maximum load, energy absorption and displacement were higher at 100 m/s.
The different results on the performance of SPR joints in the dynamic conditions may be caused by
the different test conditions used, such as different test speeds, different load cell, different system
natural frequencies and different data filtering methods used.
8. Residual Stress of SPR joints
Residual stresses in a SPR joint arise from the rivet setting process due to the high level of
deformation and the global distortion during assembly. These residual stresses will influence the
mechanical performance of the SPR joints, and as an initial mechanical status, they are also essential
for any FEA model to accurately predict the joint strength. A lot of destructive and non-destructive
techniques can be used for residual stress measurement, such as layer removal, hole drilling, block
sectioning, contour methods, X-ray diffraction, synchrotron diffraction, neutron diffraction,
ultrasound, eddy current and magnetic methods etc. But when it comes to the residual stress
measurement for the SPR joints, the techniques that can be used are limited because the SPR joints
have a complex geometry with a lot of material interfaces. X-ray diffraction is not suitable because it
53
has a depth limitation of only 5 μm, but neutron diffraction can be used because it can measure strains
up to 50 mm deep in steel based on the reports from Hutchings et al. [127] and Withers et al. [128].
Haque et al. [129] measured the residual stress of one aluminium-steel and one steel-steel joint
using the neutron diffraction with a gauge volume of 0.5 x 0.5 x 0.5 mm3. They found that the residual
stresses that developed in the rivet bore/tail near the interface between the top and bottom sheets were
the largest and most significant for both joints. The highest residual stress of 550 MPa was measured
in the aluminium-steel riveted joint. Residual stresses as high as 1075 MPa had been predicted by
Khezri and Melander [130, 131] through simulation, but not validated. One limitation of this
measurement was that the point intervals for the measurement were too large, with the smallest being
0.5 mm. Because the rivet tail only had a wall thickness of about 1 mm, the numbers of points that
could be measured were very limited. Other limitations of the measurement were that it could only
measure the residual stress within the steel because only the Fe (211) reflection was collected and it
had a large measurement uncertainty. Further research by Haque et al. [132] showed that by
increasing the acquisition time, the measurement uncertainty could be reduced, and by reducing the
gauge volume from 1 m3 to 0.125 m3, the measurement accuracy could be much improved. The strain
measurement from the rivet head side and the die side was found to be different due to the different
path distances.
9. Mechanical strength of riv-bonded joints
Compared with joints prepared by SPR only, riv-bonded joints (combination of SPR riveting and
adhesive bonding) can offer additional benefits, including continuous leak-tightness, higher strength,
higher stiffness and improved peel and impact resistance [133]. For a riv-bonded joint, the rivet and
the adhesive are complementary to each other. The adhesive can increase the joint stiffness, lap shear
strength and anti-vibration ability, reduce stress concentration and make the joint water-tight. On the
other hand, the rivet can hold the part together before curing and it can also increase the joint strength,
and in particular the peel strength. There are also some potential disadvantages for riv-bonding
compared with SPR, including longer process time, additional cost, contamination of riveting tools
and surface preparation etc.
Only certain types of adhesives can be used in riv-bonding and the process parameters need to be
controlled. The most suitable adhesives for use with self-piercing rivets are pumpable and heat-cured
adhesives [133]. Research by Hahn and Wibbeke [134] showed that the application of high viscosity
adhesives, such as EP208 with viscosity of 3000-4000 Pas, could make the riv-bonding process
difficult due to the introduction of a high hydro-pressure between the sheet and within the clamping
54
area. In this case, an optimised SPR joint could only be achieved by using a harder rivet, a lower
clamping force and a higher rivet inserting speed.
Hahn et al. [135] studied the mechanical properties of the riv-bonded joints and reported an
increase of more than 200% in lap shear strength for the riv-bonded joints when compared with the
equivalent SPR joints. There were two distinct loading peaks in the lap shear displacement-load curve
of a riv-bonded joint. The first peak was higher and it was attributed to the strength of the adhesive.
The second peak was lower, which appeared after the failure of the adhesive and was corresponding
to the interlocking strength of the rivet. However, it was also observed that the strength of the riv-
bonded joints was greatly influenced by aging/corrosion. Following immersion in a saline solution
(0.9% NaCl solution) for 8 weeks, the lap shear strength of the riv-bonded joints dropped greatly, by
20% to 70%, depending on the type of coating applied on the substrate AA6016. Moroni et al. [136]
studied the influence of adhesive on the joint strength of mechanical fastened joints and the influence
of environmental tests on the joint strength of riv-bonded hybrid joints. Results showed that the
adhesive increased the strength, stiffness and energy absorption of the hybrid joints in comparison
with SPR only joints, while environmental ageing (with different moisture and temperature) and salt-
spray exposure reduced the strength of the hybrid joints. In another study by Westgate and Razmjoo
[137], it also showed that the addition of adhesive in the SPR and RSW joints could increase both the
static and fatigue strength of the joints. Madasamy et al. [78] studied the influence of temperature
(between 21oC and 160oC) on the strength of riv-bonded joints. They demonstrated that at higher
temperature the strength increase of riv-bonded joints due to the presence of adhesive was smaller due
to the lower strength of adhesives at higher temperature.
10. Local and global distortions of SPR joined structures
The use of SPR presents some concerns on dimensional issues due to the local distortion caused by
the high impact and the relatively large material flow of the process. The local distortion of the SPR
joints and their influence on assembly dimension were studied by Cai et al. [138] by using a
coordinate measuring machine (CMM). Their results showed that the local distortion of the SPR
joints, especially that at the top coupon, is much larger than that in the RSW joints and consideration
on the SPR joint distortion is generally needed for accurate global assembly predictions.
In addition to experimental work, Huang et al. [139] used FEA modelling to study the local
distortion of aluminium alloy joints. They found that the clamping force and the blank holder
diameter were two important factors for joint distortion, while the sheet size only had a minor effect.
Their results showed that in order to reduce the local distortion, a high clamping force and a large
blank holder diameter were necessary.
55
Other than the local distortion caused by the SPR process, some researchers studied the distortion
in assembled parts. For example, Fan and Masters [140] studied the global distortion of parts joined
by SPR. The research showed that the local distortion from the SPR joining process may cause the
part dimensions error to an unacceptable level if not properly managed. In addition, it was shown that
joining of thicker sheets produced a larger distortion than that observed in thinner sheets and the
sequence of riveting could greatly influence the global distortion. A suitable riveting sequence could
be used to control the distortion of an assembly. They also found that a smaller SPR pitch produced a
greater global distortion due to the increased number of locations with local distortions. In later
research, Masters et al. [141] studied the local and global distortion through simulation by using
PamCRASHTM and PamASSEMBLYTM software. They attempted to predict the global distortions and
part-twist during assembly, but the predicted values were not very accurate.
These studies have shown that the local distortions caused by a SPR process can be quite large.
These local distortions could therefore influence the assembly dimension accuracy globally if not
properly managed.
11. Corrosion issues of SPR joints
Nowadays, owing to the application of some advanced coatings and paints, corrosion is no longer
of great concern for automotive body structures. For the automotive body structures joined by SPR,
the chance of corrosion is greatly reduced due to the application of e-coating, adhesives, sealants and
paint. However, some research has been conducted to understand the corrosion behaviour of the SPR
joints in the absence or failure of the protection system.
The earliest study on the corrosion of SPR joints was by Howard and Sunday [4]. They
demonstrated that corrosion could occur in SPR joints in two possible ways; (i) Crevice corrosion due
to surface irregularities or crevices (such as at the interfaces between the sheets that are joined), which
are introduced by the SPR process; (ii) Galvanic corrosion due to use of different materials, for
example, steel rivets and aluminium alloy sheets. They also demonstrated that coatings on steel rivets,
such as polyester coatings or cadmium plating, can significantly reduce the amount of corrosion of the
aluminium alloy in contact with steel rivets.
Various corrosion tests have been used to study the corrosion resistance of SPR joints, with
alternate immersion corrosion and salt-spray corrosion being the two main ones. Calabrese et al. [142]
studied the influence of alternate immersion corrosion on the mechanical performance of various
AA6082 aluminium alloy stacks joined by steel rivets with a zinc coating. The alternate immersion
test was carried out, according to the ASTM G44 standard, using an automated alternate immersion
tank. The testing environment was controlled at a temperature of 27 ± 1 °C and relative humidity of
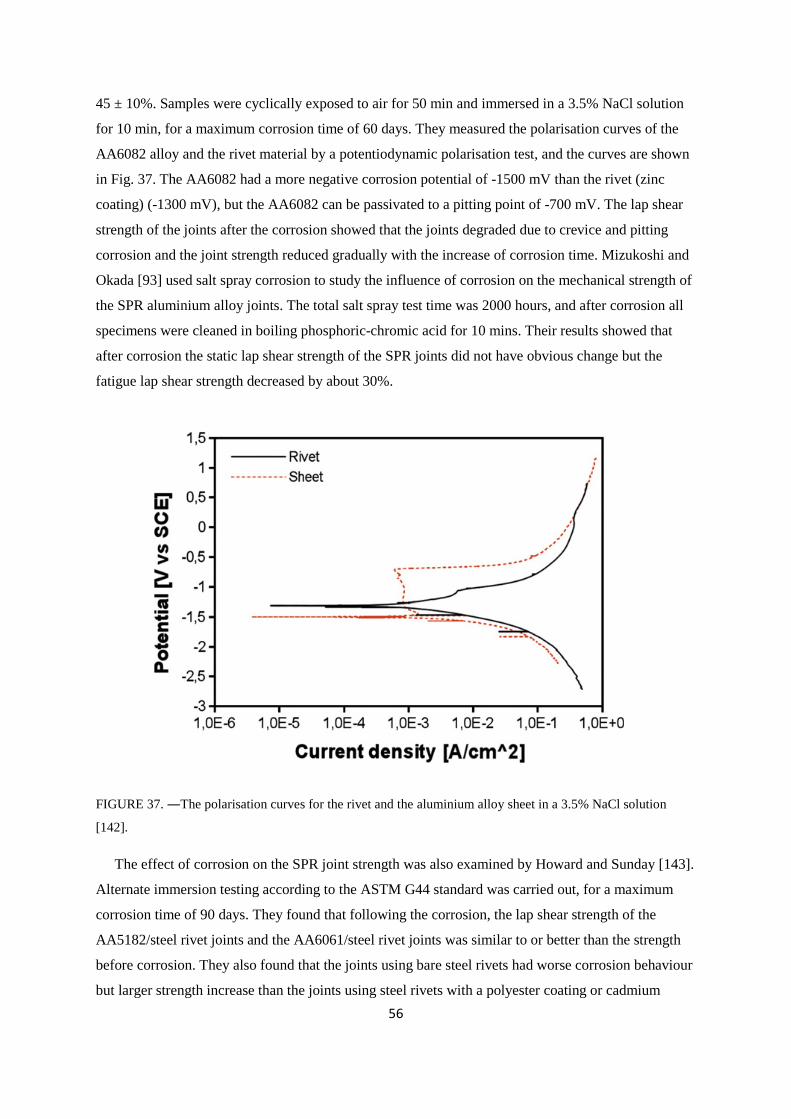
56
45 ± 10%. Samples were cyclically exposed to air for 50 min and immersed in a 3.5% NaCl solution
for 10 min, for a maximum corrosion time of 60 days. They measured the polarisation curves of the
AA6082 alloy and the rivet material by a potentiodynamic polarisation test, and the curves are shown
in Fig. 37. The AA6082 had a more negative corrosion potential of -1500 mV than the rivet (zinc
coating) (-1300 mV), but the AA6082 can be passivated to a pitting point of -700 mV. The lap shear
strength of the joints after the corrosion showed that the joints degraded due to crevice and pitting
corrosion and the joint strength reduced gradually with the increase of corrosion time. Mizukoshi and
Okada [93] used salt spray corrosion to study the influence of corrosion on the mechanical strength of
the SPR aluminium alloy joints. The total salt spray test time was 2000 hours, and after corrosion all
specimens were cleaned in boiling phosphoric-chromic acid for 10 mins. Their results showed that
after corrosion the static lap shear strength of the SPR joints did not have obvious change but the
fatigue lap shear strength decreased by about 30%.
FIGURE 37. ―The polarisation curves for the rivet and the aluminium alloy sheet in a 3.5% NaCl solution
[142].
The effect of corrosion on the SPR joint strength was also examined by Howard and Sunday [143].
Alternate immersion testing according to the ASTM G44 standard was carried out, for a maximum
corrosion time of 90 days. They found that following the corrosion, the lap shear strength of the
AA5182/steel rivet joints and the AA6061/steel rivet joints was similar to or better than the strength
before corrosion. They also found that the joints using bare steel rivets had worse corrosion behaviour
but larger strength increase than the joints using steel rivets with a polyester coating or cadmium
57
plating. Ioannou [144] also studied the influence of corrosion on the SPR joints for a stack of 1.2 mm
interstitial-free steel as the top sheet and 1.5 mm AA5182 aluminium alloy as the bottom sheet. The
rivets used were mechanically Zn-Sn coated steel rivets. The salt-spray corrosion test was performed
according to the ASTM B117 standard, at 35°C (±1.5°C) using a 5% NaCl solution in distilled water.
The corrosion test was carried out in hourly cycles, involving a salt spray of 10 mins at a spray rate of
0.8 litres/hour followed by 50 mins of hot air (drying). It was shown that the lap shear strength of the
joints increased with the increase of corrosion time up to 351 hours and then started to reduce. Li et al.
[53] studied the influence of salt-spray corrosion on the lap shear strength of an aluminium alloy joint
with 2 mm AA5754 as both the top and bottom sheets. The rivet used was mechanically zinc/tin
coated. Salt-spray corrosion test according to the ASTM B117 standard was used. Their results
showed that after 1000 hours of salt spray corrosion there was an increase in the maximum lap shear
strength but a reduction in the maximum extension of the SPR joints, which was consistent with the
results from Howard and Sunday [143]. Li et al. [53] believed that the increase of lap shear strength of
the SPR joints in these studies was due to the build-up of corrosion products and an increase of
surface roughness at the joint interfaces, which increased the frictional force and subsequently the lap
shear strength.
Recently, Calabrese et al. [145] studied the influence of salt spray on the joint strength of steel-
aluminium hybrid SPR joints using the ASTM B117 standard. Overall, the joint strength degradation
was more severe than that for aluminium SPR joints due to galvanic corrosion between the steel and
aluminium sheets. They also observed that for some types of joints the average lap shear joint strength
increased at the early stages of corrosion due to the deposition of corrosion product at the material
interfaces.
The influence of corrosion on mechanical strength of SPR joints reported by different researcher
seems to vary. This may be caused by the use of different grades of aluminium alloys, different
stacks, different type of corrosion tests used and the use of different methods to clean the specimens
after corrosion. It is believed that some corrosion products can tighten the SPR joints and/or roughen
the sheet/sheet interface and subsequently increase the joint strength, but if these corrosion products
are removed after corrosion, the joints will become loose and as a result they will have a lower
strength.
12. Quality control of SPR joints
In order to assure the joint quality and the reliability of the SPR joints, cross-sectioning and joint
feature analysis is the main method that is currently used by the technique users. Other methods that
58
have been tried and studied include process monitoring, such as displacement-force curve monitoring,
and non-destructive test (NDT) techniques, such as ultrasonic wave and eddy current etc.
The first investigation on SPR setting displacement-force curves was carried out in Paderborn
University [37, 38]. They found the rivet setting displacement-force curves were unique for a specific
material stack and rivet setting parameter combination, and they proposed the use of the curves to
monitor the SPR process. Further investigations were conducted by King [146] and Hou et al. [36],
who also proposed to use the displacement-force curves to monitor joint quality. In addition, Hou et
al. [36] analysed the influence of some possible faults on displacement-force curves, such as use of
rivet of wrong length, wrong stack thickness, die wear, part planar misalignment and punch/die axial
misalignment. By monitoring the displacement-force, the consistency of the SPR process can be
judged and process abnormalities can be notified. However, a reliable reference curve needs to be
generated based on physical cross-sectioning and joint feature analysis. In addition, this method
cannot give information on joint features, and it cannot tell whether an abnormal joint is unacceptable
or not. It is possible that a joint with a different displacement-force curve may have an even better
joint quality, although normally an abnormal displacement-force curve will indicate a weak joint.
An NDT method for SPR was developed by the University of Warwick [147] and the University of
Uppsala [148] using narrowband ultrasonic spectroscopy. Although this technique can indicate
abnormal joints in comparison with sound joints, it is unable to tell the joint quality/features and it
cannot guarantee that the abnormal joint is a weak joint.
Because of the presence of complex interfaces in a SPR joint, there are still no reliable process
monitoring and NDT methods that can be used to control the SPR joint quality without destructive
tests. However, by using the process monitoring method, it is possible to detect abnormal joints.
Modern SPR systems use the process monitoring to control the SPR setting process. By using a
reference displacement-force curve with certain tolerances, the system will give a warning when the
curve falls outside the set tolerances. Apart from setting displacement-force curve monitoring, SPR
systems can also monitor some process parameters, such as the rivet length and the stack thickness, to
give warning and stop the process before the rivet is set. In this case, engineers on site can then
investigate the problem and avoid part wastage and further production damage.
13. Finite element modelling of SPR
Although the SPR process is consistent if the right parameter combination is chosen, for any new
joint (new materials or new setting parameters), the joint quality needs to be evaluated. Currently,
cross-sectioning and joint feature analysis is the only procedure that can be used to evaluate various
parameters for a particular joint. For this reason, during the current application of SPR in automotive
59
manufacture, all the new material stacks to be used in the body-in-white structure need to be evaluated
to select the right parameter combinations before production. During the evaluation process, different
rivet, die and setting force combinations will be tried for any new stack to be used, and the joints will
be cross-sectioned and analysed against the joint quality criteria. Depending on the stack thickness
and the location in the structures, all the joints will be grouped. Within a group, the number of
required rivet, die and setting force combinations has to be limited in order to join them with one
robot and one SPR system to reduce the total number of robots and SPR systems needed for the whole
production. As a result, a large number of stacks need to be evaluated and the process is very time-
consuming. However, if a robust and reliable modelling tool is available to predict the rivetability of
various material stacks, then a large amount of time will be saved and the cost and length of the
product development will be much reduced.
In addition, there is a demand for a sound modelling tool to predict the strength of an individual
SPR joint and use it as input data for the entire vehicle modelling.
13.1. Modelling of the SPR joining process and joint strength
During a SPR process modelling, normally the punch, the blank holder, and the die are treated as
rigid bodies, while the self-piercing rivet and the top and bottom sheets are treated as deformable
bodies. Normally, a 2D model is used for SPR process modelling, because the model is axisymmetric,
while a 3D model is used for SPR joint strength modelling, because the model is not axisymmetric.
Based on the available published research, the 4-node 2D element was reported to be used in the
riveting process modelling, and the 8-node hexahedron solid element, the 27-noded brick and 15-
noded prismatic elements were reported to be used in joint strength modelling. Various re-meshing
methods, such as the r-adaptive meshing method, need to be used in SPR simulation. Continuous re-
meshing has the beneficial effect of eliminating deformation-induced mesh distortions and
consequently the need for deleting troublesome elements. According to the overview of SPR
simulation by Xu [48], nonlinear finite element models were required, because the geometries of the
parts and the materials were nonlinear and also because contacts and friction existed between the
sheet materials and the rivet. An elastic-plastic model was required for the materials because a large
amount of plastic deformation occurred during the SPR process. It was suggested that a sound
simulation model could be used to predict the residual stress/strain of a SPR joint after rivet setting,
and it could also be used to predict the joint features, such as the joint interlock distance.
Various commercial software packages have been used for SPR simulation, including ANSYS,
LS-DYNA, MSC and DEFORM 2D and ABAQUS. Casalino et al. [149] reported all the governing
equations along with the mathematics of the resolving method for setting up and simulating a finite
element model for the SPR process. The main features for modelling a SPR process include space
60
discretization, time integration, contact and friction, and fracture implementation. In the following
sections, some of these features will be reviewed.
13.1.1. Material mechanical properties
For SPR modelling, the mechanical properties of the rivet and the sheet materials are very
important, since they will control the deformation of the materials. The mechanical properties of the
sheet materials are easy to obtain through dog-bone tensile tests; however, measurement of the
mechanical properties of a self-piercing rivet is not that straightforward. The mechanical properties of
the bulk wires (which are used to make rivets) are not suitable, because the mechanical properties of
the rivets (cold-formed) are different from those of the bulk wires (before cold forming). Two
methods have been reported on how to obtain the mechanical properties of self-piercing rivets. The
first method was reported by Xu [48], in which the hardness of the rivet was measured, and then the
yield strength of the rivet material was derived through the relationship between material hardness
and strength. The second method was reported by Khezri et al. [150], in which compression tests with
the tube rivet material (with the rivet head and end of tail cut away) along the rivet tail direction were
conducted to obtain the mechanical properties of the rivet. With a different approach, Porcaro et al.
[81, 151] used lateral compression tests (by squeezing the side-wall of the tube together) of the cut
rivet tube and the mechanical properties of the rivet was obtained by inverse modelling.
Simulation results from Mucha [152] by using the MSC Marc 2005 software showed that the die
profile and the mechanical performance of the rivet had a great influence on the rivet spread and the
required setting force.
13.1.2. Friction at the joint interfaces
During a SPR setting process and a joint loading process, there are several locations where friction
occurs. These include locations between the rivet and the sheet materials, between the sheet materials,
between the punch and the rivet, between the top sheet material and the blank holder and between the
bottom sheet material and the die etc. It is not possible to measure these frictional forces at these
interfaces by in-situ methods, because friction occurs locally and the geometries of the interfaces are
complex. It will also be difficult to measure them separately, because of variations in surface texture,
applied pressure and speed of relative movements etc.
In models for SPR modelling, different researchers have used different coefficients of friction. A
value of 0.1 was used by Xu [48], a value of 0.15 was used by Khezri et al. [150], and a value of 0.2
was used by Kato et al. [153] and Abe et al. [15, 154], for all interfaces. Other researchers used
different friction coefficients at different locations. For example, Krishnappa [155] used the friction
coefficients of 0.15 and 0.3 at different locations. Atzeni et al. [40, 156] used a friction coefficient of
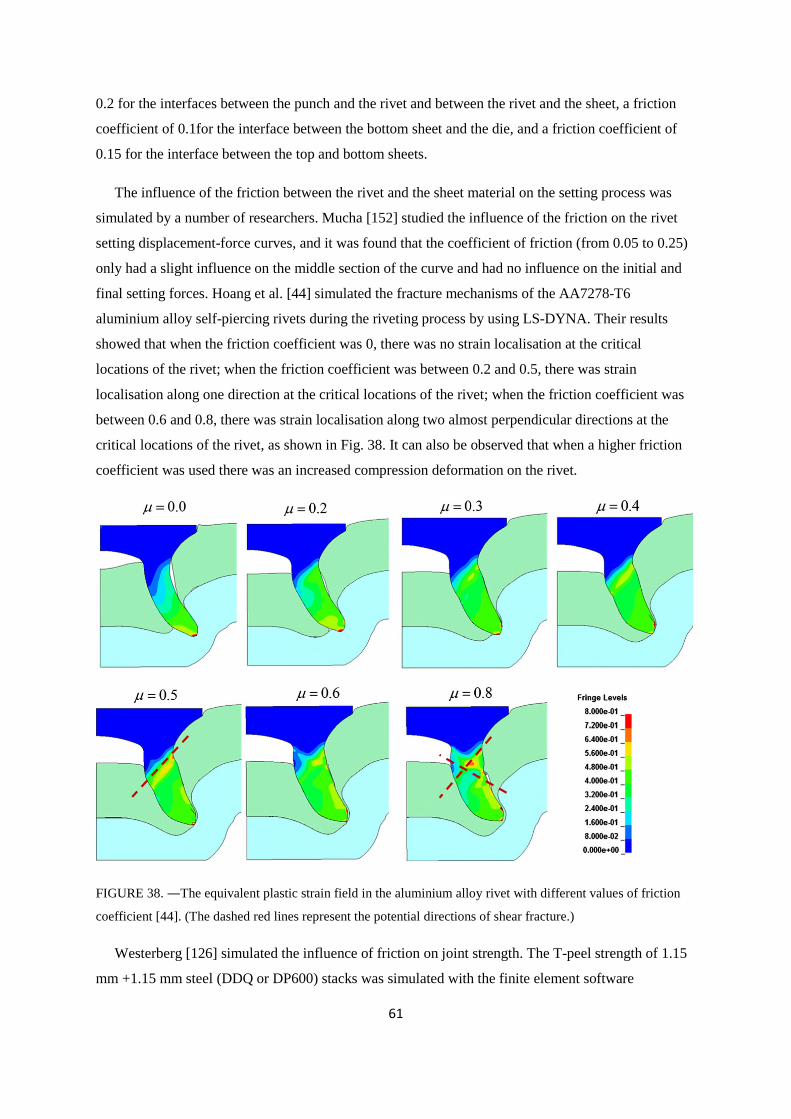
61
0.2 for the interfaces between the punch and the rivet and between the rivet and the sheet, a friction
coefficient of 0.1for the interface between the bottom sheet and the die, and a friction coefficient of
0.15 for the interface between the top and bottom sheets.
The influence of the friction between the rivet and the sheet material on the setting process was
simulated by a number of researchers. Mucha [152] studied the influence of the friction on the rivet
setting displacement-force curves, and it was found that the coefficient of friction (from 0.05 to 0.25)
only had a slight influence on the middle section of the curve and had no influence on the initial and
final setting forces. Hoang et al. [44] simulated the fracture mechanisms of the AA7278-T6
aluminium alloy self-piercing rivets during the riveting process by using LS-DYNA. Their results
showed that when the friction coefficient was 0, there was no strain localisation at the critical
locations of the rivet; when the friction coefficient was between 0.2 and 0.5, there was strain
localisation along one direction at the critical locations of the rivet; when the friction coefficient was
between 0.6 and 0.8, there was strain localisation along two almost perpendicular directions at the
critical locations of the rivet, as shown in Fig. 38. It can also be observed that when a higher friction
coefficient was used there was an increased compression deformation on the rivet.
FIGURE 38. ―The equivalent plastic strain field in the aluminium alloy rivet with different values of friction
coefficient [44]. (The dashed red lines represent the potential directions of shear fracture.)
Westerberg [126] simulated the influence of friction on joint strength. The T-peel strength of 1.15
mm +1.15 mm steel (DDQ or DP600) stacks was simulated with the finite element software
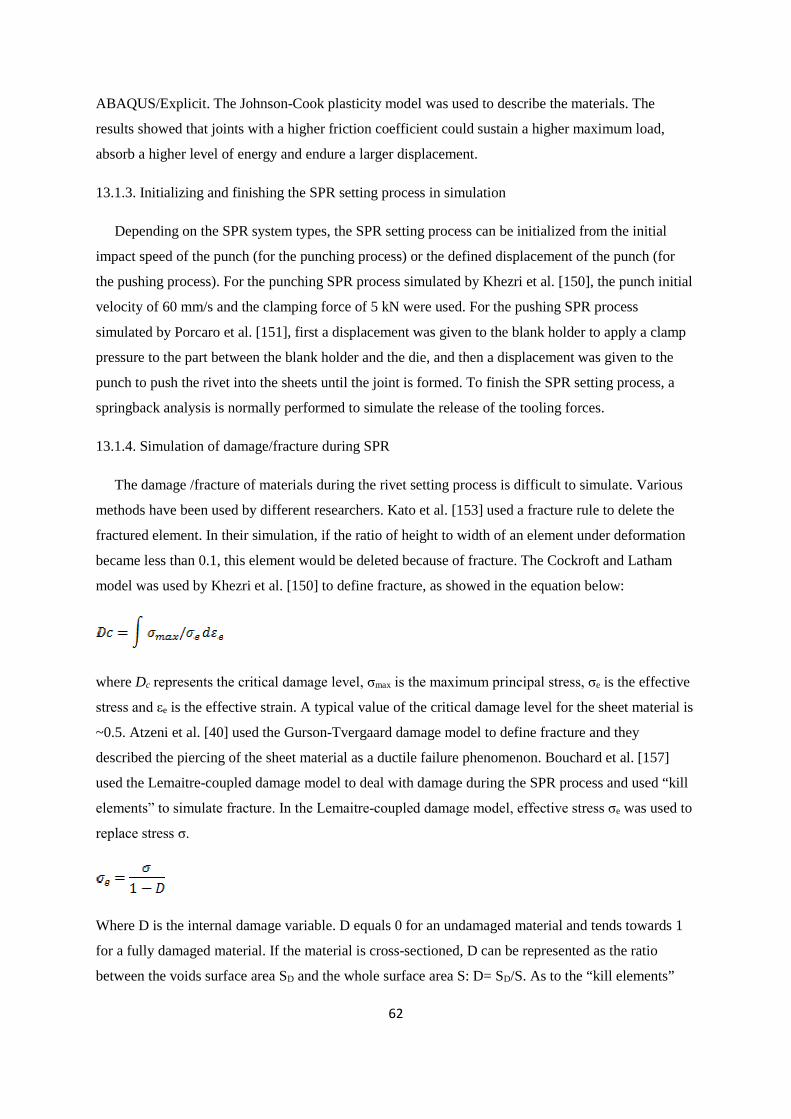
62
ABAQUS/Explicit. The Johnson-Cook plasticity model was used to describe the materials. The
results showed that joints with a higher friction coefficient could sustain a higher maximum load,
absorb a higher level of energy and endure a larger displacement.
13.1.3. Initializing and finishing the SPR setting process in simulation
Depending on the SPR system types, the SPR setting process can be initialized from the initial
impact speed of the punch (for the punching process) or the defined displacement of the punch (for
the pushing process). For the punching SPR process simulated by Khezri et al. [150], the punch initial
velocity of 60 mm/s and the clamping force of 5 kN were used. For the pushing SPR process
simulated by Porcaro et al. [151], first a displacement was given to the blank holder to apply a clamp
pressure to the part between the blank holder and the die, and then a displacement was given to the
punch to push the rivet into the sheets until the joint is formed. To finish the SPR setting process, a
springback analysis is normally performed to simulate the release of the tooling forces.
13.1.4. Simulation of damage/fracture during SPR
The damage /fracture of materials during the rivet setting process is difficult to simulate. Various
methods have been used by different researchers. Kato et al. [153] used a fracture rule to delete the
fractured element. In their simulation, if the ratio of height to width of an element under deformation
became less than 0.1, this element would be deleted because of fracture. The Cockroft and Latham
model was used by Khezri et al. [150] to define fracture, as showed in the equation below:
where Dc represents the critical damage level, σmax is the maximum principal stress, σe is the effective
stress and εe is the effective strain. A typical value of the critical damage level for the sheet material is
~0.5. Atzeni et al. [40] used the Gurson-Tvergaard damage model to define fracture and they
described the piercing of the sheet material as a ductile failure phenomenon. Bouchard et al. [157]
used the Lemaitre-coupled damage model to deal with damage during the SPR process and used “kill
elements” to simulate fracture. In the Lemaitre-coupled damage model, effective stress σe was used to
replace stress σ.
Where D is the internal damage variable. D equals 0 for an undamaged material and tends towards 1
for a fully damaged material. If the material is cross-sectioned, D can be represented as the ratio
between the voids surface area SD and the whole surface area S: D= SD/S. As to the “kill elements”
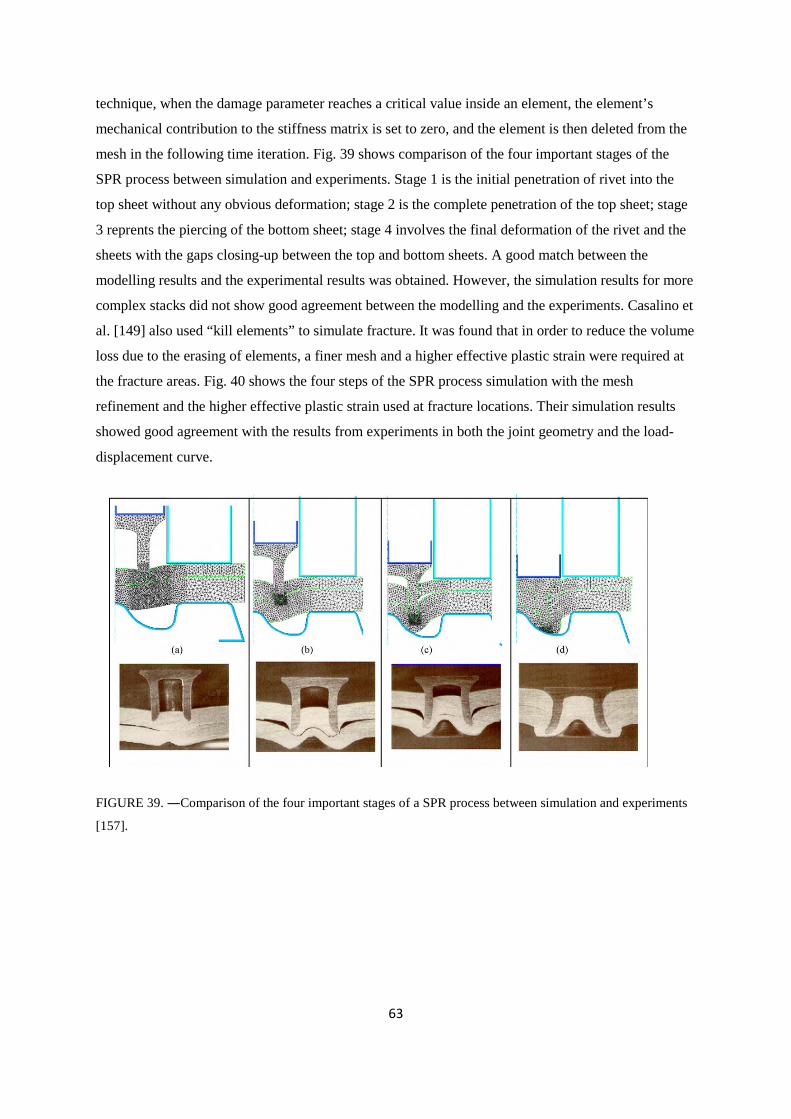
63
technique, when the damage parameter reaches a critical value inside an element, the element’s
mechanical contribution to the stiffness matrix is set to zero, and the element is then deleted from the
mesh in the following time iteration. Fig. 39 shows comparison of the four important stages of the
SPR process between simulation and experiments. Stage 1 is the initial penetration of rivet into the
top sheet without any obvious deformation; stage 2 is the complete penetration of the top sheet; stage
3 reprents the piercing of the bottom sheet; stage 4 involves the final deformation of the rivet and the
sheets with the gaps closing-up between the top and bottom sheets. A good match between the
modelling results and the experimental results was obtained. However, the simulation results for more
complex stacks did not show good agreement between the modelling and the experiments. Casalino et
al. [149] also used “kill elements” to simulate fracture. It was found that in order to reduce the volume
loss due to the erasing of elements, a finer mesh and a higher effective plastic strain were required at
the fracture areas. Fig. 40 shows the four steps of the SPR process simulation with the mesh
refinement and the higher effective plastic strain used at fracture locations. Their simulation results
showed good agreement with the results from experiments in both the joint geometry and the load-
displacement curve.
FIGURE 39. ―Comparison of the four important stages of a SPR process between simulation and experiments
[157].
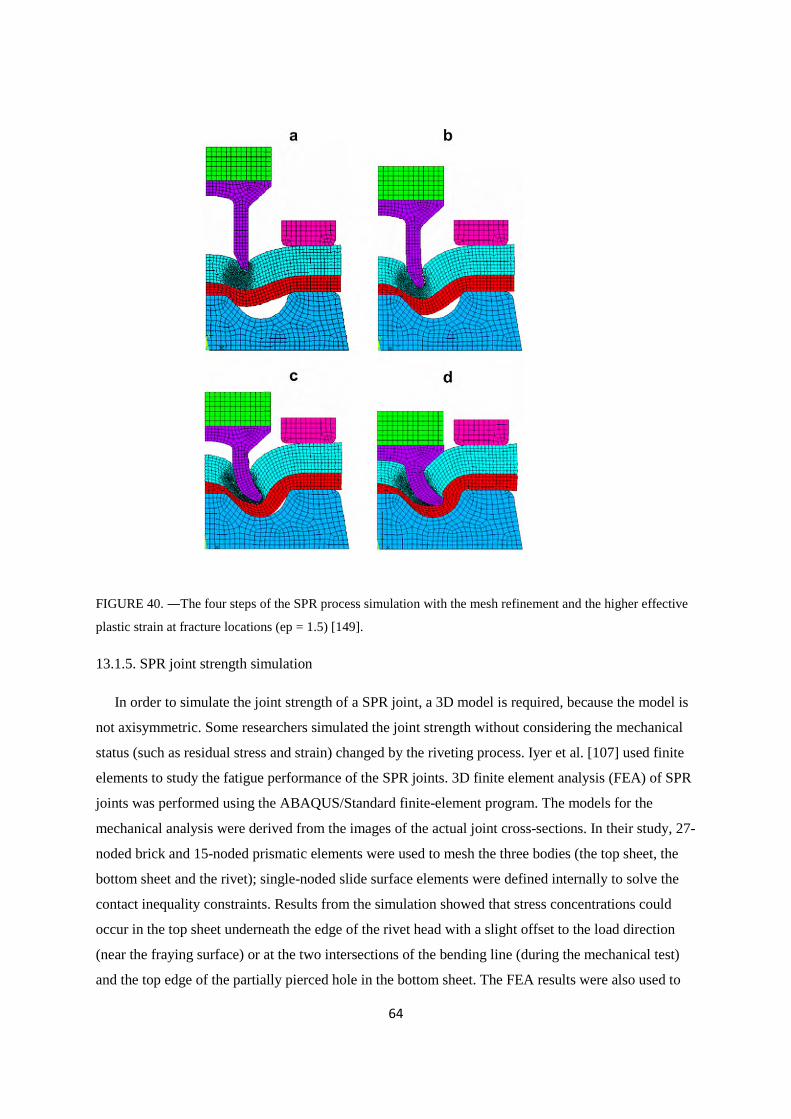
64
FIGURE 40. ―The four steps of the SPR process simulation with the mesh refinement and the higher effective
plastic strain at fracture locations (ep = 1.5) [149].
13.1.5. SPR joint strength simulation
In order to simulate the joint strength of a SPR joint, a 3D model is required, because the model is
not axisymmetric. Some researchers simulated the joint strength without considering the mechanical
status (such as residual stress and strain) changed by the riveting process. Iyer et al. [107] used finite
elements to study the fatigue performance of the SPR joints. 3D finite element analysis (FEA) of SPR
joints was performed using the ABAQUS/Standard finite-element program. The models for the
mechanical analysis were derived from the images of the actual joint cross-sections. In their study, 27-
noded brick and 15-noded prismatic elements were used to mesh the three bodies (the top sheet, the
bottom sheet and the rivet); single-noded slide surface elements were defined internally to solve the
contact inequality constraints. Results from the simulation showed that stress concentrations could
occur in the top sheet underneath the edge of the rivet head with a slight offset to the load direction
(near the fraying surface) or at the two intersections of the bending line (during the mechanical test)
and the top edge of the partially pierced hole in the bottom sheet. The FEA results were also used to
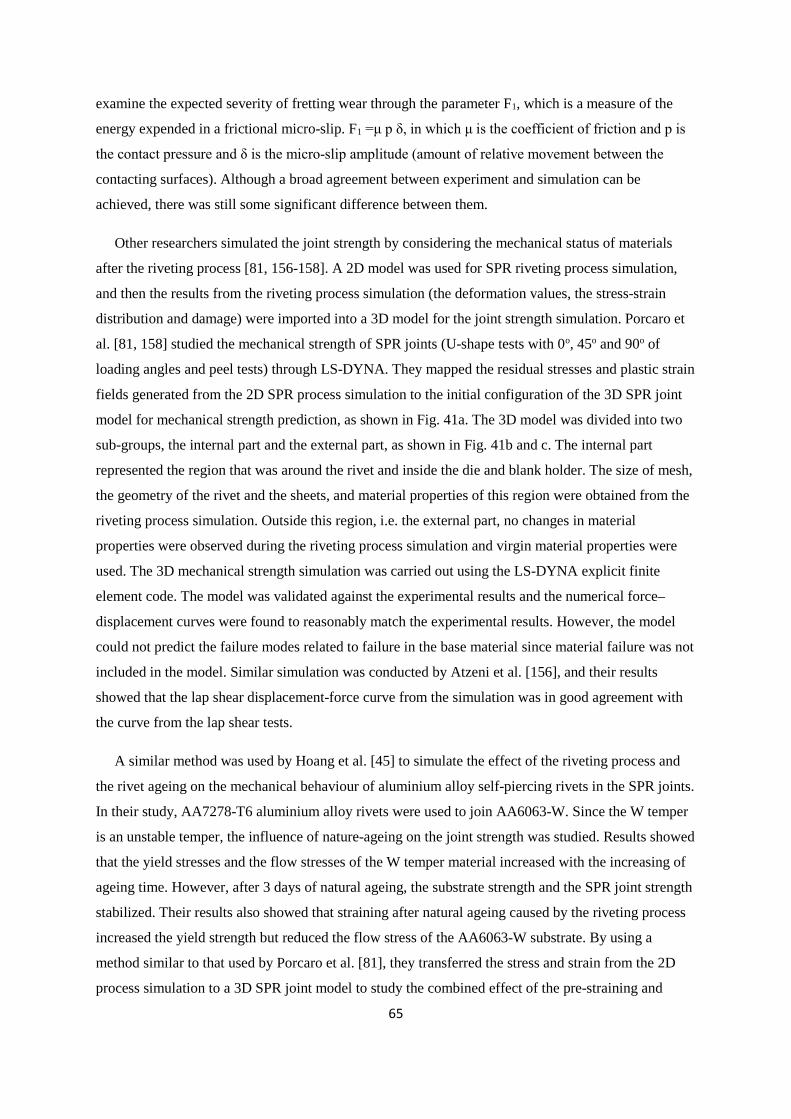
65
examine the expected severity of fretting wear through the parameter F1, which is a measure of the
energy expended in a frictional micro-slip. F1 =μ p δ, in which μ is the coefficient of friction and p is
the contact pressure and δ is the micro-slip amplitude (amount of relative movement between the
contacting surfaces). Although a broad agreement between experiment and simulation can be
achieved, there was still some significant difference between them.
Other researchers simulated the joint strength by considering the mechanical status of materials
after the riveting process [81, 156-158]. A 2D model was used for SPR riveting process simulation,
and then the results from the riveting process simulation (the deformation values, the stress-strain
distribution and damage) were imported into a 3D model for the joint strength simulation. Porcaro et
al. [81, 158] studied the mechanical strength of SPR joints (U-shape tests with 0o, 45o and 90o of
loading angles and peel tests) through LS-DYNA. They mapped the residual stresses and plastic strain
fields generated from the 2D SPR process simulation to the initial configuration of the 3D SPR joint
model for mechanical strength prediction, as shown in Fig. 41a. The 3D model was divided into two
sub-groups, the internal part and the external part, as shown in Fig. 41b and c. The internal part
represented the region that was around the rivet and inside the die and blank holder. The size of mesh,
the geometry of the rivet and the sheets, and material properties of this region were obtained from the
riveting process simulation. Outside this region, i.e. the external part, no changes in material
properties were observed during the riveting process simulation and virgin material properties were
used. The 3D mechanical strength simulation was carried out using the LS-DYNA explicit finite
element code. The model was validated against the experimental results and the numerical force–
displacement curves were found to reasonably match the experimental results. However, the model
could not predict the failure modes related to failure in the base material since material failure was not
included in the model. Similar simulation was conducted by Atzeni et al. [156], and their results
showed that the lap shear displacement-force curve from the simulation was in good agreement with
the curve from the lap shear tests.
A similar method was used by Hoang et al. [45] to simulate the effect of the riveting process and
the rivet ageing on the mechanical behaviour of aluminium alloy self-piercing rivets in the SPR joints.
In their study, AA7278-T6 aluminium alloy rivets were used to join AA6063-W. Since the W temper
is an unstable temper, the influence of nature-ageing on the joint strength was studied. Results showed
that the yield stresses and the flow stresses of the W temper material increased with the increasing of
ageing time. However, after 3 days of natural ageing, the substrate strength and the SPR joint strength
stabilized. Their results also showed that straining after natural ageing caused by the riveting process
increased the yield strength but reduced the flow stress of the AA6063-W substrate. By using a
method similar to that used by Porcaro et al. [81], they transferred the stress and strain from the 2D
process simulation to a 3D SPR joint model to study the combined effect of the pre-straining and
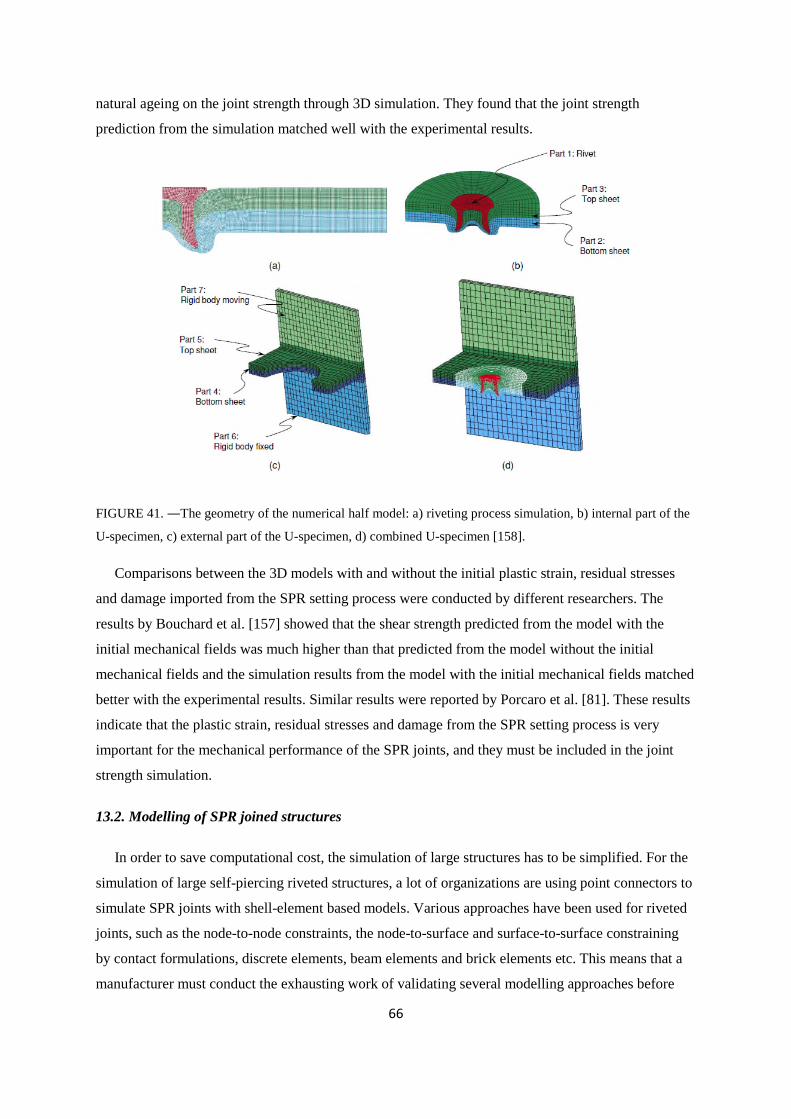
66
natural ageing on the joint strength through 3D simulation. They found that the joint strength
prediction from the simulation matched well with the experimental results.
FIGURE 41. ―The geometry of the numerical half model: a) riveting process simulation, b) internal part of the
U-specimen, c) external part of the U-specimen, d) combined U-specimen [158].
Comparisons between the 3D models with and without the initial plastic strain, residual stresses
and damage imported from the SPR setting process were conducted by different researchers. The
results by Bouchard et al. [157] showed that the shear strength predicted from the model with the
initial mechanical fields was much higher than that predicted from the model without the initial
mechanical fields and the simulation results from the model with the initial mechanical fields matched
better with the experimental results. Similar results were reported by Porcaro et al. [81]. These results
indicate that the plastic strain, residual stresses and damage from the SPR setting process is very
important for the mechanical performance of the SPR joints, and they must be included in the joint
strength simulation.
13.2. Modelling of SPR joined structures
In order to save computational cost, the simulation of large structures has to be simplified. For the
simulation of large self-piercing riveted structures, a lot of organizations are using point connectors to
simulate SPR joints with shell-element based models. Various approaches have been used for riveted
joints, such as the node-to-node constraints, the node-to-surface and surface-to-surface constraining
by contact formulations, discrete elements, beam elements and brick elements etc. This means that a
manufacturer must conduct the exhausting work of validating several modelling approaches before
67
selecting the most appropriate one. In these simplified large-scale simulations, work hardening and
residual stress–strain distributions in the region around the rivet are normally ignored.
Porcaro et al [123] used a constrained spot weld to simulate the behaviour of SPR joints in LS-
DYNA. The mechanical strength of the SPR joints tested with different loading angles was used as
input to determine model parameters, such as the mesh density, the number of nodes constrained and
the yield strength value of material around rivet. Similar research was conducted by Hanssen et al.
[159]. They developed a new resultant-based point-connector model with large-scale finite elements
using LS-DYNA. The model parameters needed to be calibrated based on the experimental results
from different mechanical tests, such as U-shape specimen tests with 0o, 90o and 45o loading
directions and peel tests, before it could be used for large structure modelling.
Sommer and Maier [160] also tried to simulate the mechanical performance of the SPR joints
using LS-DYNA. In their research, they tried different elements and material models for the SPR
joints. They found that the beam element model was not a promising model because of high rotation
under shear loading. Instead, they found that the material model (MAT_240) with one hexahedron
element was the most promising model to describe the deformation and failure behaviour of the
riveted joint, although the force-displace curves and the energy absorption values did not match well
with those from the experiments.
Dannbauer et al. [99] developed a model to predict the stiffness and the fatigue life of SPR joints
by using FEMFAT software. The model for SPR was developed based on the existing model for spot-
welding with shell elements. The crash performance of SPR joints was studied by Tang et al. [161]
through simulation in RADIOSS commercial finite element code. The SPR joints were simulated as
nonlinear spring elements. The displacement-force curves from ‘U’ tension, lap shear and T-peel tests
were used as baseline curves and input into the model. A crash speed of 20 mph and ambient
temperature were used. Results showed that the model could predict the maximum strength and joint
separation, and good correlation was observed on a full vehicle side impact analysis.
Providing that it is accurate, modelling can provide a lot of information that cannot be gained or is
very difficult to gain through experimental work. It can also save time and cost on the material stack
evaluation. Due to the complex structure of SPR joints, the simulation of the SPR process and the
simulation of the joint strength are very difficult. Generally speaking, the predicted results from
simulation match well with the results from experiments, but for different joints, tuning of the
simulation parameters is essential. The frictional force uncertainty, the slightly tilted rivets during the
initial contact with material stacks in experiments and the slight difference of the rivet tip geometry
between the one used in experiments and the one used in simulation are some of the reasons that
cause disagreement between experimental and modelling results.
68
14. Conclusions
The adoption of SPR by the automotive industry in the 1990s for joining aluminium alloy
structures brought the technique to prominence and this was followed by several research
investigations to understand the process and the performance of self-piercing rivets. The technique
relies on the rivet to pierce the top sheet and to deform and lock into the bottom sheet. The type and
properties of the rivet, the die geometry and the setting force have been identified as the main
processing parameters. The selection of suitable SPR parameters for a robust joint is dependent on the
properties of the sheets to be joined. SPR joint strength relies on a high interlock distance and
therefore the deformation of the joined materials and in particular of the bottom sheet is crucial.
Generally, joints with larger diameter rivets have higher strength than those with smaller diameter
rivets. In addition, the SPR joint strength increases with the increase of the sheet material thickness or
the stack thickness. For joints with unequal top and bottom sheet thickness, the strength of the joints is
determined by the strength of the thinner sheet and the joint strength will normally be higher if the
thick material is used as the bottom material. For a similar stack configuration, joints with higher
strength materials will normally have higher joint strength and similarly pre-straining sheet materials
prior to riveting can also increase joint strength. The influence of the setting force on the mechanical
performance of SPR joints depends on the material stack and the joint features. The presence of
coatings on the sheet materials and the rivets can result in a different level of friction at the material
interface during processing (and during performance). As a result, alternative setting forces may be
required and different joint features will be generated, leading to a different joint strength. It has been
shown that the distance between the rivet centre and the sheet edge in the longitudinal direction does
not have any obvious influence on the SPR joint strength, but the distance in the transverse direction
has a large influence. The tip geometry of the rivet is also a very important factor for the behaviour of
the rivet during the SPR process. Rivets with different tip geometries exhibit different deformation
characteristics and as a result they may produce joints of different strength. As to the influence of
different stack configurations, if the joint can be designed to avoid secondary bending, improved
behaviour will be obtained. The influence of the factors that affect SPR joint quality is summarised in
Fig. 42.
The SPR focus of the automotive industry has been on joining primarily aluminium alloys and this
was addressed in much of the initial research in the topic. Since SPR was used as an alternative to
resistance spot-welding of aluminium alloys, much of the early research was concerned with a
comparison between joints obtained from the two processes. Whilst the RSW and SPR joint strength
was comparable, SPR joints have been shown to have superior fatigue resistance. This observation
has been attributed to the work-hardening of the substrate materials and to stress relaxation through
slip at the joint interface as well as to the absence of a brittle aluminium oxide. Subsequent research
69
and development has led to the ability to join dissimilar materials together by SPR, for example,
aluminium to steel, polymers to metals and composites to metals. Studies have demonstrated that
when joining brittle materials like composites to metals, it is necessary for the brittle component to be
used as the top material, while the ductile and deformable material as the bottom material. The
rivetability of brittle and less deformable metals (including some aluminium alloys, DP steels and
magnesium alloys) may be aided by localised heating to improve their ability to deform and to obtain
an improved interlock. However, the technology to use localised heating is not fully mature yet and
may depend on the demand for high-speed SPR joining which is likely to rely on the ability to heat
the materials at a fast rate.
The lap-shear strength of a two-layer SPR joint is dependent on a combination of factors including
the force to deform the substrate material, the frictional force between the rivet and the substrate and
the frictional force between the top and bottom sheets particularly around the tip of the punched hole
in the top sheet. The failure mode depends on factors like the material thickness, the rivet material, the
setting force, the loading directions, the interfacial friction and the stack configuration. Failure for
static tests may occur by various modes including tearing of the top sheet, tearing and cleavage of the
top sheet, tearing of the top sheet accompanied with rivet pull-out from the top sheet, the rivet being
simultaneously pulled out from the top and bottom sheets, the rivet being pulled out from the bottom
sheet and/or tearing of the bottom sheet. The fatigue failure of SPR joints differs from that of static
tests. SPR fatigue failure normally occurs at the substrate materials around the joints other than the
joints themselves. Research has also shown that fatigue could reduce the remaining T-peel strength of
SPR joints, but within a certain range it could increase the lap shear stiffness and the remaining lap
shear strength of the joints due to increased friction at the joint interface. T-peel fatigue at high
applied loads could also increase the joint stiffness through plastic deformation and geometric
changes.
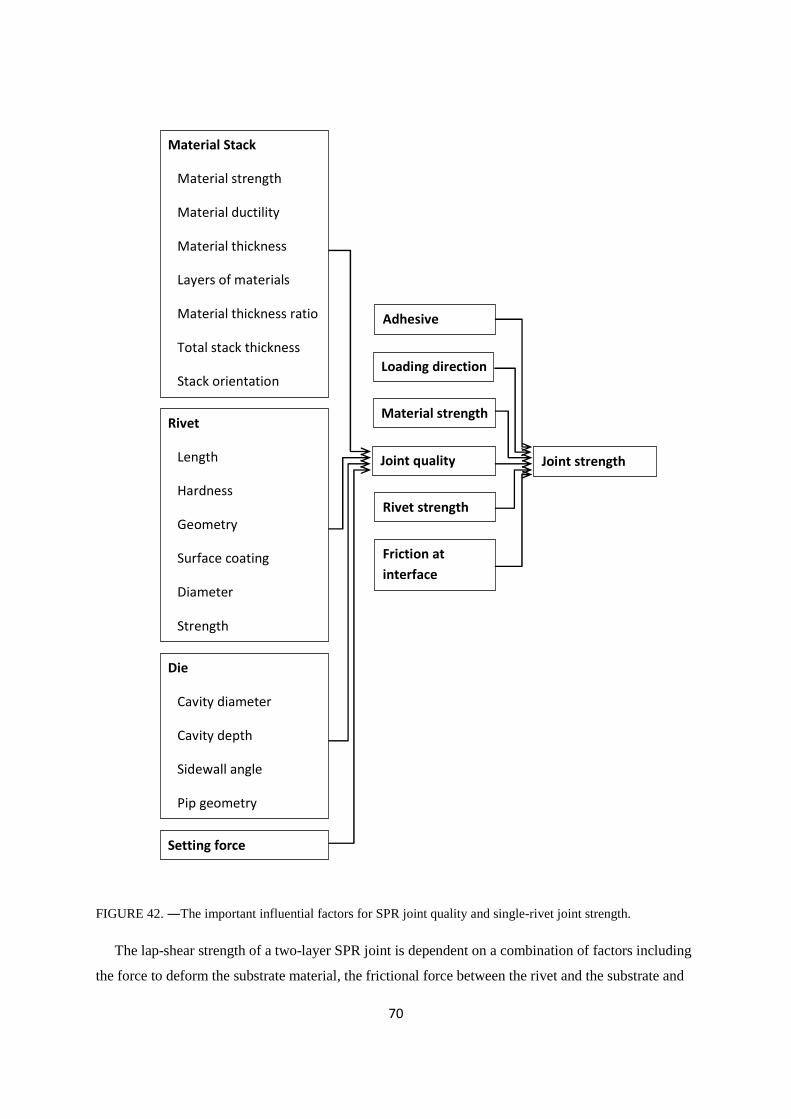
70
FIGURE 42. ―The important influential factors for SPR joint quality and single-rivet joint strength.
The lap-shear strength of a two-layer SPR joint is dependent on a combination of factors including
the force to deform the substrate material, the frictional force between the rivet and the substrate and
Material Stack
Material strength
Material ductility
Material thickness
Layers of materials
Material thickness ratio
Total stack thickness
Stack orientation
Rivet
Length
Hardness
Geometry
Surface coating
Diameter
Strength
Die
Cavity diameter
Cavity depth
Sidewall angle
Pip geometry
Setting force
Joint quality
Material strength
Rivet strength
Friction at
interface
Loading direction
Joint strength
Adhesive
71
the frictional force between the top and bottom sheets particularly around the tip of the punched hole
in the top sheet. The failure mode depends on factors like the material thickness, the rivet material, the
setting force, the loading directions, the interfacial friction and the stack configuration. Failure for
static tests may occur by various modes including tearing of the top sheet, tearing and cleavage of the
top sheet, tearing of the top sheet accompanied with rivet pull-out from the top sheet, the rivet being
simultaneously pulled out from the top and bottom sheets, the rivet being pulled out from the bottom
sheet and/or tearing of the bottom sheet. The fatigue failure of SPR joints differs from that of static
tests. SPR fatigue failure normally occurs at the substrate materials around the joints other than the
joints themselves. Research has also shown that fatigue could reduce the remaining T-peel strength of
SPR joints, but within a certain range it could increase the lap shear stiffness and the remaining lap
shear strength of the joints due to increased friction at the joint interface. T-peel fatigue at high
applied loads could also increase the joint stiffness through plastic deformation and geometric
changes.
Neutron diffraction measurements revealed the presence of large residual stresses in SPR joints as
a result of deformation during the riveting process. Residual stresses influence the SPR joint strength
during application. The local distortion caused by the SPR process, particularly at the top sheet is
much larger than that caused by the RSW process and consideration of the SPR joint distortion is
generally needed for accurate global assembly predictions. The application of electro-coating and
adhesives as well as paints greatly reduce the corrosion rate of SPR joints. However, if the protection
system were to fail, galvanic corrosion and crevice corrosion can take place. Research has shown that
in the early stages, corrosion may increase the joint strength due to the increased friction at the joint
interface. However, corrosion is undesirable as it will eventually lead to failure. Process monitoring
can be used to reveal abnormalities in SPR joints. However, process monitoring and NDT methods
cannot give other information on the joint quality.
The modelling of SPR joint strength and of the joining process is a popular topic and has been the
subject of several publications. For the modelling of the SPR process, the punch, the blank holder and
the die are normally modelled as rigid bodies, while the rivet and the sheet materials are modelled as
deformable bodies. Major challenges for accurate SPR modelling have arisen due to difficulties in
modelling the fracture and friction behaviour. For modelling the SPR joint strength, mapping the
residual stress, the strain and the material damage from 2D process modelling into 3D strength
modelling is important. Various simplified models, such as node-to-node constraints, node-to-surface
and surface-to-surface constraining by contact formulations, discrete elements, beam elements and
brick elements have been used to simulate the mechanical performance of large structures joined by
SPR. In these simplified large-scale simulations, work hardening and residual stress–strain
distribution in the region around the rivet are normally ignored in order to save computer time.
72
15. Future Research
Based on current SPR developments, future research efforts are likely to focus on SPR of new
materials (especially very high strength steel, casting materials and composite), further understanding
of the mechanical performance as well as modelling of the SPR process and behaviour. Further
research is also needed to understand the effect of residual stress from the SPR setting process and of
friction during rivet setting or under various loading conditions. The modelling of SPR due to the
complexity of the process remains the main challenge.
Acknowledgement
The authors would like to thanks the support from TSB and Jaguar Land Rover through High
Value Manufacturing Catapult. The authors would also like to thanks the support from Henrob Ltd for
information and resource. The authors are also very grateful to Dr. Ian Pearson for some important
literatures he provided.
References
1. Hulbert, J.P., Riveting without prepunching, in Machine Design. 1972.2. Anon., Self-piercing rivets attach can handle. Engineering Materials Design, 1975. 19(12): p.
46.3. Gausden, D. and I. Gunn, Self piercing rivets give strong sealed joints, in Design Engineering.
1976. p. 55-57.4. Sunday, S.P., Self-piercing rivets for aluminum components, in SAE World Congress. 1983,
Paper No. 830526.5. Patrick, E.P. and M.L. Sharp, Joining aluminum auto body structure, in SAE World Congress.
1992, Paper No. 920282.6. Edwards, K., Pierce-&-Roll riveting - the alternative to spot-welding. Aluminium Industry,
1992. 11(5): p. 24-26.7. Doo, R., Automotive body construction using self-piercing riveting. Automotive
Manufacturing International, 1993.8. Hill, H., Introduction to the self-pierce riveting process and equipment, in IBEC'94 - Body
Assembly & Manufacturing. 1994. p. 1-9.9. Bokhari, N., Self-piercing riveting - process and equipment. Weld. Met. Fabrication, 1995.
63(5): p. 186-188.10. Moss, S. and M. Mahendran, Structural behaviour of self-piercing riveted connections in steel
framed housing, in 16th International Specialty Conference on Cold-Formed Steel Structures2002: Orlando, Florida, USA. p. 748-761.
11. Moss, S.R. and M. Mahendran, Structural behaviour of self-piercing riveted connections inG300 and G550 thin sheet steels. Advances in Structures, Vols 1 and 2, 2003: p. 275-280.
12. Litherland, H., Self-piercing riveting for aluminium applications in Proceedings of the SeventhInternational Conference INALCO’98. 1998: Cambridge. p. 135-147.
13. EAA, Design with Aluminium, in The aluminium automotive manual. 2011, EuropeanAluminium Association.
73
14. Liu, Y., et al., Single-sided piercing riveting for adhesive bonding in vehicle body assembly.Journal of Manufacturing Systems, 2013. 32(3): p. 498-504.
15. Abe, Y., T. Kato, and K. Mori, Joinability of aluminium alloy and mild steel sheets by selfpiercing rivet. Journal of Materials Processing Technology, 2006. 177(1-3): p. 417-421.
16. Miller, W.S., et al., Recent development in aluminium alloys for the automotive industry.Materials Science and Engineering: A, 2000. 280(1): p. 37-49.
17. Audi. Self-study Programme 383 "Audi TT Coupé ‘07-Body". [cited 2013 November];Available from: http://www.volkspage.net/technik/ssp/ssp/SSP_383.pdf.
18. Mortimer, J., Jaguar uses X350 car to pioneer use of self-piercing rivets. Industrial Robot: AnInternational Journal, 2001. 28(3): p. 192-198.
19. Mortimer, J., Jaguar "Roadmap" rethinks self-piercing technology. Industrial Robot: AnInternational Journal, 2005. 32(3): p. 209-213.
20. Bonde, N. and S. Grange-Jansson, Self-piercing riveting in high-strength steel - A way toincrease fatigue life, in Advanced technologies & processes, IBEC '96. 1996. p. 16-20.
21. Henrob. Automotive. 2013 [cited 2013 November]; Available from:http://www.henrob.com/GB/automotive.php.
22. Weber, A., Assembling Ford’s Aluminum Wonder Truck, in Assembly. 2015.23. Coldwell, D. and P. Briskham, Assembly of the 2015 Ford F150 Using Henrob Self-Piercing
Rivet Technology. 2015: Automotive Circle International Insight Edition @Ford USA 2015.24. He, X., F. Gu, and A. Ball, Recent development in finite element analysis of self-piercing
riveted joints. The International Journal of Advanced Manufacturing Technology, 2012. 58(5-8): p. 643-649.
25. He, X., I. Pearson, and K. Young, Self-pierce riveting for sheet materials: State of the art.Journal of Materials Processing Technology, 2008. 199(1-3): p. 27-36.
26. Sui, B., et al., A Review on the Development of Self-piercing Riveting Technology forLightweight Vehicle Body. Automotive Engineering, 2006. 28(1): p. 85-89.
27. Cacko, R., Review of different material separation criteria in numerical modeling of the self-piercing riveting process – SPR. Archives of Civil and Mechanical Engineering, 2008. 8(2): p.21-30.
28. Self-piercing riveting : Properties, processing and applications ed. A. Chrysanthou and X. Sun.2013: Woodhead Publishing, Cambridge, UK. , Cambridge
29. Kaščák, Ľ. and E. Spišák, Joining materials by self-piercing riveting method. Transfer inovácií,2012. 22: p. 43-46.
30. Mucha, J., The numerical analysis of the effect of the joining process parameters on self-piercing riveting using the solid rivet. Archives of Civil and Mechanical Engineering, 2014.14(3): p. 444-454.
31. Clinch Rivet Tool. 2015 [cited 2015 10/11/2015]; Available from: http://www.tox-us.com/us/products/joining-systems/tox-clinch-procedure/tox-clinchrivet.html.
32. Wang, B., C.Y. Hao, and J.S. Zhang, A new self-piercing riveting process and strengthevaluation. Journal of Manufacturing Science and Engineering-Transactions of the Asme,2006. 128(2): p. 580-587.
33. Duan, H., et al., Rotation friction pressing riveting of AZ31 magnesium alloy sheet. Materials& Design, 2014. 54: p. 414-424.
34. Lou, M., et al., Influence of resistance heating on self-piercing riveted dissimilar joints ofAA6061-T6 and galvanized DP590. Journal of Materials Processing Technology, 2014.214(10): p. 2119-2126.
35. Westgate, S.A., et al., The deveopment of lightweight self-piercing riveting equipment, in SAEWorld Congress. 2001, Paper No. 2001-01-0979.
36. Hou, W., et al., Characterization for Quality Monitoring of a Self-Piercing Riveting, in SheetMetal Welding conference XI. 2004: Sterling Heights, Michigan. p. Paper No. 8-3.
74
37. Budde, L., W. Lappe, and F. Liebrecht, Further developments in the self-piercing rivettechnology. Bleche Rohre Profile, 1992. 39: p. 310–314.
38. Lappe, W. and L. Budde, Possibilities for monitoring and controlling the mechanical processin sheet metal assembly. 1993, Paderborn University.
39. King, R.P., et al., Setting load requirements and fastening strength in the self-pierce rivetingprocess, in Proceedings of the 11th National Conference on Manufacturing Research. 1995:Leicester, UK. p. 57-61.
40. Atzeni, E., R. Ippolito, and L. Settineri, Experimental and numerical appraisal of self-piercingriveting. CIRP Annals - Manufacturing Technology, 2009. 58(1): p. 17-20.
41. Haque, R., J.H. Beynon, and Y. Durandet, Characterisation of force-displacement curve in self-pierce riveting. Science and Technology of Welding and Joining, 2012. 17(6): p. 476-488.
42. Xu, Y., Effects of factors on physical attributes of self-piercing riveted joints. Science andTechnology of Welding and Joining, 2006. 11(6): p. 666-671.
43. Hoang, N.H., et al., Self-piercing riveting connections using aluminium rivets. InternationalJournal of Solids and Structures, 2010. 47(3-4): p. 427-439.
44. Hoang, N.H., et al., Failure of aluminium self-piercing rivets: An experimental and numericalstudy. Materials & Design, 2013. 49(0): p. 323-335.
45. Hoang, N.H., et al., The effect of the riveting process and aging on the mechanical behaviourof an aluminium self-piercing riveted connection. European Journal of Mechanics - A/Solids,2011. 30(5): p. 619-630.
46. EAA, Mechanical Joining, in The aluminium automotive manual. 2002, European AluminiumAssociation.
47. Henrob. Rivet types. 2013 [cited 2013 November]; Available from:http://www.henrob.com/GB/rivet-types.php.
48. Xu, Y., A close look at self-piercing riveting-Computer simulation is a noteworthy alternativeto physical testing of joints, in The Fabricator. 2006.
49. Presz, W. and R. Cacko, Analysis of the influence of a rivet yield stress distribution on themicro-SPR joint – initial approach. Archives of Civil and Mechanical Engineering, 2010. 10(4):p. 69-75.
50. Li, D., et al., An Evaluation of Quality and Performance of Self-Piercing Riveted High StrengthAluminium Alloy AA6008 for Automotive Applications, in SAE World Congress. 2010, PaperNo. 2010-01-0223.
51. Iguchi, H. and Y. Ohmi, Joining Technologies for Aluminum Body-Improvement of Self-piercing Riveting, in SAE Technical Paper 2003-01-2788. 2003, SAE International.
52. Mori, K., et al., Plastic Joining of Ultra High Strength Steel and Aluminium Alloy Sheets by SelfPiercing Rivet. CIRP Annals - Manufacturing Technology, 2006. 55(1): p. 283-286.
53. Li, D., et al. The effect of setting velocity on the static and fatigue strengths of self-piercingriveted joints for automotive applications. in TMS Annual Conference. 2014.
54. Han, L., et al., Effect of Setting Velocity on Self-Piercing Riveting Process and Joint Behaviourfor Automotive Applications, in SAE World Congress. 2010, SAE Technical Paper 2010-01-0966.
55. Hahn, O. and M. Horstmann, Mechanical joining of magnesium components by means ofinductive heating - Realization and capability. Materials Science Forum, 2007. 539-543: p.1638-1643.
56. Durandet, Y., et al., Laser assisted self-pierce riveting of AZ31 magnesium alloy strips.Materials & Design, 2010. 31, Supplement 1(0): p. S13-S16.
57. Sjöström, E., Self piercing riveting and adhesive bonding of cast magnesium to ultra highstrength sheet steel. 2006, Kimab, Report No.: IM-2006-501.
58. Luo, A., T. Lee, and J. Carter, Self-Pierce Riveting of Magnesium to Aluminum Alloys. SAE Int.J. Mater. Manuf., 2011. 4(1): p. 158-165.
75
59. Wang, J.W., et al., Self-Piercing Riveting of Wrought Magnesium AZ31 Sheets. Journal ofManufacturing Science and Engineering-Transactions of the Asme, 2011. 133(3): p. 0310091-0310099.
60. Miyashita, Y., et al., Strength of adhesive aided SPR joint for AM50 magnesium alloy sheets.Procedia Engineering, 2011. 10(0): p. 2532-2537.
61. He, X., et al., Self-piercing riveting of similar and dissimilar metal sheets of aluminum alloyand copper alloy. Materials & Design, 2015. 65(0): p. 923-933.
62. Xing, B., et al., Study of mechanical properties for copper alloy H62 sheets joined by self-piercing riveting and clinching. Journal of Materials Processing Technology, 2015. 216(0): p.28-36.
63. Pickin, C.G., K. Young, and I. Tuersley, Joining of lightweight sandwich sheets to aluminiumusing self-pierce riveting. Materials & Design, 2007. 28(8): p. 2361-2365.
64. Fratini, L. and V. Ruisi, Self-piercing riveting for aluminium alloys-composites hybrid joints.The International Journal of Advanced Manufacturing Technology, 2009. 43(1-2): p. 61-66.
65. Di Franco, G., et al., On the self-piercing riveting of aluminium blanks and carbon fibrecomposite panels. International Journal of Material Forming, 2010. 3(1): p. 1035-1038.
66. Settineri, L., E. Atzeni, and R. Ippolito, Self piercing riveting for metal-polymer joints.International Journal of Material Forming, 2010. 3: p. 995-998.
67. Di Franco, G., L. Fratini, and A. Pasta, Analysis of the mechanical performance of hybrid(SPR/bonded) single-lap joints between CFRP panels and aluminum blanks. InternationalJournal of Adhesion and Adhesives, 2013. 41(0): p. 24-32.
68. Fiore, V., et al., On the mechanical behavior of BFRP to aluminum AA6086 mixed joints.Composites Part B: Engineering, 2013. 48(0): p. 79-87.
69. Di Franco, G., L. Fratini, and A. Pasta, Fatigue behaviour of self-piercing riveting of aluminiumblanks and carbon fibre composite panels. Proceedings of the Institution of MechanicalEngineers, Part L: Journal of Materials Design and Applications, 2012. 226(3): p. 230-241.
70. Di Franco, G., et al., On the self-piercing riveting of aluminium blanks and carbon fibrecomposite panels. International Journal of Material Forming, 2013. 6(1): p. 137-144.
71. Anon., Self-piercing rivets overcome 'impossible' joining problems, in Eureka transferstechnology. 1990. p. 15.
72. Ueda, M., et al., Instantaneous mechanical fastening of quasi-isotropic CFRP laminates by aself-piercing rivet. Composite Structures, 2012. 94(11): p. 3388-3393.
73. Han, L. and A. Chrysanthou, Evaluation of quality and behaviour of self-piercing rivetedaluminium to high strength low alloy sheets with different surface coatings. Materials &Design, 2008. 29(2): p. 458-468.
74. Han, L., et al., Effect of sheet material coatings on quality and strength of self-piercingriveted joints, in SAE World Congress. 2006, Paper No. 2006-01-0775.
75. Li, D., et al., Influence of edge distance on quality and static behaviour of self-piercing rivetedaluminium joints. Materials & Design, 2012. 34: p. 22-31.
76. Li, D., et al., The influence of fatigue on the stiffness and remaining static strength of self-piercing riveted aluminium joints. Materials & Design, 2014. 54(0): p. 301-314.
77. Han, L., et al., Self-pierce riveting – A new way for joining structures, in Structures PressureVessels and Piping Conference, PVP2002-1495. 2002. p. 123-127.
78. Madasamy, C., et al., Static and impact behaviour of self-pierced rivet connections inaluminium, in The ASME International Mechanical Engineering Congress and Exposition2001: New York. p. 73–79.
79. Madasamy, C., et al., Experimental study on the crash performance of aluminium and steelrails, in The ASME International Mechanical Engineering Congress and Exposition 2002: NewOrleans. p. 223-231.
76
80. Taylor, G., Self-piercing riveting in automotive assembly, in The 30th InternationalSymposium on Automotive Technology and Automotation (ISATA). 1997: Florence, Italy. p.229-240.
81. Porcaro, R., et al., The behaviour of a self-piercing riveted connection under quasi-staticloading conditions. International Journal of Solids and Structures, 2006. 43(17): p. 5110-5131.
82. Li, B. and A. Fatemi, An experimental investigation of deformation and fatigue behavior ofcoach peel riveted joints. International Journal of Fatigue, 2006. 28(1): p. 9-18.
83. Khanna, S.K., et al., Fatigue properties and failure characterisation of self-piercing riveted6111 aluminium sheet joints. Science and Technology of Welding & Joining, 2006. 11(5): p.544-549.
84. Han, L., et al., The effect of pre-straining on the mechanical behaviour of self-piercing rivetedaluminium alloy sheets. Materials & Design, 2006. 27(10): p. 1108-1113.
85. Sun, X., 9 - Optimization of the strength of self-piercing rivets (SPRs), in Self-Piercing Riveting,A. Chrysanthou and X. Sun, Editors. 2014, Woodhead Publishing. p. 149-170.
86. Stephens, E.V., 2 - Mechanical strength of self-piercing riveting (SPR), in Self-PiercingRiveting, A. Chrysanthou and X. Sun, Editors. 2014, Woodhead Publishing. p. 11-32.
87. Li, D., et al., Influence of Die Profiles and Cracks on Joint Buttons on the Joint Quality andMechanical Strengths of High Strength Aluminium Alloy Joint. Advanced Materials Research,2012. 58: p. 398-405.
88. Han, L., et al., The effect of breakthrough on the behaviour of self-piercing riveted aluminium5754 - HSLA joints. Transactions of Society of Automotive Engineers of Japan, 2005. 36(5): p.181-186.
89. Fu, M. and P.K. Mallick, Fatigue of self-piercing riveted joints in aluminum alloy 6111.International Journal of Fatigue, 2003. 25(3): p. 183-189.
90. Blacket, S., The self pierce riveting process comes of age, in Proceedings of the Materials inWelding and Joining Conference. 1995, Institute of Metals and Materials Australasia. p. 149-154.
91. Riches, S.T., et al., Advanced joining technologies for lightweight vehicle manufacture, inProceedings of the Materials for Lean Weight Vehicles Conference. 1995, Institute ofMaterials. p. 137-146.
92. Krause, A.R. and A.R.A. Chernenkoff, A comparative study of the fatigue behaviour of spotwelded and mechanically fastened aluminium joints, in SAE World Congress. 1995, Paper No.950710.
93. Mizukoshi, H. and H. Okada, Fatigue properties of mechanical fastening joints. MaterialsScience Forum, 1997. 242: p. 231-238.
94. Briskham, P., et al., Comparison of Self-Pierce Riveting, Resistance Spot Welding and SpotFriction Joining for Aluminium Automotive Sheet, in SAE Technical Paper 2006-01-0774.2006, SAE International.
95. Han, L., M. Thornton, and M. Shergold, A comparison of the mechanical behaviour of self-piercing riveted and resistance spot welded aluminium sheets for the automotive industry.Materials & Design, 2010. 31(3): p. 1457-1467.
96. Booth, G.S., et al., Self-piercing riveted joints and resistance spot welded joints in steel andaluminium, in SAE World Congress. 2000, Paper No. 2000-01-2681.
97. Galtier, A. and J.-N. Gacel, Fatigue Behavior of Mechanical Joining for HSS Grades, in SAETechnical Paper 2002-01-1998. 2002, SAE International.
98. Westgate, S., The resistance spot welding of high and ultra-high strength steels, in the 3rdInternational Seminar on Advances in Resistance Welding. 2004: Berlin.
77
99. Dannbauer, H., et al., Development of a model for the stiffness and life time prediction of selfpiercing riveted joints in automotive components. Materialprufung, 2006. 48(11-12): p. 576-581.
100. Svensson, L.-E. and J.K. Larsson, Welding and Joining of High-Performance Car Bodies, inTrends in Welding Research: Proceedings of the 6th International Conference. 2002, ASMInternational. p. 787-792.
101. Westgate, S.A. and M.C. Whittaker, Press joining and self piercing riveting for sheet joining-joint formation and mechanical properties. 1994, TWI Report 492/1994.
102. Razmjoo, G.R. and S.A. Westgate, Fatigue properties of clinched, self piercing riveted andspot welded joints in steel and aluminium alloy sheet. 1999, TWI Report 680/1999.
103. Mori, K., Y. Abe, and T. Kato, Mechanism of superiority of fatigue strength for aluminiumalloy sheets joined by mechanical clinching and self-pierce riveting. Journal of MaterialsProcessing Technology, 2012. 212(9): p. 1900-1905.
104. Blundell, N., et al., A Comparative Study between Self Pierce Riveting and Spot FrictionJoining, in JSAE Annual Congress 2005: Japan, paper No.: 20055417.
105. Han, L., A. Chrysanthou, and J.M. O'Sullivan, Fretting behaviour of self-piercing rivetedaluminium alloy joints under different interfacial conditions. Materials & Design, 2006. 27(3):p. 200-208.
106. Li, D., et al., Influence of rivet to sheet edge distance on fatigue strength of self-piercingriveted aluminium joints. Materials Science and Engineering: A, 2012. 558(0): p. 242-252.
107. Iyer, K., et al., Fatigue of single- and double-rivet self-piercing riveted lap joints. Fatigue &Fracture of Engineering Materials & Structures, 2005. 28(11): p. 997-1007.
108. Li, D., et al., Influence of Rivet Tip Geometry on the Joint Quality and Mechanical Strengths ofSelf-Piercing Riveted Aluminium Joints. Materials Science Forum, 2013. 765: p. 746-750.
109. Han, L., A. Chrysanthou, and K.W. Young, Mechanical behaviour of self-piercing riveted multi-layer joints under different specimen configurations. Materials & Design, 2007. 28(7): p.2024-2033.
110. Sun, X., E.V. Stephens, and M.A. Khaleel, Fatigue behaviors of self-piercing rivets joiningsimilar and dissimilar sheet metals. International Journal of Fatigue, 2007. 29(2): p. 370-386.
111. Agrawal, H., et al., Fatigue Life of Self Pierced Rivets (SPR) in Car Body, in SAE Technical Paper2003-01-0914. 2003, SAE International.
112. Jin, Z. and P.K. Mallick, Enhancement of fatigue life of self-piercing riveted joints by coining,in The ASME International Mechanical Engineering Congress and Exposition 2002: NewOrleans. p. 417-430.
113. Eckstein, J., et al., Experimental and numerical investigations to extend the process limits inself-pierce riveting, in 10th ESAFORM conference on Material Froming, E. Cueto and F.Chinesta, Editors. 2007. p. 279-284.
114. Huang, L., et al., Fatigue and fretting of mixed metal Self-Piercing riveted joint. InternationalJournal of Fatigue.
115. Han, L., et al., Characterization of fretting fatigue in self-piercing riveted aluminium alloysheets. Fatigue & Fracture of Engineering Materials & Structures, 2006. 29(8): p. 646-654.
116. Chen, Y.K., et al., Fretting wear in self-piercing riveted aluminium alloy sheet. Wear, 2003.255(7-12): p. 1463-1470.
117. Iyer, K., et al., Fatigue and fretting of self-piercing riveted joints, in Proceedings of IMECE.2002, ASME: New Orleans, Louisiana. p. 401-415.
118. Sun, X., E. Vela, and M.A. Khaleel, Analytical strength estimator for self-piercing rivets. 2002,Battelle Pacific Northwest National Laboratory, PNNL technical report.
119. Sun, X. and M.A. Khaleel, Strength estimation of self-piercing rivets using lower bound limitload analysis. Science and Technology of Welding and Joining, 2005. 10(5): p. 624-635.
78
120. Sun, X. and M.A. Khaleel, Performance Optimization of Self-Piercing Rivets ThroughAnalytical Rivet Strength Estimation. Journal of Manufacturing Processes, 2005. 7(1): p. 83-93.
121. Lee, M.-H., H.-Y. Kim, and S.-I. Oh, Crushing test of double hat-shaped members of dissimilarmaterials with adhesively bonded and self-piercing riveted joining methods. Thin-WalledStructures, 2006. 44(4): p. 381-386.
122. Sun, X. and M.A. Khaleel, Dynamic strength evaluations for self-piercing rivets and resistancespot welds joining similar and dissimilar metals. International Journal of Impact Engineering,2007. 34(10): p. 1668-1682.
123. Porcaro, R., et al., Joining of aluminium using self-piercing riveting: Testing, modelling andanalysis. International Journal of Crashworthiness, 2004. 9(2): p. 141-154.
124. Porcaro, R., et al., Crashworthiness of self-piercing riveted connections. International Journalof Impact Engineering, 2008. 35(11): p. 1251-1266.
125. Wood, P.K.C., et al., A model to describe the high rate performance of self-piercing rivetedjoints in sheet aluminium. Materials & Design, 2011. 32(4): p. 2246-2259.
126. Westerberg, C., Finite element simulation of crash testing of selfpiercing rivet joints, peelspecimen, in Structural Mechanics. 2002, LUND University: LTH.
127. Hutchings, M.T., et al., Introduction to the characetrization of residual stress by neutrondiffraction. 2005, Boca Raton, FL: Taylor & Francis.
128. Withers, P.J., et al., Recent advances in residual stress measurement. International Journal ofPressure Vessles and piping, 2008. 85(3): p. 118-127.
129. Haque, R., et al., Feasibility of measuring residual stress profile in different self-pierce rivetedjoints Science and Technology of Welding & Joining, 2012. 17(1): p. 60-68.
130. Khezri, R. and A. Melander, New technology for self piercing riveting of TRIP800 in 1+1 and1+2 mm sheet thickness. 2006, Swedish Institute for Metal Research: Stockholm, Sweden.
131. Khezri, R. and A. Melander, Simulation of self piercing riveting of TRIP800 sheet steel in 1+1mm thickness. 2003, Swedish Institute for Metals Research: Stockholm, Sweden.
132. Haque, R., et al., Optimising parameters for meaningful measurement of residual strain byneutron diffraction in self-pierce riveted joints. Science and Technology of Welding andJoining, 2013. 18(6): p. 492-499.
133. Weber, A., A new look at an old technology, in Assembly. 2004.134. Hahn, O. and T.-M. Wibbeke, Application of low-heat hybrid joining technologies for the
joining of thin-walled sheet materials. Welding & Cutting, 2005. 4(4): p. 208-214.135. Hahn, O., G. Meschut, and A. Peetz, Mechanical properties of punch-riveted and adhesive-
bonded aluminium sheets. Welding & Cutting, 1999. 51(7): p. E130-E134.136. Moroni, F., A. Pirondi, and F. Kleiner, Experimental analysis and comparison of the strength
of simple and hybrid structural joints. International Journal of Adhesion and Adhesives, 2010.30(5): p. 367-379.
137. Westgate, S.A. and G.R. Razmjoo, Static and fatigue performance of mechanically fastenedand hybrid joints in steel metals. 1999, TWI Report 691/1999.
138. Cai, W., P.C. Wang, and W. Yang, Assembly dimensional prediction for self-piercing rivetedaluminum panels. International Journal of Machine Tools and Manufacture, 2005. 45(6): p.695-704.
139. Huang, H., et al., Distortion analysis for self-piercing riveting of aluminium alloy sheets.Science and Technology of Welding and Joining, 2007. 12(1): p. 73-78.
140. Fan, X. and I. Masters, Dimensional Variation in Self-Piercing Riveting, in SAE Technical Paper2006-01-0776. 2006, SAE International.
141. Masters, I., et al., Modelling distortion induced in an assembly by the self piercing rivetprocess. Proceedings of the Institution of Mechanical Engineers Part B-Journal of EngineeringManufacture, 2012. 226(B2): p. 300-312.
79
142. Calabrese, L., et al., Durability on alternate immersion test of self-piercing riveting aluminiumjoint. Materials & Design, 2013. 46(0): p. 849-856.
143. Howard, R.M. and S.P. Sunday, The corrosion performance of steel self-piercing rivets whenused with aluminum components, in SAE World Congress. 1983, Paper No. 831816.
144. Ioannou, J., Mechanical behaviour and corrosion of interstitial-free steel to aluminium alloyself-piercing riveted joints, PhD thesis, in School of Engineering and Technology. 2009,University of Hertfordshire, UK.
145. Calabrese, L., et al., Failure behaviour of SPR joints after salt spray test. EngineeringStructures, 2015. 82(0): p. 33-43.
146. King, R.P., Analysis and quality monitoring self-pierce riveting process, in PhD thesis. 1997,University of Hertfordshire.
147. Han, L., et al., An evaluation of NDT for self-pierce riveting, in SAE World Congress. 2007,Paper No. 2007-01-1364.
148. Stepinski, T. Assessing Quality of Self-piercing Rivets Using Ultrasound. in EuropeanConference on Non-Destructive Testing. 2006. Berlin, Germany.
149. Casalino, G., A. Rotondo, and A. Ludovico, On the numerical modelling of the multiphysicsself piercing riveting process based on the finite element technique. Advances in EngineeringSoftware, 2008. 39(9): p. 787-795.
150. Khezri, R., E. Sjöström, and A. Melander, Self-piercing riveting of high strength steel. 2000,Swedish Institute for Metal Research: Report No.: IM-2000-554.
151. Porcaro, R., et al., Self-piercing riveting process: An experimental and numericalinvestigation. Journal of Materials Processing Technology, 2006. 171(1): p. 10-20.
152. Mucha, J., A Study of Quality Parameters and Behaviour of Self-Piercing Riveted AluminiumSheets with Different Joining Conditions. Strojniski Vestnik-Journal of MechanicalEngineering, 2011. 57(4): p. 323-333.
153. Kato, T., Y. Abe, and K. Mori, Finite element simulation of self-piercing riveting of threealuminium alloy sheets. Key Engineering Materials, 2007. 340-341: p. 1461-1466.
154. Abe, Y., T. Kato, and K. Mori, Self-piercing riveting of high tensile strength steel andaluminium alloy sheets using conventional rivet and die. Journal of Materials ProcessingTechnology, 2009. 209(8): p. 3914-3922.
155. Krishnappa, U.S., Numerical Investigation of self-piercing riveted dual layer joint, inDepartment of Mechanical Engineering, . 2004, Master thesis, Wichita State University,India.
156. Atzeni, E., R. Ippolito, and L. Settineri, FEM modeling of self-piercing riveted joint. KeyEngineering Materials, 2007. 344: p. 655-662.
157. Bouchard, P.O., T. Laurent, and L. Tollier, Numerical modeling of self-pierce riveting--Fromriveting process modeling down to structural analysis. Journal of Materials ProcessingTechnology, 2008. 202(1-3): p. 290-300.
158. Porcaro, R., et al., An experimental investigation on the behaviour of self-piercing rivetedconnections in aluminium alloy AA6060. International Journal of Crashworthiness, 2006.11(5): p. 397-417.
159. Hanssen, A.G., et al., A large-scale finite element point-connector model for self-piercing rivetconnections. European Journal of Mechanics - A/Solids, 2010. 29(4): p. 484-495.
160. Sommer, S. and J. Maier, Failure modelling of a self piercing riveted joint using LS-Dyna, in8th European LS-DYNA Conference. 2011: Strasbourg, France.
161. Tang, D.X., B. Barthelemy, and H. Yuan, Self-pierced rivet (SPR) modelling in aluminiumstructure crash analysis, in The ASME International Mechanical Engineering Congress andExposition 2002: New Orleans. p. 207-222.
80
List of Figures
FIGURE 1. ―A SPR system for laboratory use.
FIGURE 2. ―A schematic diagram of the four stages of a SPR process.
FIGURE 3. ―A typical four-stage force-displacement curve of a SPR process [36].
FIGURE 4. ―Typical SPR rivets with countersunk head and a cross-section.
FIGURE 5. ―Comparison of the single-joint strength between aluminium rivets and a steel rivet with combined
shearing and pull-out loading with loading angle α = 45o [43].
FIGURE 6. ―Typical dies for SPR and a cross-section.
FIGURE 7. ―SPR joint quality and some faults.
FIGURE 8. ―Possible joint defects for joining an ultra-high strength steel to an aluminium alloy by SPR [52].
FIGURE 9. ―The cross-section of a SPR joint with extruded AA6063 and die-cast magnesium AM50 [58].
FIGURE 10. ―The cross-section of a SPR joint with 2 mm glass fibre composite and 2 mm AA6082 T6
(modified from [64]).
FIGURE 11. ―Representative experimental lap shear force-displacement curves for the U-shaped specimens
with different material strength, sheet thickness and stack thickness (modified from [81]).
FIGURE 12. ―Influence of the amount of pre-straining on the static and fatigue lap shear strength of the single
rivet SPR joints [84].
FIGURE 13. ―The cross-sections of SPR joints with different stack orientations but the same rivet and die, a) 2
mm AA5182 O+1 mm HSLA 350, and b) 1 mm HSLA 350+2 mm AA5182 O (modified from [85]).
FIGURE 14. ―The displacement-load curves of the joints with different stack orientations [85].
FIGURE 15. ―The cross-sections and button images of the SPR joints (3.0AA5754+2.5AA6008 T61 215 MPa)
with, a) b) the deep and sharp corner die and c) d) the shallow and tilted sidewall die (modified from [87]).
FIGURE 16. ―The strength and joint features of joints produced with different setting velocities, a, lap shear
strength and interlock, b, T-peel strength and rivet head height [53].
FIGURE 17. ―Comparison of the static shear strength of SPR and spot welded aluminium alloy joints
(Regenerated from [7]).
FIGURE 18. ―Comparison of the static peel strength of SPR and spot welded aluminium alloy joints
(Regenerated from [7]).
81
FIGURE 19. ―Representative experimental force-displacement curves for the U-shaped specimens with
different loading angles (modified from [81]).
FIGURE 20. ―Influence of edge distance on the lap-shear strength for specimens with coupon width of 48 mm
[75].
FIGURE 21. ―Influence of edge distance on the T-peel strength for specimens with coupon width of 48 mm
[75].
FIGURE 22. ―The lap shear fatigue S-N curves for the specimens with different edge distances [106].
FIGURE 23. ―The T-peel fatigue S-N curves for the specimens with different edge distances [106].
FIGURE 24. ―The cross sections of the SPR joints with different rivets, a) hardness level 1 blunt rivet, b)
hardness level 1 sharp rivet, c) ) hardness level 2 blunt rivet, and d) hardness level 2 sharp rivet [108].
FIGURE 25. ―An illustration of different stack configurations for lap shear tests [109].
FIGURE 26. ―An illustration of different stack configurations for T-peel tests [109].
FIGURE 27. ―The remaining static lap shear strength of the specimens after the fatigue for different cycles
with maximum load of 3.5 kN [76].
FIGURE 28. ―The remaining static T-peel strength of the specimens after the fatigue for different cycles with
maximum load of 1.8 kN [76].
FIGURE 29. ―Three possible riveting orientation combinations with double-rivet joints when the upper and
lower sheets are identical [107].
FIGURE 30. ―The failure modes of SPR joints in static lap shear tests, a) tearing of top sheet (1 mm
AA5754+2 mm AA5754), b) tearing and cleavage of top sheet (1.5 mm AA5754+3 mm AA5754), c) rivet being
simultaneously pulled out from top and bottom sheets (2 mm AA5754+2 mm AA5754), d) rivet being pulled
out from bottom sheet (3 mm AA5754+2 mm AA5754), e) tearing of bottom sheet (2 mm AA5754+1 mm
AA5754) and f) rivet being pulled out from bottom sheet and fracture of rivet head (1.4 mm boron steel+2.5 mm
AA5754).
FIGURE 31. ―A fracture in the rivet in a joint with an aluminium alloy rivet after the pure shear test [43].
FIGURE 32. ―The two crack initiation locations of lap shear specimens during a fatigue (Fig.32b was cross
sectioned along one of the dash line in the insertion before the specimen failed) (modified from [106]).
FIGURE 33. ―The three crack initiation locations for a 2 mm AA5754+2 mm AA5754 stack during a T-peel
fatigue [106].
82
FIGURE 34. ―The SEM images of the fracture interface of a lap shear specimen with edge distance as 11.5
mm after the fatigue, a) crack initiation, b) and c) crack development and d) sudden break fracture interface
[106].
FIGURE 35. ―The SEM images of the fracture interface of a T-peel specimen with edge distance as 11.5 mm,
a) a fracture interface in the middle of the thickness, b) a fracture interface at the tension/compression boundary,
c) secondary cracks at the tension/compression boundary and d) sudden break fracture interface (modified from
[106]).
FIGURE 36. ―The static T-peel fracture interfaces of the specimens after the fatigue for certain cycles, a, b and
c are from the same joint after the fatigue with maximum load of 0.7 kN; d is from a specimen after the fatigue
with maximum load of 1.8 kN. The marked areas were ductile failure areas by the static test [76].
FIGURE 37. ―The polarisation curves for the rivet and the aluminium alloy sheet in a 3.5% NaCl solution
[142].
FIGURE 38. ―The equivalent plastic strain field in the aluminium alloy rivet with different values of the
friction coefficient [44]. (The dashed red lines represent the potential directions of shear fracture.)
FIGURE 39. ―Comparison of the four important stages of a SPR process between simulation and experiments
[157].
FIGURE 40. ―The four steps of the SPR process simulation with the mesh refinement and the higher effective
plastic strain at failure (ep = 1.5) [149].
FIGURE 41. ―The geometry of the numerical half model: a) riveting process simulation, b) internal part of the
U-specimen, c) external part of the U-specimen, d) combined U-specimen [158].
FIGURE 42. ―The important influential factors for SPR joint quality and single-rivet joint strength.
List of Tables
Table 1. ―Typical mechanical properties of the aluminium and magnesium alloys (Luo et al., 2011).


![A New Self-Piercing Riveting Chuanyong Hao Process …hozhang/Publications_files/GalleyProof.pdf · PROOF COPY [MANU-04-1276] 001602MAE PROOF COPY [MANU-04-1276] 001602MAE Bin Wang](https://img.pdfslide.us/doc/110x75/5ba4204209d3f2205e8cb008/a-new-self-piercing-riveting-chuanyong-hao-process-hozhangpublicationsfilesgalleyproofpdf.jpg)