Embed Size (px)
Citation preview
Paper ID #15617
Self-paced, Problem-solving Approach to Teaching Finite Element Analysisin Strength of Materials
Dr. Anne Raich, Lafayette College
Prof. Raich is an Associate Professor of Civil and Environmental Engineering at Lafayette College. Herteaching interests are in structural mechanics and analysis, structural design, and computational methodsand applications. Prof. Raich received her Ph.D. from the University of Illinois and previously worked asan assistant professor at Texas A&M University and as a structural engineering consultant.
c©American Society for Engineering Education, 2016
Self-Paced, Problem Solving Approach to Teaching Finite
Element Analysis in Strength of Materials
Introduction
The finite element (FE) method is used widely by both civil and mechanical design
professionals. Therefore, providing opportunities for students to gain an understanding of FE
theory and to gain practice modeling and analyzing engineering problems using professional FE
analysis software is critical even for undergraduates. The content of a traditional Strength of
Materials course was revised to provide students with a basic FE skill set, as well as to improve
their understanding of how to use FE analysis as part of a design process. This change was
motivated by the need to streamline the sequence of upper-level design courses, while still
providing students with the opportunity to learn the FE modeling and analysis skills needed to be
successful in subsequent courses and in design project work. The change also increased the
exposure students have to computational engineering tools, which is a stated desire of ABET and
our departmental external advisory boards.
This project studied the effectiveness of the approach taken to integrate FE modeling and
analysis content into four sections of Strength of Materials. The sections had student
enrollments of 20, 22, 30 and 18 and were taught by two different faculty members. The added
content was constructed with the following objectives: a) improve the student’s understanding of
specific stress, strain and deformation topics covered in the course by integrating experiences
using a FE analysis program, b) provide students with a basic understanding of FE theory, c)
provide students with the skill set needed to model and analyze combined load problems using a
FE analysis program; and d) provide students with an understanding of how element type, mesh
size, support conditions, and other modeling decisions may impact FE analysis results.
Previous studies have sought to incorporate FE modeling and analysis content as early as the
freshman year into the engineering curriculum. However, implementing these approaches in
Strength of Materials courses often requires students to spend considerable time learning FE
theory before being able to use commercial FEA programs. A few studies have stressed the
benefit of students learning how to work directly with FEA programs to model and analyze
familiar mechanical systems without needing to first drag them through the FE theory.1,2 The
primary focus of the study presented is to help students gain appreciable FE modeling and
analysis skills. A secondary focus is placed on gaining a basic understanding of FE theory,
especially related to potential modeling issues due to the use of different element types and mesh
sizes and the presence of stress concentrations. The ability to successfully focus on modeling
and analysis with novice students is strongly supported by the easy-to-use graphical user
interfaces provided by the geometry and mechanical workspaces in ANSYS Workbench 15.0.3
In fall 2015, significant in-class and out-of-class course material was added to all four sections of
the course. The added FE content consisted of eight hours of in-class recitation time and thirty-
two hours of out-of-class self-paced instruction time. The out-of-class, self-paced instruction
time was organized using stand-alone tutorials that presented specific topics in a visual format.
Each recitation was run as a problem solving session in which students worked individually to
complete ANSYS-based homework problems. In all the tutorials and homework, students were
required to compare hand calculations with ANSYS results in order to reinforce concepts
covered in class lectures and to help verify model accuracy. In addition, students were required
to complete a combined load design project, which involved designing an eccentrically-loaded
bar system to meet specific stress limits using both ANSYS© WorkbenchTM 15.03 and separate
hand calculations. It should be noted that all material covered in the tutorials and corresponding
recitations was material added to the Strength of Materials course. No course material was
removed or reduced in breadth or depth from the in-class course sessions in this implementation.
Implementation
Students receive one course credit, which is equivalent to four credit hours, for Strength of
Materials in our curriculum. Students typically take this course in the fall semester of the
sophomore year. In previous semesters, the course was taught with three in-class contact hours
and an informal fourth hour that required up 14 hours of student work outside of class, often in
the form of additional homework or projects. In fall 2015, the fourth hour was officially
scheduled as a once-a-week, in-class recitation period. During the first six weeks of the
semester, the recitation time was used to help students build problem solving skills by asking
students to apply concepts learned in class to more complex problems. No homework was
assigned during these first six recitation sessions.
For the remaining eight weeks of the semester, recitation sessions were sequenced to specifically
help students learn how to use the finite element analysis (FEA) program ANSYS©
WorkbenchTM 15.03. The scope of material covered over these eight weeks was defined to
ensure that students would be able to model and analyze elements subjected to axial, shear,
bending, and combined loads. Each week the students were required to:
1) Prepare for each ANSYS recitation session by completing an assigned ANSYS tutorial
before attending the corresponding ANSYS recitation session. No grade was assigned for
completing the assigned ANSYS tutorials.
2) Work during the recitation session either on completing the assigned ANSYS tutorial due to
errors or other issues occurring during their outside-of-class prep work or on completing the
assigned ANSYS homework problems.
3) Complete the assigned ANSYS homework before the start of the next recitation session.
Each self-paced ANSYS tutorial focused on a specific topic. These topics are summarized in
Table 1. The sequence of the tutorials was constructed to build the knowledge and skills
required to successfully model and analyze an eccentrically-loaded bar system to meet specific
stress limits in ANSYS Workbench 15.03. This requirement was added by extending an existing
semester Combined Stress Project to now include ANSYS modeling and analysis student work.
The Combined Stress Project details were presented in Tutorial 6. Homework 6 was assigned
after completing Tutorial 6, but the final project report was not due until the end of the semester.
Therefore in the following discussion, information about Tutorials 1, 2, 3, 4, 5, and 7 are
presented first. Then, information related to Tutorial 6 is covered in a separate section that
provides details concerning the Combined Stress Project requirements.
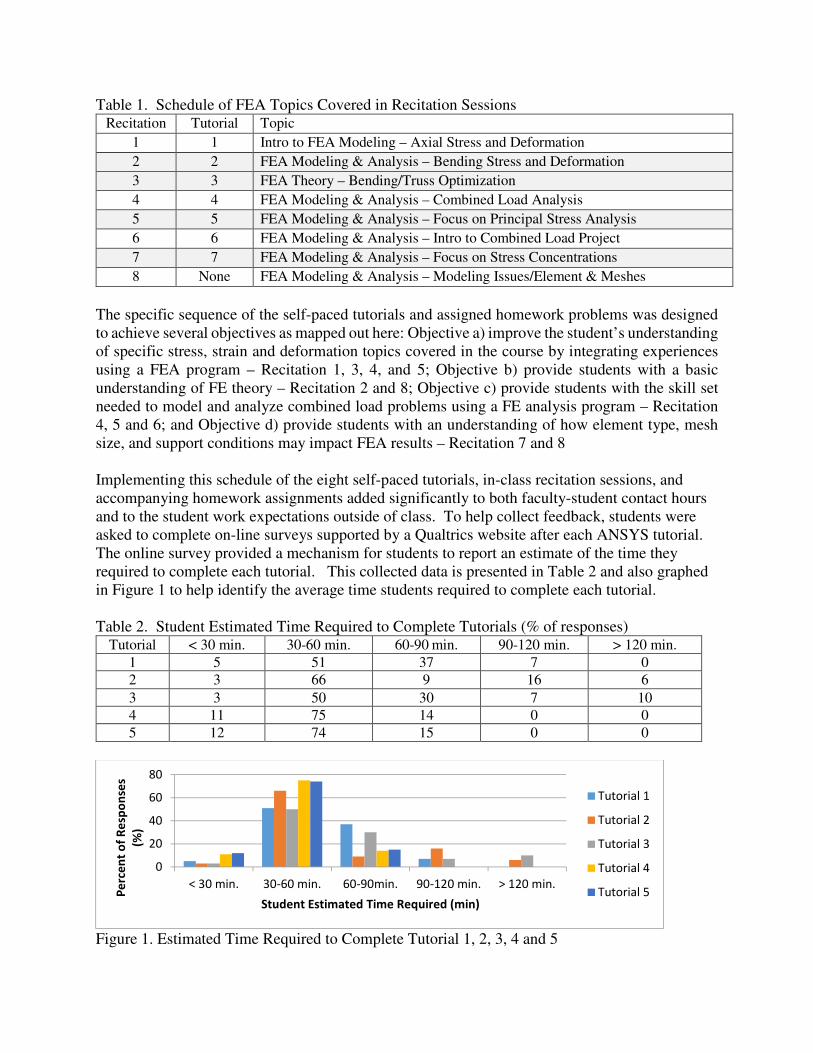
Table 1. Schedule of FEA Topics Covered in Recitation Sessions Recitation Tutorial Topic
1 1 Intro to FEA Modeling – Axial Stress and Deformation
2 2 FEA Modeling & Analysis – Bending Stress and Deformation
3 3 FEA Theory – Bending/Truss Optimization
4 4 FEA Modeling & Analysis – Combined Load Analysis
5 5 FEA Modeling & Analysis – Focus on Principal Stress Analysis
6 6 FEA Modeling & Analysis – Intro to Combined Load Project
7 7 FEA Modeling & Analysis – Focus on Stress Concentrations
8 None FEA Modeling & Analysis – Modeling Issues/Element & Meshes
The specific sequence of the self-paced tutorials and assigned homework problems was designed
to achieve several objectives as mapped out here: Objective a) improve the student’s understanding
of specific stress, strain and deformation topics covered in the course by integrating experiences
using a FEA program – Recitation 1, 3, 4, and 5; Objective b) provide students with a basic
understanding of FE theory – Recitation 2 and 8; Objective c) provide students with the skill set
needed to model and analyze combined load problems using a FE analysis program – Recitation
4, 5 and 6; and Objective d) provide students with an understanding of how element type, mesh
size, and support conditions may impact FEA results – Recitation 7 and 8
Implementing this schedule of the eight self-paced tutorials, in-class recitation sessions, and
accompanying homework assignments added significantly to both faculty-student contact hours
and to the student work expectations outside of class. To help collect feedback, students were
asked to complete on-line surveys supported by a Qualtrics website after each ANSYS tutorial.
The online survey provided a mechanism for students to report an estimate of the time they
required to complete each tutorial. This collected data is presented in Table 2 and also graphed
in Figure 1 to help identify the average time students required to complete each tutorial.
Table 2. Student Estimated Time Required to Complete Tutorials (% of responses) Tutorial < 30 min. 30-60 min. 60-90 min. 90-120 min. > 120 min.
1 5 51 37 7 0
2 3 66 9 16 6
3 3 50 30 7 10
4 11 75 14 0 0
5 12 74 15 0 0
Figure 1. Estimated Time Required to Complete Tutorial 1, 2, 3, 4 and 5
0
20
40
60
80
< 30 min. 30-60 min. 60-90min. 90-120 min. > 120 min.
Pe
rce
nt
of
Re
spo
nse
s
(%)
Student Estimated Time Required (min)
Tutorial 1
Tutorial 2
Tutorial 3
Tutorial 4
Tutorial 5
From the collected responses, it is clear that many students finished the tutorials within 60
minutes, and that almost all students finished the tutorials within 90 minutes. The online survey
did not ask students to report their average hours worked on each homework assignment.
However based on the complexity of problems solved, the reporting requirements for each
assignment and discussions with students about time spent on outside-of-class work, the time
required for each homework was proportional to the time required to complete each tutorial.
Therefore, the student time-on-task required to support the integration of the ANSYS FEA
content into the course during fall 2015 was estimated as 12 hours of out-of-class time to
complete Tutorials 1, 2, 3, 4, 5, and 7; 8 hours of in-class recitation work; 12 hours of out-of-
class time to complete Homework 1, 2, 3, 4, 5, and 7; and 8 hours of out-of-class time to
complete the Combined Stress Project tasks and prepare the report. The total added student
time-on-task was 8 hours of in-class time and 32 hours of out-of-class time. The average time
per week for eight weeks of the semester was one hour in-class and four hours out-of-class.
Overview of ANSYS Tutorial and Homework Assignments
This section provides details about the ANSYS tutorials and homework assignments that were
designed for the fall 2015 semester. These assignments define the skills students were expected
to learn and also define the scaffolding of increasingly complex problems that were introduced to
students in the assignments. The complete ANSYS Workbench 15.03 Tutorial and Homework
Assignments from fall 2015 are provided at the following website: sites.lafayette.edu/raicha
under the Strength of Materials course information.
Tutorial 1 - Intro to FEA Modeling – Axial Stress and Deformation
This tutorial was structured to guide students through the process of creating their first model in
ANSYS Workbench 15.03 and then through analyzing their model to obtain axial stress and
deformation results. Students learned how to define the model geometry and assign material
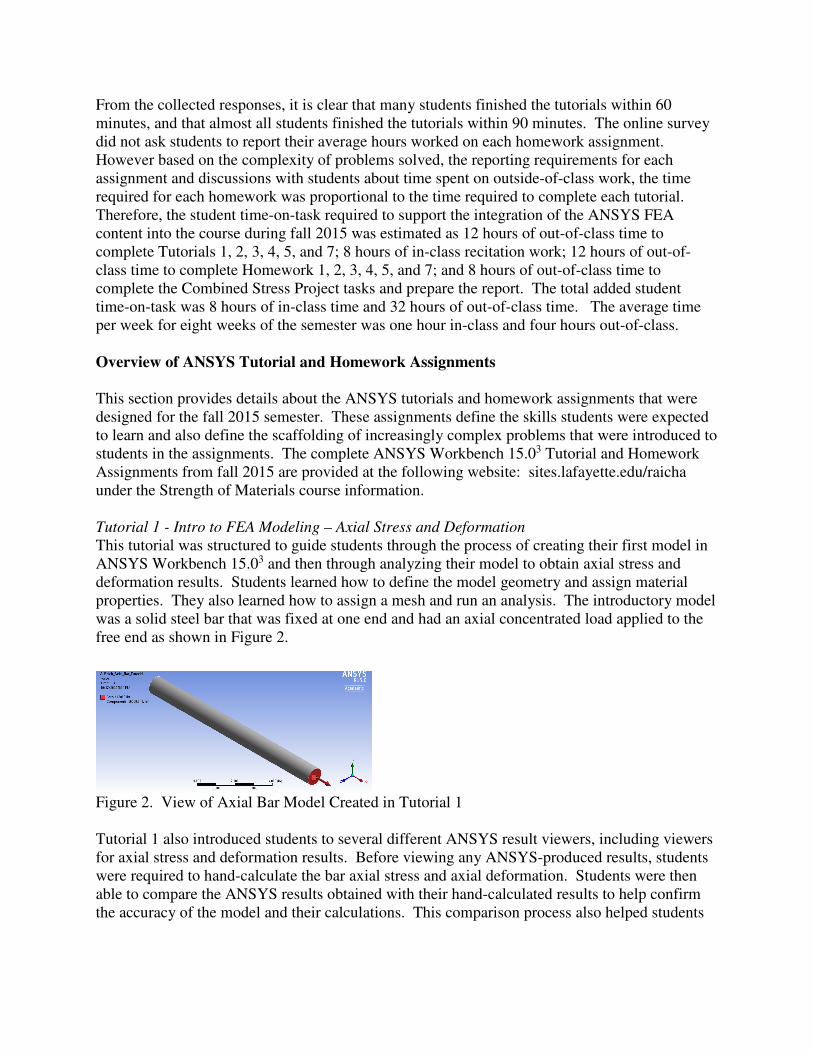
properties. They also learned how to assign a mesh and run an analysis. The introductory model
was a solid steel bar that was fixed at one end and had an axial concentrated load applied to the
free end as shown in Figure 2.
Figure 2. View of Axial Bar Model Created in Tutorial 1
Tutorial 1 also introduced students to several different ANSYS result viewers, including viewers
for axial stress and deformation results. Before viewing any ANSYS-produced results, students
were required to hand-calculate the bar axial stress and axial deformation. Students were then
able to compare the ANSYS results obtained with their hand-calculated results to help confirm
the accuracy of the model and their calculations. This comparison process also helped students
begin to identify regions that are subjected to local stress concentration effects. Other topics
covered included viewing normal strain, lateral strain and Poisson’s Effect.
Homework 1 - Intro to FEA Modeling – Axial Stress and Deformation
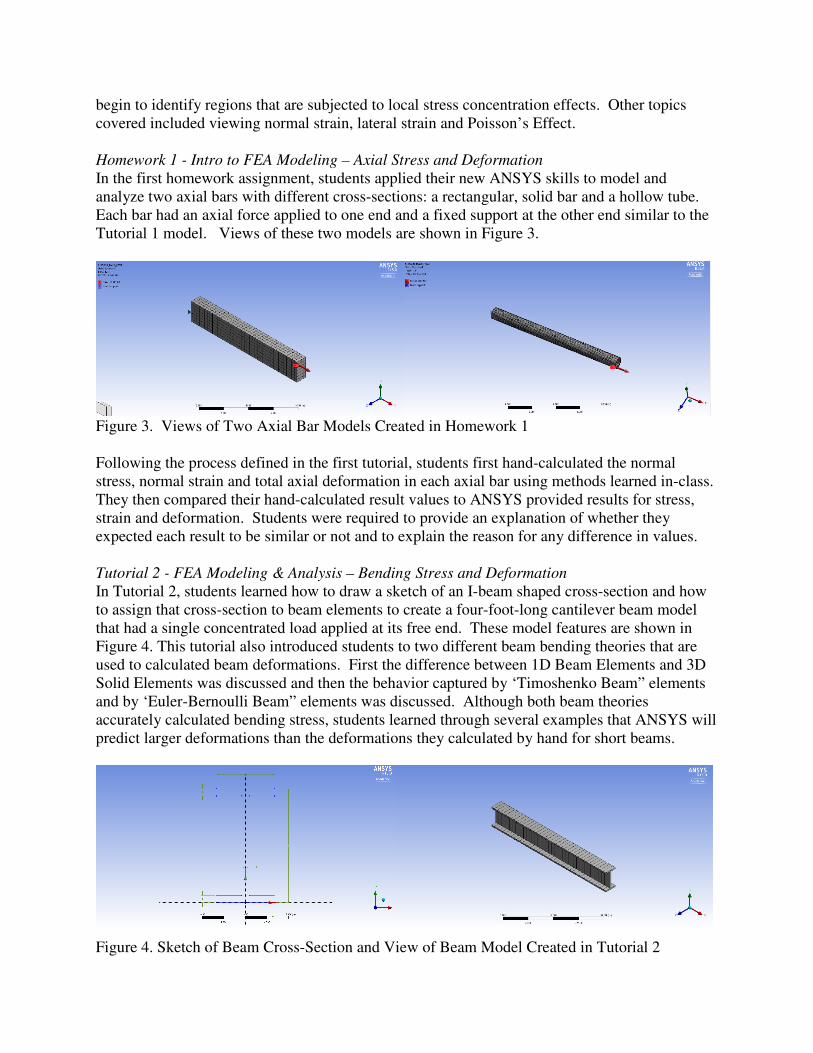
In the first homework assignment, students applied their new ANSYS skills to model and
analyze two axial bars with different cross-sections: a rectangular, solid bar and a hollow tube.
Each bar had an axial force applied to one end and a fixed support at the other end similar to the
Tutorial 1 model. Views of these two models are shown in Figure 3.
Figure 3. Views of Two Axial Bar Models Created in Homework 1
Following the process defined in the first tutorial, students first hand-calculated the normal
stress, normal strain and total axial deformation in each axial bar using methods learned in-class.
They then compared their hand-calculated result values to ANSYS provided results for stress,
strain and deformation. Students were required to provide an explanation of whether they
expected each result to be similar or not and to explain the reason for any difference in values.
Tutorial 2 - FEA Modeling & Analysis – Bending Stress and Deformation
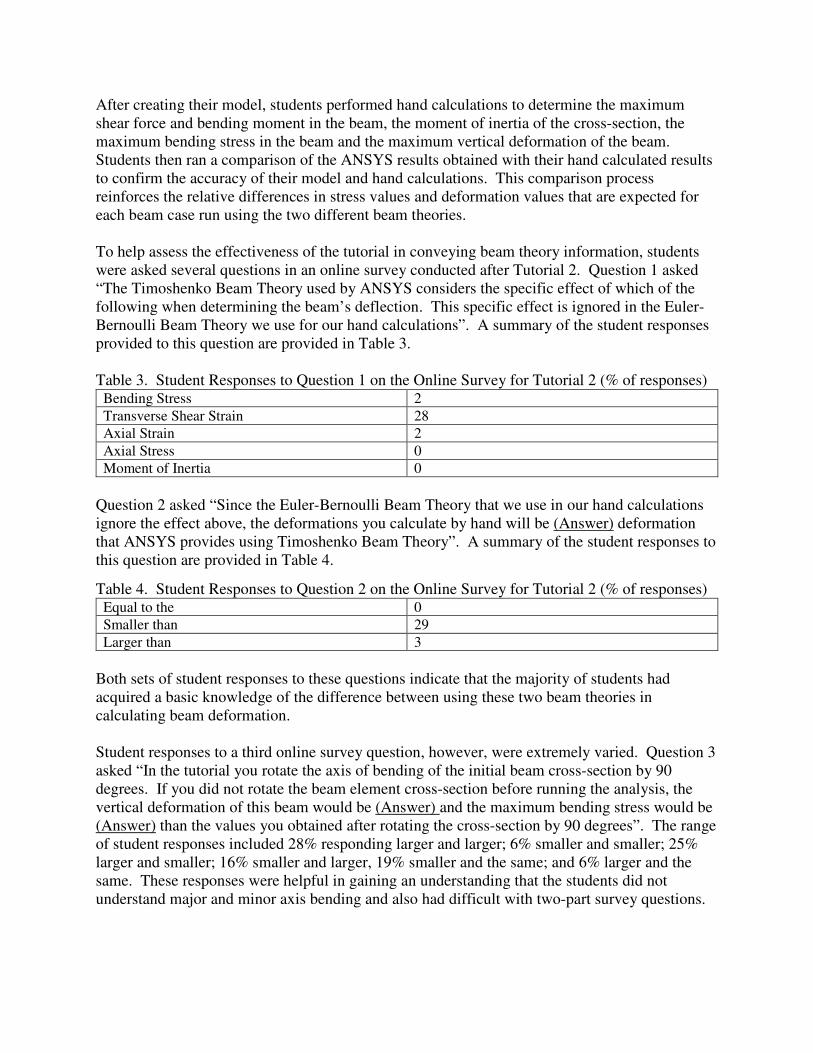
In Tutorial 2, students learned how to draw a sketch of an I-beam shaped cross-section and how
to assign that cross-section to beam elements to create a four-foot-long cantilever beam model
that had a single concentrated load applied at its free end. These model features are shown in
Figure 4. This tutorial also introduced students to two different beam bending theories that are
used to calculated beam deformations. First the difference between 1D Beam Elements and 3D
Solid Elements was discussed and then the behavior captured by ‘Timoshenko Beam” elements
and by ‘Euler-Bernoulli Beam” elements was discussed. Although both beam theories
accurately calculated bending stress, students learned through several examples that ANSYS will
predict larger deformations than the deformations they calculated by hand for short beams.
Figure 4. Sketch of Beam Cross-Section and View of Beam Model Created in Tutorial 2
After creating their model, students performed hand calculations to determine the maximum
shear force and bending moment in the beam, the moment of inertia of the cross-section, the
maximum bending stress in the beam and the maximum vertical deformation of the beam.
Students then ran a comparison of the ANSYS results obtained with their hand calculated results
to confirm the accuracy of their model and hand calculations. This comparison process
reinforces the relative differences in stress values and deformation values that are expected for
each beam case run using the two different beam theories.
To help assess the effectiveness of the tutorial in conveying beam theory information, students
were asked several questions in an online survey conducted after Tutorial 2. Question 1 asked
“The Timoshenko Beam Theory used by ANSYS considers the specific effect of which of the
following when determining the beam’s deflection. This specific effect is ignored in the Euler-
Bernoulli Beam Theory we use for our hand calculations”. A summary of the student responses
provided to this question are provided in Table 3.
Table 3. Student Responses to Question 1 on the Online Survey for Tutorial 2 (% of responses) Bending Stress 2
Transverse Shear Strain 28
Axial Strain 2
Axial Stress 0
Moment of Inertia 0
Question 2 asked “Since the Euler-Bernoulli Beam Theory that we use in our hand calculations
ignore the effect above, the deformations you calculate by hand will be (Answer) deformation
that ANSYS provides using Timoshenko Beam Theory”. A summary of the student responses to
this question are provided in Table 4.
Table 4. Student Responses to Question 2 on the Online Survey for Tutorial 2 (% of responses) Equal to the 0
Smaller than 29
Larger than 3
Both sets of student responses to these questions indicate that the majority of students had
acquired a basic knowledge of the difference between using these two beam theories in
calculating beam deformation.
Student responses to a third online survey question, however, were extremely varied. Question 3
asked “In the tutorial you rotate the axis of bending of the initial beam cross-section by 90
degrees. If you did not rotate the beam element cross-section before running the analysis, the
vertical deformation of this beam would be (Answer) and the maximum bending stress would be
(Answer) than the values you obtained after rotating the cross-section by 90 degrees”. The range
of student responses included 28% responding larger and larger; 6% smaller and smaller; 25%
larger and smaller; 16% smaller and larger, 19% smaller and the same; and 6% larger and the
same. These responses were helpful in gaining an understanding that the students did not
understand major and minor axis bending and also had difficult with two-part survey questions.
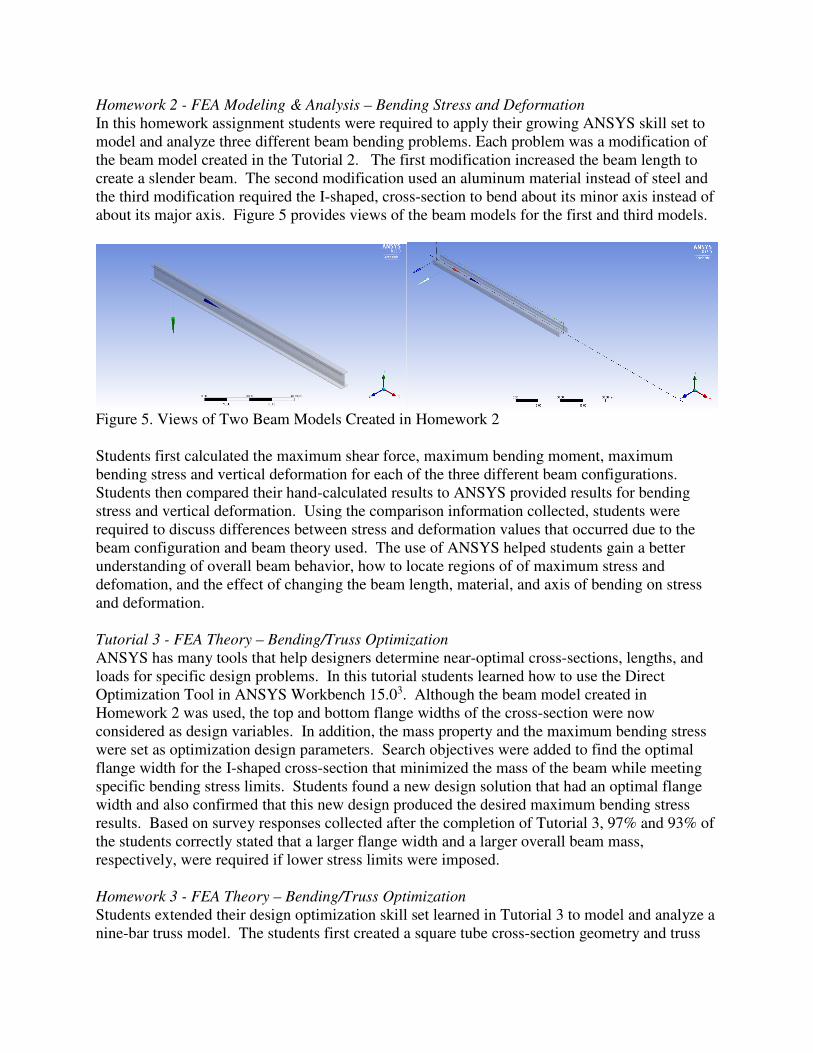
Homework 2 - FEA Modeling & Analysis – Bending Stress and Deformation
In this homework assignment students were required to apply their growing ANSYS skill set to
model and analyze three different beam bending problems. Each problem was a modification of
the beam model created in the Tutorial 2. The first modification increased the beam length to
create a slender beam. The second modification used an aluminum material instead of steel and
the third modification required the I-shaped, cross-section to bend about its minor axis instead of
about its major axis. Figure 5 provides views of the beam models for the first and third models.
Figure 5. Views of Two Beam Models Created in Homework 2
Students first calculated the maximum shear force, maximum bending moment, maximum
bending stress and vertical deformation for each of the three different beam configurations.
Students then compared their hand-calculated results to ANSYS provided results for bending
stress and vertical deformation. Using the comparison information collected, students were
required to discuss differences between stress and deformation values that occurred due to the
beam configuration and beam theory used. The use of ANSYS helped students gain a better
understanding of overall beam behavior, how to locate regions of of maximum stress and
defomation, and the effect of changing the beam length, material, and axis of bending on stress
and deformation.
Tutorial 3 - FEA Theory – Bending/Truss Optimization
ANSYS has many tools that help designers determine near-optimal cross-sections, lengths, and
loads for specific design problems. In this tutorial students learned how to use the Direct
Optimization Tool in ANSYS Workbench 15.03. Although the beam model created in
Homework 2 was used, the top and bottom flange widths of the cross-section were now
considered as design variables. In addition, the mass property and the maximum bending stress
were set as optimization design parameters. Search objectives were added to find the optimal
flange width for the I-shaped cross-section that minimized the mass of the beam while meeting
specific bending stress limits. Students found a new design solution that had an optimal flange
width and also confirmed that this new design produced the desired maximum bending stress
results. Based on survey responses collected after the completion of Tutorial 3, 97% and 93% of
the students correctly stated that a larger flange width and a larger overall beam mass,
respectively, were required if lower stress limits were imposed.
Homework 3 - FEA Theory – Bending/Truss Optimization
Students extended their design optimization skill set learned in Tutorial 3 to model and analyze a
nine-bar truss model. The students first created a square tube cross-section geometry and truss
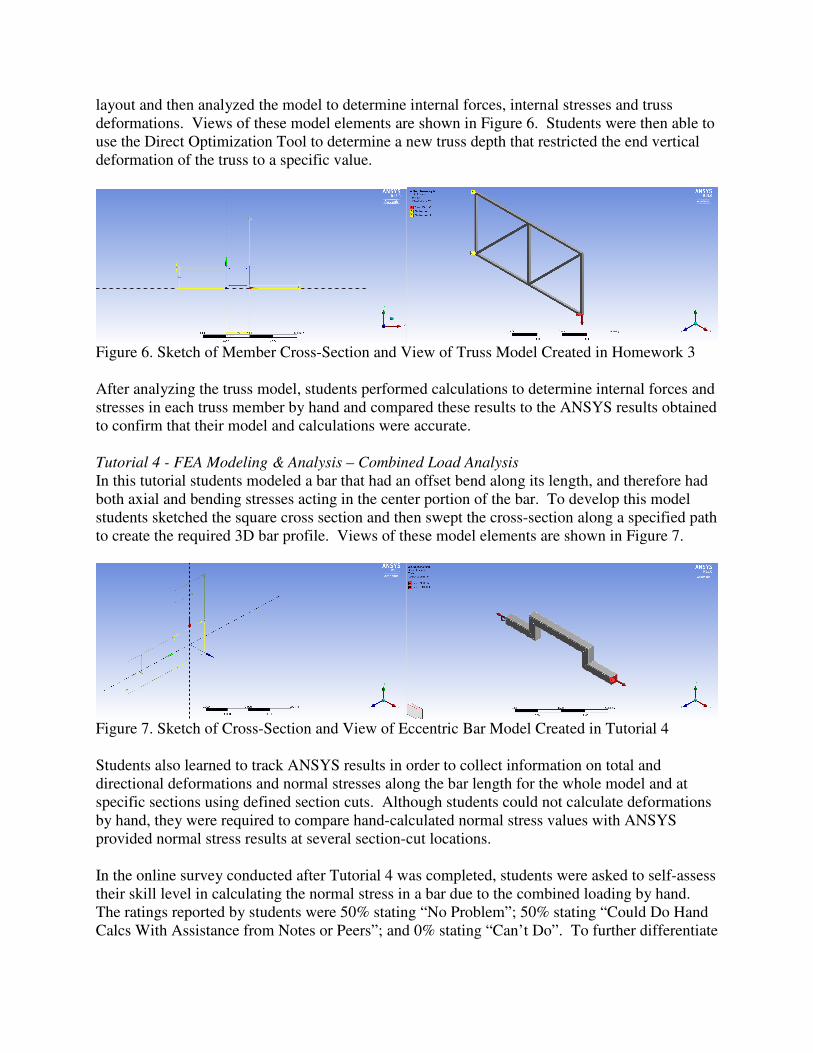
layout and then analyzed the model to determine internal forces, internal stresses and truss
deformations. Views of these model elements are shown in Figure 6. Students were then able to
use the Direct Optimization Tool to determine a new truss depth that restricted the end vertical
deformation of the truss to a specific value.
Figure 6. Sketch of Member Cross-Section and View of Truss Model Created in Homework 3
After analyzing the truss model, students performed calculations to determine internal forces and
stresses in each truss member by hand and compared these results to the ANSYS results obtained
to confirm that their model and calculations were accurate.
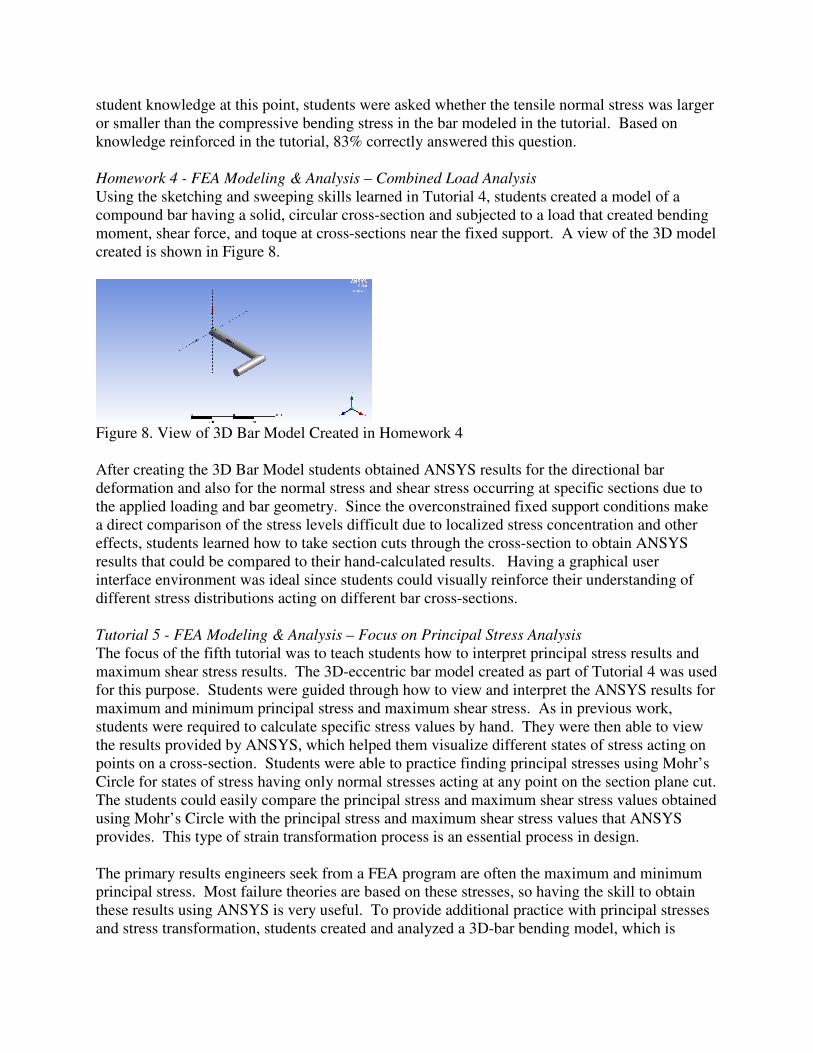
Tutorial 4 - FEA Modeling & Analysis – Combined Load Analysis
In this tutorial students modeled a bar that had an offset bend along its length, and therefore had
both axial and bending stresses acting in the center portion of the bar. To develop this model
students sketched the square cross section and then swept the cross-section along a specified path
to create the required 3D bar profile. Views of these model elements are shown in Figure 7.
Figure 7. Sketch of Cross-Section and View of Eccentric Bar Model Created in Tutorial 4
Students also learned to track ANSYS results in order to collect information on total and
directional deformations and normal stresses along the bar length for the whole model and at
specific sections using defined section cuts. Although students could not calculate deformations
by hand, they were required to compare hand-calculated normal stress values with ANSYS
provided normal stress results at several section-cut locations.
In the online survey conducted after Tutorial 4 was completed, students were asked to self-assess
their skill level in calculating the normal stress in a bar due to the combined loading by hand.
The ratings reported by students were 50% stating “No Problem”; 50% stating “Could Do Hand
Calcs With Assistance from Notes or Peers”; and 0% stating “Can’t Do”. To further differentiate
student knowledge at this point, students were asked whether the tensile normal stress was larger
or smaller than the compressive bending stress in the bar modeled in the tutorial. Based on
knowledge reinforced in the tutorial, 83% correctly answered this question.
Homework 4 - FEA Modeling & Analysis – Combined Load Analysis
Using the sketching and sweeping skills learned in Tutorial 4, students created a model of a
compound bar having a solid, circular cross-section and subjected to a load that created bending
moment, shear force, and toque at cross-sections near the fixed support. A view of the 3D model
created is shown in Figure 8.
Figure 8. View of 3D Bar Model Created in Homework 4
After creating the 3D Bar Model students obtained ANSYS results for the directional bar
deformation and also for the normal stress and shear stress occurring at specific sections due to
the applied loading and bar geometry. Since the overconstrained fixed support conditions make
a direct comparison of the stress levels difficult due to localized stress concentration and other
effects, students learned how to take section cuts through the cross-section to obtain ANSYS
results that could be compared to their hand-calculated results. Having a graphical user
interface environment was ideal since students could visually reinforce their understanding of
different stress distributions acting on different bar cross-sections.
Tutorial 5 - FEA Modeling & Analysis – Focus on Principal Stress Analysis
The focus of the fifth tutorial was to teach students how to interpret principal stress results and
maximum shear stress results. The 3D-eccentric bar model created as part of Tutorial 4 was used
for this purpose. Students were guided through how to view and interpret the ANSYS results for
maximum and minimum principal stress and maximum shear stress. As in previous work,
students were required to calculate specific stress values by hand. They were then able to view
the results provided by ANSYS, which helped them visualize different states of stress acting on
points on a cross-section. Students were able to practice finding principal stresses using Mohr’s
Circle for states of stress having only normal stresses acting at any point on the section plane cut.
The students could easily compare the principal stress and maximum shear stress values obtained
using Mohr’s Circle with the principal stress and maximum shear stress values that ANSYS
provides. This type of strain transformation process is an essential process in design.
The primary results engineers seek from a FEA program are often the maximum and minimum
principal stress. Most failure theories are based on these stresses, so having the skill to obtain
these results using ANSYS is very useful. To provide additional practice with principal stresses
and stress transformation, students created and analyzed a 3D-bar bending model, which is
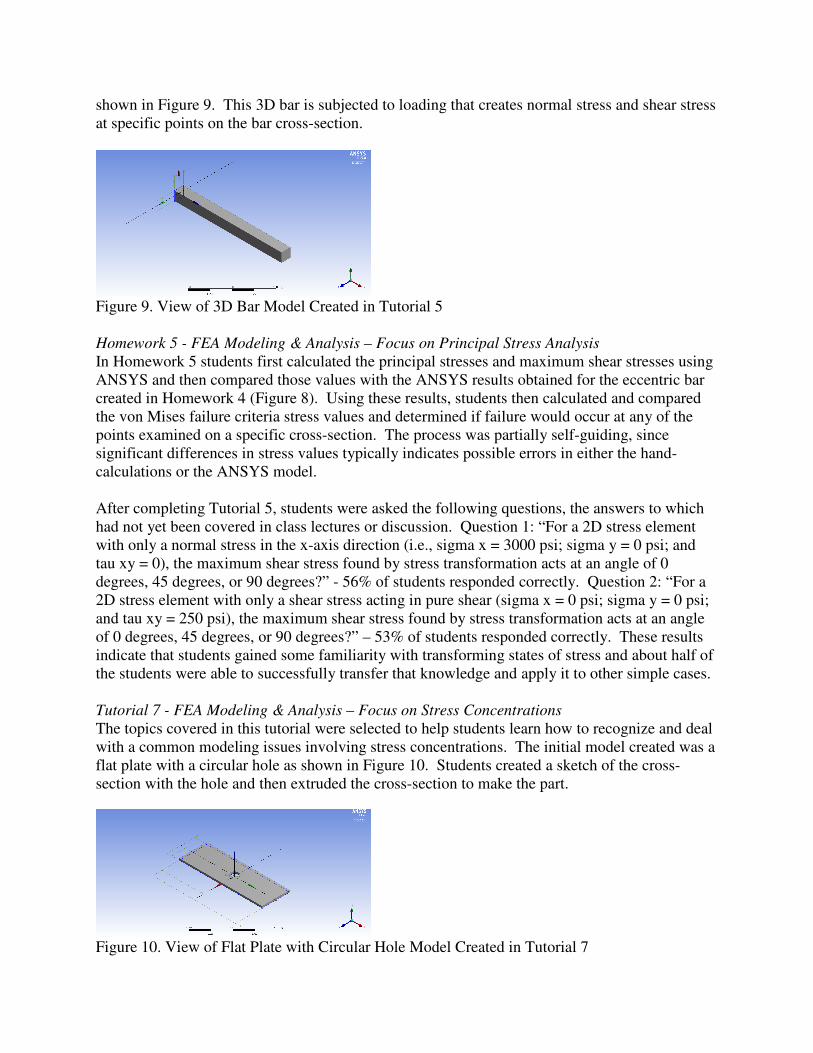
shown in Figure 9. This 3D bar is subjected to loading that creates normal stress and shear stress
at specific points on the bar cross-section.
Figure 9. View of 3D Bar Model Created in Tutorial 5
Homework 5 - FEA Modeling & Analysis – Focus on Principal Stress Analysis
In Homework 5 students first calculated the principal stresses and maximum shear stresses using
ANSYS and then compared those values with the ANSYS results obtained for the eccentric bar
created in Homework 4 (Figure 8). Using these results, students then calculated and compared
the von Mises failure criteria stress values and determined if failure would occur at any of the
points examined on a specific cross-section. The process was partially self-guiding, since
significant differences in stress values typically indicates possible errors in either the hand-
calculations or the ANSYS model.
After completing Tutorial 5, students were asked the following questions, the answers to which
had not yet been covered in class lectures or discussion. Question 1: “For a 2D stress element
with only a normal stress in the x-axis direction (i.e., sigma x = 3000 psi; sigma y = 0 psi; and
tau xy = 0), the maximum shear stress found by stress transformation acts at an angle of 0
degrees, 45 degrees, or 90 degrees?” - 56% of students responded correctly. Question 2: “For a
2D stress element with only a shear stress acting in pure shear (sigma x = 0 psi; sigma y = 0 psi;
and tau xy = 250 psi), the maximum shear stress found by stress transformation acts at an angle
of 0 degrees, 45 degrees, or 90 degrees?” – 53% of students responded correctly. These results
indicate that students gained some familiarity with transforming states of stress and about half of
the students were able to successfully transfer that knowledge and apply it to other simple cases.
Tutorial 7 - FEA Modeling & Analysis – Focus on Stress Concentrations
The topics covered in this tutorial were selected to help students learn how to recognize and deal
with a common modeling issues involving stress concentrations. The initial model created was a
flat plate with a circular hole as shown in Figure 10. Students created a sketch of the cross-
section with the hole and then extruded the cross-section to make the part.
Figure 10. View of Flat Plate with Circular Hole Model Created in Tutorial 7
Students were tasked with learning how to compare the stresses ANSYS reported in regions
located near the hole with the hand-calculated values they obtained using an approximate stress
concentration factor. Students also compared the stress concentration results obtained for a plate
made out of a non-yielding material and a plate made out of a yielding material. They learned
through experience that modeling elastic-plastic material behavior helps to reduce errors in
calculating stresses in areas that have stress concentrations in ANSYS.
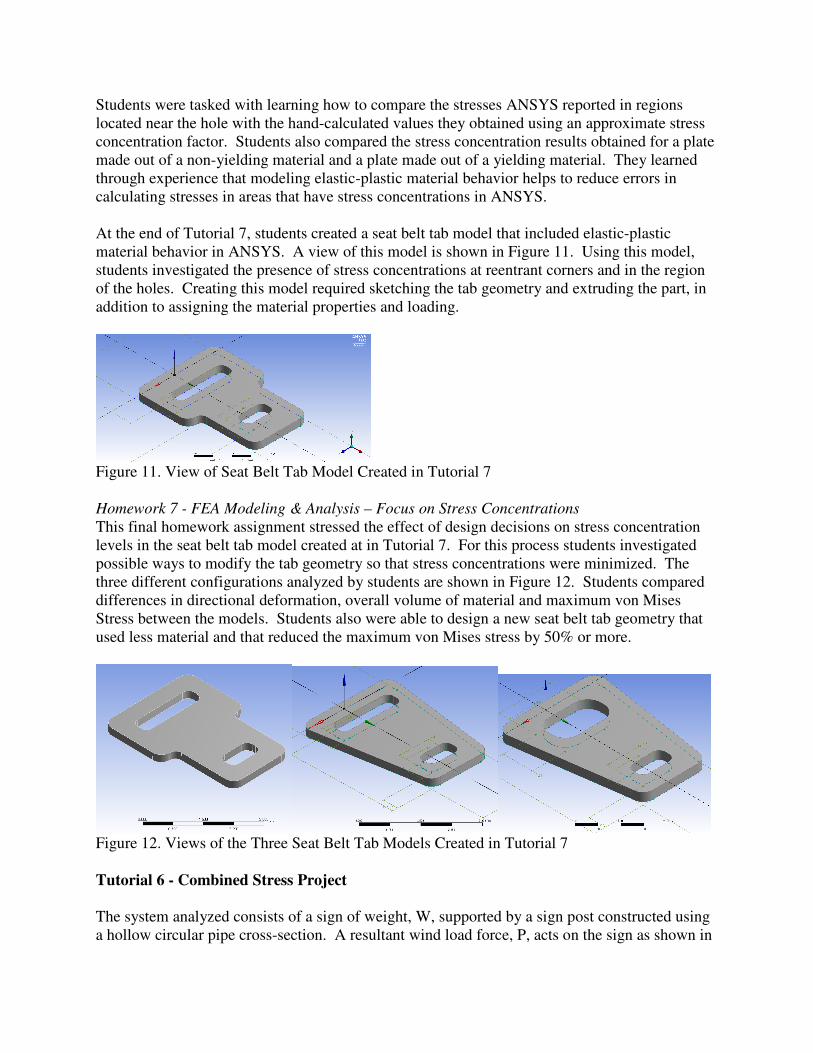
At the end of Tutorial 7, students created a seat belt tab model that included elastic-plastic
material behavior in ANSYS. A view of this model is shown in Figure 11. Using this model,
students investigated the presence of stress concentrations at reentrant corners and in the region
of the holes. Creating this model required sketching the tab geometry and extruding the part, in
addition to assigning the material properties and loading.
Figure 11. View of Seat Belt Tab Model Created in Tutorial 7
Homework 7 - FEA Modeling & Analysis – Focus on Stress Concentrations
This final homework assignment stressed the effect of design decisions on stress concentration
levels in the seat belt tab model created at in Tutorial 7. For this process students investigated
possible ways to modify the tab geometry so that stress concentrations were minimized. The
three different configurations analyzed by students are shown in Figure 12. Students compared
differences in directional deformation, overall volume of material and maximum von Mises
Stress between the models. Students also were able to design a new seat belt tab geometry that
used less material and that reduced the maximum von Mises stress by 50% or more.
Figure 12. Views of the Three Seat Belt Tab Models Created in Tutorial 7
Tutorial 6 - Combined Stress Project
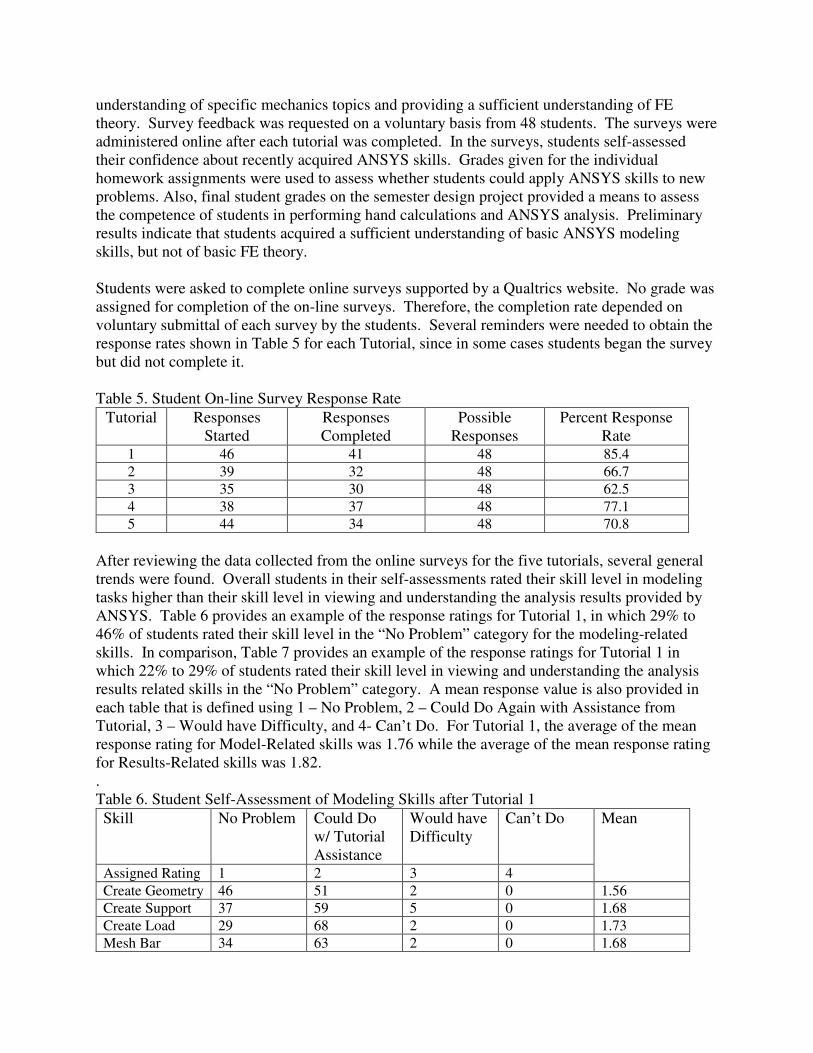
The system analyzed consists of a sign of weight, W, supported by a sign post constructed using
a hollow circular pipe cross-section. A resultant wind load force, P, acts on the sign as shown in
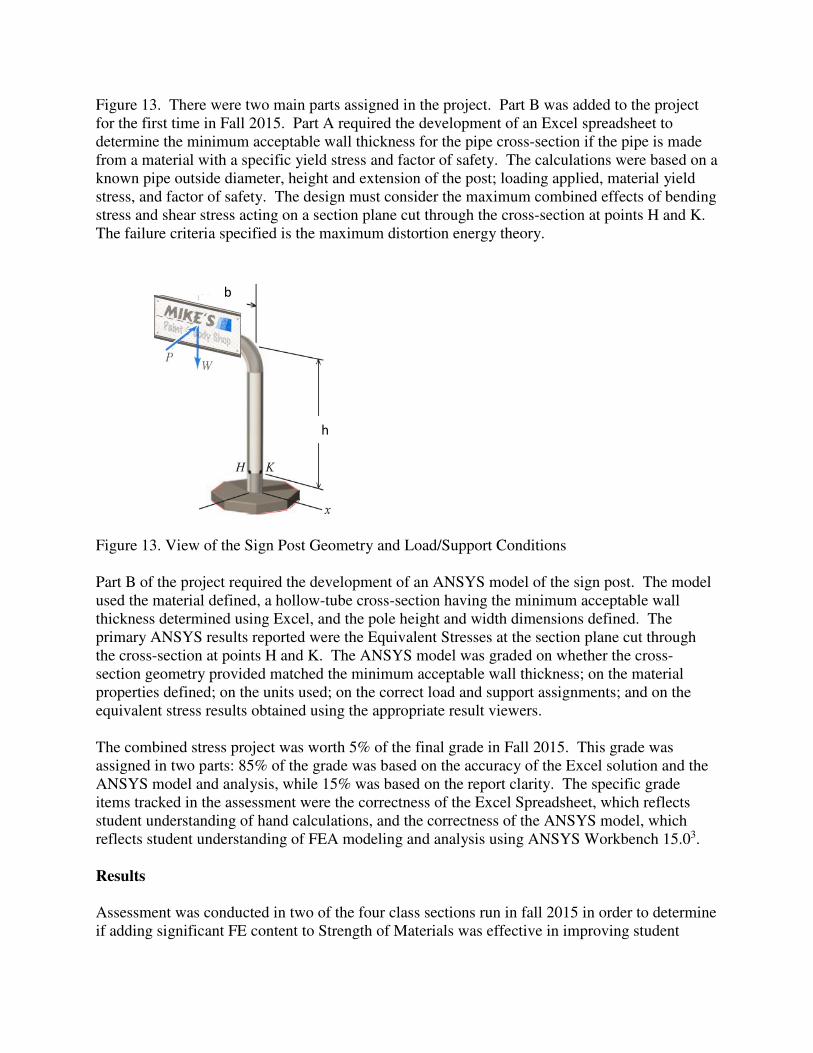
Figure 13. There were two main parts assigned in the project. Part B was added to the project
for the first time in Fall 2015. Part A required the development of an Excel spreadsheet to
determine the minimum acceptable wall thickness for the pipe cross-section if the pipe is made
from a material with a specific yield stress and factor of safety. The calculations were based on a
known pipe outside diameter, height and extension of the post; loading applied, material yield
stress, and factor of safety. The design must consider the maximum combined effects of bending
stress and shear stress acting on a section plane cut through the cross-section at points H and K.
The failure criteria specified is the maximum distortion energy theory.
Figure 13. View of the Sign Post Geometry and Load/Support Conditions
Part B of the project required the development of an ANSYS model of the sign post. The model
used the material defined, a hollow-tube cross-section having the minimum acceptable wall
thickness determined using Excel, and the pole height and width dimensions defined. The
primary ANSYS results reported were the Equivalent Stresses at the section plane cut through
the cross-section at points H and K. The ANSYS model was graded on whether the cross-
section geometry provided matched the minimum acceptable wall thickness; on the material
properties defined; on the units used; on the correct load and support assignments; and on the
equivalent stress results obtained using the appropriate result viewers.
The combined stress project was worth 5% of the final grade in Fall 2015. This grade was
assigned in two parts: 85% of the grade was based on the accuracy of the Excel solution and the
ANSYS model and analysis, while 15% was based on the report clarity. The specific grade
items tracked in the assessment were the correctness of the Excel Spreadsheet, which reflects
student understanding of hand calculations, and the correctness of the ANSYS model, which
reflects student understanding of FEA modeling and analysis using ANSYS Workbench 15.03.
Results
Assessment was conducted in two of the four class sections run in fall 2015 in order to determine
if adding significant FE content to Strength of Materials was effective in improving student
h
b
understanding of specific mechanics topics and providing a sufficient understanding of FE
theory. Survey feedback was requested on a voluntary basis from 48 students. The surveys were
administered online after each tutorial was completed. In the surveys, students self-assessed
their confidence about recently acquired ANSYS skills. Grades given for the individual
homework assignments were used to assess whether students could apply ANSYS skills to new
problems. Also, final student grades on the semester design project provided a means to assess
the competence of students in performing hand calculations and ANSYS analysis. Preliminary
results indicate that students acquired a sufficient understanding of basic ANSYS modeling
skills, but not of basic FE theory.
Students were asked to complete online surveys supported by a Qualtrics website. No grade was
assigned for completion of the on-line surveys. Therefore, the completion rate depended on
voluntary submittal of each survey by the students. Several reminders were needed to obtain the
response rates shown in Table 5 for each Tutorial, since in some cases students began the survey
but did not complete it.
Table 5. Student On-line Survey Response Rate
Tutorial Responses
Started
Responses
Completed
Possible
Responses
Percent Response
Rate 1 46 41 48 85.4
2 39 32 48 66.7
3 35 30 48 62.5
4 38 37 48 77.1
5 44 34 48 70.8
After reviewing the data collected from the online surveys for the five tutorials, several general
trends were found. Overall students in their self-assessments rated their skill level in modeling
tasks higher than their skill level in viewing and understanding the analysis results provided by
ANSYS. Table 6 provides an example of the response ratings for Tutorial 1, in which 29% to
46% of students rated their skill level in the “No Problem” category for the modeling-related
skills. In comparison, Table 7 provides an example of the response ratings for Tutorial 1 in
which 22% to 29% of students rated their skill level in viewing and understanding the analysis
results related skills in the “No Problem” category. A mean response value is also provided in
each table that is defined using 1 – No Problem, 2 – Could Do Again with Assistance from
Tutorial, 3 – Would have Difficulty, and 4- Can’t Do. For Tutorial 1, the average of the mean
response rating for Model-Related skills was 1.76 while the average of the mean response rating
for Results-Related skills was 1.82.
.
Table 6. Student Self-Assessment of Modeling Skills after Tutorial 1
Skill No Problem Could Do
w/ Tutorial
Assistance
Would have
Difficulty
Can’t Do Mean
Assigned Rating 1 2 3 4
Create Geometry 46 51 2 0 1.56
Create Support 37 59 5 0 1.68
Create Load 29 68 2 0 1.73
Mesh Bar 34 63 2 0 1.68

Table 7. Student Self-Assessment of Understanding Analysis Results Skills after Tutorial 1
Skill No Problem Could Do
w/ Tutorial
Assistance
Would have
Difficulty
Can’t Do Mean
Assigned Rating 1 2 3 4
View Stress 22 73 5 0 1.83
View
Deformation
29 61 10 0 1.8
Table 8 summarizes the student self-assessment ratings broken out by Modeling-related and
Results-related categories for all five tutorials. The self-assessment rating is reported as the
average of the mean reported for each individual task listed under each category from the survey.
Table 8. Student Self-Assessment of Modeling-Related and Results-Related Skills
Tutorial Skill Average Mean Reported 1
Modeling-Related 1.76
Results-Related 1.82
2
Modeling-Related 1.58
Results-Related 1.66
3
Modeling-Related 1.83
Results-Related 1.89
4
Modeling-Related 1.56
Results-Related 1.61
5
Modeling-Related 1.44
Results-Related 1.61
These rating results, in which a decrease in value brings the student rating closer to a desired
rating of ‘No Problem’, indicates that student confidence in their modeling-related skills overall
increased over the semester even as the models they were asked to create grew in complexity.
The student’s confidence in their results-related skills also improved overall but lagged the
modeling-related skill ratings. This data indicates that in future offerings of this course more
information and examples should be provided in the tutorials to help students better understand
how to view results correctly and how to report results, compare results between trials, and to
check if the results obtained by ANSYS are correct.
The number of reported student difficulties using the ANSYS Workbench 15.03 program
environment also decreased as the semester proceeded, as shown by student responses from the
online surveys that are summarized in Table 9.
Table 9. Number of Issues Reported using ANSYS Workbench 15.03
Tutorial Students Total Number of Issues Reported By Students Workbench Interface DesignModeler (Geometry) Mechanical (Analysis)
1 7 4 4 4
2 4 3 2 2
3 3 3 0 0
4 2 1 1 2
5 0 0 0 0
The student grade average for each ANSYS homework assignment was 91.3% for HW 1; 83.2%
for HW 2; 84.5% for HW 3; 85.6% for HW 4; 75.7% for HW 5; and 80.4% for HW 7. The total
Recitation grade students received, which consisted of grades on ANSYS homework
assignments, was only 15% of the final grade in the course. In the two sections tracked in the
fall 2015 assessment, several students did not complete all of the ANSYS Homework or
submitted work that showed minimal effort. This low student performance was the exception,
but it should be noted that under the current implementation students can choose to not complete
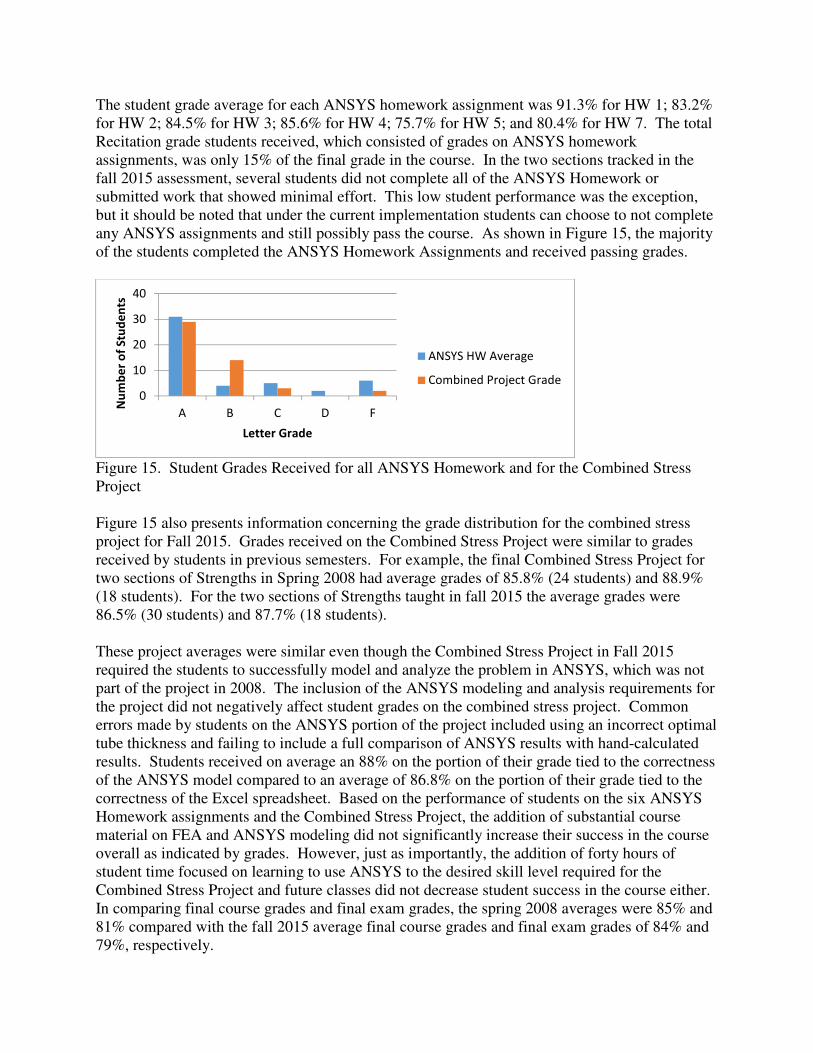
any ANSYS assignments and still possibly pass the course. As shown in Figure 15, the majority
of the students completed the ANSYS Homework Assignments and received passing grades.
Figure 15. Student Grades Received for all ANSYS Homework and for the Combined Stress
Project
Figure 15 also presents information concerning the grade distribution for the combined stress
project for Fall 2015. Grades received on the Combined Stress Project were similar to grades
received by students in previous semesters. For example, the final Combined Stress Project for
two sections of Strengths in Spring 2008 had average grades of 85.8% (24 students) and 88.9%
(18 students). For the two sections of Strengths taught in fall 2015 the average grades were
86.5% (30 students) and 87.7% (18 students).
These project averages were similar even though the Combined Stress Project in Fall 2015
required the students to successfully model and analyze the problem in ANSYS, which was not
part of the project in 2008. The inclusion of the ANSYS modeling and analysis requirements for
the project did not negatively affect student grades on the combined stress project. Common
errors made by students on the ANSYS portion of the project included using an incorrect optimal
tube thickness and failing to include a full comparison of ANSYS results with hand-calculated
results. Students received on average an 88% on the portion of their grade tied to the correctness
of the ANSYS model compared to an average of 86.8% on the portion of their grade tied to the
correctness of the Excel spreadsheet. Based on the performance of students on the six ANSYS
Homework assignments and the Combined Stress Project, the addition of substantial course
material on FEA and ANSYS modeling did not significantly increase their success in the course
overall as indicated by grades. However, just as importantly, the addition of forty hours of
student time focused on learning to use ANSYS to the desired skill level required for the
Combined Stress Project and future classes did not decrease student success in the course either.
In comparing final course grades and final exam grades, the spring 2008 averages were 85% and
81% compared with the fall 2015 average final course grades and final exam grades of 84% and
79%, respectively.
0
10
20
30
40
A B C D F
Nu
mb
er
of
Stu
de
nts
Letter Grade
ANSYS HW Average
Combined Project Grade
Conclusions
Based on preliminary assessment of student performance on individual ANSYS homework
assignments, online survey feedback provided by students, and student performance on a
combined stress project that involved both hand calculations and ANSYS modelling and
analysis, the following conclusions were made. The integration of course content using Tutorial
1 and 2 helped support student understanding of axial and bending stress and axial and bending
deformation. The integration of course content using Tutorials 4 and 5 helped to support student
understanding of states of stress, combined stresses, principal stresses and failure criteria. The
combined stress project successfully provided students with the opportunity to show that they
had developed the skill set needed to model and analyze combined load problems using ANSYS
Workbench 15.03. Secondary beneficial impacts of the integration of FEA content included
having students investigate the effects of element types on beam deformation results in Tutorial 2
and the effect of mesh sizes and the presence of stress concentrations on stress results in Tutorial
7 and Recitation 8.
Preliminary results indicate that students acquired a sufficient understanding of the basic ANSYS
modeling skills that form the foundation of subsequent courses and design project experiences,
but not of basic FE theory. If the specific objective of providing students with a basic
understanding of FE theory remains a primary objective in future semesters, the course
framework should be changed to increase the number of weeks that FEA topics are covered in
recitation sessions. Overall the integration of FEA content into the Strength of Materials course
was successful in building the ANSYS skill set students needed for future classes without
negatively impacting their learning of the required Strength of Material course content.
References
1 J. Papadopoulos, C. Papadopoulos, V. Prantil, A philosophy of integrating FEA
practice throughout the undergraduate ce/me curriculum, Proceedings of the 2011 Annual ASEE
Conference and Exposition, 2011. 2 T. Wedlick, S.R. Chang, B. Sepahpour. A Start Up Manual for Using ANSYS in
Undergraduate Engineering Courses, Proceedings of the 2006 Annual ASEE Conference and
Exposition, 2006 3 ANSYS® WorkbenchTM Academic Research, Release 15.0, ANSYS, Inc., 2013