Embed Size (px)
Citation preview
Post print from a paper that appears in the Journal of Applied Mechanics, Volume 74, Number 4, July 2007, pp. 816-820
Near Field Acoustic Levitation Sliding Contact
T A Stolarski and C I Woolliscroft Mechanical Engineering
School of Engineering and Design Brunel University
Uxbridge, Middlesex UB8 3PH Abstract: The paper presents an investigation into producing self-levitation effect using piezo-electric actuators (PZT). Self-levitation has been demonstrated and results are presented and discussed. A relationship between the levitation distance and weight of the levitating sample has been found. In addition, the orientation and position of the PZTs has been found to affect the levitation distance. Modal shapes of the vibration plates used have been produced through modelling and found to accurately correlate with the experimental results found. Additional evidence suggests that the type of vibration plate material affects the separation distance, possibly due to the material’s properties of acoustic reflection. 1. Introduction Increasingly in modern technology the demand for engineering
components is to become smaller and smaller. This opens up a
completely new area of micro technology and precision engineering in
the nanometre scale. One of the main problems with manufacturing
components at such a small scale with equipment such as laser cutters,
optical scanners and silicon chip production tools is the accuracy of
any movement at this scale. Static friction has a major effect on
controlled precise movements at the nanometre scale. Near frictionless
1

Post print from a paper that appears in the Journal of Applied Mechanics, Volume 74, Number 4, July 2007, pp. 816-820
operation of machinery for nanometre accuracy is a definite pre-
requisite.
Producing frictionless movement can be achieved with several
methods. Lubricating oil can be used to reduce friction but small
accurate movements can be affected by the viscosity of the lubricant.
Current compressed air tracks are available but these require a
constant clean supply of compressed air and the air tracks require
hose feeds and porous pads making the system bulky. Magnetic
frictionless systems are available but these are also costly and require
the use of large magnets or coils to produce the magnetic fields. In
addition, the magnetic fields produced by this equipment are
undesirable in many applications relating to nano-technology.
Dynamic bearings do produce a frictionless surface when in operation
however, they do not perform well in static conditions as when the
surfaces stop moving relative to each other and the separation
between them is lost.
Near Field Acoustic Levitation (NFAL) [1, 2, 3] is an interesting
alternative for near frictionless operation of high precision machinery.
NFAL is produced when rapid vibrations between two surfaces close
together in a compressible fluid medium such as air create a load
carrying gas film. This gas film has a pressure greater than the
ambient pressure and so can support a load. There is no need for large
quantities of clean compressed gas or the production of magnetic
fields. All that is required is the production of rapid vibrations between
two surfaces to produce the effect. The production of rapid vibrations
2
Post print from a paper that appears in the Journal of Applied Mechanics, Volume 74, Number 4, July 2007, pp. 816-820
can be achieved by some form of piezo-electric actuator (PZT) as the
frequency required is particularly high. The separation between the
two surfaces can be very small indeed, in some cases down to a
distance of just 10 µm.
The frictionless operation of the levitating surface along with the small
dimensions of the separation distance between the two surfaces
makes the NFAL effect an alternative for separation distance
techniques within computer hard disks. Within the computer industry
the demand for larger data capacity storage devices, means that the
density of transistors is much higher on a hard disk platter and in
order for the disk head to read the data it must be extremely close to
the rotating platter. Current aerodynamic methods of separation of the
platter and head are reaching their limits. The possibility of the head
levitating due to ultrasonic vibrations above the hard disk platter may
be an interesting and plausible method. If the separation between the
head and the platter can be kept extremely small down to 6nm, rather
than the current distances of 76 nm to 500 nm, the density of data
storage elements on the hard disk platter will increase from the
current 10Gb/in2 to 100 Gb/in2 [4].
Acoustic levitation of solids has been suggested for use in non-contact
transportation of glass substrate of LCD in its manufacture [1]. Since
the acoustic levitation effect can be used to move objects as well as
cause them to levitate, many other applications would be applicable to
acoustic levitation where relatively light objects need transporting
accurately.
3
Post print from a paper that appears in the Journal of Applied Mechanics, Volume 74, Number 4, July 2007, pp. 816-820
This paper reports on a sliding contact operating on NFAL principle.
The ultrasonic frequency range used is inaudible so operation of any
NFAL contact should be kept within this region if NFAL is to be
recognised as a plausible method for use in industry.
The main objective of the study presented was to find a proof of
evidence demonstrating that the NFAL contact is practically feasible
and operates due to the emission of an ultrasonic acoustic wave from
a parallel surface. Once the acoustic levitation concept was confirmed
it was then possible to investigate relationships between the levitation
effect and various parameters affecting it.
2. Experimental set up
In order to investigate the possibility of self-lifting generation due to
NFAL a plain rectangular piece of material was rigidly clamped at each
end as shown in Figure 1[5]. The initial dimensions of the rectangular
plate were 200x100x5 mm and it was made from aluminium. The
plate had two foil-type piezoelectric actuators on the underside of it,
which produce Poisson’s ratio contraction effect when operated. In
addition, these two PZTs generate an ultrasonic acoustic wave from the
surface of the plate to allow small mass objects to levitate utilising the
NFAL effect.
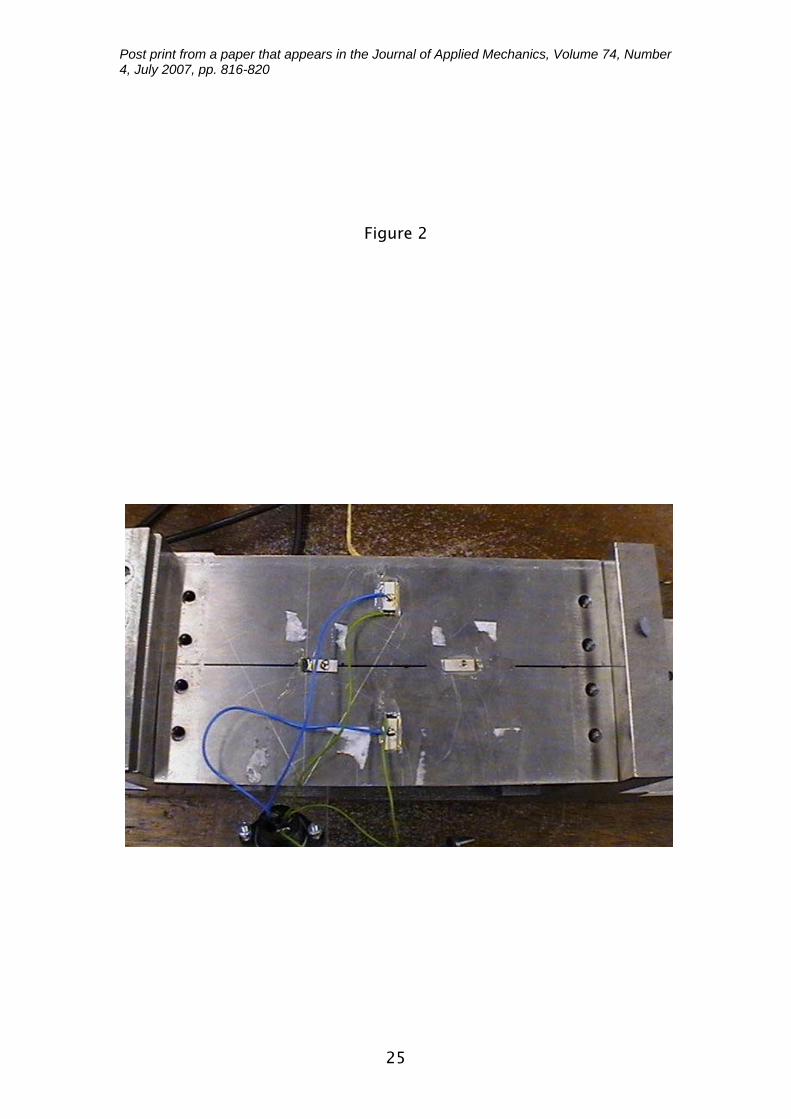
Experimental set up, in the form of a computer generated 3-D image,
is shown in Figure 2. The test rig main structure is made of mild steel
and holds the vibrating plate clamped in the horizontal plane. The
vibrating plate is clamped at both ends to the steel supporting
4
Post print from a paper that appears in the Journal of Applied Mechanics, Volume 74, Number 4, July 2007, pp. 816-820
structure with the help of four bolts and a steel strip at each end. In
addition, the base of the rig is made from twenty millimetre thick mild
steel, this additional mass aids in the stability of the structure. The
vibration of the plate will inevitably be passed onto the rig, which
cannot be permitted to move around during operation; the large mass
of the clamping structure makes it more difficult for the vibration of
the plate to cause movement of the clamping rig.
The three feet to the base are adjustable so that the testing rig can be
balanced with the use of a spirit level when set up on a bench. This is
necessary as the levitating sample will be very sensitive to even a
slight incline and this will cause the sample to constantly slide to the
edges of the vibrating plate. Including the adjustable feet in the design
of the testing rig enables the level of the plate to be set to horizontal
on most laboratory benches.
The vertical acrylic plate on the side of the rig base has the function of
holding a 4pin socket for the connector to plug into. This makes the
rig easily detachable from other equipment. In addition, this means
that when the wires are connected to the PZTs and the socket they
receive no disturbance. Any disturbance through the wires connected
to the PZTs could damp the vibrations of the element and lead to a
wire breakage.
Vibrating plates used in experiments are the 1mm aluminium plate,
1.9mm aluminium plate 1.55mm titanium plate, and the 1.1mm steel
plate. The 1.9mm aluminium plate was tested first and good results
were obtained. The 1mm aluminium plate was then tested, as thinner
5

Post print from a paper that appears in the Journal of Applied Mechanics, Volume 74, Number 4, July 2007, pp. 816-820
plates should lead to higher amplitude of vibrations due to the lower
mass of the plate being accelerated and the increase in deformation.
The high carbon steel plate was chosen to obtain ground steel gauge
plate, as it was thought that the smooth ground finish would increase
the NFAL performance. The titanium plate was tested because titanium
has certain elastic propertiesi that were thought to be favourable to
the NFAL effect.
The floating samples used for the experimental testing had to have
five very important features.
(i) The sample needed to be as flat and smooth as possible on the
side facing the vibrating plate.
6
Post print from a paper that appears in the Journal of Applied Mechanics, Volume 74, Number 4, July 2007, pp. 816-820
(ii) The samples needed to be relatively light. The amount of weight
per unit area that can be supported by the NFAL effect may be
very small with the small size of the PZTs driving the plate.
(iii) The floating samples needed to be rigid. If the samples were not
rigid then the acoustic waves emitted from the vibrating plate
would be partially absorbed by the sample. The levitating sample
is a reflector of ultrasonic acoustic waves produced by the
vibrating plate, this is a fundamental part of the NFAL principle,
having a rigid sample will greatly improve the performance of the
NFAL effect observed.
(iv) The sample had to be at least 1.5 wavelengths of the flexural
wavelength of the vibrating plate to levitate stably. Through
modelling, it was discovered that the floating sample would need
to be at least 30mm in most modes of vibration for all of the
plates.
(v) The top surface of the sample had to be metallic. The proximity
probe, used to measure separation, can sense only conductive
surfaces.
The most readily available samples that were found to cover all of
these criteria were glass discs of 49.5 mm diameter and 3 mm thick
and acrylic discs of 49.5 mm diameter and 6 mm thick. Both of these
samples agree with all of the above conditions, apart from neither of
the samples were metallic.
7
Post print from a paper that appears in the Journal of Applied Mechanics, Volume 74, Number 4, July 2007, pp. 816-820
To use the glass and acrylic samples with the proximity probe the
upper surface of the sample needed to be metallic. This was overcome
by having both of the samples gold plated. The gold plating technique
produces a very thin layer of less than 0.1 µm. However, the layer is
sufficient to be detected by the capacitance proximity sensor and thin
enough not to affect the sample’s smooth surface.
Foil type PZTs were used and they are known to change length when a
voltage is put across them in order to vibrate the plate on the rig.
These PZTs are capable to operate at ultrasonic frequencies and were
suitable for this application. The PZTs were bonded to the plates with
epoxy resin in the manner shown in Figure 3. Initially, two PZTs were
used. Their positions were decided as the best position over the plate
in regards to the most flexural part of the plate, one element in the
centre of each half of the plate less the clamped ends of the plate.
Also the orientation of the PZTs was chosen to be lengthways as in this
direction the plate has more material and so is more flexural.
3. Modelling and modal analysis
The 1.9mm thick aluminium plate was modelled using the finite
element analysis programme ANSYS. Two models were created to
investigate the behaviour of the plate around the ultrasonic frequency
range.
3.1 Modal analysis
8
Post print from a paper that appears in the Journal of Applied Mechanics, Volume 74, Number 4, July 2007, pp. 816-820
The first model was a modal frequency sweep of the plate. The plate
was drawn in ANSYS and then a frequency sweep was done about a
range of frequencies, which was set to 20 kHz- 40 kHz, as this is the
range of the PZTs used. Through this frequency sweep, ANSYS
detected the theoretical resonant frequencies of the plate with the
given material properties of density 2600kg/m3, Young’s modulus
70GPa and Poisson’s ratio 0.33. ANSYS also used the dimensions of
the plate. The plate model was fixed at both longitudinal ends of the
plate for 20mm from both ends. This was done by restraining the
areas of the plate model surface for this distance in all dimensions.
The elements used were solid brick 20 node “type 186” for the plate
central area and solid tetrahedral 10 node “type 92” for the clamped
area of the plate.
ANSYS was then used to display each of the detected resonant
frequencies showing the deformed modal shape at that resonant
frequency. This deformed shape does not have dimensions of
deformation as no applied force is specified in the computing of the
modal shapes, the distances shown in the deformation of modal
shapes is relative distance. The deformed shape shows an estimate of
what that mode of resonance of the plate will look like in terms of
flexural vibration.
3.2 Structural deformation
9
Post print from a paper that appears in the Journal of Applied Mechanics, Volume 74, Number 4, July 2007, pp. 816-820
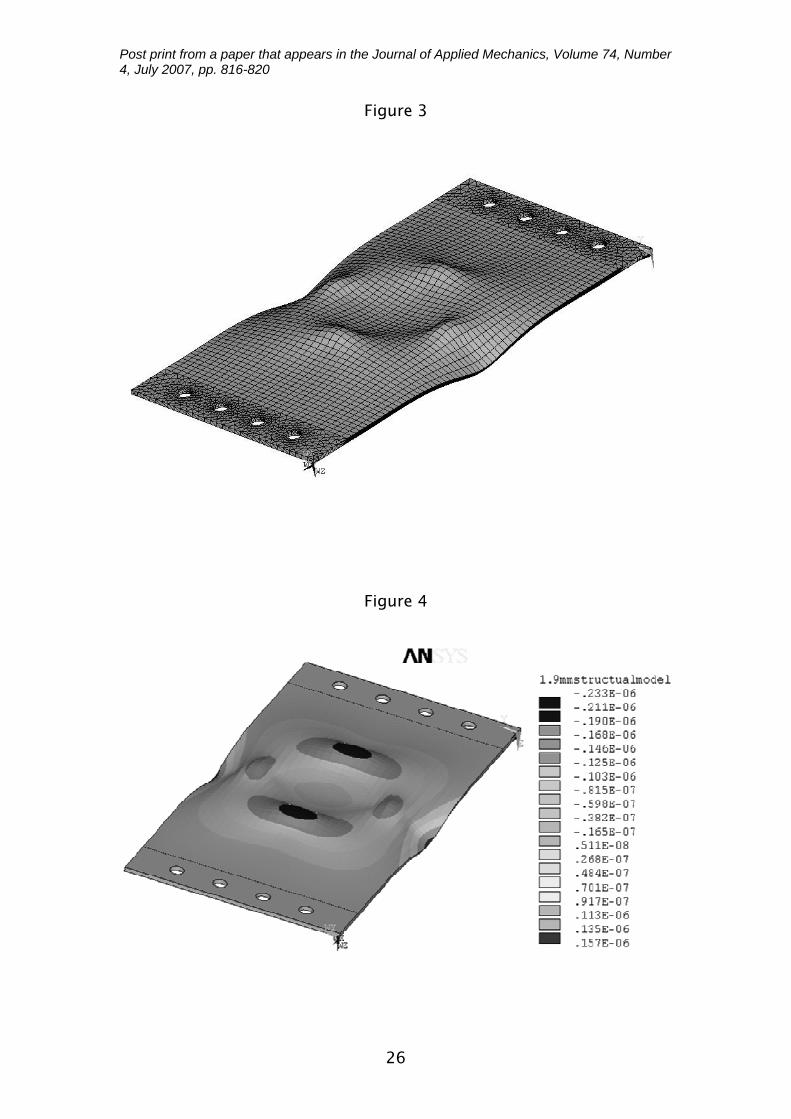
The second model was a structural model of the plate. The plate was
drawn in ANSYS as in the previous model with the same boundary
conditions. Then forces of 10N per PZT were applied to the model of
the plate in the positions where the PZTs are attached, across 3 nodes.
By modelling the forces produced by the PZTs, the stress within the
plate model can be examined and the deformed plate can be analysed.
This model gives an indication of the way in which plate is forced to
vibrate and the dimensions at which the plate will deform when the
forces are applied. The structural model was used to understand how
the plate is excited by the PZTs and whether the position of the piezo-
actuators can be optimised to give better experimental results.
The structural model of the 1.9 mm thick aluminium plate, Figure 4
shows that the compressive forces applied by PZTs to the underside of
the plate model deform the plate in this manner. The four
protuberances on the surface of the plate model are directly above the
positions of the forces representing the PZTs in the model; the
deformation shown in the model is to an exaggerated scale.
Figure 5 shows that the displacement perpendicular to the surface of
the plate has
a maximum value of 0.233 µm. The maximum displacement within the
plate is found where the longitudinal PZTs are positioned.
When the PZTs are driven with a sinusoidal signal the forces are
applied in an oscillatory manner, the deformation will occur as shown
in Figures 4 and 5. The plate will also deform similarly in the opposite
direction with respect to the surface, reciprocally every cycle of the
10
Post print from a paper that appears in the Journal of Applied Mechanics, Volume 74, Number 4, July 2007, pp. 816-820
sine signal. This deformation of the plate will excite it, vibrating it to
the supply frequency of the PZTs.
The shape of the deformed plate as seen in this model will not
necessarily be the shape that the plate will vibrate at. Flexural
vibrations of the plate are at maximum displacement amplitude when
the vibration of the plate is at a resonant frequency of the plate. To
achieve maximum resonant frequency displacement amplitude, the
position of the applied forces to the underside of the plate is critical. If
the position of the PZTs deforms the plate in a shape that is similar to
the modal shape of the plate at the applied frequency, then the
resonant vibrations of the plate will be of higher displacement and
more forceful, this should produce a better NFAL effect.
By examining Figures 4 and 5 it can be seen that the PZTs deform the
plate differently when orientated in different positions. Relating the
position of the PZTs to the optimum position is partly a trial and error
process as the modes of vibration of the plate have been modelled but
it is difficult to perceive which modes will be better at producing the
NFAL effect without experimentation. This is due to the displacement
values of the modal structure being given in relative distance rather
than actual distances. This structural model of the plate will be
compared with the results to attempt to find optimum positioning of
the PZTs.
4. Experimental apparatus and procedures
11
Post print from a paper that appears in the Journal of Applied Mechanics, Volume 74, Number 4, July 2007, pp. 816-820
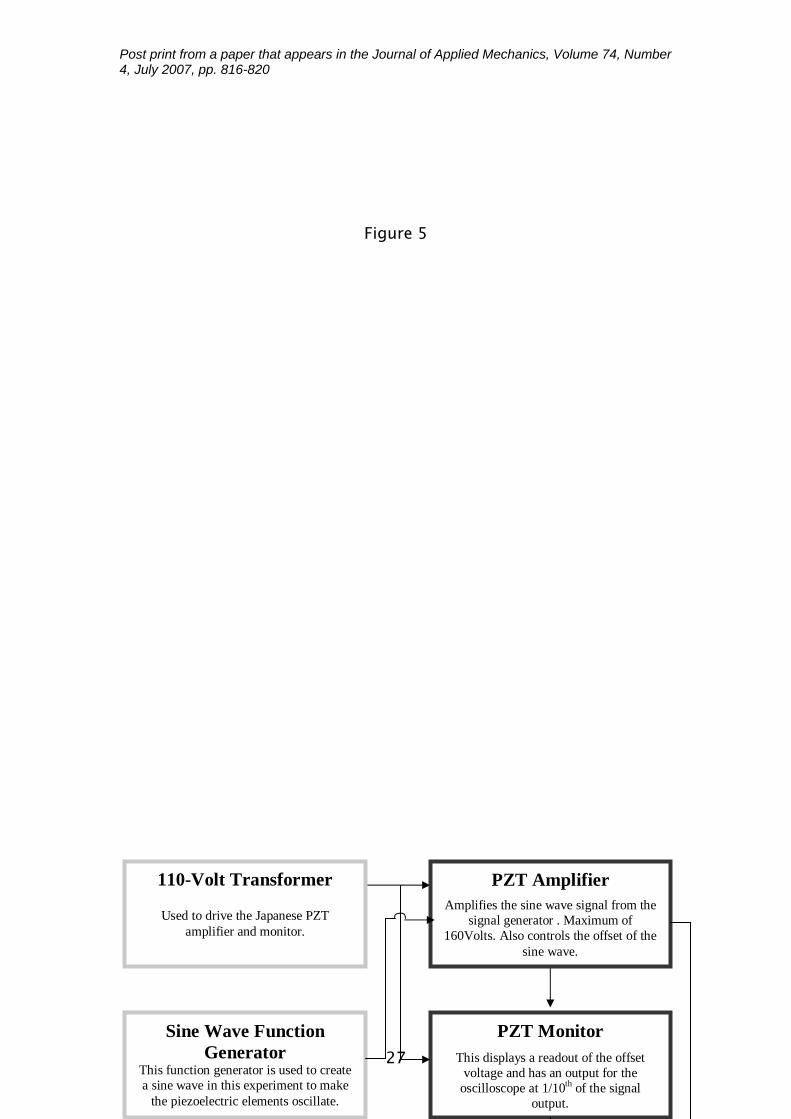
Flow chart, shown in Figure 6, illustrates the experimental set up of
the apparatus. The flow chart shows the various components used
throughout the experiment and the connections between them.
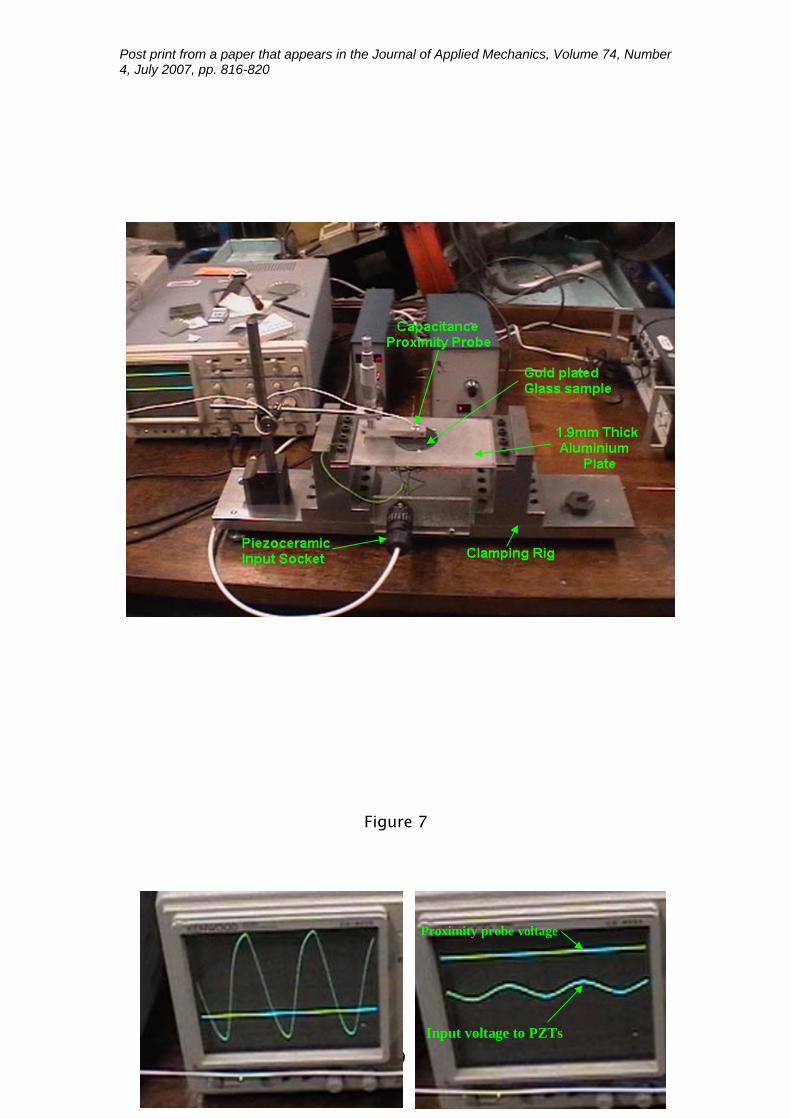
The apparatus, as used during experimental investigations, is shown
in Figure 7. The input equipment as shown in Figure 6, consists of an
110V transformer and a sine wave signal generator. The 110 V
transformer has to be used to drive the ultrasonic PZT amplifier and
the PZT monitor. The sine wave signal generator is needed to create
the sinusoidal frequency required to drive the PZTs attached to the
plate. This sine wave generator is operated between the frequency
range of 10 - 60 kHz and it goes well into the ultrasonic region. This
is also useful for application purposes as in ultrasonic region the NFAL
does not emit audible noise.
Two experiments of fundamental importance for the concept of NAFL
were carried out, namely (i) voltage amplitude versus levitation
distance and
(ii) supported load per unit area (surface density) versus levitation
distance.
In order to find out the relationship between the voltage amplitude
and levitation distance, the following steps were taken:
1. Both the surface of vibration plate and the sample to be levitated were
thoroughly cleaned. Then the gold plated sample, either glass or
acrylic disc, was positioned in the centre of the vibrating plate with the
proximity probe directly above it. The amplitude of the input signal to
12
Post print from a paper that appears in the Journal of Applied Mechanics, Volume 74, Number 4, July 2007, pp. 816-820
the amplifier was increased until the amplitude of signal to the PZTs
was at 160 V as measured on the oscilloscope screen.
2. The proximity probe was then lowered to get a reasonable reading of
voltage. The voltage had to be low enough to fit on the oscilloscope
scale with a high resolution so that all of the distance measurements
consisted of measurements of at least 20% of the vertical height of the
oscilloscope screen.
3. The first reading of the maximum separation distance was found by
lowering the amplitude of the input signal to zero, as shown in Figure
8. The difference in voltage of the horizontal line (the proximity probe
output) was recorded and is directly proportional to the levitation
distance. This difference in voltage between the two conditions is the
“separation voltage”. Then the amplitude was increased again to the
same point of 160 V, and lowered again to zero, here another reading
was taken. This was repeated 4 times so that an average of the four
readings could be used for results processing.
4. Now to take further readings, the amplitude of the signal input voltage
was reduced by the step length (typically 10 V per step was used) and
four results were recorded for each amplitude voltage in the same
manner as the maximum separation voltage described step 3.
Throughout the decrease of the amplitude of the input signal voltage,
the proximity probe was lowered to ensure the measurement
resolution was kept to 20% of the oscilloscope screen per
measurement. In addition, the levitating sample was lightly touched
with a small piece of plastic before each amplitude change to ensure
13
Post print from a paper that appears in the Journal of Applied Mechanics, Volume 74, Number 4, July 2007, pp. 816-820
that the sample was still levitating and was not getting stuck on the
surface of the plate by any contaminants.
Relationship between supported load per unit area (surface density)
versus levitation distance was established utilising procedure
described above. In addition to that the following steps were taken:
1. The first voltage reading is proportional to the separation distance of
load per unit area of the levitating sample. For this first reading the
load per unit area (surface density) was simply the weight of the
sample divided by the area of the bottom surface of the levitating
sample.
2. The next reading was carried out as described in step 3 above. The
amplitude of the input signal voltage was not changed and stayed at
160 V. However, a mass to increase the load per unit area was placed
on the levitating sample. This slightly decreased the separation
distance between the levitating sample and the vibration plate.
3. This procedure was repeated for the required loads to be tested to
give a set of results to analyse the separation distance versus load per
unit area. Masses used to vary the load per unit area were from 1 g to
15 g in 1 g intervals. Afterwards, 5 g intervals were used until the
suppression of levitation, which happened, typically, around 80-90 g.
5. Results and discussion
The testing began with 1.9 mm thick aluminium plate and the
lengthways orientation of the PZTs. A preliminary experiment was
carried out according to the experimental procedure described earlier.
14
Post print from a paper that appears in the Journal of Applied Mechanics, Volume 74, Number 4, July 2007, pp. 816-820
Gold plated glass disc was used as levitation sample and the plate was
operated at a resonant frequency of 25.6 kHz, which was found to be
the most powerful ultrasonic resonant frequency.
5.1 Effect of PZT orientation
The experimental findings showed that the levitation distance of the
floating sample was less than 5 µm at full peak to peak voltage. In
order to increase the levitation distance of the floating sample two
additional PZTs were added to the vibration plate laterally across the
centre of the plate now giving the plate 4 PZTs. The levitation
distances obtained with the additional elements were much higher.
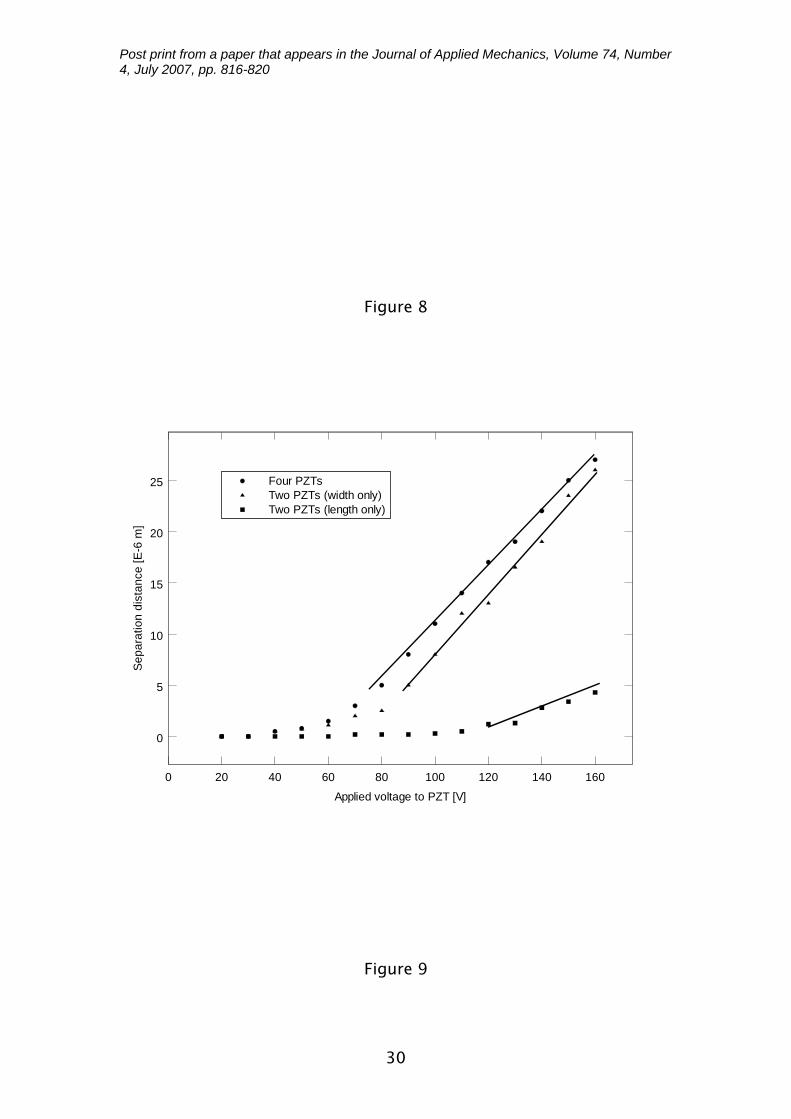
The results of the different orientations of the PZTs are shown in
Figure 9. It is clearly shown that the levitation distance is almost
entirely dependant upon the laterally aligned PZTs and the
longitudinally aligned elements do not contribute much to the NFAL
effect. As the graph shows, the levitation distance versus input voltage
amplitude relationship seems to be a reasonably linear for the laterally
applied PZTs when just the values above the 5 µm separation distance
are considered. This can also be said for the PZTs orientated
longitudinally for voltage amplitudes greater then 120 V peak to peak.
However, the separation distances achieved with this orientation of the
PZTs is far less than the laterally orientated ones. In fact, the levitation
distances attained do not even go above the critical separation
distance of 5 µm and so these results could be disregarded altogether
15
Post print from a paper that appears in the Journal of Applied Mechanics, Volume 74, Number 4, July 2007, pp. 816-820
as true levitation of the sample may not be fully achieved here and
there may still be contact with the vibration plate below.
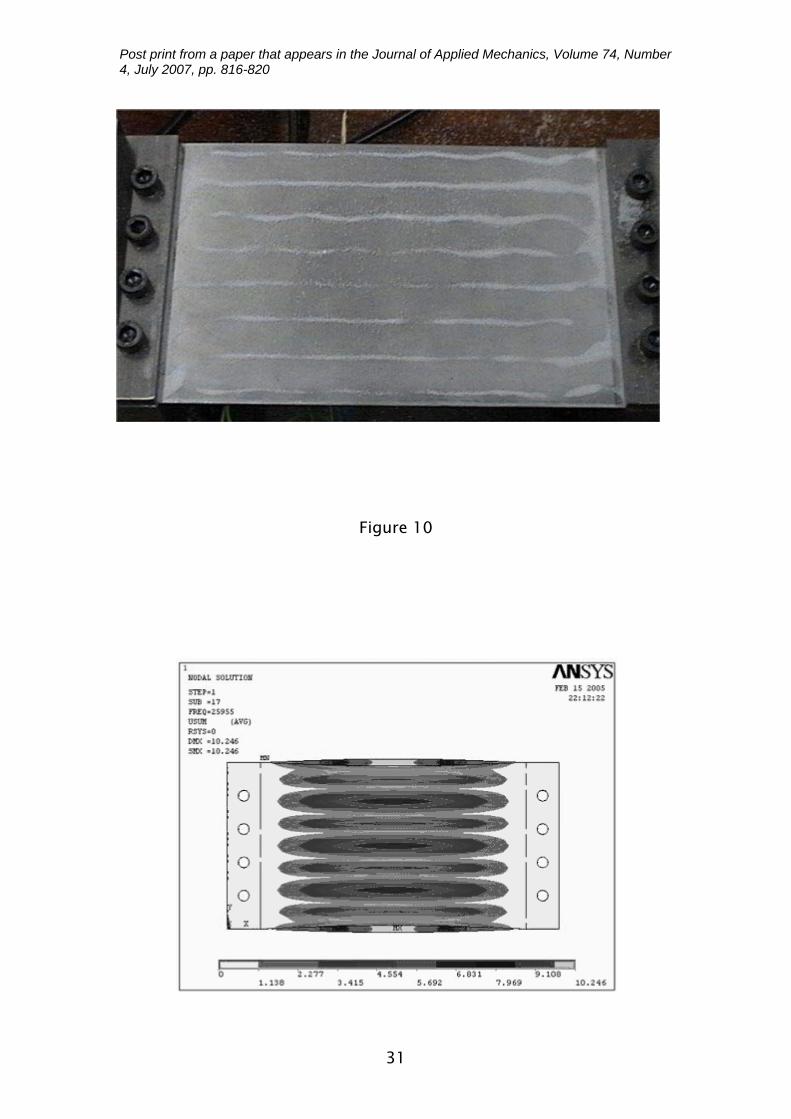
The reason for the orientation of the PZTs affecting the performance of
the NFAL so dramatically is thought to be that the lateral PZTs excite
the plate in this mode of vibration much more. This can be clarified by
looking at the modal shape of the plate at the frequency of 25.6 kHz,
shown in Figure 10. This figure demonstrates the modal shape of the
plate when at its resonant frequency of 25.6 kHz. To achieve a pattern
depicting the modal shape of the vibrating plate, caster sugar was
simply poured onto the plate and the sugar particles gathered around
nodes - the points between the oscillating crests and troughs of a
standing wave of the flexural wave of the plate. The sugar particles
gathered here because the nodes are stationary positions of the plate
and so permit the sugar particles to reside. This mode appeared to
displace the most perpendicular to the surface of the plate in
comparison with other resonant frequencies found between the
frequencies of 20-50 kHz. This was found both with the maximum
levitation distance achieved at this frequency and the sugar particles
being most vigorous at this frequency, as they are forced off the
oscillatory parts of the plate. The experimental modal shape at this
frequency agrees well with the modal shape found within FEA
modelling at a frequency of 25.955 kHz (see Figure 11). This is the
only modal shape found that has eight longitudinal nodes of flexural
vibration and the frequency is very close (within 1.4%) to the frequency
found during testing.
16
Post print from a paper that appears in the Journal of Applied Mechanics, Volume 74, Number 4, July 2007, pp. 816-820
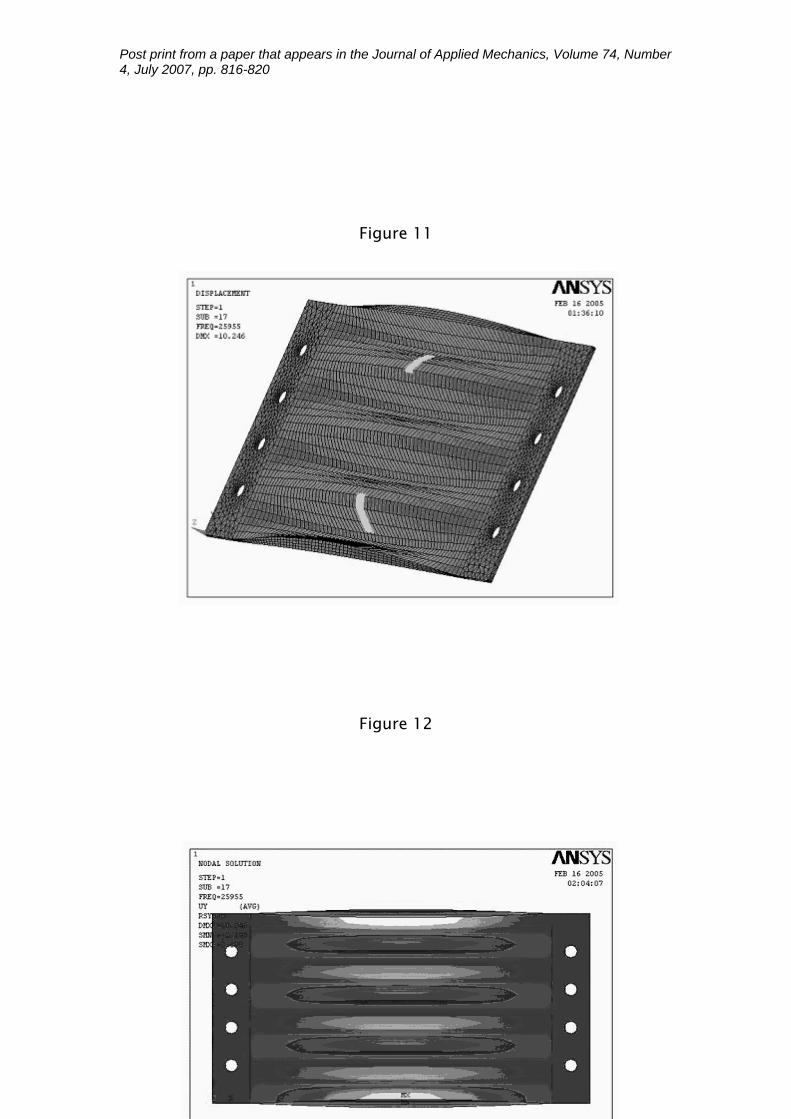
The deformed shape of the model (see Figure 12) shows, in an
exaggerated scale, the modal shape of the plate when vibrating at the
frequency of 25.96 kHz model. It can be seen from Figure 12 that the
reason that the PZTs excited the plate in this mode much better when
mounted laterally, is because the force of the elements was applied
across the peak of a flexural wave. Unlike in the longitudinal direction,
this orientation of the PZTs resulted in plate deformation similar to the
plate’s modal shape at this frequency. This explains why the lateral
PZTs produced a levitation distance that is over 6 times higher than
that obtained with the longitudinal PZTs. The best position for the
elements to be in would be centred on a crest of one of the
peaks/troughs as the shape oscillates between the two. In this position
the maximum displacement of the PZT can be utilized as this position
of the flexural wave is where the maximum lateral displacement occurs
(see Figure 13). The crests of the flexural wave of the plate are shown
to be the most laterally displaced positions locally over the length of a
PZT (10mm) in Figure 13.
Positioning the lateral PZTs centrally over the crest of the plate flexural
waves could increase the levitation distance of the NFAL effect even
further, as the current position of the elements is not centrally over
the crest of the waves. If the NFAL effect were to be increased even
further, then several PZTs of the same dimensions used in this
experiment could be positioned on the underside of the plate placing
each PZT over the crest of one of the flexural waves of the plate.
17
Post print from a paper that appears in the Journal of Applied Mechanics, Volume 74, Number 4, July 2007, pp. 816-820
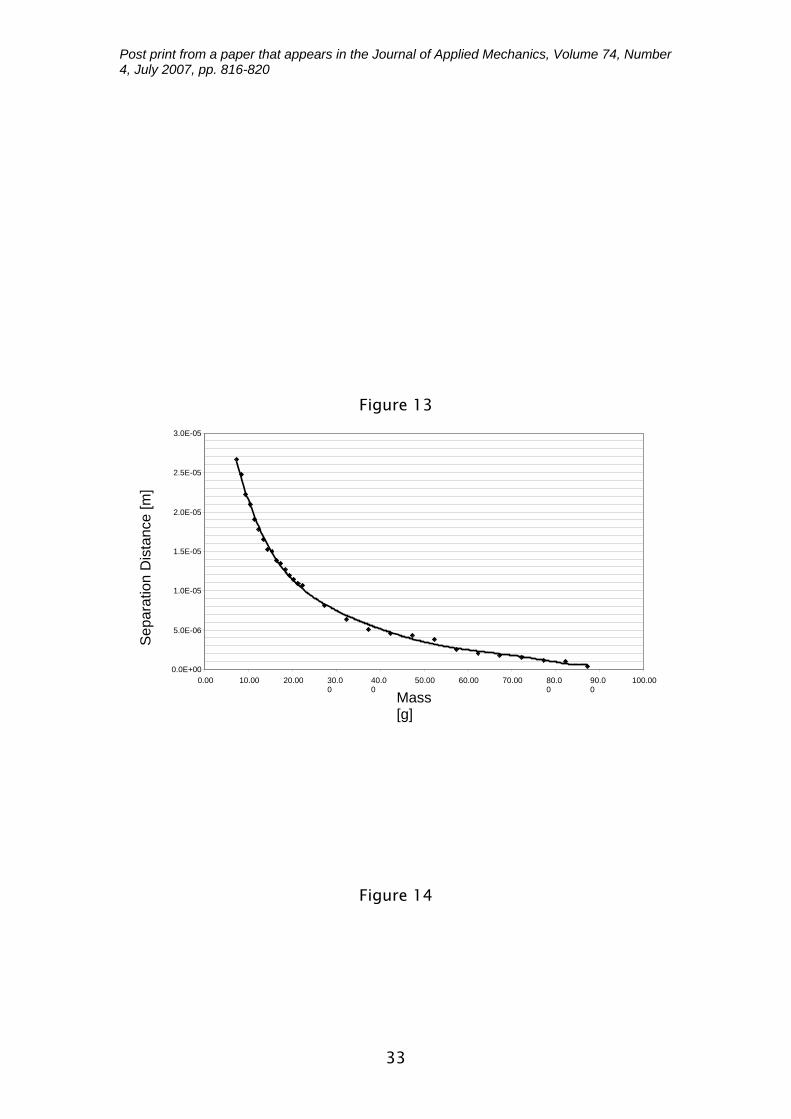
5.2 Load carrying capacity
Aluminium plate with 1.9 mm thickness was used and operated at the
frequency of 25.6 kHz. Levitating specimen was the gold plated glass
disc. The results obtained from the testing are shown in Figure 14.
This figure shows the combined mass of the levitating sample versus
the separation distance achieved for the fixed voltage input amplitude.
It appears that the levitation distance is inversely proportional to the
square root of the weight per unit area of the floating specimen in al
flexural modes, that is,
mkL 1
= (1)
where L is the separation distance, m is the mass of floating specimen
and k is a constant. In order to prove the correlation with the above
equation the results shown in Figure 14 were re-plotted but this time
in a graph of levitation distance versus the inverse of the root of the
total mass on the levitating object. It is seen from Figure 15 that a
linear relationship was obtained.
The levitation distance was found to be proportional to the inverse
root of the total mass of floating object with the proportionality
constant k equal to 1*10-4.
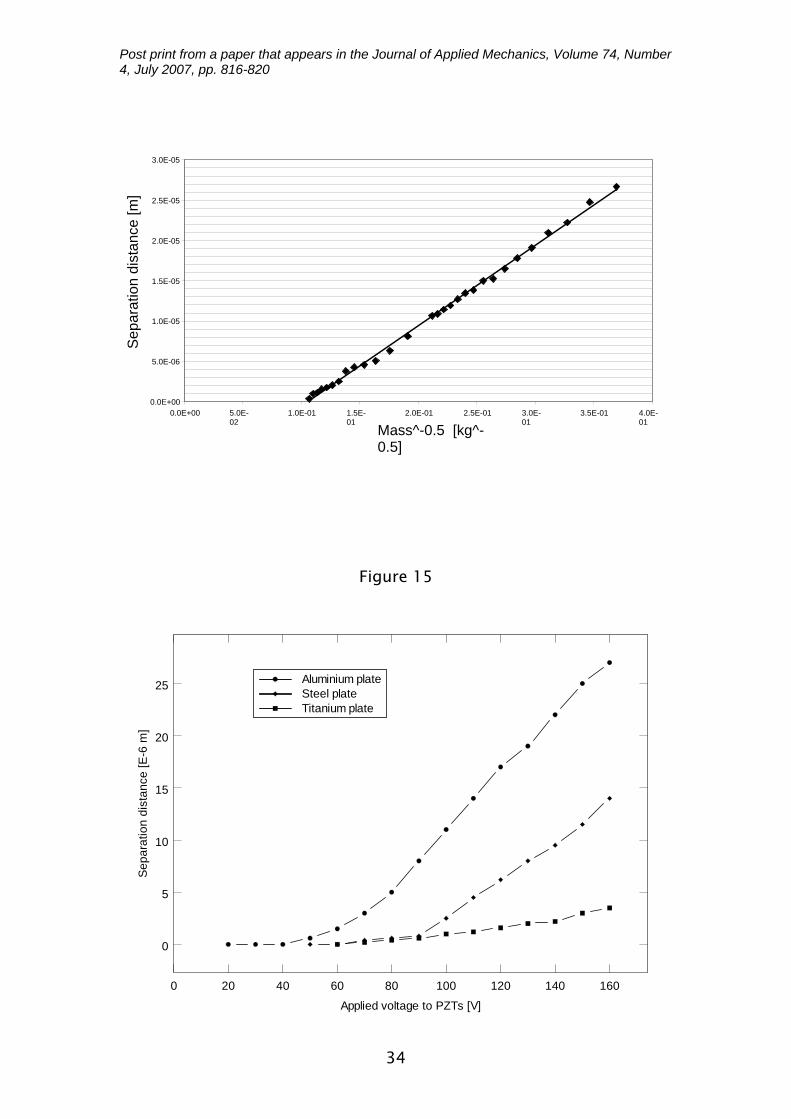
5.3 Effect of vibrating plate material
In order to ascertain the effect of plate material on levitation two
additional plates, 1.6 mm thick titanium plate and 1.1 mm thick steel
plate were made and tested. In Figure 16, the results obtained are
18
Post print from a paper that appears in the Journal of Applied Mechanics, Volume 74, Number 4, July 2007, pp. 816-820
compared with the set of results found for the aluminium plate of
1.9mm thickness.
As the results show, the 1.9 mm aluminium plate produces the largest
separation distances. The 1.1 mm steel plate produces the next
highest separation distances and then the 1.6 mm titanium plate
produces separation distances that have been recorded but are all
below the 5 µm level.
In the attempt to understand the differences between the NFAL effect
when using these materials, the mass of each plate must be taken into
consideration. The masses involved were: 172.9 g, 144.8 g, and 103.5
g for steel, titanium and aluminium plates respectively. Lighter plates
should give better NFAL effects as they can be accelerated greater with
the same force and so the flexural wave should have higher
amplitudes of displacement. This appears to be true at first as the
aluminium plate did produce the greatest vibrations however the steel
plate, which is the heaviest plate of the three, is not the worst plate in
regards to levitation distance. The distances produced with the steel
plate were higher than the ones produced with the titanium plate.
The reason for this non-correlation of mass of plate versus levitation
distance may be because the modal shape for each plate is dependant
on the dimensions of the plate and the material properties namely the
Young’s modulus, Poisson’s ratio and the density of the material. In
order for any material to produce a large NFAL effect the plate must
have a modal shape at an achievable frequency with a given equipment,
the PZTs must by positioned and orientated in an optimal way so that
19
Post print from a paper that appears in the Journal of Applied Mechanics, Volume 74, Number 4, July 2007, pp. 816-820
maximum displacement of the plate is possible perpendicular to the
surface of the plate. The 1.9mm aluminium plate achieved these goals
better than the other plates and so outperformed them by producing a
larger separation distance.
6. Conclusions
Based on obtained results the following conclusions can be drawn.
(i) Existence of NFLA effect has been experimentally confirmed.
(ii) For the 1.9mm aluminium plate, a reasonably linear
relationship was found to exist between the PZT input voltage
and the levitation distance at the frequency of 25.6 kHz. This
can also be said for the titanium, and steel plates at their
respective frequencies.
(iii) A relationship between surface density and separation
distance for the 1.9mm aluminium plate at a frequency of
25.6 kHz was found to exist, as given by equation (1).
(iv) The orientation and position of the PZTs was found to be one
of the most important factors controlling the effectiveness of
the NFAL phenomenon. It has been found that attaching the
elements in a suitable position on the plate is dependant
upon the modal shape produced at the operating frequency
of the vibrating plate and the dimensions of the PZTs.
(v) Computer modelling results of modal shape agree well with
experimental findings. Both the modal shape and the
frequency at which it is produced show excellent correlation.
20
Post print from a paper that appears in the Journal of Applied Mechanics, Volume 74, Number 4, July 2007, pp. 816-820
(vi) Vibration plate material greatly affects the separation
distance created with the NFAL effect. This is because the
modal shape and resonant frequencies, closely governing the
NFAL effect, were also altered by the material.
7. References
[1] E. Matsuo, Y. Koike, K. Nakamura, S. Ueha, Y. Hashimoto; Holding
characteristics of planar objects suspended by near-field acoustic
levitation, Ultrasonics, 38, 60-63, 2000.
[2] S. Ueha, Y. Hashimoto, Y. Koike; Non-contact transportation using
near-field acoustic levitation, Ultrasonics, 38, 26-32, 2000.
[3] Y. Hashimoto, S. Ueha; Near field acoustic levitation of planar
specimens using flexural vibration, J. Acoust. Soc. America, 100,
2057-2061.
[4] A. Menon; Essential requirements for 100 Gbits/in2 head/media
interface, Proc. Intern. Trib. Conf., Nagasaki, Japan, 2000.
[5] C.I. Woolliscroft; Ultrasonic Acoustic Levitation, Mechanical
Engineering, School of Engineering and Design, Brunel University, June,
2005.
21

Post print from a paper that appears in the Journal of Applied Mechanics, Volume 74, Number 4, July 2007, pp. 816-820
Figure captions
Figure 1 Piezoelectric driven plate and levitating sample.
Figure 2 Three-dimensional drawing of testing rig.
Figure 3 Vibration plate with four PZTs bonded to the underside of the plate.
22

Post print from a paper that appears in the Journal of Applied Mechanics, Volume 74, Number 4, July 2007, pp. 816-820
Figure 4 Structural model of 1.9mm thick aluminium plate, deformed with 4 PZTs.
Figure 5 Contour plot of Z-axis displacement, 1.9mm aluminium model.
Figure 6 Flow chart of the apparatus and connections between its main components.
Figure 7 Apparatus set-up. Figure 8 Oscilloscope output screen, no levitation (right), levitating sample (left).
Figure 9 Graph of separation distance versus voltage across PZTs, for three orientations of the PZTs, at 25.6 kHz.
Figure 10 The pattern of sugar upon the plate when resonating at 25.6 kHz.
Figure 11 Modal shape of the plate at 25.955 kHz.
Figure 12 Exaggerated model of the modal shape of the plate when excited to resonant frequency of 25.955 kHz.
Figure 13 Contour plot of lateral displacement when in modal shape at frequency of 25.955 kHz.
Figure 14 Separation distance versus total mass of levitating sample.
Figure 15 Separation distance versus inverse root of the total mass of the levitation object.
Figure 16 Separation distance versus applied voltage input for aluminium (1.9 mm thickness), titanium (1.55 mm thickness) and steel (1.1 mm thickness) plates.
23

Post print from a paper that appears in the Journal of Applied Mechanics, Volume 74, Number 4, July 2007, pp. 816-820
Figures
Figure 1
24
Post print from a paper that appears in the Journal of Applied Mechanics, Volume 74, Number 4, July 2007, pp. 816-820
Figure 2
25
Post print from a paper that appears in the Journal of Applied Mechanics, Volume 74, Number 4, July 2007, pp. 816-820
Figure 3
Figure 4
26
Post print from a paper that appears in the Journal of Applied Mechanics, Volume 74, Number 4, July 2007, pp. 816-820
Figure 5
27
110-Volt Transformer
Used to drive the Japanese PZT amplifier and monitor.
PZT Amplifier
Amplifies the sine wave signal from the signal generator . Maximum of
160Volts. Also controls the offset of the sine wave.
PZT Monitor
This displays a readout of the offset voltage and has an output for the
oscilloscope at 1/10th of the signal output.
Sine Wave Function Generator
This function generator is used to create a sine wave in this experiment to make
the piezoelectric elements oscillate.

Post print from a paper that appears in the Journal of Applied Mechanics, Volume 74, Number 4, July 2007, pp. 816-820
Figure 6
28
Post print from a paper that appears in the Journal of Applied Mechanics, Volume 74, Number 4, July 2007, pp. 816-820
Figure 7
29
Proximity probe voltage
Input voltage to PZTs
Post print from a paper that appears in the Journal of Applied Mechanics, Volume 74, Number 4, July 2007, pp. 816-820
Figure 8
Figure 9
0 20 40 60 80 100 120 140 160
Applied voltage to PZT [V]
0
5
10
15
20
25
Sepa
ratio
n di
stan
ce [E
-6 m
]
Four PZTsTwo PZTs (width only)Two PZTs (length only)
30
Post print from a paper that appears in the Journal of Applied Mechanics, Volume 74, Number 4, July 2007, pp. 816-820
Figure 10
31
Post print from a paper that appears in the Journal of Applied Mechanics, Volume 74, Number 4, July 2007, pp. 816-820
Figure 11
Figure 12
32
Post print from a paper that appears in the Journal of Applied Mechanics, Volume 74, Number 4, July 2007, pp. 816-820
Figure 13
Figure 14
2.5E-05
3.0E-05
ass ]
Sep
arat
ion
Dis
tanc
e [m
]
0.0E+00
5.0E-06
1.0E-05
1.5E-05
2.0E-05
0.00 10.00 20.00 30.00
40.00
50.00 60.00 70.00 80.00
90.00 100.00
M[g
33
Post print from a paper that appears in the Journal of Applied Mechanics, Volume 74, Number 4, July 2007, pp. 816-820
Figure 15
0.0E+00
5.0E-06
1.0E-05
1.5E-05
2.0E-05
2.5E-05
3.0E-05
0.0E+00 5.0E-02
1.0E-01 1.5E-01
2.0E-01 2.5E-01 3.0E-01
3.5E-01 4.0E-01
Mass^-0.5 [kg^-0.5]
Sep
arat
ion
dist
ance
[m]
0 20 40 60 80 100 120 140 160
Applied voltage to PZTs [V]
0
5
10
15
20
25
Sepa
ratio
n di
stan
ce [E
-6 m
]
Aluminium plateSteel plateTitanium plate
34

Post print from a paper that appears in the Journal of Applied Mechanics, Volume 74, Number 4, July 2007, pp. 816-820
Figure 16
35

Post print from a paper that appears in the Journal of Applied Mechanics, Volume 74, Number 4, July 2007, pp. 816-820
36