Embed Size (px)
Citation preview
Nanoscale
PAPER
Cite this: Nanoscale, 2016, 8, 7723
Received 15th January 2016,Accepted 6th March 2016
DOI: 10.1039/c6nr00371k
www.rsc.org/nanoscale
Self-healing gold mirrors and filters atliquid–liquid interfaces†
Evgeny Smirnov,a Pekka Peljo,a Micheál D. Scanlon,b Frederic Gumya andHubert H. Girault*a
The optical and morphological properties of lustrous metal self-healing liquid-like nanofilms were sys-
tematically studied for different applications (e.g., optical mirrors or filters). These nanofilms were
formed by a one-step self-assembly methodology of gold nanoparticles (AuNPs) at immiscible water–oil
interfaces, previously reported by our group. We investigated a host of experimental variables and herein
report their influence on the optical properties of nanofilms: AuNP mean diameter, interfacial AuNP
surface coverage, nature of the organic solvent, and nature of the lipophilic organic molecule that caps
the AuNPs in the interfacial nanofilm. To probe the interfacial gold nanofilms we used in situ (UV-vis-NIR
spectroscopy and optical microscopy) as well as ex situ (SEM and TEM of interfacial gold nanofilms trans-
ferred to silicon substrates) techniques. The interfacial AuNP surface coverage strongly influenced the
morphology of the interfacial nanofilms, and in turn their maximum reflectance and absorbance. We
observed three distinct morphological regimes; (i) smooth 2D monolayers of “floating islands” of AuNPs at
low surface coverages, (ii) a mixed 2D/3D regime with the beginnings of 3D nanostructures consisting of
small piles of adsorbed AuNPs even under sub-full-monolayer conditions and, finally, (iii) a 3D regime
characterised by the 2D full-monolayer being covered in significant piles of adsorbed AuNPs. A maximal
value of reflectance reached 58% in comparison with a solid gold mirror, when 38 nm mean diameter
AuNPs were used at a water–nitrobenzene interface. Meanwhile, interfacial gold nanofilms prepared with
12 nm mean diameter AuNPs exhibited the highest extinction intensities at ca. 690 nm and absorbance
around 90% of the incident light, making them an attractive candidate for filtering applications. Further-
more, the interparticle spacing, and resulting interparticle plasmon coupling derived optical properties,
varied significantly on replacing tetrathiafulvalene with neocuproine as the AuNP capping ligand in the
nanofilm. These interfacial nanofilms formed with neocuproine and 38 nm mean diameter AuNPs, at
monolayer surface coverages and above, were black due to aggregation and broadband absorbance.
Introduction
Currently, mirrors and filters are produced industrially by thinfilm technology.1 The manufacturing process is technicallychallenging, requiring large metal evaporation chambers oper-ating under vacuum conditions and clean-room environments.A proposed industrially viable alternative approach towards
the development of thin film optical technology, potentiallycircumventing the need for such stringent, complex and costlyprocess environments, is the controlled large-scale self-assem-bly of nanoparticles (NPs) with tunable optical responses onvarious substrates2,3 and interfaces.4–8 In this regard, metallicNPs, which possess Localized Surface Plasmon Resonance(LSPR) in the visible or near-infrared (NIR) range of the electro-magnetic spectrum, open new avenues towards the develop-ment of scalable, low cost mirrors and filters.9–12 The opticalresponses of the latter are tunable (i) by the intrinsic pro-perties of the individual NPs, with the optical properties ofnoble metallic NPs such as silver (AgNPs) or gold (AuNPs)dependent on their size and shapes, and (ii) by the packingarrangements and spacing between individual NPs in theassemblies.7,13–15
There are two main disadvantages of self-assembly pro-cesses at liquid–solid interfaces: expansion across films onlarge-scales, and poor reproducibility between process batches.
†Electronic supplementary information (ESI) available: Interfacial tensionmeasurements for various water–organic solvent systems, step-by-step opticalmicroscopy and SEM characterization of the obtained film, optical photographsof all tested solvents and molecules, and influence of the interfacial tension onoptical responses of AuNPs assemblies. See DOI: 10.1039/c6nr00371k
aLaboratoire d’Electrochimie Physique et Analytique, Ecole Polytechnique Fédérale de
Lausanne, Rue de l’Industrie 17, CH-1951 Sion, Switzerland.
E-mail: [email protected] of Chemistry, the Tyndall National Institute and the Analytical &
Biological Chemistry Research Facility (ABCRF), University College Cork, Cork,
Ireland
This journal is © The Royal Society of Chemistry 2016 Nanoscale, 2016, 8, 7723–7737 | 7723
Publ
ishe
d on
07
Mar
ch 2
016.
Dow
nloa
ded
by E
CO
LE
PO
LY
TE
CH
NIC
FE
D D
E L
AU
SAN
NE
on
01/0
4/20
16 1
7:22
:11.
View Article OnlineView Journal | View Issue
In contrast, liquid–liquid interfaces are inherently defect-freeand, furthermore, both mechanically flexible, and possessingself-recovery characteristics.16–20 Thus, liquid–liquid interfacesrepresent an ideal system to perform self-assembly of apanoply of species, ranging from molecules21,22 to NPs14,23,24
to microparticles,25 into two-dimensional ordered films. Thelatter for NPs has been recently reviewed in detail.26 Cruciallyfor the production of optical technology, NP films (nanofilm)at liquid–liquid interfaces remain stable for time periodsranging from months to years.24,27
Since Yogev and Efrima28 first described the formation ofmetal liquid-like films upon the reduction of silver salts atliquid–liquid interfaces, many other methods have been intro-duced to form such nanofilms, e.g. addition of ethanol ormethanol to the interfacial region,23,29,30 precise injection ofcolloidal AuNP solutions prepared in methanol at water–organic solvent interfaces,31 use of salts,32 solvent evapor-ation,33 covalent bonding14,34,35 and self-assembly provided byelectrostatic interactions.36–38 Applications of these self-assembled nanofilms include filters, mirrors5,39 or smartmirrors,40 substrates for Surface Enhanced Raman Spectro-scopy (SERS),41–44 and enhancement of non-linear SecondHarmonic Generation (SHG) optical responses.45–47 Finally,these nanofilms were used to achieve electrocatalysis at electri-cally polarized liquid–liquid interfaces.48,49
Recently, our group introduced a facile biphasic method toself-assemble nanofilms of AuNPs at water–1,2-dichloroethane(DCE) interfaces with controllable interfacial AuNP surface cov-erages (θAuNP
int ).24 Briefly, a lipophilic species (tetrathiafulva-lene; TTF) was present in the DCE phase and which came intocontact with an aqueous solution of citrate-stabilized AuNPs.Upon vigorous mechanical shaking, TTF displaced the citrateligands from the surface of the AuNPs and, in turn, underwentFermi-level equilibration with the AuNPs becoming oxidized toTTF+• or possibly, but less likely, to TTF2+. These TTF+• coatedAuNPs were entrapped at the liquid–liquid interface upon ces-sation of shaking. We postulate that the TTF+• molecules actboth as a “glue”, holding the AuNPs together due to π–π-inter-actions between TTF molecules, and as a “lubricant” permit-ting the reproducible self-healing behavior of the interfacialgold nanofilm after substantial perturbations, such as vigorousmechanical shaking. In this context, self-healing means thatthe gold nanofilm retains its metallic lustrous properties aftersubstantial perturbations. Thus, the TTF molecule preventsirreversible AuNP aggregation at the liquid–liquid interfacewhich would destroy the optical properties of the lustrousnanofilm.24 Finally, the optical extinction spectra and observedvisual appearance of the interfacial AuNP assemblies variedsubstantially depending on the mean-diameters of the individ-ual AuNPs used to create them.24
Herein, we optimized the biphasic experimental conditionsto produce self-assembled interfacial gold nanofilms withsuitable optical responses for gold mirror or filter applications.To this end, we carried out an in situ comparative study of theoptical responses (extinction and reflectance) of self-assembled and self-healing interfacial gold nanofilms with (i)
different mean diameters (12 and 38 nm Ø), (ii) at variousθAuNPint values, (iii) using several organic solvents to form water–
organic interfaces with different interfacial surface tensions(γw/o), and (iv) using alternative lipophilic molecules, such asneocuproine (NCP),7 in the organic droplet instead of TTF.
We identified an optimal value of θAuNPint at water–DCE inter-
faces that permitted the maximum coverage of the interfacewith a 2D monolayer (enhancing reflectance) without thepresence of substantial 3D piles of AuNPs. These piles causedthe incident light to scatter (diminishing the optical response).We demonstrated that the interparticle spacing between AuNPsin the interfacial nanofilms, and thus their plasmon couplingand optical properties, can be varied significantly by replacingTTF in the organic phase with NCP. Overall, the best opticalresponses were obtained at water–nitrobenzene interfaces.
ExperimentalChemicals
Tetrachloroauric acid (HAuCl4, 99.9%), neocuproine (NCP) andtetrathiafulvalene (TTF) were received from Aldrich. Citratetrisodium dihydrate (Na3C6H5O7·2H2O), 1,2-dichloroethane(DCE), nitrobenzene (NB), and nitromethane (MeNO2) were pur-chased from Fluka, whereas α,α,α-trifluorotoluene (TFT) wasreceived from Acros. Silver nitrate (AgNO3) was bought fromChempur and ascorbic acid (C6H8O6) from Riedel-de-Haen. Allchemicals were used as received without further purification. Inall experiments Millipore water (18.2 MΩ cm) was used.
Preparation of aqueous colloidal AuNP solutions and theircharacterization
Suspensions of AuNPs with various mean diameters were pre-pared using the seed-mediated growth method.29 Initially,seed AuNPs were synthesized.50,51 Briefly, 41.5 mg ofHAuCl4·3H2O was dissolved in 300 mL of deionized water in around-bottom flask with stirring. This solution was brought tothe boiling point and 9 mL of a 1% w/v trisodium citrate solu-tion was injected to form the 12 nm mean diameter AuNPs.Subsequently, to prepare the 38 nm mean diameter AuNPs byseed-mediated growth, 4 mL of 20 mM HAuCl4·3H2O with0.4 mL of 10 mM AgNO3 was added to 170 mL of deionizedwater. To this, under vigorous stirring, 15 mL of the 12 nm ØAuNP seed solution and 30 mL of 5 mM ascorbic acid solutionwere added by using a syringe pump in a drop-wise mannerwith a constant flow rate of 0.5 mL min−1.
The colloidal AuNP solutions were characterized by UV-Visspectroscopy using a standard Perkin Elmer, Lambda XLS+spectrophotometer with a 10 mm cell width. By analyzingthese spectra as described by Haiss et al.52 information on themean AuNP diameter and concentration of AuNPs in solutionwere obtained. Further analysis of the mean AuNP diameterand size distribution was accomplished by dynamic light scat-tering (DLS) measurements performed with a Nano ZS Zetasizer(Malvern Instruments, UK), with irradiation (λ = 633 nm) froma He–Ne laser, and using Dispersion Technology Software
Paper Nanoscale
7724 | Nanoscale, 2016, 8, 7723–7737 This journal is © The Royal Society of Chemistry 2016
Publ
ishe
d on
07
Mar
ch 2
016.
Dow
nloa
ded
by E
CO
LE
PO
LY
TE
CH
NIC
FE
D D
E L
AU
SAN
NE
on
01/0
4/20
16 1
7:22
:11.
View Article Online
(DTS). Transmission electron microscopy (TEM) images wereobtained using a FEI CM12 (Phillips) transmission electronmicroscope, operating with a LaB6 electron source at 120 kV.The size distributions of the AuNPs were estimated by usingImageJ software assuming that the AuNPs were spherical. Foreach sample 4 to 5 individual images were analysed, collectinginformation on more than 150 AuNPs.
Preparation of interfacial gold nanofilms and theircharacterization
Interfacial gold nanofilms were prepared using a biphasicmethod introduced by our group recently.24 The typical pro-cedure involves either sonicating or vigorously shaking of aliquid–liquid interface formed by an aqueous colloidal AuNPsolution and a droplet of an organic solvent (either DCE, TFT, NBor MeNO2) containing a lipophilic species (either TTF or NCP,typically 1 mM concentrations). Once the color of the agitatedsolution changed from red to bluish gray, the suspension wasleft to settle, resulting in an interfacial gold nanofilm coveringthe entire surface area of the organic droplet. This nanofilmhas self-healing nature meaning that the droplet restores its
original lustrous properties after being vigorously shaken forseveral times.
For scanning electron microscopy (SEM) and transmissionelectron microscopy (TEM) studies only, the interfacial AuNPnanofilms were transferred to a polished silicon substrate orTEM grid, respectively, by carefully dipping the solid supportin the organic droplet. These transferred nanofilms were thenanalyzed further by using a Merlyn (Zeiss, Germany) high-resolution scanning electron microscope (SEM) operating at3 kV with secondary electron detectors. The interparticle sizedistributions were estimated by using ImageJ software.For each AuNP sample, 2 to 3 individual HR-TEM images,obtained with the FEI CM12 (Phillips), were analyzed, collect-ing information on between 50 and 70 interparticle distances.
In situ optical images of interfacial nanofilms in horizontalmode were obtained with a standard BX41 laboratory micro-scope (Olympus).
UV-Vis-NIR spectra of the interfacial AuNP films wererecorded in situ at the liquid–liquid interface without transfer-ring the nanofilm to a solid substrate. Two separate configur-ations were investigated, total transmittance or extinction andtotal reflectance, as outlined in Scheme 1. The spectra were
Scheme 1 Extinction and reflectance spectra acquisition for interfacial gold nanofilms: in situ UV-Vis-NIR experimental configurations with a whiteintegrating sphere. (A) “Blank” (without the gold nanofilm coating the organic droplet) and (B) “Sample” (with the gold nanofilm coating the organicdroplet) extinction spectra were measured through two AuNP films at opposite walls of the quartz cuvette. (C) “Reference” extinction spectra wereobtained at a solid blue filter with an additional 2 mm quartz plate in front of it. (D) “Blank” and (E) “Sample” reflectance spectra were obtained at asingle interface on one side of the quartz cell. (F) “Reference” reflectance spectra were obtained at a solid gold mirror, separated from the sample-window with a 2 mm quartz plate, and corresponding to 100% reflectance. Q, w, org, NF, SBF and SGM are acronyms for quartz, water, organicsolvent, nanofilm of AuNPs, solid blue filter and solid gold mirror, respectively. The colors corresponding to each component in the quartz cell aredetailed in the various legends.
Nanoscale Paper
This journal is © The Royal Society of Chemistry 2016 Nanoscale, 2016, 8, 7723–7737 | 7725
Publ
ishe
d on
07
Mar
ch 2
016.
Dow
nloa
ded
by E
CO
LE
PO
LY
TE
CH
NIC
FE
D D
E L
AU
SAN
NE
on
01/0
4/20
16 1
7:22
:11.
View Article Online
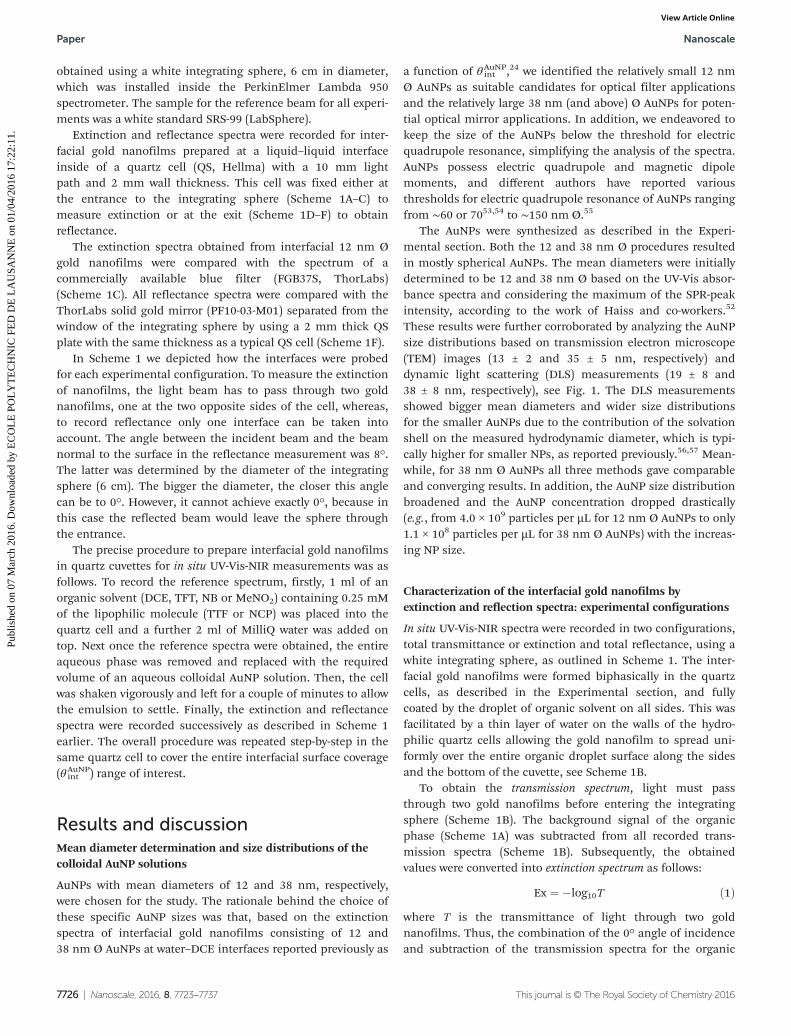
obtained using a white integrating sphere, 6 cm in diameter,which was installed inside the PerkinElmer Lambda 950spectrometer. The sample for the reference beam for all experi-ments was a white standard SRS-99 (LabSphere).
Extinction and reflectance spectra were recorded for inter-facial gold nanofilms prepared at a liquid–liquid interfaceinside of a quartz cell (QS, Hellma) with a 10 mm lightpath and 2 mm wall thickness. This cell was fixed either atthe entrance to the integrating sphere (Scheme 1A–C) tomeasure extinction or at the exit (Scheme 1D–F) to obtainreflectance.
The extinction spectra obtained from interfacial 12 nm Øgold nanofilms were compared with the spectrum of acommercially available blue filter (FGB37S, ThorLabs)(Scheme 1C). All reflectance spectra were compared with theThorLabs solid gold mirror (PF10-03-M01) separated from thewindow of the integrating sphere by using a 2 mm thick QSplate with the same thickness as a typical QS cell (Scheme 1F).
In Scheme 1 we depicted how the interfaces were probedfor each experimental configuration. To measure the extinctionof nanofilms, the light beam has to pass through two goldnanofilms, one at the two opposite sides of the cell, whereas,to record reflectance only one interface can be taken intoaccount. The angle between the incident beam and the beamnormal to the surface in the reflectance measurement was 8°.The latter was determined by the diameter of the integratingsphere (6 cm). The bigger the diameter, the closer this anglecan be to 0°. However, it cannot achieve exactly 0°, because inthis case the reflected beam would leave the sphere throughthe entrance.
The precise procedure to prepare interfacial gold nanofilmsin quartz cuvettes for in situ UV-Vis-NIR measurements was asfollows. To record the reference spectrum, firstly, 1 ml of anorganic solvent (DCE, TFT, NB or MeNO2) containing 0.25 mMof the lipophilic molecule (TTF or NCP) was placed into thequartz cell and a further 2 ml of MilliQ water was added ontop. Next once the reference spectra were obtained, the entireaqueous phase was removed and replaced with the requiredvolume of an aqueous colloidal AuNP solution. Then, the cellwas shaken vigorously and left for a couple of minutes to allowthe emulsion to settle. Finally, the extinction and reflectancespectra were recorded successively as described in Scheme 1earlier. The overall procedure was repeated step-by-step in thesame quartz cell to cover the entire interfacial surface coverage(θAuNP
int ) range of interest.
Results and discussionMean diameter determination and size distributions of thecolloidal AuNP solutions
AuNPs with mean diameters of 12 and 38 nm, respectively,were chosen for the study. The rationale behind the choice ofthese specific AuNP sizes was that, based on the extinctionspectra of interfacial gold nanofilms consisting of 12 and38 nm Ø AuNPs at water–DCE interfaces reported previously as
a function of θAuNPint ,24 we identified the relatively small 12 nm
Ø AuNPs as suitable candidates for optical filter applicationsand the relatively large 38 nm (and above) Ø AuNPs for poten-tial optical mirror applications. In addition, we endeavored tokeep the size of the AuNPs below the threshold for electricquadrupole resonance, simplifying the analysis of the spectra.AuNPs possess electric quadrupole and magnetic dipolemoments, and different authors have reported variousthresholds for electric quadrupole resonance of AuNPs rangingfrom ∼60 or 7053,54 to ∼150 nm Ø.55
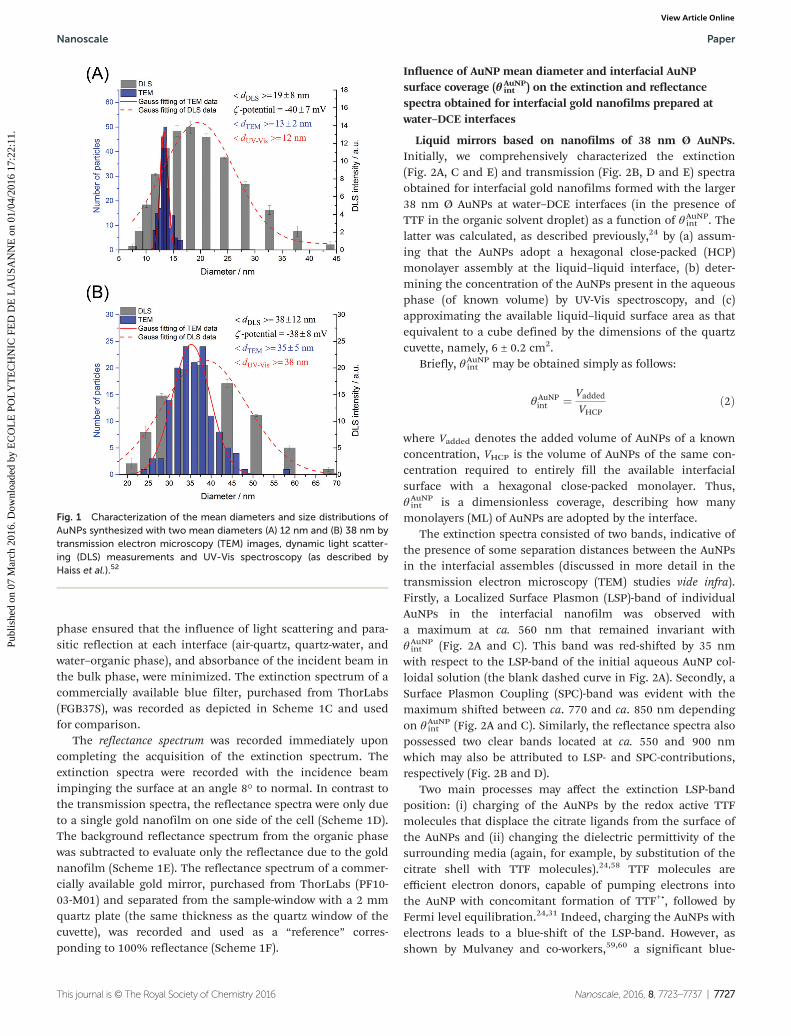
The AuNPs were synthesized as described in the Experi-mental section. Both the 12 and 38 nm Ø procedures resultedin mostly spherical AuNPs. The mean diameters were initiallydetermined to be 12 and 38 nm Ø based on the UV-Vis absor-bance spectra and considering the maximum of the SPR-peakintensity, according to the work of Haiss and co-workers.52
These results were further corroborated by analyzing the AuNPsize distributions based on transmission electron microscope(TEM) images (13 ± 2 and 35 ± 5 nm, respectively) anddynamic light scattering (DLS) measurements (19 ± 8 and38 ± 8 nm, respectively), see Fig. 1. The DLS measurementsshowed bigger mean diameters and wider size distributionsfor the smaller AuNPs due to the contribution of the solvationshell on the measured hydrodynamic diameter, which is typi-cally higher for smaller NPs, as reported previously.56,57 Mean-while, for 38 nm Ø AuNPs all three methods gave comparableand converging results. In addition, the AuNP size distributionbroadened and the AuNP concentration dropped drastically(e.g., from 4.0 × 10⁹ particles per µL for 12 nm Ø AuNPs to only1.1 × 108 particles per µL for 38 nm Ø AuNPs) with the increas-ing NP size.
Characterization of the interfacial gold nanofilms byextinction and reflection spectra: experimental configurations
In situ UV-Vis-NIR spectra were recorded in two configurations,total transmittance or extinction and total reflectance, using awhite integrating sphere, as outlined in Scheme 1. The inter-facial gold nanofilms were formed biphasically in the quartzcells, as described in the Experimental section, and fullycoated by the droplet of organic solvent on all sides. This wasfacilitated by a thin layer of water on the walls of the hydro-philic quartz cells allowing the gold nanofilm to spread uni-formly over the entire organic droplet surface along the sidesand the bottom of the cuvette, see Scheme 1B.
To obtain the transmission spectrum, light must passthrough two gold nanofilms before entering the integratingsphere (Scheme 1B). The background signal of the organicphase (Scheme 1A) was subtracted from all recorded trans-mission spectra (Scheme 1B). Subsequently, the obtainedvalues were converted into extinction spectrum as follows:
Ex ¼ �log10T ð1Þwhere T is the transmittance of light through two goldnanofilms. Thus, the combination of the 0° angle of incidenceand subtraction of the transmission spectra for the organic
Paper Nanoscale
7726 | Nanoscale, 2016, 8, 7723–7737 This journal is © The Royal Society of Chemistry 2016
Publ
ishe
d on
07
Mar
ch 2
016.
Dow
nloa
ded
by E
CO
LE
PO
LY
TE
CH
NIC
FE
D D
E L
AU
SAN
NE
on
01/0
4/20
16 1
7:22
:11.
View Article Online
phase ensured that the influence of light scattering and para-sitic reflection at each interface (air-quartz, quartz-water, andwater–organic phase), and absorbance of the incident beam inthe bulk phase, were minimized. The extinction spectrum of acommercially available blue filter, purchased from ThorLabs(FGB37S), was recorded as depicted in Scheme 1C and usedfor comparison.
The reflectance spectrum was recorded immediately uponcompleting the acquisition of the extinction spectrum. Theextinction spectra were recorded with the incidence beamimpinging the surface at an angle 8° to normal. In contrast tothe transmission spectra, the reflectance spectra were only dueto a single gold nanofilm on one side of the cell (Scheme 1D).The background reflectance spectrum from the organic phasewas subtracted to evaluate only the reflectance due to the goldnanofilm (Scheme 1E). The reflectance spectrum of a commer-cially available gold mirror, purchased from ThorLabs (PF10-03-M01) and separated from the sample-window with a 2 mmquartz plate (the same thickness as the quartz window of thecuvette), was recorded and used as a “reference” corres-ponding to 100% reflectance (Scheme 1F).
Influence of AuNP mean diameter and interfacial AuNPsurface coverage (θAuNP
int ) on the extinction and reflectancespectra obtained for interfacial gold nanofilms prepared atwater–DCE interfaces
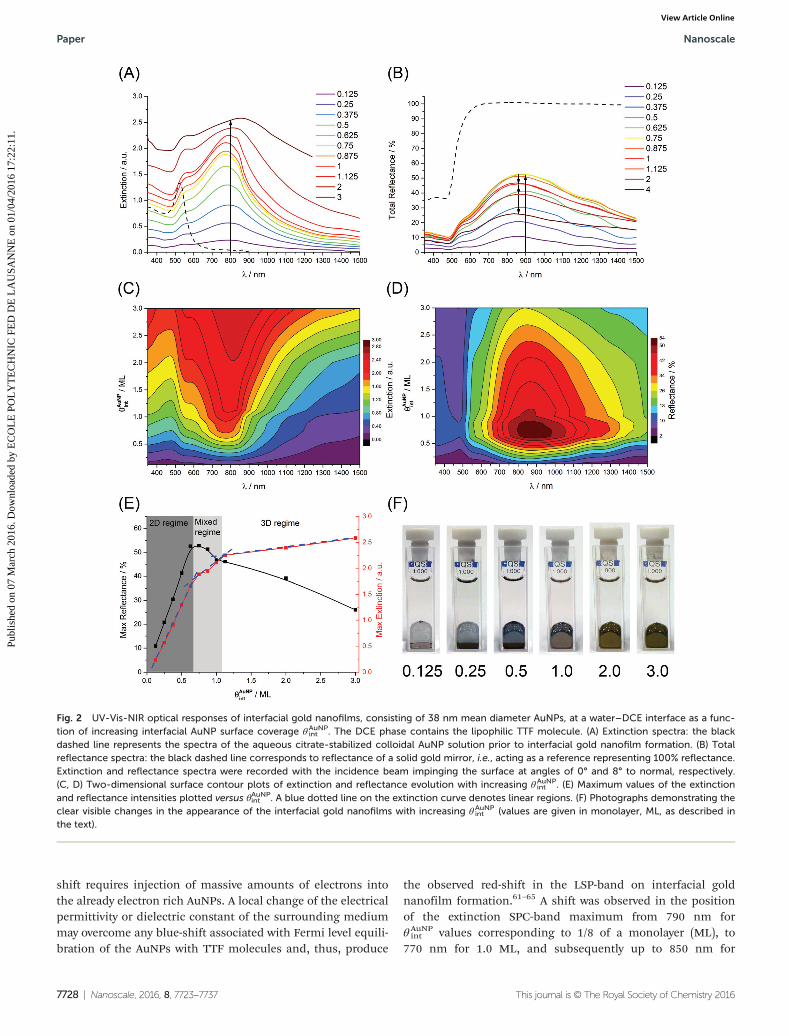
Liquid mirrors based on nanofilms of 38 nm Ø AuNPs.Initially, we comprehensively characterized the extinction(Fig. 2A, C and E) and transmission (Fig. 2B, D and E) spectraobtained for interfacial gold nanofilms formed with the larger38 nm Ø AuNPs at water–DCE interfaces (in the presence ofTTF in the organic solvent droplet) as a function of θAuNP
int . Thelatter was calculated, as described previously,24 by (a) assum-ing that the AuNPs adopt a hexagonal close-packed (HCP)monolayer assembly at the liquid–liquid interface, (b) deter-mining the concentration of the AuNPs present in the aqueousphase (of known volume) by UV-Vis spectroscopy, and (c)approximating the available liquid–liquid surface area as thatequivalent to a cube defined by the dimensions of the quartzcuvette, namely, 6 ± 0.2 cm2.
Briefly, θAuNPint may be obtained simply as follows:
θ AuNPint ¼ Vadded
VHCPð2Þ
where Vadded denotes the added volume of AuNPs of a knownconcentration, VHCP is the volume of AuNPs of the same con-centration required to entirely fill the available interfacialsurface with a hexagonal close-packed monolayer. Thus,θAuNPint is a dimensionless coverage, describing how many
monolayers (ML) of AuNPs are adopted by the interface.The extinction spectra consisted of two bands, indicative of
the presence of some separation distances between the AuNPsin the interfacial assembles (discussed in more detail in thetransmission electron microscopy (TEM) studies vide infra).Firstly, a Localized Surface Plasmon (LSP)-band of individualAuNPs in the interfacial nanofilm was observed witha maximum at ca. 560 nm that remained invariant withθAuNPint (Fig. 2A and C). This band was red-shifted by 35 nm
with respect to the LSP-band of the initial aqueous AuNP col-loidal solution (the blank dashed curve in Fig. 2A). Secondly, aSurface Plasmon Coupling (SPC)-band was evident with themaximum shifted between ca. 770 and ca. 850 nm dependingon θAuNP
int (Fig. 2A and C). Similarly, the reflectance spectra alsopossessed two clear bands located at ca. 550 and 900 nmwhich may also be attributed to LSP- and SPC-contributions,respectively (Fig. 2B and D).
Two main processes may affect the extinction LSP-bandposition: (i) charging of the AuNPs by the redox active TTFmolecules that displace the citrate ligands from the surface ofthe AuNPs and (ii) changing the dielectric permittivity of thesurrounding media (again, for example, by substitution of thecitrate shell with TTF molecules).24,58 TTF molecules areefficient electron donors, capable of pumping electrons intothe AuNP with concomitant formation of TTF+•, followed byFermi level equilibration.24,31 Indeed, charging the AuNPs withelectrons leads to a blue-shift of the LSP-band. However, asshown by Mulvaney and co-workers,59,60 a significant blue-
Fig. 1 Characterization of the mean diameters and size distributions ofAuNPs synthesized with two mean diameters (A) 12 nm and (B) 38 nm bytransmission electron microscopy (TEM) images, dynamic light scatter-ing (DLS) measurements and UV-Vis spectroscopy (as described byHaiss et al.).52
Nanoscale Paper
This journal is © The Royal Society of Chemistry 2016 Nanoscale, 2016, 8, 7723–7737 | 7727
Publ
ishe
d on
07
Mar
ch 2
016.
Dow
nloa
ded
by E
CO
LE
PO
LY
TE
CH
NIC
FE
D D
E L
AU
SAN
NE
on
01/0
4/20
16 1
7:22
:11.
View Article Online
shift requires injection of massive amounts of electrons intothe already electron rich AuNPs. A local change of the electricalpermittivity or dielectric constant of the surrounding mediummay overcome any blue-shift associated with Fermi level equili-bration of the AuNPs with TTF molecules and, thus, produce
the observed red-shift in the LSP-band on interfacial goldnanofilm formation.61–65 A shift was observed in the positionof the extinction SPC-band maximum from 790 nm forθAuNPint values corresponding to 1/8 of a monolayer (ML), to
770 nm for 1.0 ML, and subsequently up to 850 nm for
Fig. 2 UV-Vis-NIR optical responses of interfacial gold nanofilms, consisting of 38 nm mean diameter AuNPs, at a water–DCE interface as a func-tion of increasing interfacial AuNP surface coverage θAuNP
int . The DCE phase contains the lipophilic TTF molecule. (A) Extinction spectra: the blackdashed line represents the spectra of the aqueous citrate-stabilized colloidal AuNP solution prior to interfacial gold nanofilm formation. (B) Totalreflectance spectra: the black dashed line corresponds to reflectance of a solid gold mirror, i.e., acting as a reference representing 100% reflectance.Extinction and reflectance spectra were recorded with the incidence beam impinging the surface at angles of 0° and 8° to normal, respectively.(C, D) Two-dimensional surface contour plots of extinction and reflectance evolution with increasing θAuNP
int . (E) Maximum values of the extinctionand reflectance intensities plotted versus θAuNPint . A blue dotted line on the extinction curve denotes linear regions. (F) Photographs demonstrating theclear visible changes in the appearance of the interfacial gold nanofilms with increasing θAuNP
int (values are given in monolayer, ML, as described inthe text).
Paper Nanoscale
7728 | Nanoscale, 2016, 8, 7723–7737 This journal is © The Royal Society of Chemistry 2016
Publ
ishe
d on
07
Mar
ch 2
016.
Dow
nloa
ded
by E
CO
LE
PO
LY
TE
CH
NIC
FE
D D
E L
AU
SAN
NE
on
01/0
4/20
16 1
7:22
:11.
View Article Online

3.0 MLs. Thus, the average position of the SPC-band peakmaximum was ca. 810 nm. However, it is difficult to establishif this wandering variation of the maximum has a physicalorigin (e.g., decreasing interparticle distances)66 or is due tothe rearrangements and changes of the local environment ofthe AuNPs upon nanofilm growth. The plots of the maximumextinction (red data points) and reflectance (black data points)peak intensities versus θAuNPint were highly informative revealingseveral interesting features in the optical behavior of the inter-facial gold nanofilms (Fig. 2E). The steady continuous growthsof the overall extinction and reflectance peak intensities withincreasing θAuNP
int were both abruptly interrupted under 0.625ML conditions. At this initial threshold the linear dependence(the Beer–Lambert law) was broken for the extinction spectracausing a change of slope or, in other words, the extinctioncoefficient (Fig. 2E, red data points). A second threshold wasreached under 1.125 ML conditions, again leading to a furtherchange of the slope. Thus, three distinct regions were distin-guished, each with a unique extinction coefficient; (1) a 2Dregime dominated by smooth “floating islands” of interfaciallyadsorbed 2D monolayers, (2) a mixed 2D/3D regime where the2D “floating islands” start to become modified with 3D nano-structures consisting of small piles of adsorbed AuNPs evenunder sub-full-monolayer conditions, and (3) a 3D regimewhere the interfacially adsorbed 2D full-monolayer is comple-tely subsumed beneath significant piles of adsorbed AuNPs.The presence of these three distinct regimes is further sup-ported by ex situ scanning electron microscopy (SEM) imagesof the interfacial gold nanofilms after their transfer to siliconsubstrates, discussed vide infra.
The variation of the reflectance in these three regimes ismarked (Fig. 2E, black data points). As noted, the reflectanceincreases steadily with increasing θAuNP
int in the 2D regime. Inthe mixed 2D/3D regime the rate of increase in reflectanceslows dramatically and reaches a maximum of 51% (comparedto the 100% reference reflectance from the Thorlabs goldmirror) between 0.75 and 0.875 ML conditions, followed by aslow decrease under 1.125 ML conditions. Beyond this, in the3D regime, the rate of decrease of reflectance ramps up signifi-cantly, and this behavior is clearly visible to the naked eye witha dimming of the luster of the interfacial gold nanofilmsbetween 1.0 and 3.0 ML conditions (Fig. 2F).
From the spectroscopic point of view, the overall peakwidth of the extinction and reflectance spectra broaden withincreasing θAuNP
int beyond 1.0 ML conditions. This is indicativeof the formation of additional out-of-plane interactionsbetween AuNPs. Owing to the the morphology of the inter-facial gold nanofilm transitions from 2D to 3D beyond 1.0 MLconditions, each AuNP (surrounded by six close neighbors inthe interfacially adsorbed 2D monolayer) establishes contactwith three further AuNPs in the second layer leading toadditional depolarization factors and peak broadening. Thelatter is supported by previous simulations and experimentalobservations demonstrating that increasing the extent of inter-acting AuNPs leads to a red shift and broadening of the SPC-peak.3,12,13,67 Under these conditions both red and green
lights were absorbed strongly (Fig. 2A and C) which also leadsto strong reflection of these two colours (Fig. 2B and D). Thehuman eye then perceives these mixtures of red and greenlights as orange or gold, giving the strong golden coloration ofthe multilayer nanofilms, see Fig. 2F.
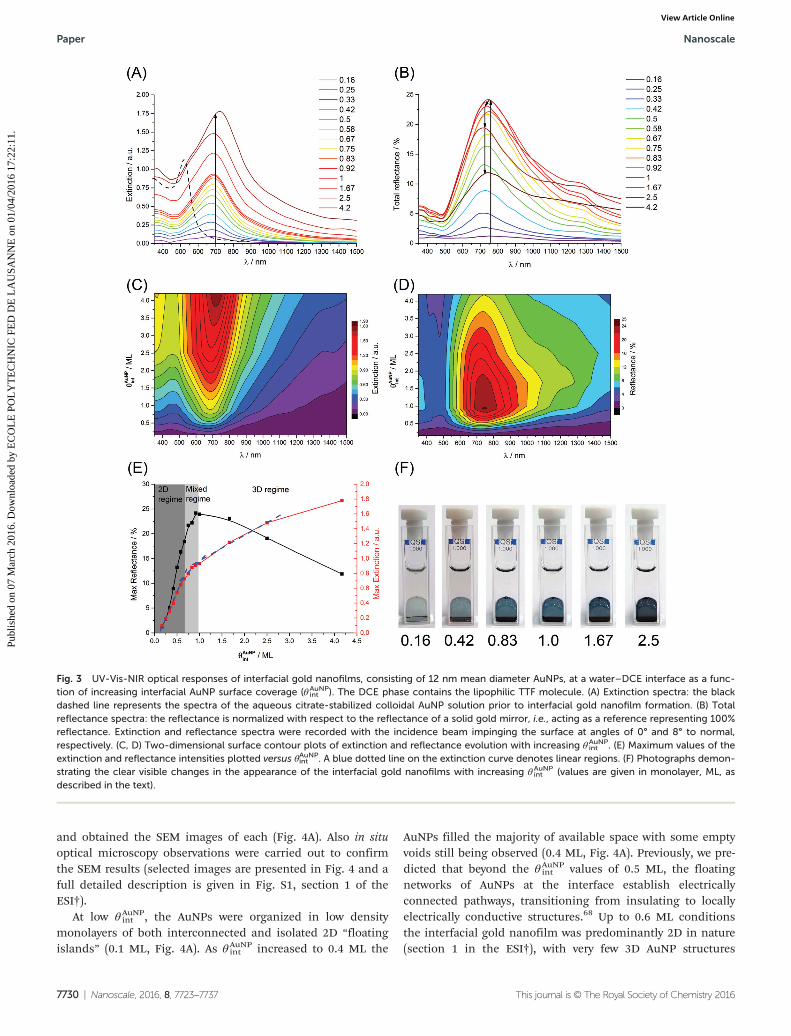
Liquid filters based on nanofilms of 12 nm Ø AuNPs. Sub-sequently, we comprehensively characterized the extinction(Fig. 3A, C and E) and transmission (Fig. 3B, D and E) spectraobtained for interfacial gold nanofilms formed with thesmaller 12 nm Ø AuNPs at water–DCE interfaces (in the pres-ence of TTF in the organic solvent droplet) as a function ofθAuNPint . All of the trends found for the larger AuNPs were gener-
ally replicated. In addition, the extinction spectra exhibitedboth LSP- and SPC-bands at ca. 550 nm and ca. 690 nm,respectively. The LSP-band was slightly (10 nm) blue-shifted,while the SPC-band was significantly (120 nm) blue-shifted incomparison with the interfacial gold nanofilms formed with38 nm Ø AuNPs. The LSP-band appeared as a tiny shoulder onthe intense and broad SPC-band and was only visible underhigh θAuNP
int conditions in excess of 1 ML (Fig. 3A). Also, vari-ation in the position of the SPC-band maximum was observedto be quite small under sub-ML conditions: ca. 680 nm forθAuNPint of 0.16 ML to ca. 675 nm for θAuNP
int of 0.33 ML. However,the maximum of the SPC-band reached ca. 720 nm for 4 MLs.
The reflectance spectra also possessed two bands attributedto LSP- and SPC-contributions, respectively (Fig. 3B and D).The trends seen for the variations of the extinction and reflec-tance peak intensities versus θAuNPint were replicated with thethree distinct regimes, discussed above, again evident(Fig. 3E). In this instance the maximum values of both theextinction and reflectance spectra simultaneously changed theslope under ca. 0.83 ML conditions.
Although, the observed trends in the optical behavior forinterfacial gold nanofilms formed with either 12 or 38 nm ØAuNPs were broadly similar, some clear distinctions exist thatimpact their potential applications. Interfacial nanofilmsformed with 38 nm Ø AuNPs display (a) considerably broaderSCP extinction bands under θAuNP
int conditions in excess of 1ML (leading to their gold coloration) and (b) a maximumreflectance of 51% versus only 24% for 12 nm Ø AuNPs.Hence, 12 nm Ø and smaller AuNPs are good candidates toform optical filters at liquid–liquid interfaces, whereas 38 nmØ and larger AuNPs may potentially be utilized to form opticalmirrors at liquid–liquid interfaces.
Monitoring the morphology of the interfacial gold nanofilmswith increasing θAuNP
int by scanning electron microscopy (SEM)
The interpretation of the extinction and reflectance spectra forinterfacial nanofilms formed with 38 nm Ø (Fig. 2) and 12 nmØ (Fig. 3) AuNPs was dependent on the existence of 3 distinctmorphological regimes of the AuNPs at the interface, each ofwhich scattered light to varying degrees, as a function of θAuNPint .
To confirm their existence we transferred interfacial goldnanofilms formed in a stepwise manner with 38 nm Ø AuNPsunder a series of θAuNP
int conditions (from 0.1 to 2.0 ML) tosilicon substrates, as described in the Experimental section,
Nanoscale Paper
This journal is © The Royal Society of Chemistry 2016 Nanoscale, 2016, 8, 7723–7737 | 7729
Publ
ishe
d on
07
Mar
ch 2
016.
Dow
nloa
ded
by E
CO
LE
PO
LY
TE
CH
NIC
FE
D D
E L
AU
SAN
NE
on
01/0
4/20
16 1
7:22
:11.
View Article Online
and obtained the SEM images of each (Fig. 4A). Also in situoptical microscopy observations were carried out to confirmthe SEM results (selected images are presented in Fig. 4 and afull detailed description is given in Fig. S1, section 1 of theESI†).
At low θAuNPint , the AuNPs were organized in low density
monolayers of both interconnected and isolated 2D “floatingislands” (0.1 ML, Fig. 4A). As θAuNP
int increased to 0.4 ML the
AuNPs filled the majority of available space with some emptyvoids still being observed (0.4 ML, Fig. 4A). Previously, we pre-dicted that beyond the θAuNP
int values of 0.5 ML, the floatingnetworks of AuNPs at the interface establish electricallyconnected pathways, transitioning from insulating to locallyelectrically conductive structures.68 Up to 0.6 ML conditionsthe interfacial gold nanofilm was predominantly 2D in nature(section 1 in the ESI†), with very few 3D AuNP structures
Fig. 3 UV-Vis-NIR optical responses of interfacial gold nanofilms, consisting of 12 nm mean diameter AuNPs, at a water–DCE interface as a func-tion of increasing interfacial AuNP surface coverage (θAuNP
int ). The DCE phase contains the lipophilic TTF molecule. (A) Extinction spectra: the blackdashed line represents the spectra of the aqueous citrate-stabilized colloidal AuNP solution prior to interfacial gold nanofilm formation. (B) Totalreflectance spectra: the reflectance is normalized with respect to the reflectance of a solid gold mirror, i.e., acting as a reference representing 100%reflectance. Extinction and reflectance spectra were recorded with the incidence beam impinging the surface at angles of 0° and 8° to normal,respectively. (C, D) Two-dimensional surface contour plots of extinction and reflectance evolution with increasing θAuNP
int . (E) Maximum values of theextinction and reflectance intensities plotted versus θAuNPint . A blue dotted line on the extinction curve denotes linear regions. (F) Photographs demon-strating the clear visible changes in the appearance of the interfacial gold nanofilms with increasing θAuNP
int (values are given in monolayer, ML, asdescribed in the text).
Paper Nanoscale
7730 | Nanoscale, 2016, 8, 7723–7737 This journal is © The Royal Society of Chemistry 2016
Publ
ishe
d on
07
Mar
ch 2
016.
Dow
nloa
ded
by E
CO
LE
PO
LY
TE
CH
NIC
FE
D D
E L
AU
SAN
NE
on
01/0
4/20
16 1
7:22
:11.
View Article Online
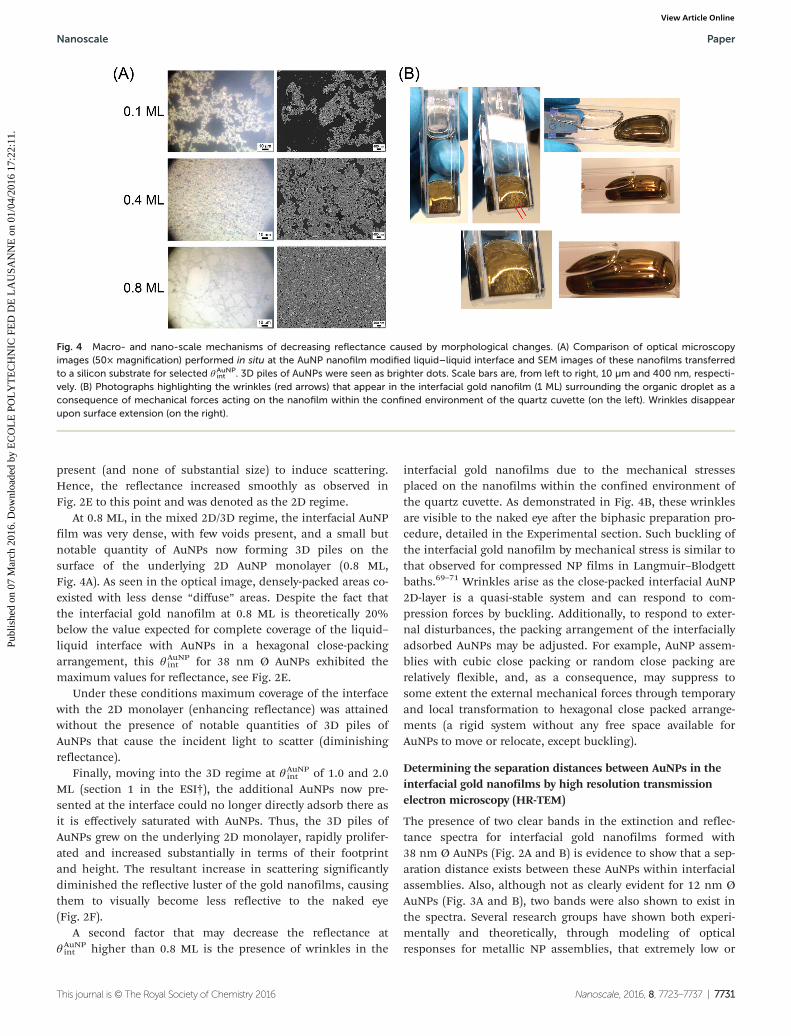
present (and none of substantial size) to induce scattering.Hence, the reflectance increased smoothly as observed inFig. 2E to this point and was denoted as the 2D regime.
At 0.8 ML, in the mixed 2D/3D regime, the interfacial AuNPfilm was very dense, with few voids present, and a small butnotable quantity of AuNPs now forming 3D piles on thesurface of the underlying 2D AuNP monolayer (0.8 ML,Fig. 4A). As seen in the optical image, densely-packed areas co-existed with less dense “diffuse” areas. Despite the fact thatthe interfacial gold nanofilm at 0.8 ML is theoretically 20%below the value expected for complete coverage of the liquid–liquid interface with AuNPs in a hexagonal close-packingarrangement, this θAuNP
int for 38 nm Ø AuNPs exhibited themaximum values for reflectance, see Fig. 2E.
Under these conditions maximum coverage of the interfacewith the 2D monolayer (enhancing reflectance) was attainedwithout the presence of notable quantities of 3D piles ofAuNPs that cause the incident light to scatter (diminishingreflectance).
Finally, moving into the 3D regime at θAuNPint of 1.0 and 2.0
ML (section 1 in the ESI†), the additional AuNPs now pre-sented at the interface could no longer directly adsorb there asit is effectively saturated with AuNPs. Thus, the 3D piles ofAuNPs grew on the underlying 2D monolayer, rapidly prolifer-ated and increased substantially in terms of their footprintand height. The resultant increase in scattering significantlydiminished the reflective luster of the gold nanofilms, causingthem to visually become less reflective to the naked eye(Fig. 2F).
A second factor that may decrease the reflectance atθAuNPint higher than 0.8 ML is the presence of wrinkles in the
interfacial gold nanofilms due to the mechanical stressesplaced on the nanofilms within the confined environment ofthe quartz cuvette. As demonstrated in Fig. 4B, these wrinklesare visible to the naked eye after the biphasic preparation pro-cedure, detailed in the Experimental section. Such buckling ofthe interfacial gold nanofilm by mechanical stress is similar tothat observed for compressed NP films in Langmuir–Blodgettbaths.69–71 Wrinkles arise as the close-packed interfacial AuNP2D-layer is a quasi-stable system and can respond to com-pression forces by buckling. Additionally, to respond to exter-nal disturbances, the packing arrangement of the interfaciallyadsorbed AuNPs may be adjusted. For example, AuNP assem-blies with cubic close packing or random close packing arerelatively flexible, and, as a consequence, may suppress tosome extent the external mechanical forces through temporaryand local transformation to hexagonal close packed arrange-ments (a rigid system without any free space available forAuNPs to move or relocate, except buckling).
Determining the separation distances between AuNPs in theinterfacial gold nanofilms by high resolution transmissionelectron microscopy (HR-TEM)
The presence of two clear bands in the extinction and reflec-tance spectra for interfacial gold nanofilms formed with38 nm Ø AuNPs (Fig. 2A and B) is evidence to show that a sep-aration distance exists between these AuNPs within interfacialassemblies. Also, although not as clearly evident for 12 nm ØAuNPs (Fig. 3A and B), two bands were also shown to exist inthe spectra. Several research groups have shown both experi-mentally and theoretically, through modeling of opticalresponses for metallic NP assemblies, that extremely low or
Fig. 4 Macro- and nano-scale mechanisms of decreasing reflectance caused by morphological changes. (A) Comparison of optical microscopyimages (50× magnification) performed in situ at the AuNP nanofilm modified liquid–liquid interface and SEM images of these nanofilms transferredto a silicon substrate for selected θAuNP
int . 3D piles of AuNPs were seen as brighter dots. Scale bars are, from left to right, 10 µm and 400 nm, respecti-vely. (B) Photographs highlighting the wrinkles (red arrows) that appear in the interfacial gold nanofilm (1 ML) surrounding the organic droplet as aconsequence of mechanical forces acting on the nanofilm within the confined environment of the quartz cuvette (on the left). Wrinkles disappearupon surface extension (on the right).
Nanoscale Paper
This journal is © The Royal Society of Chemistry 2016 Nanoscale, 2016, 8, 7723–7737 | 7731
Publ
ishe
d on
07
Mar
ch 2
016.
Dow
nloa
ded
by E
CO
LE
PO
LY
TE
CH
NIC
FE
D D
E L
AU
SAN
NE
on
01/0
4/20
16 1
7:22
:11.
View Article Online

zero interparticle distances result in a broad band in the reflec-tance spectra tailing into the NIR range, as seen for bulkmirrors.3,13,72 In contrast, relatively large interparticle dis-tances lead to a bell-shaped reflectance in the middle of theUV-Vis spectra. Thus, tuning of interparticle distances is adirect way of controlling the optical response of metallic NPassemblies.3,13,72
The interparticle separation distance distributions weremeasured by HR-TEM and are presented in Fig. 5. For inter-facial gold nanofilms formed with either 12 or 38 nm ØAuNPs, the interparticle separation distances were estimatedto be 0.85 (±0.1) and 0.87 (±0.2) nm, respectively. These dis-tances were equivalent to the thickness of a few layers ofπ-stacked TTF or TTF+• molecules that form a shell aroundeach AuNP. Thus, while the AuNPs are located in close enoughproximity with each other in the interfacial nanofilm to lead toeffective electronic coupling between the individual AuNPs,they do not touch each other.3,13,72 This is a key attribute ofthese nanofilms making them an attractive soft interfacial sub-
strate for mirror applications and future SERS studies inparticular.73,74
Comparing the optical responses of interfacial gold nanofilmsformed biphasically using alternative organic solvents of lowmiscibility with water and replacing the lipophilic moleculeTTF in the organic droplet with neocuproine (NCP)
Thus far we have focused entirely on thoroughly characterizingour initial organic solvent/lipophilic molecule combination ofDCE containing TTF.24 In this final section, we demonstratethat our biphasic approach to interfacial gold nanofilm for-mation, whereby the citrate ligands are displaced from thesurface of the aqueous AuNPs by a lipophilic species presentin the organic solvent, is not restricted to the combinationnoted above.
Initially, we expanded our choice of organic solvents underinvestigation to include α,α,α-trifluorotoluene (TFT), nitro-benzene (NB), and nitromethane (MeNO2). These solvents differin the density (ρ), dielectric constant in a static electric field (εr)and interfacial surface tension (γw/o) to 1,2-dichloroethane (DCE).Thus, the goal here was to determine the magnitude of the influ-ence of the immiscible organic solvent on the observed opticalresponses and the stability of the interfacial gold nanofilmsγw/o was measured for each water–organic solvent interface by thependant drop method (Fig. S2, section 2 in the ESI†). With theexception of MeNO2, each of these liquid–liquid interfaces arepolarizable (either chemically or electrochemically) and, thus,may be implemented in the construction of electrically driven“smart” filters and mirrors.39 Relevant physiochemical dataon each organic solvent and water–organic solvent interface aresummarized in Table 1.
Subsequently, the lipophilic molecule neocuproine (NCP),previously used to self-assemble AgNPs at water–DCE inter-faces,6,7 was tested and the interfacial gold nanofilms formedwere compared to those observed at water–DCE interfaces withTTF in the organic phase. We also investigated other bipyri-dines, previously reported to create liquid mirror films ofAgNPs,6,76,77 and thionine,78 a direct structural analogue ofTTF. However, only NCP led to interfacial AuNP nanofilm for-mation and is thus the sole focus of our extended analysisherein.
Comparison of the extinction and reflectance spectra forinterfacial gold nanofilms formed with either 12 nm Ø (Fig. 6Aand B) or 38 nm Ø (Fig. 6B and D) AuNPs, using either DCE,
Fig. 5 High-resolution transmission electron microscopy (HR-TEM)images of interfacial gold nanofilms after transferring to a TEM grid. Theinterfacial gold nanofilms were formed with (A) 12 and (B) 38 nm ØAuNPs at the water–DCE interface, with TTF present in the organicdroplet, and at 0.8 ML conditions. Insets: interparticle separation dis-tance distributions were measured based on the HR-TEM-images.
Table 1 Summary of the density (ρ) and dielectric constant in a staticelectric field (εr)
75 of each organic solvent studied, and the interfacialsurface tension (γw/o) of each water–organic solvent interface (as deter-mined by the pendant drop method in section 2 of the ESI)
Solvent ρ/g cm−3 εr75 γw/o/mN m−1
TFT 1.181 9.18 38.0 ± 0.5DCE 1.256 10.42 30.5 ± 0.3NB 1.552 35.60 24.4 ± 0.2MeNO2 1.130 37.27 16.0 ± 0.2
Paper Nanoscale
7732 | Nanoscale, 2016, 8, 7723–7737 This journal is © The Royal Society of Chemistry 2016
Publ
ishe
d on
07
Mar
ch 2
016.
Dow
nloa
ded
by E
CO
LE
PO
LY
TE
CH
NIC
FE
D D
E L
AU
SAN
NE
on
01/0
4/20
16 1
7:22
:11.
View Article Online
TFT, NB or MeNO2 as the organic solvent, are presented inFig. 6.
Optical photographs of the obtained interfacial gold nano-films are given in Fig. S3, section 3 of the ESI.† A value of 0.75for θAuNP
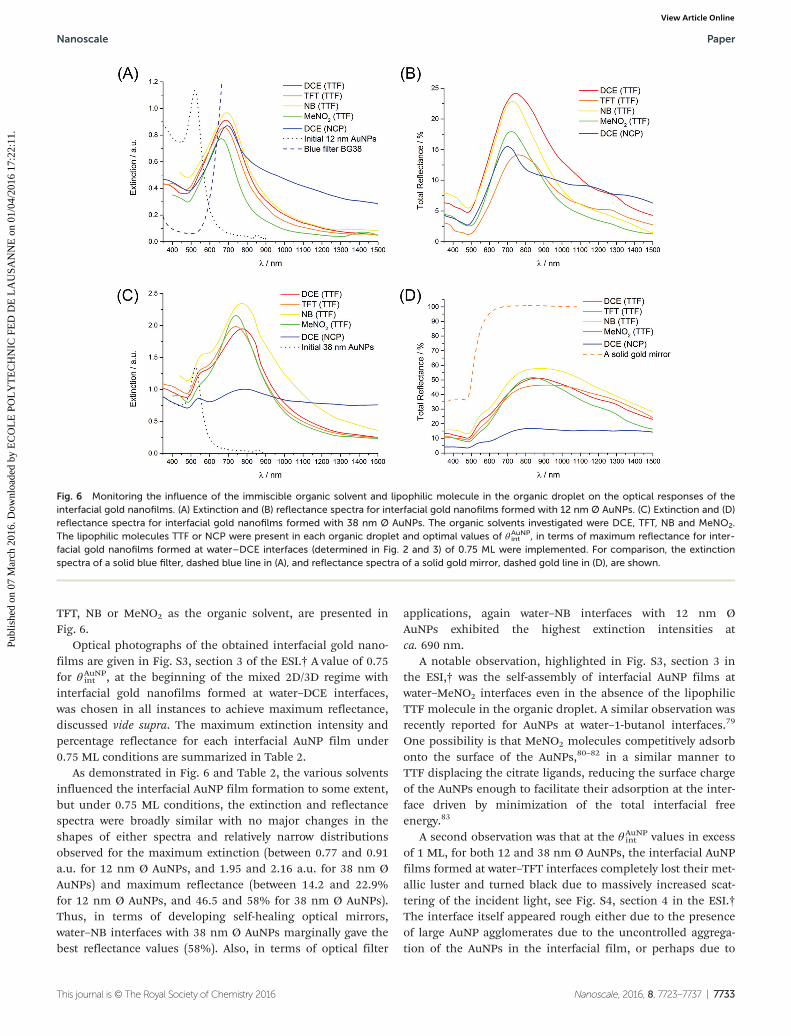
int , at the beginning of the mixed 2D/3D regime withinterfacial gold nanofilms formed at water–DCE interfaces,was chosen in all instances to achieve maximum reflectance,discussed vide supra. The maximum extinction intensity andpercentage reflectance for each interfacial AuNP film under0.75 ML conditions are summarized in Table 2.
As demonstrated in Fig. 6 and Table 2, the various solventsinfluenced the interfacial AuNP film formation to some extent,but under 0.75 ML conditions, the extinction and reflectancespectra were broadly similar with no major changes in theshapes of either spectra and relatively narrow distributionsobserved for the maximum extinction (between 0.77 and 0.91a.u. for 12 nm Ø AuNPs, and 1.95 and 2.16 a.u. for 38 nm ØAuNPs) and maximum reflectance (between 14.2 and 22.9%for 12 nm Ø AuNPs, and 46.5 and 58% for 38 nm Ø AuNPs).Thus, in terms of developing self-healing optical mirrors,water–NB interfaces with 38 nm Ø AuNPs marginally gave thebest reflectance values (58%). Also, in terms of optical filter
applications, again water–NB interfaces with 12 nm ØAuNPs exhibited the highest extinction intensities atca. 690 nm.
A notable observation, highlighted in Fig. S3, section 3 inthe ESI,† was the self-assembly of interfacial AuNP films atwater–MeNO2 interfaces even in the absence of the lipophilicTTF molecule in the organic droplet. A similar observation wasrecently reported for AuNPs at water–1-butanol interfaces.79
One possibility is that MeNO2 molecules competitively adsorbonto the surface of the AuNPs,80–82 in a similar manner toTTF displacing the citrate ligands, reducing the surface chargeof the AuNPs enough to facilitate their adsorption at the inter-face driven by minimization of the total interfacial freeenergy.83
A second observation was that at the θAuNPint values in excess
of 1 ML, for both 12 and 38 nm Ø AuNPs, the interfacial AuNPfilms formed at water–TFT interfaces completely lost their met-allic luster and turned black due to massively increased scat-tering of the incident light, see Fig. S4, section 4 in the ESI.†The interface itself appeared rough either due to the presenceof large AuNP agglomerates due to the uncontrolled aggrega-tion of the AuNPs in the interfacial film, or perhaps due to
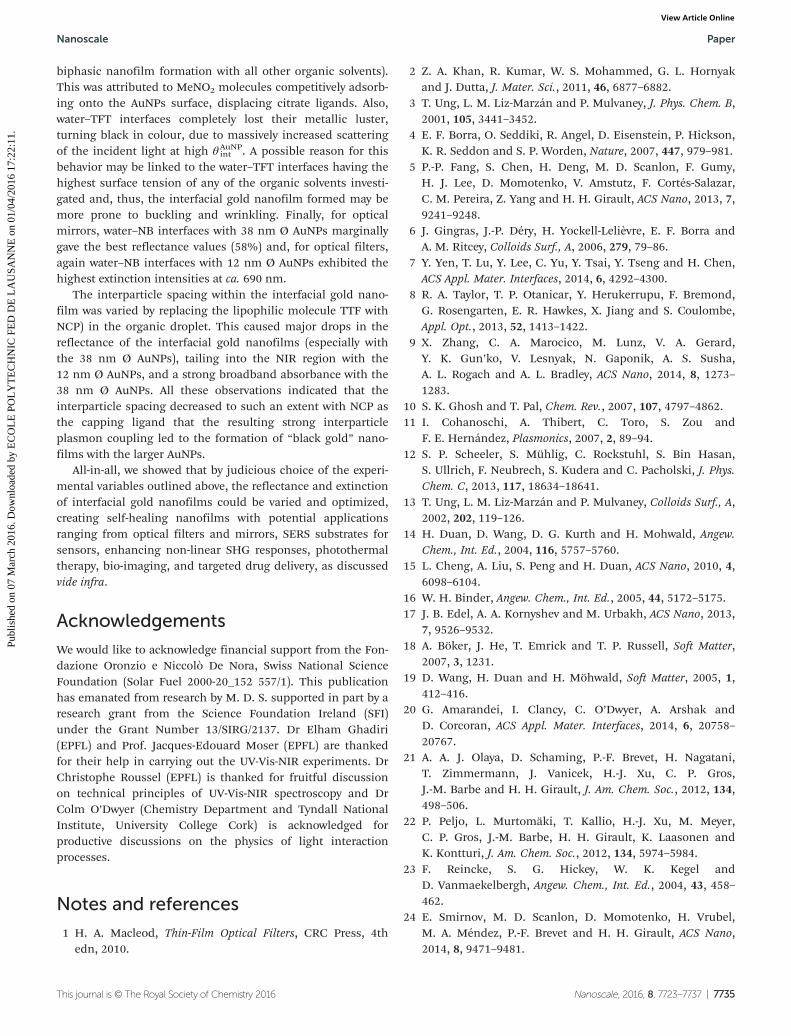
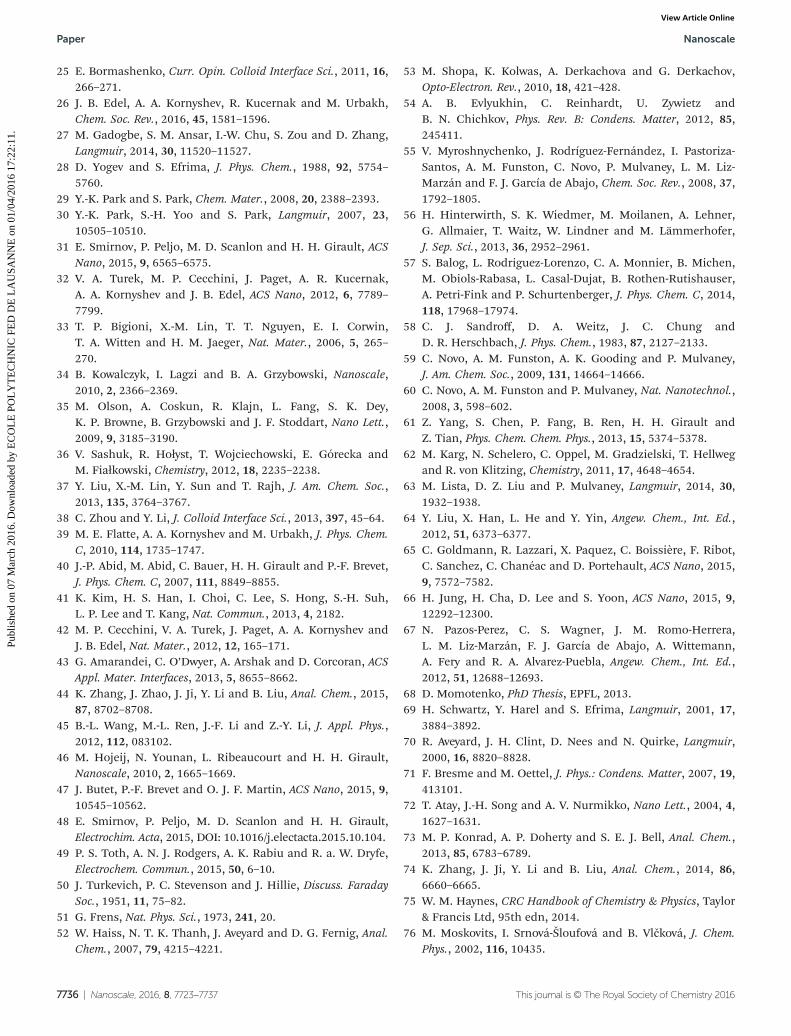
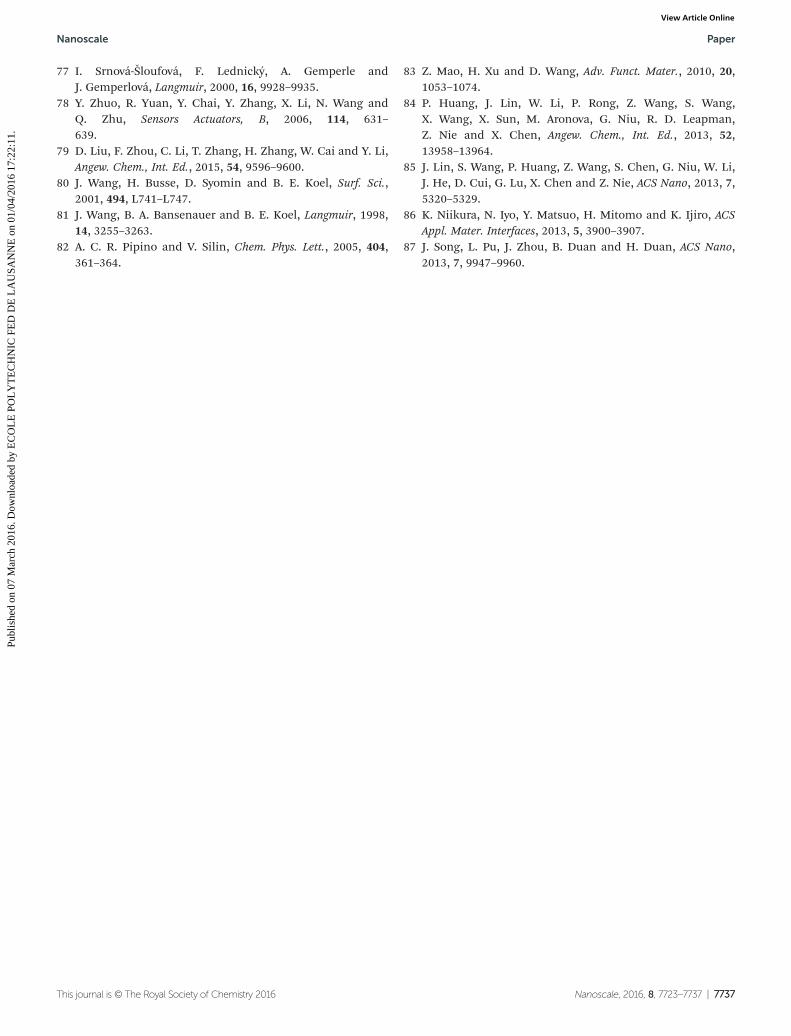
Fig. 6 Monitoring the influence of the immiscible organic solvent and lipophilic molecule in the organic droplet on the optical responses of theinterfacial gold nanofilms. (A) Extinction and (B) reflectance spectra for interfacial gold nanofilms formed with 12 nm Ø AuNPs. (C) Extinction and (D)reflectance spectra for interfacial gold nanofilms formed with 38 nm Ø AuNPs. The organic solvents investigated were DCE, TFT, NB and MeNO2.The lipophilic molecules TTF or NCP were present in each organic droplet and optimal values of θAuNP
int , in terms of maximum reflectance for inter-facial gold nanofilms formed at water–DCE interfaces (determined in Fig. 2 and 3) of 0.75 ML were implemented. For comparison, the extinctionspectra of a solid blue filter, dashed blue line in (A), and reflectance spectra of a solid gold mirror, dashed gold line in (D), are shown.
Nanoscale Paper
This journal is © The Royal Society of Chemistry 2016 Nanoscale, 2016, 8, 7723–7737 | 7733
Publ
ishe
d on
07
Mar
ch 2
016.
Dow
nloa
ded
by E
CO
LE
PO
LY
TE
CH
NIC
FE
D D
E L
AU
SAN
NE
on
01/0
4/20
16 1
7:22
:11.
View Article Online

buckling of the water–TFT interface at these high θAuNPint values.
The origin of this behavior is, as yet, unresolved. As detailed inTable 1, however, TFT has the highest interfacial surfacetension among the considered solvents of 38 mN m−1 and theimpact of increased interfacial surface tension to potentiallyinduce buckling of the interfacial gold nanofilms at highinterfacial surface coverages is discussed in section 4 of theESI.†
A comparison of the extinction and reflectance spectra forinterfacial gold nanofilms formed biphasically with either 12or 38 nm Ø AuNPs and with either NCP (blue spectra) (seeFig. S5, section 5 in the ESI† for the chemical structure ofNCP) or TTF (red spectra) in the DCE droplet are also pre-sented in Fig. 6 and Table 2. Again, θAuNP
int values of 0.75 MLwere chosen. The extinction spectra for interfacial nanofilmscomposed of 12 nm Ø AuNPs revealed a significant tailing intothe NIR region when NCP was present in the DCE droplet(Fig. 6A).
Additionally, the reflectance of these nanofilms with NCPpresent was less than that observed with TTF, dropping from24.2 to 15.5% (Fig. 6B). For 38 nm Ø AuNPs, major opticaldifferences were observed for the interfacial gold nanofilms,with the appearance of a strong broadband absorption (Fig. 6)and a huge drop in reflectance, from 51.2% to 16.8% (Fig. 6D),when NCP was replaced with TTF in the DCE droplet. Theseobservations indicate that the AuNPs in the interfacial goldnanofilm formed with NCP were in extremely close proximity,with considerably smaller interparticle separation distancesthan those with TTF in the DCE droplet. These small inter-particle distances led to strong interparticle plasmonic coupling,which in turn cause broadband absorption, low reflectivity andthe interfacial gold nanofilms to appear very dark in color,resembling “black gold” (see Fig. S5, section 5 in the ESI† foroptical photographs of the obtained interfacial gold nano-films), as recently described by Liu et al.79 Clearly, these “blackgold” films are not suitable for either optical mirror orfilter applications. However, their lower reflectance and, in par-ticular, strong ability to absorb light in the NIR range leadingto their enhanced broadband absorption, means that theymay potentially impact other technological niches, such asphotothermal therapy,84,85 bio-imaging, and targeted drugdelivery.86,87
Conclusions
The influence of a host of experimental variables (AuNP meandiameter, Ø; interfacial AuNP surface coverage θAuNP
int ; thenature of the organic solvent; nature of the lipophilic organicmolecule that caps the AuNPs in the interfacial nanofilm) onthe optical properties of interfacial gold nanofilms formed atimmiscible water–oil interfaces were investigated by both insitu spectroscopy (extinction and reflection UV-vis-NIR spectraand optical photographs) and ex situ microscopy (TEM andSEM images of interfacial gold nanofilms transferred to siliconsubstrates) techniques.
Smaller AuNPs with 12 nm Ø were suited to applications asliquid based optical band-pass filters, forming interfacial goldnanofilms that attenuated green and red lights, while transmit-ting blue light. Larger AuNPs with 38 nm Ø were suited toapplications as liquid mirrors, forming interfacial gold nano-films that strongly reflected both red and green light, perceivedas gold to the human eye.
The magnitudes of the maximum reflection for interfacialgold nanofilms formed, determined by in situ UV-vis-NIRspectra, were strongly influenced by the morphology of thenanofilms at the interface, which was in turn determined byθAuNPint . Systematic in situ spectroscopy studies, corroborated by
in situ optical micrographs and ex situ SEM images, revealedthree distinct morphological regimes, with optimal conditionsbeing those that yielded the maximum coverage of the inter-face with a 2D monolayer (enhancing reflectance) without thepresence of notable quantities of 3D piles of AuNPs that causethe incident light to scatter (diminishing reflectance). Forwater–DCE interfaces this was determined to be at a sub-monolayer (ML) surface coverage (approximately 0.75 ML)assuming hexagonal close packing of the AuNPs at theinterface.
The nature of the organic solvent turned out to be the leastinfluential variable studies, with only small variations ofmaximum extinction and reflectance observed in both 12 and38 nm Ø AuNPs at 0.75 ML surface coverages when DCE wasreplaced with TFT, MeNO2 or NB. Interesting aberrationsincluded the observation of interfacial gold nanofilms withMeNO2 without a lipophilic molecule in the organic droplet(typically required to displace the citrate ligands and induce
Table 2 Comparison of the maximum extinction (a.u.) and reflectance (%) values measured for interfacial gold nanofilms, consisting of either12 nm or 38 mean diameter AuNPs, formed with either DCE, TFT, NB or MeNO2 as the organic solvent. The lipophilic molecules TTF or NCP werepresent in each organic droplet and θAuNP
int values of 0.75 ML were implemented. The peak positions at which each of the values were determinedfrom the spectra shown in Fig. 6 are indicated in brackets
Solvent Lipophilic molecule
12 nm Ø AuNPs 38 nm Ø AuNPs
Extinction/a.u. Reflectance/% Extinction/a.u. Reflectance/%
DCE NCP 0.87 (693 nm) 15.5 (699 nm) 1.00 (787 nm) 16.8 (822 nm)DCE TTF 0.91 (685 nm) 24.2 (745 nm) 1.95 (774 nm) 51.2 (864 nm)TFT TTF 0.86 (677 nm) 14.2 (757 nm) 1.98 (740 nm) 46.5 (906 nm)NB TTF 0.97 (691 nm) 22.9 (728 nm) 2.34 (773 nm) 58 (884 nm)MeNO2 TTF 0.77 (662 nm) 17.9 (723 nm) 2.16 (741 nm) 51.6 (838 nm)
Paper Nanoscale
7734 | Nanoscale, 2016, 8, 7723–7737 This journal is © The Royal Society of Chemistry 2016
Publ
ishe
d on
07
Mar
ch 2
016.
Dow
nloa
ded
by E
CO
LE
PO
LY
TE
CH
NIC
FE
D D
E L
AU
SAN
NE
on
01/0
4/20
16 1
7:22
:11.
View Article Online
biphasic nanofilm formation with all other organic solvents).This was attributed to MeNO2 molecules competitively adsorb-ing onto the AuNPs surface, displacing citrate ligands. Also,water–TFT interfaces completely lost their metallic luster,turning black in colour, due to massively increased scatteringof the incident light at high θAuNP
int . A possible reason for thisbehavior may be linked to the water–TFT interfaces having thehighest surface tension of any of the organic solvents investi-gated and, thus, the interfacial gold nanofilm formed may bemore prone to buckling and wrinkling. Finally, for opticalmirrors, water–NB interfaces with 38 nm Ø AuNPs marginallygave the best reflectance values (58%) and, for optical filters,again water–NB interfaces with 12 nm Ø AuNPs exhibited thehighest extinction intensities at ca. 690 nm.
The interparticle spacing within the interfacial gold nano-film was varied by replacing the lipophilic molecule TTF withNCP) in the organic droplet. This caused major drops in thereflectance of the interfacial gold nanofilms (especially withthe 38 nm Ø AuNPs), tailing into the NIR region with the12 nm Ø AuNPs, and a strong broadband absorbance with the38 nm Ø AuNPs. All these observations indicated that theinterparticle spacing decreased to such an extent with NCP asthe capping ligand that the resulting strong interparticleplasmon coupling led to the formation of “black gold” nano-films with the larger AuNPs.
All-in-all, we showed that by judicious choice of the experi-mental variables outlined above, the reflectance and extinctionof interfacial gold nanofilms could be varied and optimized,creating self-healing nanofilms with potential applicationsranging from optical filters and mirrors, SERS substrates forsensors, enhancing non-linear SHG responses, photothermaltherapy, bio-imaging, and targeted drug delivery, as discussedvide infra.
Acknowledgements
We would like to acknowledge financial support from the Fon-dazione Oronzio e Niccolò De Nora, Swiss National ScienceFoundation (Solar Fuel 2000-20_152 557/1). This publicationhas emanated from research by M. D. S. supported in part by aresearch grant from the Science Foundation Ireland (SFI)under the Grant Number 13/SIRG/2137. Dr Elham Ghadiri(EPFL) and Prof. Jacques-Edouard Moser (EPFL) are thankedfor their help in carrying out the UV-Vis-NIR experiments. DrChristophe Roussel (EPFL) is thanked for fruitful discussionon technical principles of UV-Vis-NIR spectroscopy and DrColm O’Dwyer (Chemistry Department and Tyndall NationalInstitute, University College Cork) is acknowledged forproductive discussions on the physics of light interactionprocesses.
Notes and references
1 H. A. Macleod, Thin-Film Optical Filters, CRC Press, 4thedn, 2010.
2 Z. A. Khan, R. Kumar, W. S. Mohammed, G. L. Hornyakand J. Dutta, J. Mater. Sci., 2011, 46, 6877–6882.
3 T. Ung, L. M. Liz-Marzán and P. Mulvaney, J. Phys. Chem. B,2001, 105, 3441–3452.
4 E. F. Borra, O. Seddiki, R. Angel, D. Eisenstein, P. Hickson,K. R. Seddon and S. P. Worden, Nature, 2007, 447, 979–981.
5 P.-P. Fang, S. Chen, H. Deng, M. D. Scanlon, F. Gumy,H. J. Lee, D. Momotenko, V. Amstutz, F. Cortés-Salazar,C. M. Pereira, Z. Yang and H. H. Girault, ACS Nano, 2013, 7,9241–9248.
6 J. Gingras, J.-P. Déry, H. Yockell-Lelièvre, E. F. Borra andA. M. Ritcey, Colloids Surf., A, 2006, 279, 79–86.
7 Y. Yen, T. Lu, Y. Lee, C. Yu, Y. Tsai, Y. Tseng and H. Chen,ACS Appl. Mater. Interfaces, 2014, 6, 4292–4300.
8 R. A. Taylor, T. P. Otanicar, Y. Herukerrupu, F. Bremond,G. Rosengarten, E. R. Hawkes, X. Jiang and S. Coulombe,Appl. Opt., 2013, 52, 1413–1422.
9 X. Zhang, C. A. Marocico, M. Lunz, V. A. Gerard,Y. K. Gun’ko, V. Lesnyak, N. Gaponik, A. S. Susha,A. L. Rogach and A. L. Bradley, ACS Nano, 2014, 8, 1273–1283.
10 S. K. Ghosh and T. Pal, Chem. Rev., 2007, 107, 4797–4862.11 I. Cohanoschi, A. Thibert, C. Toro, S. Zou and
F. E. Hernández, Plasmonics, 2007, 2, 89–94.12 S. P. Scheeler, S. Mühlig, C. Rockstuhl, S. Bin Hasan,
S. Ullrich, F. Neubrech, S. Kudera and C. Pacholski, J. Phys.Chem. C, 2013, 117, 18634–18641.
13 T. Ung, L. M. Liz-Marzán and P. Mulvaney, Colloids Surf., A,2002, 202, 119–126.
14 H. Duan, D. Wang, D. G. Kurth and H. Mohwald, Angew.Chem., Int. Ed., 2004, 116, 5757–5760.
15 L. Cheng, A. Liu, S. Peng and H. Duan, ACS Nano, 2010, 4,6098–6104.
16 W. H. Binder, Angew. Chem., Int. Ed., 2005, 44, 5172–5175.17 J. B. Edel, A. A. Kornyshev and M. Urbakh, ACS Nano, 2013,
7, 9526–9532.18 A. Böker, J. He, T. Emrick and T. P. Russell, Soft Matter,
2007, 3, 1231.19 D. Wang, H. Duan and H. Möhwald, Soft Matter, 2005, 1,
412–416.20 G. Amarandei, I. Clancy, C. O’Dwyer, A. Arshak and
D. Corcoran, ACS Appl. Mater. Interfaces, 2014, 6, 20758–20767.
21 A. A. J. Olaya, D. Schaming, P.-F. Brevet, H. Nagatani,T. Zimmermann, J. Vanicek, H.-J. Xu, C. P. Gros,J.-M. Barbe and H. H. Girault, J. Am. Chem. Soc., 2012, 134,498–506.
22 P. Peljo, L. Murtomäki, T. Kallio, H.-J. Xu, M. Meyer,C. P. Gros, J.-M. Barbe, H. H. Girault, K. Laasonen andK. Kontturi, J. Am. Chem. Soc., 2012, 134, 5974–5984.
23 F. Reincke, S. G. Hickey, W. K. Kegel andD. Vanmaekelbergh, Angew. Chem., Int. Ed., 2004, 43, 458–462.
24 E. Smirnov, M. D. Scanlon, D. Momotenko, H. Vrubel,M. A. Méndez, P.-F. Brevet and H. H. Girault, ACS Nano,2014, 8, 9471–9481.
Nanoscale Paper
This journal is © The Royal Society of Chemistry 2016 Nanoscale, 2016, 8, 7723–7737 | 7735
Publ
ishe
d on
07
Mar
ch 2
016.
Dow
nloa
ded
by E
CO
LE
PO
LY
TE
CH
NIC
FE
D D
E L
AU
SAN
NE
on
01/0
4/20
16 1
7:22
:11.
View Article Online
25 E. Bormashenko, Curr. Opin. Colloid Interface Sci., 2011, 16,266–271.
26 J. B. Edel, A. A. Kornyshev, R. Kucernak and M. Urbakh,Chem. Soc. Rev., 2016, 45, 1581–1596.
27 M. Gadogbe, S. M. Ansar, I.-W. Chu, S. Zou and D. Zhang,Langmuir, 2014, 30, 11520–11527.
28 D. Yogev and S. Efrima, J. Phys. Chem., 1988, 92, 5754–5760.
29 Y.-K. Park and S. Park, Chem. Mater., 2008, 20, 2388–2393.30 Y.-K. Park, S.-H. Yoo and S. Park, Langmuir, 2007, 23,
10505–10510.31 E. Smirnov, P. Peljo, M. D. Scanlon and H. H. Girault, ACS
Nano, 2015, 9, 6565–6575.32 V. A. Turek, M. P. Cecchini, J. Paget, A. R. Kucernak,
A. A. Kornyshev and J. B. Edel, ACS Nano, 2012, 6, 7789–7799.
33 T. P. Bigioni, X.-M. Lin, T. T. Nguyen, E. I. Corwin,T. A. Witten and H. M. Jaeger, Nat. Mater., 2006, 5, 265–270.
34 B. Kowalczyk, I. Lagzi and B. A. Grzybowski, Nanoscale,2010, 2, 2366–2369.
35 M. Olson, A. Coskun, R. Klajn, L. Fang, S. K. Dey,K. P. Browne, B. Grzybowski and J. F. Stoddart, Nano Lett.,2009, 9, 3185–3190.
36 V. Sashuk, R. Hołyst, T. Wojciechowski, E. Górecka andM. Fiałkowski, Chemistry, 2012, 18, 2235–2238.
37 Y. Liu, X.-M. Lin, Y. Sun and T. Rajh, J. Am. Chem. Soc.,2013, 135, 3764–3767.
38 C. Zhou and Y. Li, J. Colloid Interface Sci., 2013, 397, 45–64.39 M. E. Flatte, A. A. Kornyshev and M. Urbakh, J. Phys. Chem.
C, 2010, 114, 1735–1747.40 J.-P. Abid, M. Abid, C. Bauer, H. H. Girault and P.-F. Brevet,
J. Phys. Chem. C, 2007, 111, 8849–8855.41 K. Kim, H. S. Han, I. Choi, C. Lee, S. Hong, S.-H. Suh,
L. P. Lee and T. Kang, Nat. Commun., 2013, 4, 2182.42 M. P. Cecchini, V. A. Turek, J. Paget, A. A. Kornyshev and
J. B. Edel, Nat. Mater., 2012, 12, 165–171.43 G. Amarandei, C. O’Dwyer, A. Arshak and D. Corcoran, ACS
Appl. Mater. Interfaces, 2013, 5, 8655–8662.44 K. Zhang, J. Zhao, J. Ji, Y. Li and B. Liu, Anal. Chem., 2015,
87, 8702–8708.45 B.-L. Wang, M.-L. Ren, J.-F. Li and Z.-Y. Li, J. Appl. Phys.,
2012, 112, 083102.46 M. Hojeij, N. Younan, L. Ribeaucourt and H. H. Girault,
Nanoscale, 2010, 2, 1665–1669.47 J. Butet, P.-F. Brevet and O. J. F. Martin, ACS Nano, 2015, 9,
10545–10562.48 E. Smirnov, P. Peljo, M. D. Scanlon and H. H. Girault,
Electrochim. Acta, 2015, DOI: 10.1016/j.electacta.2015.10.104.49 P. S. Toth, A. N. J. Rodgers, A. K. Rabiu and R. a. W. Dryfe,
Electrochem. Commun., 2015, 50, 6–10.50 J. Turkevich, P. C. Stevenson and J. Hillie, Discuss. Faraday
Soc., 1951, 11, 75–82.51 G. Frens, Nat. Phys. Sci., 1973, 241, 20.52 W. Haiss, N. T. K. Thanh, J. Aveyard and D. G. Fernig, Anal.
Chem., 2007, 79, 4215–4221.
53 M. Shopa, K. Kolwas, A. Derkachova and G. Derkachov,Opto-Electron. Rev., 2010, 18, 421–428.
54 A. B. Evlyukhin, C. Reinhardt, U. Zywietz andB. N. Chichkov, Phys. Rev. B: Condens. Matter, 2012, 85,245411.
55 V. Myroshnychenko, J. Rodríguez-Fernández, I. Pastoriza-Santos, A. M. Funston, C. Novo, P. Mulvaney, L. M. Liz-Marzán and F. J. García de Abajo, Chem. Soc. Rev., 2008, 37,1792–1805.
56 H. Hinterwirth, S. K. Wiedmer, M. Moilanen, A. Lehner,G. Allmaier, T. Waitz, W. Lindner and M. Lämmerhofer,J. Sep. Sci., 2013, 36, 2952–2961.
57 S. Balog, L. Rodriguez-Lorenzo, C. A. Monnier, B. Michen,M. Obiols-Rabasa, L. Casal-Dujat, B. Rothen-Rutishauser,A. Petri-Fink and P. Schurtenberger, J. Phys. Chem. C, 2014,118, 17968–17974.
58 C. J. Sandroff, D. A. Weitz, J. C. Chung andD. R. Herschbach, J. Phys. Chem., 1983, 87, 2127–2133.
59 C. Novo, A. M. Funston, A. K. Gooding and P. Mulvaney,J. Am. Chem. Soc., 2009, 131, 14664–14666.
60 C. Novo, A. M. Funston and P. Mulvaney, Nat. Nanotechnol.,2008, 3, 598–602.
61 Z. Yang, S. Chen, P. Fang, B. Ren, H. H. Girault andZ. Tian, Phys. Chem. Chem. Phys., 2013, 15, 5374–5378.
62 M. Karg, N. Schelero, C. Oppel, M. Gradzielski, T. Hellwegand R. von Klitzing, Chemistry, 2011, 17, 4648–4654.
63 M. Lista, D. Z. Liu and P. Mulvaney, Langmuir, 2014, 30,1932–1938.
64 Y. Liu, X. Han, L. He and Y. Yin, Angew. Chem., Int. Ed.,2012, 51, 6373–6377.
65 C. Goldmann, R. Lazzari, X. Paquez, C. Boissière, F. Ribot,C. Sanchez, C. Chanéac and D. Portehault, ACS Nano, 2015,9, 7572–7582.
66 H. Jung, H. Cha, D. Lee and S. Yoon, ACS Nano, 2015, 9,12292–12300.
67 N. Pazos-Perez, C. S. Wagner, J. M. Romo-Herrera,L. M. Liz-Marzán, F. J. García de Abajo, A. Wittemann,A. Fery and R. A. Alvarez-Puebla, Angew. Chem., Int. Ed.,2012, 51, 12688–12693.
68 D. Momotenko, PhD Thesis, EPFL, 2013.69 H. Schwartz, Y. Harel and S. Efrima, Langmuir, 2001, 17,
3884–3892.70 R. Aveyard, J. H. Clint, D. Nees and N. Quirke, Langmuir,
2000, 16, 8820–8828.71 F. Bresme and M. Oettel, J. Phys.: Condens. Matter, 2007, 19,
413101.72 T. Atay, J.-H. Song and A. V. Nurmikko, Nano Lett., 2004, 4,
1627–1631.73 M. P. Konrad, A. P. Doherty and S. E. J. Bell, Anal. Chem.,
2013, 85, 6783–6789.74 K. Zhang, J. Ji, Y. Li and B. Liu, Anal. Chem., 2014, 86,
6660–6665.75 W. M. Haynes, CRC Handbook of Chemistry & Physics, Taylor
& Francis Ltd, 95th edn, 2014.76 M. Moskovits, I. Srnová-Šloufová and B. Vlčková, J. Chem.
Phys., 2002, 116, 10435.
Paper Nanoscale
7736 | Nanoscale, 2016, 8, 7723–7737 This journal is © The Royal Society of Chemistry 2016
Publ
ishe
d on
07
Mar
ch 2
016.
Dow
nloa
ded
by E
CO
LE
PO
LY
TE
CH
NIC
FE
D D
E L
AU
SAN
NE
on
01/0
4/20
16 1
7:22
:11.
View Article Online
77 I. Srnová-Šloufová, F. Lednický, A. Gemperle andJ. Gemperlová, Langmuir, 2000, 16, 9928–9935.
78 Y. Zhuo, R. Yuan, Y. Chai, Y. Zhang, X. Li, N. Wang andQ. Zhu, Sensors Actuators, B, 2006, 114, 631–639.
79 D. Liu, F. Zhou, C. Li, T. Zhang, H. Zhang, W. Cai and Y. Li,Angew. Chem., Int. Ed., 2015, 54, 9596–9600.
80 J. Wang, H. Busse, D. Syomin and B. E. Koel, Surf. Sci.,2001, 494, L741–L747.
81 J. Wang, B. A. Bansenauer and B. E. Koel, Langmuir, 1998,14, 3255–3263.
82 A. C. R. Pipino and V. Silin, Chem. Phys. Lett., 2005, 404,361–364.
83 Z. Mao, H. Xu and D. Wang, Adv. Funct. Mater., 2010, 20,1053–1074.
84 P. Huang, J. Lin, W. Li, P. Rong, Z. Wang, S. Wang,X. Wang, X. Sun, M. Aronova, G. Niu, R. D. Leapman,Z. Nie and X. Chen, Angew. Chem., Int. Ed., 2013, 52,13958–13964.
85 J. Lin, S. Wang, P. Huang, Z. Wang, S. Chen, G. Niu, W. Li,J. He, D. Cui, G. Lu, X. Chen and Z. Nie, ACS Nano, 2013, 7,5320–5329.
86 K. Niikura, N. Iyo, Y. Matsuo, H. Mitomo and K. Ijiro, ACSAppl. Mater. Interfaces, 2013, 5, 3900–3907.
87 J. Song, L. Pu, J. Zhou, B. Duan and H. Duan, ACS Nano,2013, 7, 9947–9960.
Nanoscale Paper
This journal is © The Royal Society of Chemistry 2016 Nanoscale, 2016, 8, 7723–7737 | 7737
Publ
ishe
d on
07
Mar
ch 2
016.
Dow
nloa
ded
by E
CO
LE
PO
LY
TE
CH
NIC
FE
D D
E L
AU
SAN
NE
on
01/0
4/20
16 1
7:22
:11.
View Article Online