Embed Size (px)
Citation preview
Center for Labor Markets and Policy | Drexel University
Paul E. HarringtonCenter for Labor Markets and Policy
Drexel University
Self Employment in New York and the
Hudson Valley
Center for Labor Markets and Policy | Drexel University
0
2000
4000
6000
8000
10000
12000
14000
16000
18000
Dec 2
000
Apr
2001
Aug 2
001
Dec 2
001
Apr
2002
Aug 2
002
Dec 2
002
Apr
2003
Aug 2
003
Dec 2
003
Apr
2004
Aug 2
004
Dec 2
004
Apr
2005
Aug 2
005
Dec 2
005
Apr
2006
Aug 2
006
Dec 2
006
Apr
2007
Aug 2
007
Dec 2
007
Apr
2008
Aug 2
008
Dec 2
008
Apr
2009
Aug 2
009
Dec 2
009
Apr
2010
Aug 2
010
Dec 2
010
Apr
2011
Aug 2
011
Dec 2
011
Apr
2012
Aug 2
012
Dec 2
012
Apr
2013
Aug 2
013
Dec 2
013
Apr
2014
Aug 2
014
Dec 2
014
Apr
2015
Aug 2
015
Dec 2
015
Nu
mb
ers (
Th
ou
san
ds)
Month, Year
Vacant Job
Unemployment
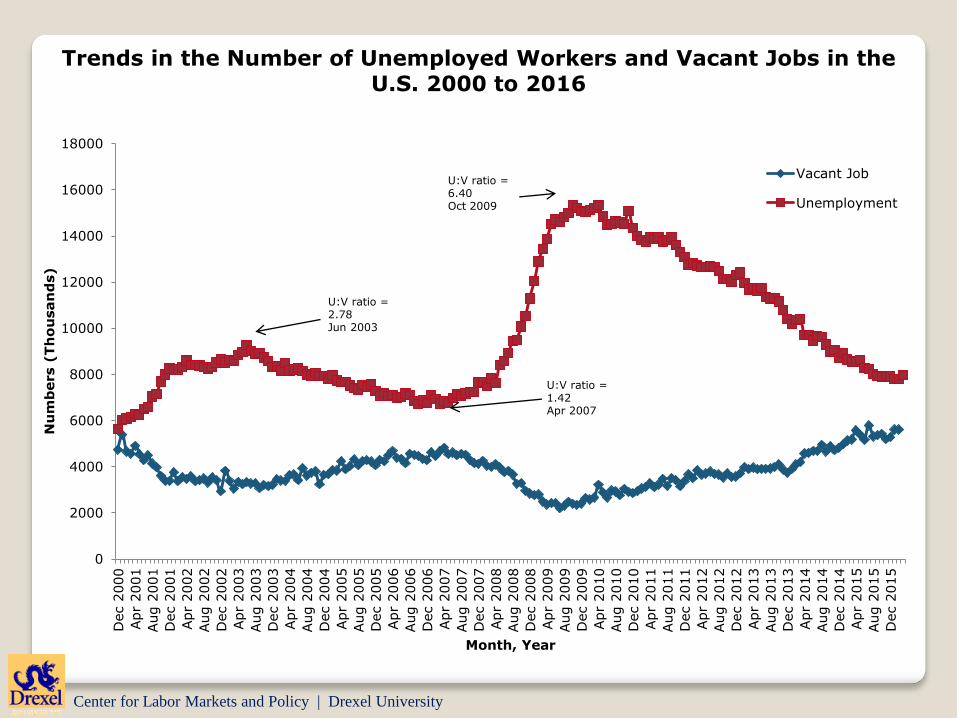
U:V ratio = 2.78Jun 2003
U:V ratio = 1.42Apr 2007
U:V ratio = 6.40Oct 2009
Trends in the Number of Unemployed Workers and Vacant Jobs in the U.S. 2000 to 2016

Center for Labor Markets and Policy | Drexel University
Vacant JobsExperienced Job
SeekersU:V Ratio
Total 5315 6299 1.19
Construction 144 624 4.33
Manufacturing 311 677 2.18
Wholesale Trade 163 136 0.83
Retail Trade 546 999 1.83
Transport & Utilities 203 275 1.36
Information 107 108 1.01
Financial Services 328 247 0.75
Prof. & Bus.SVC 1072 894 0.83
Education 97 213 2.19
Health ans Social SVC 924 610 0.66
Arts, Entertainment 65 191 2.93
Accommodation & Food SVC 661 902 1.36
Other Services 176 340 1.94
Experienced Unemployed and Job Vacancies in the U.S.2015

Center for Labor Markets and Policy | Drexel University
1.0
1.5
2.0
2.5
3.0
3.5
4.0
2.0 4.0 6.0 8.0 10.0 12.0
Jo
b V
acan
cy R
ate
Unemployment Rate
Dec-00
Jul-09
Oct-09
Mar-16
Shift
The Beveridge Curve (Monthly Job Vacancy Rate versus Unemployment Rate) Seasonally Adjusted, December 2000 to March 2016

Center for Labor Markets and Policy | Drexel University
Age Group 1999-2000-2001 2013-2014-2015
16-19 41.3 27.2
20-24 69.5 62.6
25-34 80.7 79.5
35-44 81.9 80.3
45-54 79.5 78.9
55-64 57.4 64.8
65-74 17.7 26.8
75+ 5.9 8.7
Total 62.9 61.2
The Age Twist in Labor Force Participation Rates in New YorkBetween 1999-2001 and 2013-2015

Center for Labor Markets and Policy | Drexel University
Age 1999-2000-2001 2013-2014-2015
16-19 35.4 21.6
20-24 62.9 54.8
25-34 76.8 74.2
35-44 78.7 76.6
45-54 77.2 75.0
55-64 55.4 61.7
65-74 17.1 25.3
75+ 5.7 8.3
Total 59.9 57.2
The Age Twist in Employment to Population Ratios in New YorkBetween 1999-2001 and 2013-2015

Center for Labor Markets and Policy | Drexel University
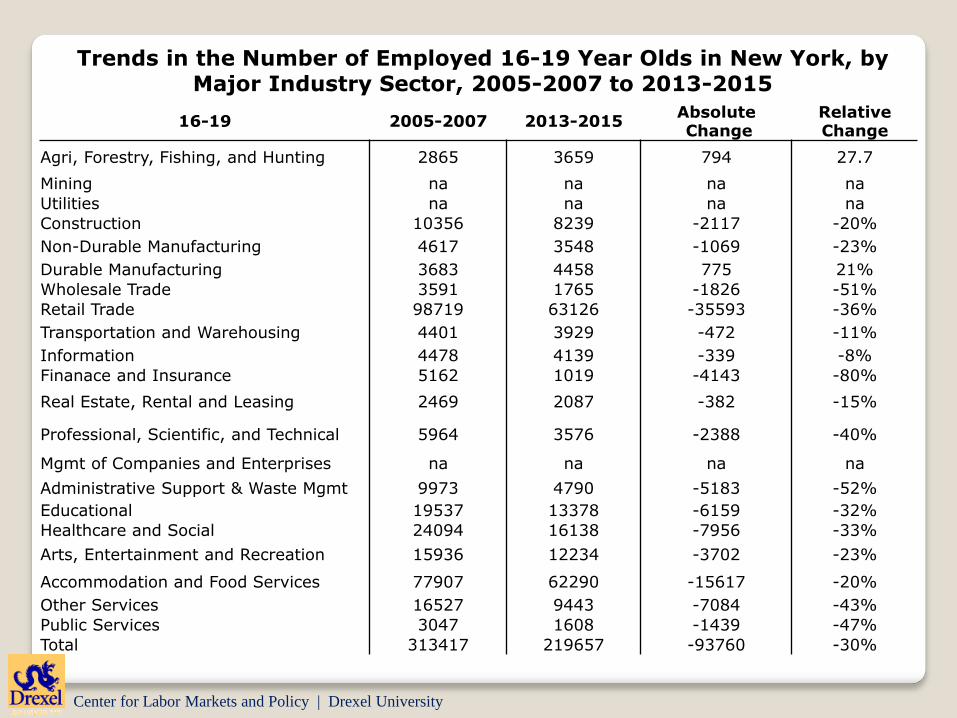
Trends in the Number of Employed 16-19 Year Olds in New York, by Major Industry Sector, 2005-2007 to 2013-2015
16-19 2005-2007 2013-2015AbsoluteChange
Relative Change
Agri, Forestry, Fishing, and Hunting 2865 3659 794 27.7
Mining na na na na
Utilities na na na na
Construction 10356 8239 -2117 -20%
Non-Durable Manufacturing 4617 3548 -1069 -23%
Durable Manufacturing 3683 4458 775 21%
Wholesale Trade 3591 1765 -1826 -51%
Retail Trade 98719 63126 -35593 -36%
Transportation and Warehousing 4401 3929 -472 -11%
Information 4478 4139 -339 -8%
Finanace and Insurance 5162 1019 -4143 -80%
Real Estate, Rental and Leasing 2469 2087 -382 -15%
Professional, Scientific, and Technical 5964 3576 -2388 -40%
Mgmt of Companies and Enterprises na na na na
Administrative Support & Waste Mgmt 9973 4790 -5183 -52%
Educational 19537 13378 -6159 -32%
Healthcare and Social 24094 16138 -7956 -33%
Arts, Entertainment and Recreation 15936 12234 -3702 -23%
Accommodation and Food Services 77907 62290 -15617 -20%
Other Services 16527 9443 -7084 -43%
Public Services 3047 1608 -1439 -47%
Total 313417 219657 -93760 -30%
Center for Labor Markets and Policy | Drexel University
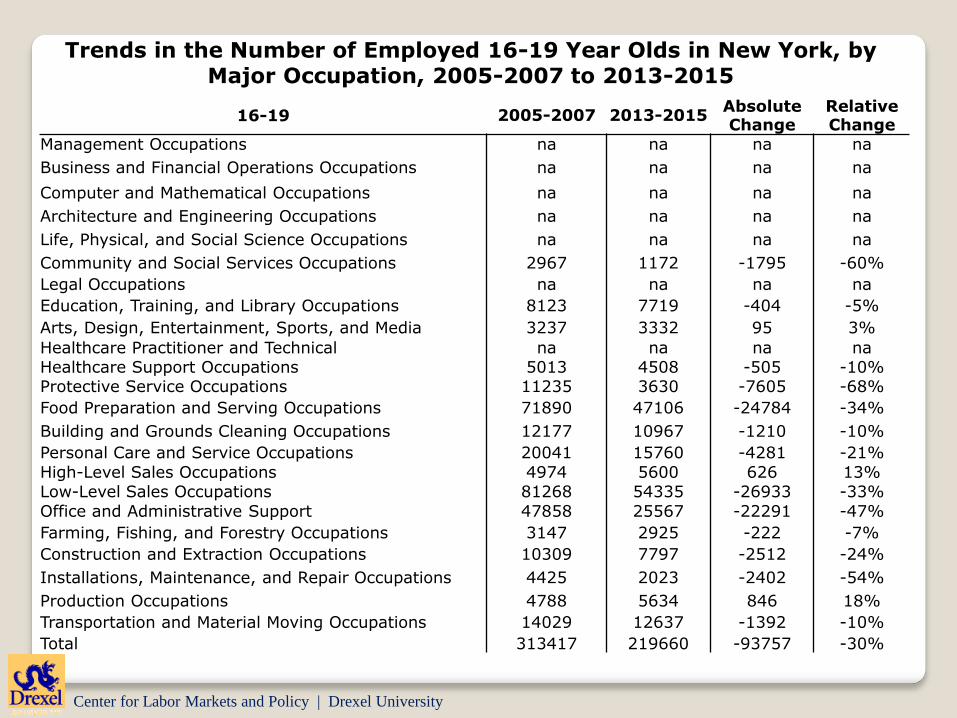
Trends in the Number of Employed 16-19 Year Olds in New York, by Major Occupation, 2005-2007 to 2013-2015
16-19 2005-2007 2013-2015Absolute Change
Relative Change
Management Occupations na na na na
Business and Financial Operations Occupations na na na na
Computer and Mathematical Occupations na na na na
Architecture and Engineering Occupations na na na na
Life, Physical, and Social Science Occupations na na na na
Community and Social Services Occupations 2967 1172 -1795 -60%
Legal Occupations na na na na
Education, Training, and Library Occupations 8123 7719 -404 -5%
Arts, Design, Entertainment, Sports, and Media 3237 3332 95 3%
Healthcare Practitioner and Technical na na na naHealthcare Support Occupations 5013 4508 -505 -10%Protective Service Occupations 11235 3630 -7605 -68%
Food Preparation and Serving Occupations 71890 47106 -24784 -34%
Building and Grounds Cleaning Occupations 12177 10967 -1210 -10%
Personal Care and Service Occupations 20041 15760 -4281 -21%
High-Level Sales Occupations 4974 5600 626 13%
Low-Level Sales Occupations 81268 54335 -26933 -33%
Office and Administrative Support 47858 25567 -22291 -47%
Farming, Fishing, and Forestry Occupations 3147 2925 -222 -7%
Construction and Extraction Occupations 10309 7797 -2512 -24%
Installations, Maintenance, and Repair Occupations 4425 2023 -2402 -54%
Production Occupations 4788 5634 846 18%
Transportation and Material Moving Occupations 14029 12637 -1392 -10%
Total 313417 219660 -93757 -30%

Center for Labor Markets and Policy | Drexel University
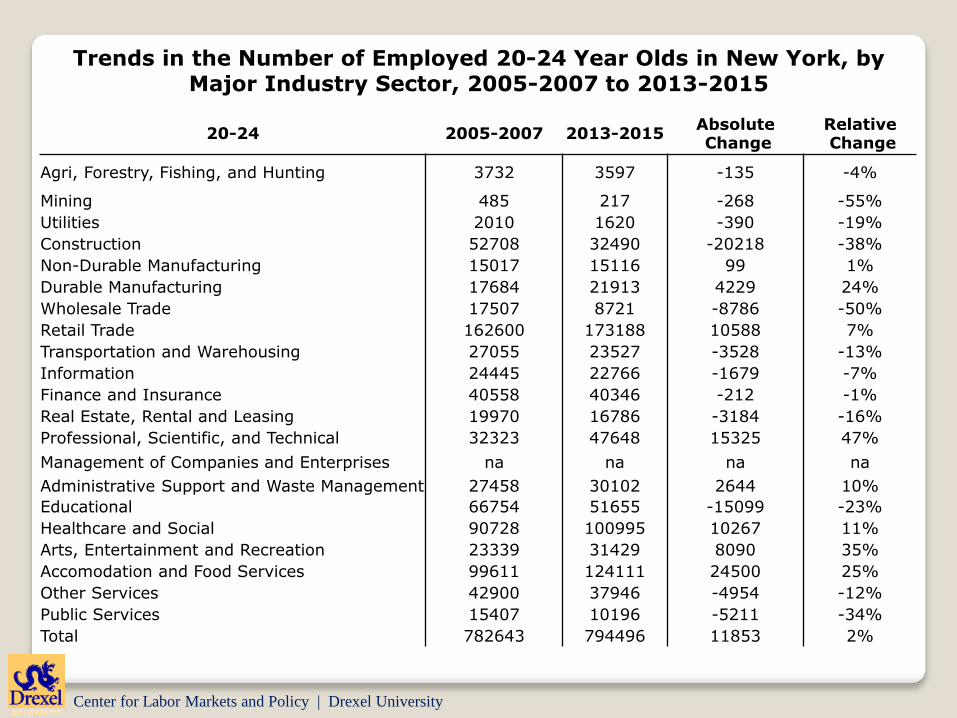
Trends in the Number of Employed 20-24 Year Olds in New York, by Major Industry Sector, 2005-2007 to 2013-2015
20-24 2005-2007 2013-2015AbsoluteChange
RelativeChange
Agri, Forestry, Fishing, and Hunting 3732 3597 -135 -4%
Mining 485 217 -268 -55%
Utilities 2010 1620 -390 -19%
Construction 52708 32490 -20218 -38%
Non-Durable Manufacturing 15017 15116 99 1%
Durable Manufacturing 17684 21913 4229 24%
Wholesale Trade 17507 8721 -8786 -50%
Retail Trade 162600 173188 10588 7%
Transportation and Warehousing 27055 23527 -3528 -13%
Information 24445 22766 -1679 -7%
Finance and Insurance 40558 40346 -212 -1%
Real Estate, Rental and Leasing 19970 16786 -3184 -16%
Professional, Scientific, and Technical 32323 47648 15325 47%
Management of Companies and Enterprises na na na na
Administrative Support and Waste Management 27458 30102 2644 10%
Educational 66754 51655 -15099 -23%
Healthcare and Social 90728 100995 10267 11%
Arts, Entertainment and Recreation 23339 31429 8090 35%
Accomodation and Food Services 99611 124111 24500 25%
Other Services 42900 37946 -4954 -12%
Public Services 15407 10196 -5211 -34%
Total 782643 794496 11853 2%

Center for Labor Markets and Policy | Drexel University
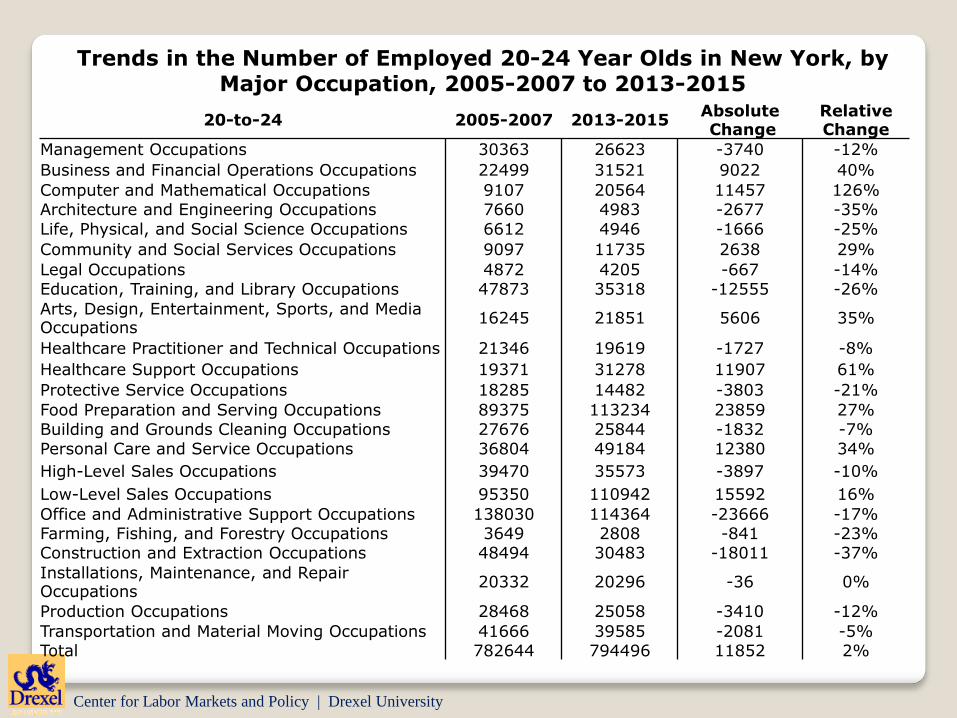
Trends in the Number of Employed 20-24 Year Olds in New York, by Major Occupation, 2005-2007 to 2013-2015
20-to-24 2005-2007 2013-2015AbsoluteChange
Relative Change
Management Occupations 30363 26623 -3740 -12%
Business and Financial Operations Occupations 22499 31521 9022 40%
Computer and Mathematical Occupations 9107 20564 11457 126%Architecture and Engineering Occupations 7660 4983 -2677 -35%
Life, Physical, and Social Science Occupations 6612 4946 -1666 -25%
Community and Social Services Occupations 9097 11735 2638 29%
Legal Occupations 4872 4205 -667 -14%Education, Training, and Library Occupations 47873 35318 -12555 -26%
Arts, Design, Entertainment, Sports, and Media Occupations
16245 21851 5606 35%
Healthcare Practitioner and Technical Occupations 21346 19619 -1727 -8%
Healthcare Support Occupations 19371 31278 11907 61%
Protective Service Occupations 18285 14482 -3803 -21%
Food Preparation and Serving Occupations 89375 113234 23859 27%
Building and Grounds Cleaning Occupations 27676 25844 -1832 -7%
Personal Care and Service Occupations 36804 49184 12380 34%
High-Level Sales Occupations 39470 35573 -3897 -10%
Low-Level Sales Occupations 95350 110942 15592 16%
Office and Administrative Support Occupations 138030 114364 -23666 -17%Farming, Fishing, and Forestry Occupations 3649 2808 -841 -23%Construction and Extraction Occupations 48494 30483 -18011 -37%
Installations, Maintenance, and Repair Occupations
20332 20296 -36 0%
Production Occupations 28468 25058 -3410 -12%
Transportation and Material Moving Occupations 41666 39585 -2081 -5%Total 782644 794496 11852 2%

Center for Labor Markets and Policy | Drexel University
Trends in the Number of Employed Aged 25+ in New York, by Major Industry Sector, 2005-2007 to 2013-2015
25 and Older 2005-2007 2013-2015Absolute Change
RelativeChange
Agri, Forestry, Fishing, and Hunting 39277 37380 -1897 -5%
Mining 7895 8754 859 11%
Utilities 58181 42321 -15860 -27%
Construction 533450 494567 -38883 -7%
Non-Durable Manufacturing 252385 217281 -35104 -14%
Durable Manufacturing 381117 334896 -46221 -12%
Wholesale Trade 216437 183909 -32528 -15%
Retail Trade 711140 715339 4199 1%
Transportation and Warehousing 424593 394428 -30165 -7%
Information 270764 237330 -33434 -12%
Finanace and Insurance 491386 522031 30645 6%
Real Estate, Rental and Leasing 195856 208093 12237 6%
Professional, Scientific and Technical 539406 698072 158666 29%
Management of Companies and Enterprises 7328 10582 3254 44%
Administrative Support and Waste Management 310690 316177 5487 2%
Educational 846118 831355 -14763 -2%
Healthcare and Social 1303209 1381868 78659 6%
Arts, Entertainment and Recreation 156419 173714 17295 11%
Accomodation and Food Services 380963 401374 20411 5%
Other Services 389039 379936 -9103 -2%
Public Services 408437 419999 11562 3%
Total 7924090 8009406 85316 1%
Center for Labor Markets and Policy | Drexel University
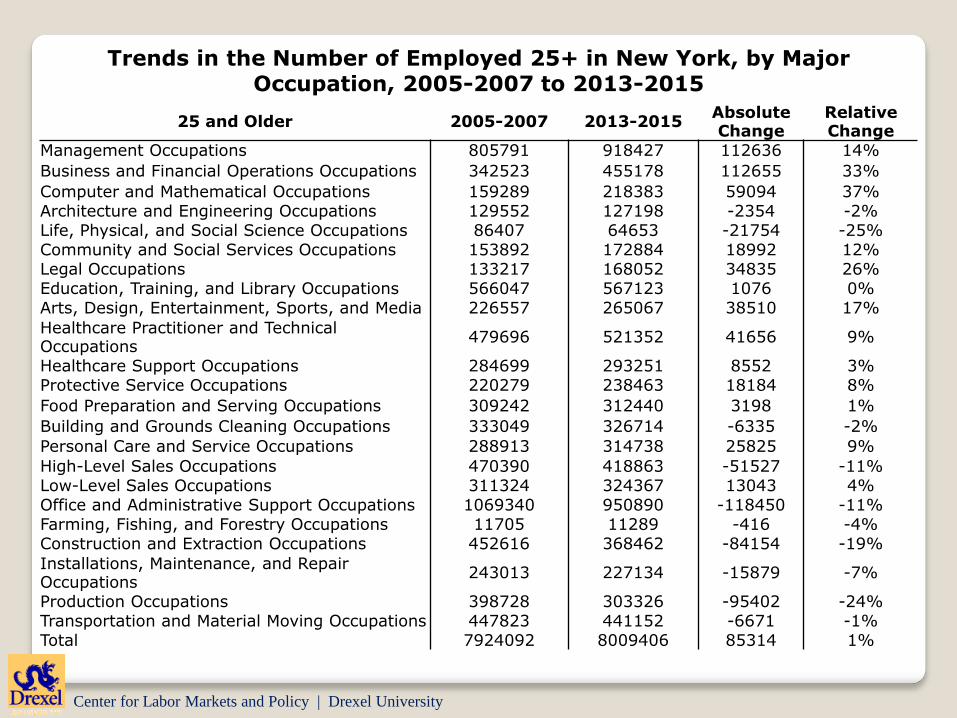
Trends in the Number of Employed 25+ in New York, by Major Occupation, 2005-2007 to 2013-2015
25 and Older 2005-2007 2013-2015Absolute Change
Relative Change
Management Occupations 805791 918427 112636 14%
Business and Financial Operations Occupations 342523 455178 112655 33%
Computer and Mathematical Occupations 159289 218383 59094 37%Architecture and Engineering Occupations 129552 127198 -2354 -2%Life, Physical, and Social Science Occupations 86407 64653 -21754 -25%Community and Social Services Occupations 153892 172884 18992 12%Legal Occupations 133217 168052 34835 26%Education, Training, and Library Occupations 566047 567123 1076 0%
Arts, Design, Entertainment, Sports, and Media 226557 265067 38510 17%
Healthcare Practitioner and Technical Occupations
479696 521352 41656 9%
Healthcare Support Occupations 284699 293251 8552 3%Protective Service Occupations 220279 238463 18184 8%
Food Preparation and Serving Occupations 309242 312440 3198 1%
Building and Grounds Cleaning Occupations 333049 326714 -6335 -2%
Personal Care and Service Occupations 288913 314738 25825 9%
High-Level Sales Occupations 470390 418863 -51527 -11%Low-Level Sales Occupations 311324 324367 13043 4%Office and Administrative Support Occupations 1069340 950890 -118450 -11%Farming, Fishing, and Forestry Occupations 11705 11289 -416 -4%Construction and Extraction Occupations 452616 368462 -84154 -19%
Installations, Maintenance, and Repair Occupations
243013 227134 -15879 -7%
Production Occupations 398728 303326 -95402 -24%Transportation and Material Moving Occupations 447823 441152 -6671 -1%Total 7924092 8009406 85314 1%
Center for Labor Markets and Policy | Drexel University
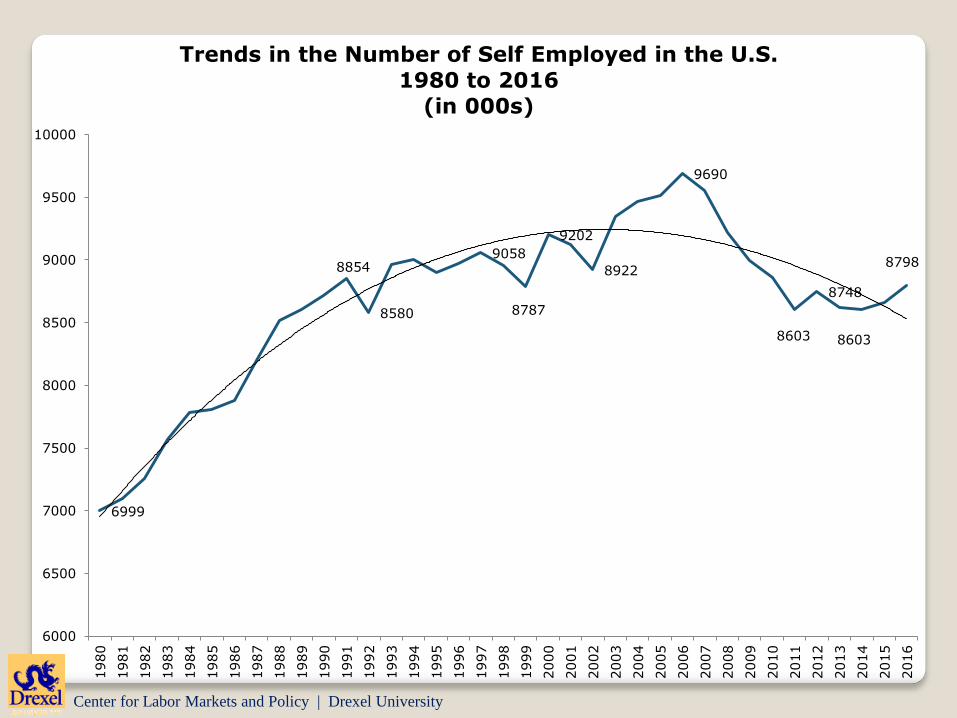
6999
8854
8580
9058
8787
9202
8922
9690
8603
8748
8603
8798
6000
6500
7000
7500
8000
8500
9000
9500
10000
1980
1981
1982
1983
1984
1985
1986
1987
1988
1989
1990
1991
1992
1993
1994
1995
1996
1997
1998
1999
2000
2001
2002
2003
2004
2005
2006
2007
2008
2009
2010
2011
2012
2013
2014
2015
2016
Trends in the Number of Self Employed in the U.S.
1980 to 2016
(in 000s)
Center for Labor Markets and Policy | Drexel University
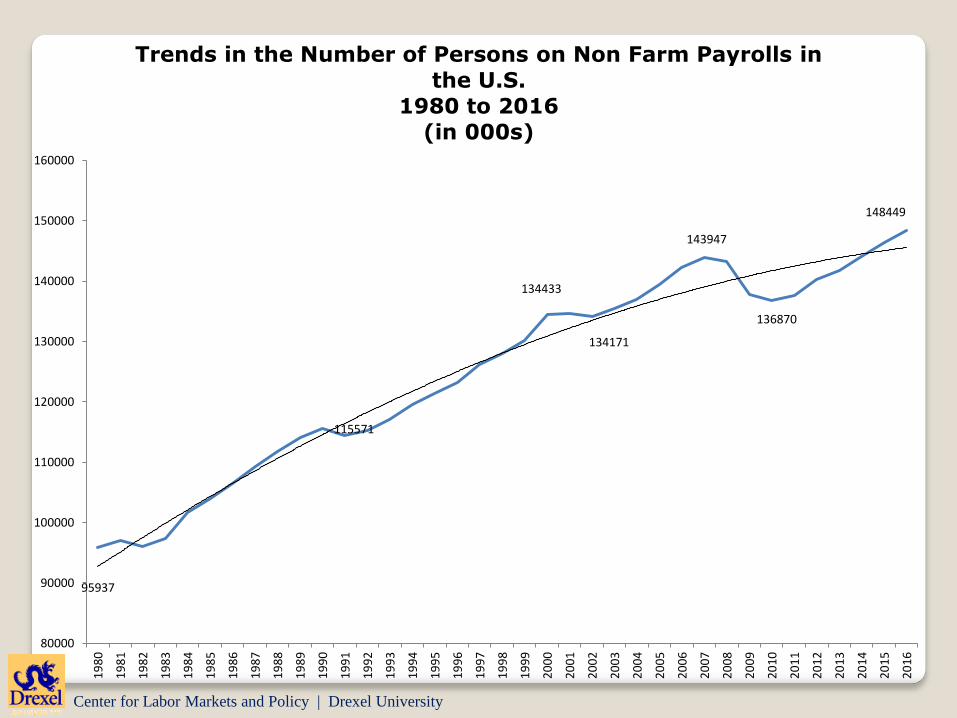
95937
115571
134433
134171
143947
136870
148449
80000
90000
100000
110000
120000
130000
140000
150000
160000
1980
1981
1982
1983
1984
1985
1986
1987
1988
1989
1990
1991
1992
1993
1994
1995
1996
1997
1998
1999
2000
2001
2002
2003
2004
2005
2006
2007
2008
2009
2010
2011
2012
2013
2014
2015
2016
Trends in the Number of Persons on Non Farm Payrolls in
the U.S.
1980 to 2016
(in 000s)
Center for Labor Markets and Policy | Drexel University
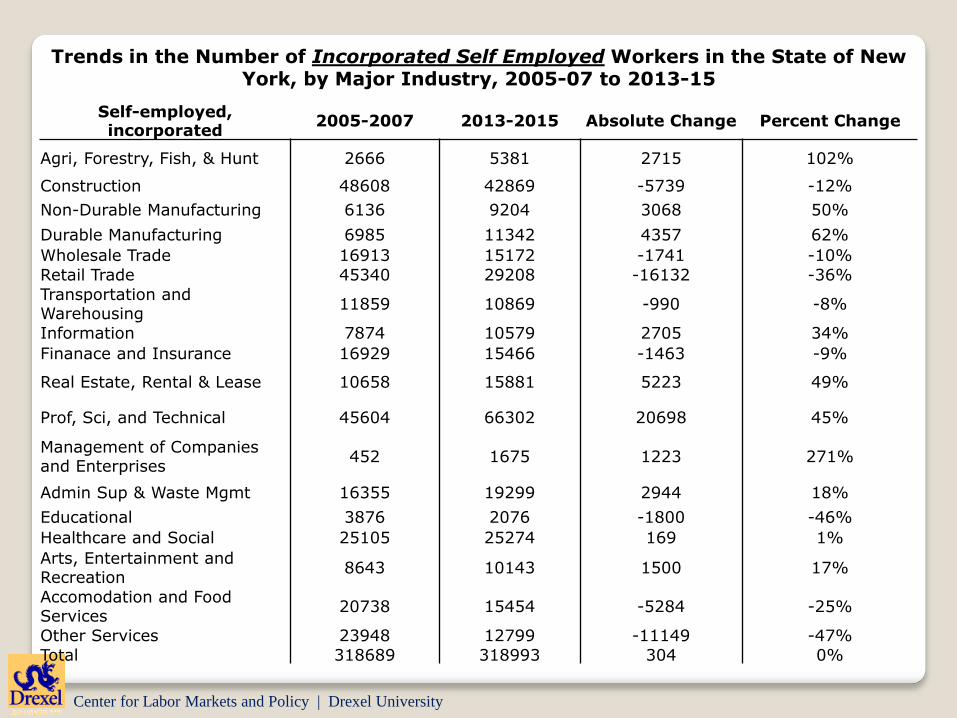
Self-employed, incorporated
2005-2007 2013-2015 Absolute Change Percent Change
Agri, Forestry, Fish, & Hunt 2666 5381 2715 102%
Construction 48608 42869 -5739 -12%
Non-Durable Manufacturing 6136 9204 3068 50%
Durable Manufacturing 6985 11342 4357 62%
Wholesale Trade 16913 15172 -1741 -10%
Retail Trade 45340 29208 -16132 -36%
Transportation and Warehousing
11859 10869 -990 -8%
Information 7874 10579 2705 34%
Finanace and Insurance 16929 15466 -1463 -9%
Real Estate, Rental & Lease 10658 15881 5223 49%
Prof, Sci, and Technical 45604 66302 20698 45%
Management of Companies and Enterprises
452 1675 1223 271%
Admin Sup & Waste Mgmt 16355 19299 2944 18%
Educational 3876 2076 -1800 -46%
Healthcare and Social 25105 25274 169 1%
Arts, Entertainment and Recreation
8643 10143 1500 17%
Accomodation and Food Services
20738 15454 -5284 -25%
Other Services 23948 12799 -11149 -47%
Total 318689 318993 304 0%
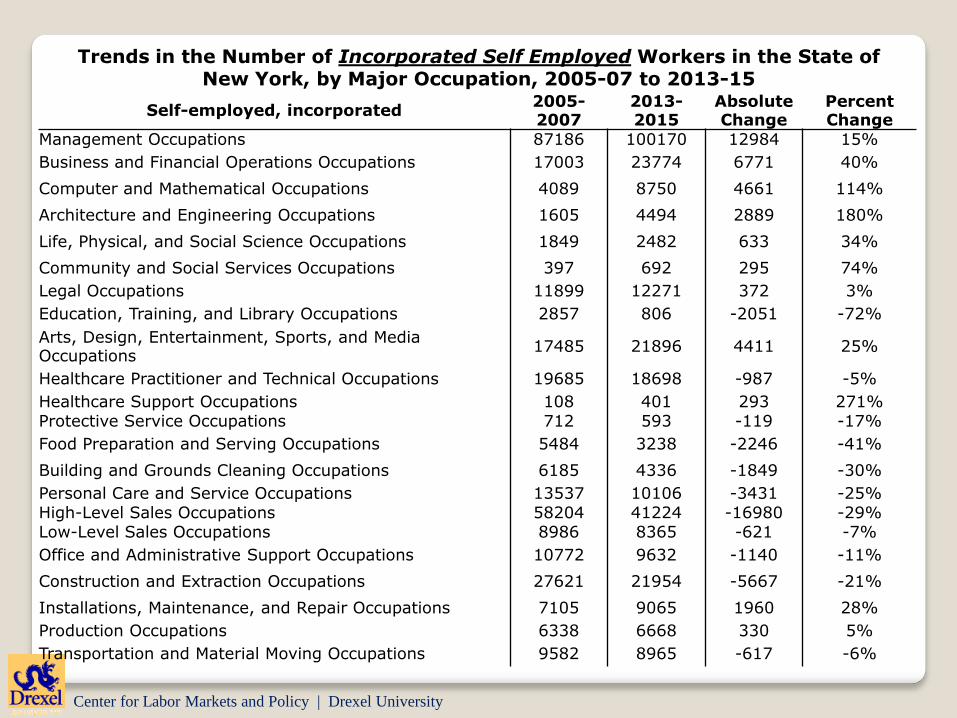
Trends in the Number of Incorporated Self Employed Workers in the State of New York, by Major Industry, 2005-07 to 2013-15
Center for Labor Markets and Policy | Drexel University
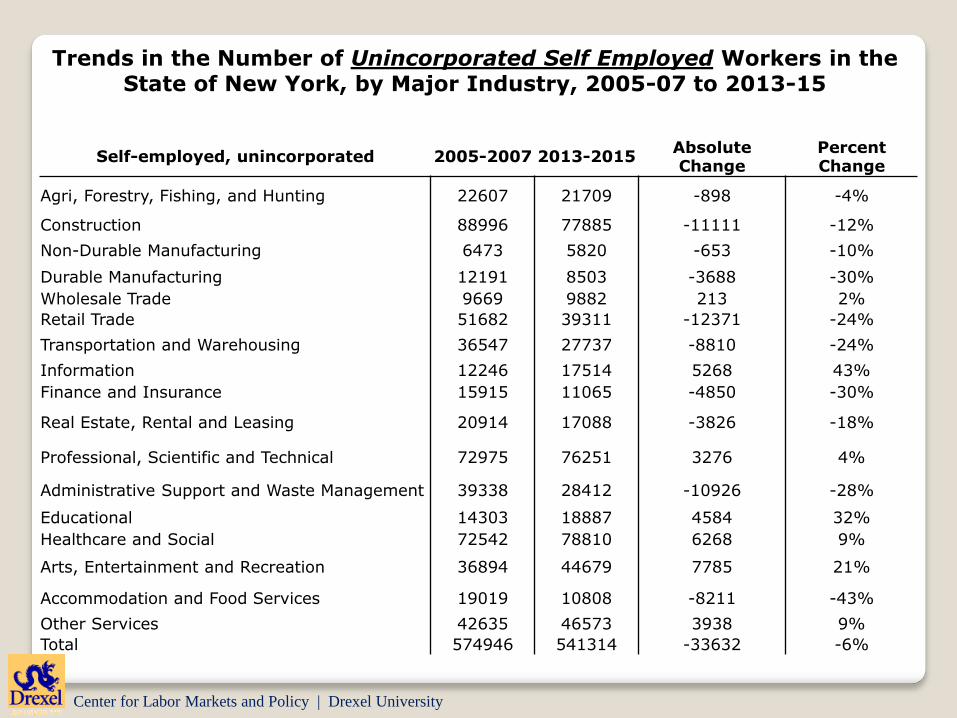
Self-employed, unincorporated 2005-2007 2013-2015Absolute Change
Percent Change
Agri, Forestry, Fishing, and Hunting 22607 21709 -898 -4%
Construction 88996 77885 -11111 -12%
Non-Durable Manufacturing 6473 5820 -653 -10%
Durable Manufacturing 12191 8503 -3688 -30%
Wholesale Trade 9669 9882 213 2%
Retail Trade 51682 39311 -12371 -24%
Transportation and Warehousing 36547 27737 -8810 -24%
Information 12246 17514 5268 43%
Finance and Insurance 15915 11065 -4850 -30%
Real Estate, Rental and Leasing 20914 17088 -3826 -18%
Professional, Scientific and Technical 72975 76251 3276 4%
Administrative Support and Waste Management 39338 28412 -10926 -28%
Educational 14303 18887 4584 32%
Healthcare and Social 72542 78810 6268 9%
Arts, Entertainment and Recreation 36894 44679 7785 21%
Accommodation and Food Services 19019 10808 -8211 -43%
Other Services 42635 46573 3938 9%
Total 574946 541314 -33632 -6%
Trends in the Number of Unincorporated Self Employed Workers in the State of New York, by Major Industry, 2005-07 to 2013-15
Center for Labor Markets and Policy | Drexel University
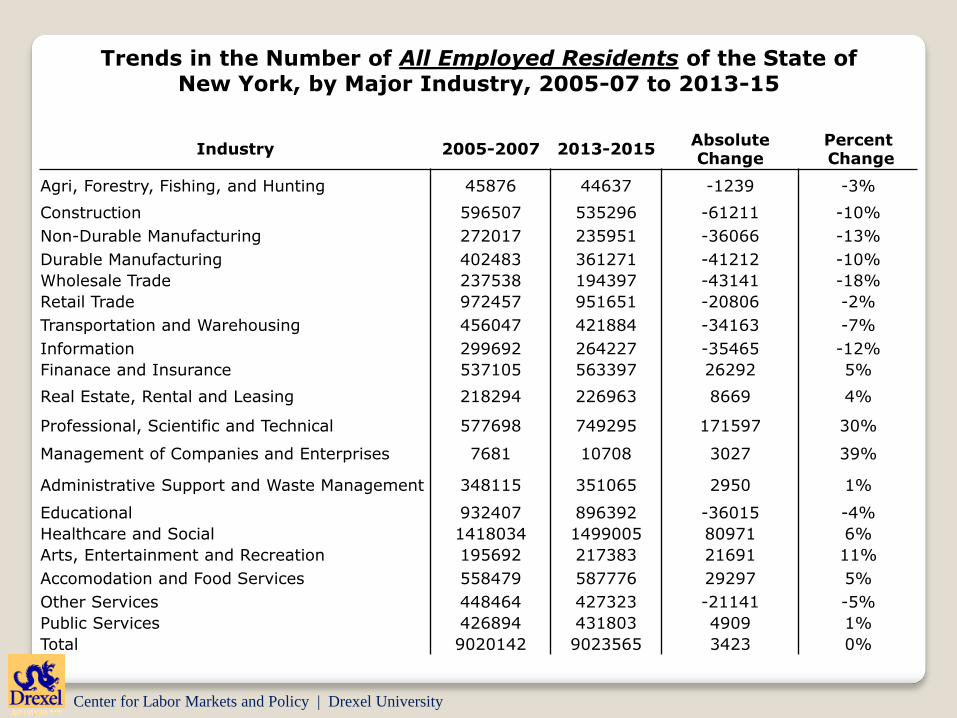
Industry 2005-2007 2013-2015Absolute Change
PercentChange
Agri, Forestry, Fishing, and Hunting 45876 44637 -1239 -3%
Construction 596507 535296 -61211 -10%
Non-Durable Manufacturing 272017 235951 -36066 -13%
Durable Manufacturing 402483 361271 -41212 -10%
Wholesale Trade 237538 194397 -43141 -18%
Retail Trade 972457 951651 -20806 -2%
Transportation and Warehousing 456047 421884 -34163 -7%
Information 299692 264227 -35465 -12%
Finanace and Insurance 537105 563397 26292 5%
Real Estate, Rental and Leasing 218294 226963 8669 4%
Professional, Scientific and Technical 577698 749295 171597 30%
Management of Companies and Enterprises 7681 10708 3027 39%
Administrative Support and Waste Management 348115 351065 2950 1%
Educational 932407 896392 -36015 -4%
Healthcare and Social 1418034 1499005 80971 6%
Arts, Entertainment and Recreation 195692 217383 21691 11%
Accomodation and Food Services 558479 587776 29297 5%
Other Services 448464 427323 -21141 -5%
Public Services 426894 431803 4909 1%
Total 9020142 9023565 3423 0%
Trends in the Number of All Employed Residents of the State of New York, by Major Industry, 2005-07 to 2013-15
Center for Labor Markets and Policy | Drexel University
Self-employed, incorporated2005-2007
2013-2015
Absolute Change
Percent Change
Management Occupations 87186 100170 12984 15%
Business and Financial Operations Occupations 17003 23774 6771 40%
Computer and Mathematical Occupations 4089 8750 4661 114%
Architecture and Engineering Occupations 1605 4494 2889 180%
Life, Physical, and Social Science Occupations 1849 2482 633 34%
Community and Social Services Occupations 397 692 295 74%
Legal Occupations 11899 12271 372 3%
Education, Training, and Library Occupations 2857 806 -2051 -72%
Arts, Design, Entertainment, Sports, and Media Occupations
17485 21896 4411 25%
Healthcare Practitioner and Technical Occupations 19685 18698 -987 -5%
Healthcare Support Occupations 108 401 293 271%Protective Service Occupations 712 593 -119 -17%
Food Preparation and Serving Occupations 5484 3238 -2246 -41%
Building and Grounds Cleaning Occupations 6185 4336 -1849 -30%
Personal Care and Service Occupations 13537 10106 -3431 -25%High-Level Sales Occupations 58204 41224 -16980 -29%Low-Level Sales Occupations 8986 8365 -621 -7%
Office and Administrative Support Occupations 10772 9632 -1140 -11%
Construction and Extraction Occupations 27621 21954 -5667 -21%
Installations, Maintenance, and Repair Occupations 7105 9065 1960 28%
Production Occupations 6338 6668 330 5%
Transportation and Material Moving Occupations 9582 8965 -617 -6%
Trends in the Number of Incorporated Self Employed Workers in the State of New York, by Major Occupation, 2005-07 to 2013-15
Center for Labor Markets and Policy | Drexel University
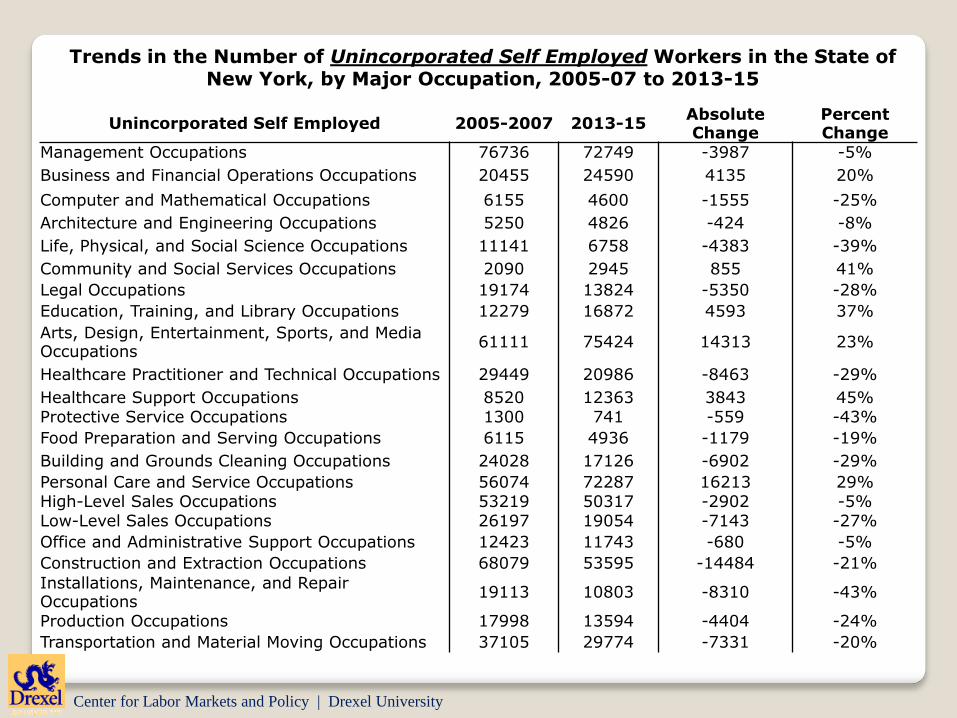
Unincorporated Self Employed 2005-2007 2013-15Absolute Change
Percent Change
Management Occupations 76736 72749 -3987 -5%
Business and Financial Operations Occupations 20455 24590 4135 20%
Computer and Mathematical Occupations 6155 4600 -1555 -25%
Architecture and Engineering Occupations 5250 4826 -424 -8%
Life, Physical, and Social Science Occupations 11141 6758 -4383 -39%
Community and Social Services Occupations 2090 2945 855 41%
Legal Occupations 19174 13824 -5350 -28%
Education, Training, and Library Occupations 12279 16872 4593 37%
Arts, Design, Entertainment, Sports, and Media Occupations
61111 75424 14313 23%
Healthcare Practitioner and Technical Occupations 29449 20986 -8463 -29%
Healthcare Support Occupations 8520 12363 3843 45%Protective Service Occupations 1300 741 -559 -43%
Food Preparation and Serving Occupations 6115 4936 -1179 -19%
Building and Grounds Cleaning Occupations 24028 17126 -6902 -29%
Personal Care and Service Occupations 56074 72287 16213 29%High-Level Sales Occupations 53219 50317 -2902 -5%Low-Level Sales Occupations 26197 19054 -7143 -27%
Office and Administrative Support Occupations 12423 11743 -680 -5%
Construction and Extraction Occupations 68079 53595 -14484 -21%
Installations, Maintenance, and Repair Occupations
19113 10803 -8310 -43%
Production Occupations 17998 13594 -4404 -24%
Transportation and Material Moving Occupations 37105 29774 -7331 -20%
Trends in the Number of Unincorporated Self Employed Workers in the State of New York, by Major Occupation, 2005-07 to 2013-15
Center for Labor Markets and Policy | Drexel University
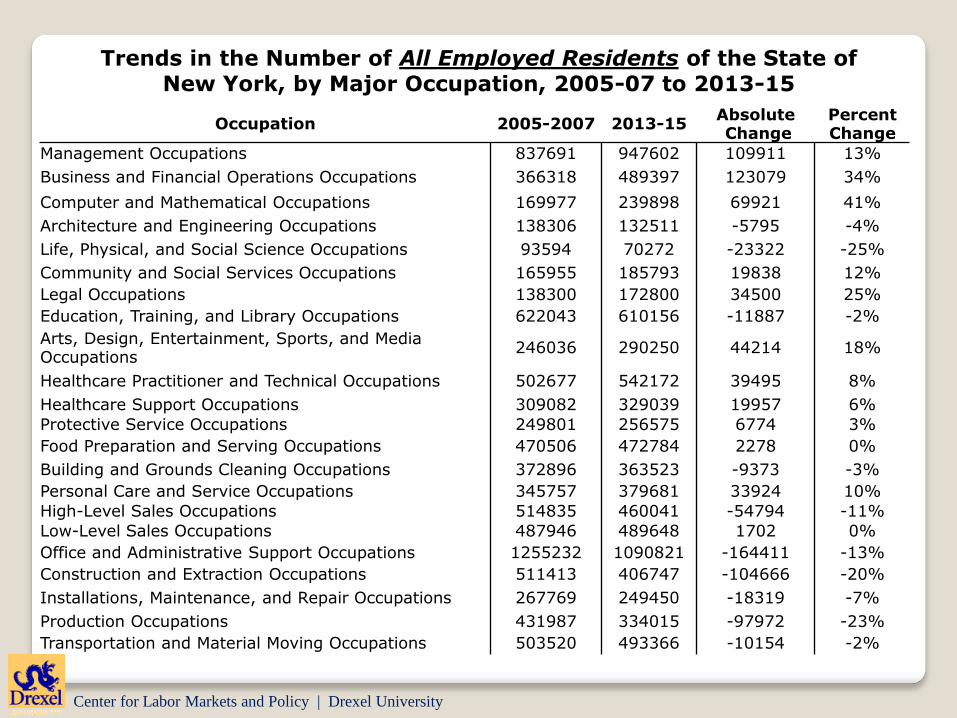
Occupation 2005-2007 2013-15AbsoluteChange
Percent Change
Management Occupations 837691 947602 109911 13%
Business and Financial Operations Occupations 366318 489397 123079 34%
Computer and Mathematical Occupations 169977 239898 69921 41%
Architecture and Engineering Occupations 138306 132511 -5795 -4%
Life, Physical, and Social Science Occupations 93594 70272 -23322 -25%
Community and Social Services Occupations 165955 185793 19838 12%
Legal Occupations 138300 172800 34500 25%
Education, Training, and Library Occupations 622043 610156 -11887 -2%
Arts, Design, Entertainment, Sports, and Media Occupations
246036 290250 44214 18%
Healthcare Practitioner and Technical Occupations 502677 542172 39495 8%
Healthcare Support Occupations 309082 329039 19957 6%
Protective Service Occupations 249801 256575 6774 3%
Food Preparation and Serving Occupations 470506 472784 2278 0%
Building and Grounds Cleaning Occupations 372896 363523 -9373 -3%
Personal Care and Service Occupations 345757 379681 33924 10%
High-Level Sales Occupations 514835 460041 -54794 -11%
Low-Level Sales Occupations 487946 489648 1702 0%
Office and Administrative Support Occupations 1255232 1090821 -164411 -13%
Construction and Extraction Occupations 511413 406747 -104666 -20%
Installations, Maintenance, and Repair Occupations 267769 249450 -18319 -7%
Production Occupations 431987 334015 -97972 -23%
Transportation and Material Moving Occupations 503520 493366 -10154 -2%
Trends in the Number of All Employed Residents of the State of New York, by Major Occupation, 2005-07 to 2013-15
Center for Labor Markets and Policy | Drexel University
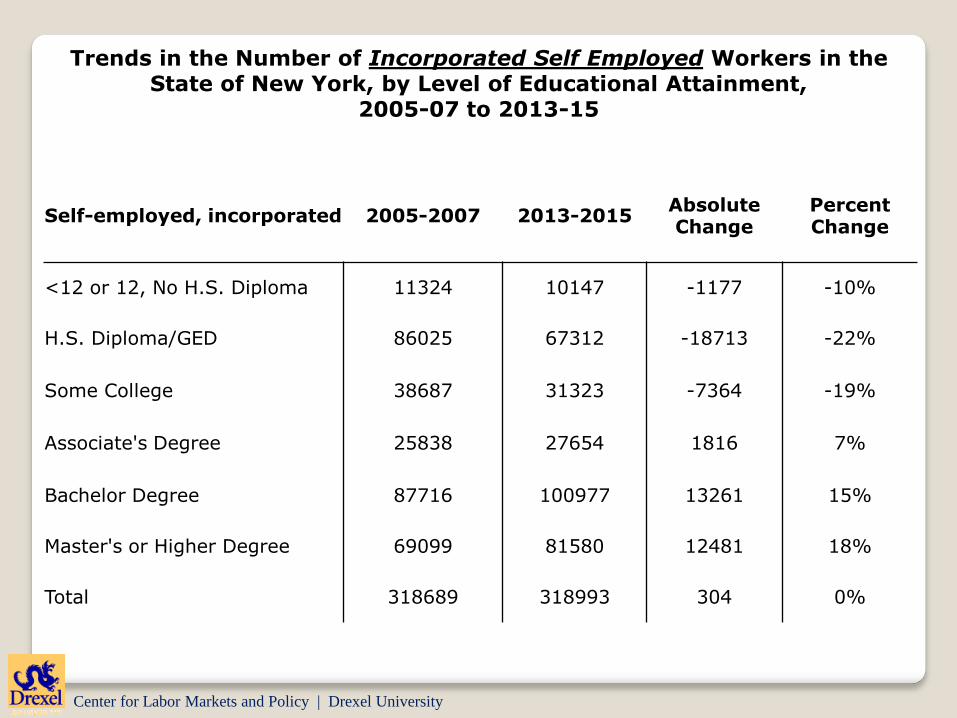
Trends in the Number of Incorporated Self Employed Workers in the State of New York, by Level of Educational Attainment,
2005-07 to 2013-15
Self-employed, incorporated 2005-2007 2013-2015Absolute Change
Percent Change
<12 or 12, No H.S. Diploma 11324 10147 -1177 -10%
H.S. Diploma/GED 86025 67312 -18713 -22%
Some College 38687 31323 -7364 -19%
Associate's Degree 25838 27654 1816 7%
Bachelor Degree 87716 100977 13261 15%
Master's or Higher Degree 69099 81580 12481 18%
Total 318689 318993 304 0%
Center for Labor Markets and Policy | Drexel University
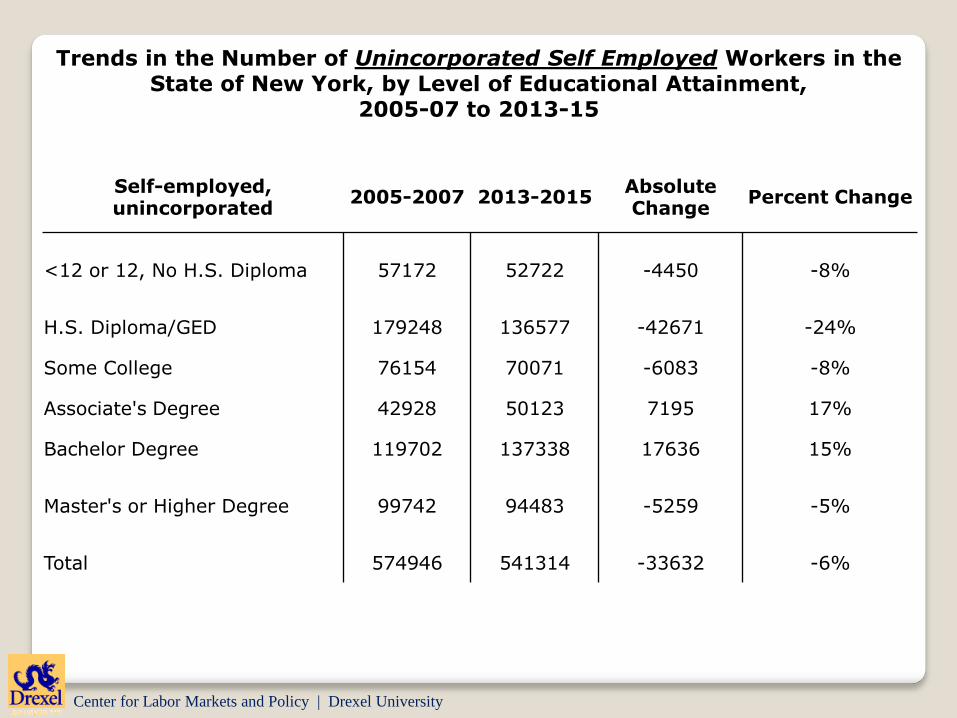
Trends in the Number of Unincorporated Self Employed Workers in the State of New York, by Level of Educational Attainment,
2005-07 to 2013-15
Self-employed, unincorporated
2005-2007 2013-2015Absolute Change
Percent Change
<12 or 12, No H.S. Diploma 57172 52722 -4450 -8%
H.S. Diploma/GED 179248 136577 -42671 -24%
Some College 76154 70071 -6083 -8%
Associate's Degree 42928 50123 7195 17%
Bachelor Degree 119702 137338 17636 15%
Master's or Higher Degree 99742 94483 -5259 -5%
Total 574946 541314 -33632 -6%
Center for Labor Markets and Policy | Drexel University
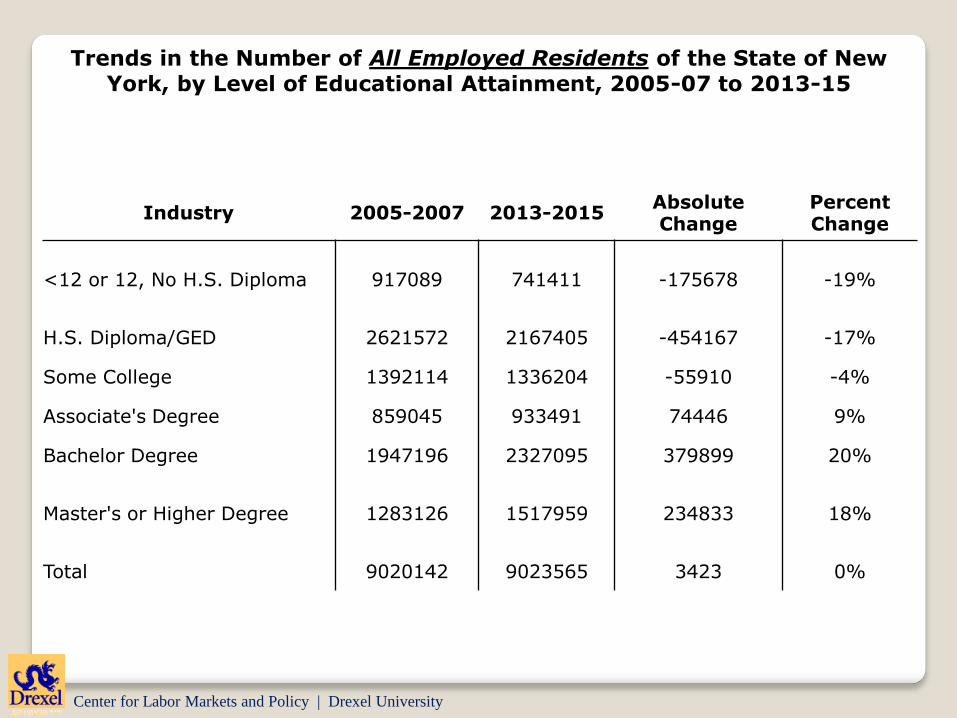
Trends in the Number of All Employed Residents of the State of New York, by Level of Educational Attainment, 2005-07 to 2013-15
Industry 2005-2007 2013-2015Absolute Change
Percent Change
<12 or 12, No H.S. Diploma 917089 741411 -175678 -19%
H.S. Diploma/GED 2621572 2167405 -454167 -17%
Some College 1392114 1336204 -55910 -4%
Associate's Degree 859045 933491 74446 9%
Bachelor Degree 1947196 2327095 379899 20%
Master's or Higher Degree 1283126 1517959 234833 18%
Total 9020142 9023565 3423 0%
Center for Labor Markets and Policy | Drexel University
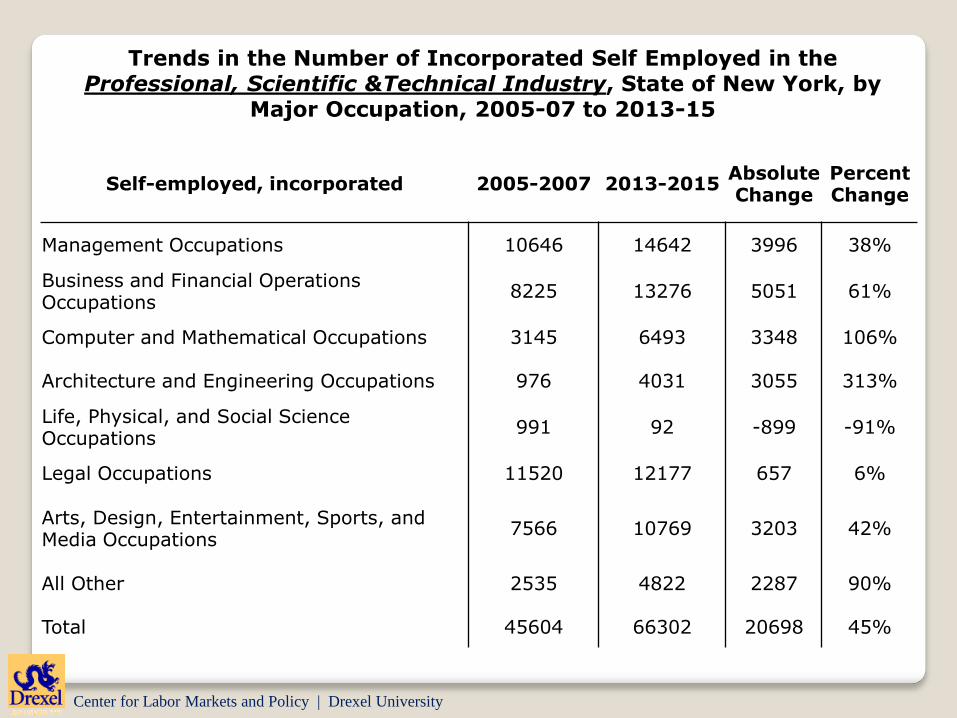
Trends in the Number of Incorporated Self Employed in the Professional, Scientific &Technical Industry, State of New York, by
Major Occupation, 2005-07 to 2013-15
Self-employed, incorporated 2005-2007 2013-2015Absolute Change
Percent Change
Management Occupations 10646 14642 3996 38%
Business and Financial Operations Occupations
8225 13276 5051 61%
Computer and Mathematical Occupations 3145 6493 3348 106%
Architecture and Engineering Occupations 976 4031 3055 313%
Life, Physical, and Social Science Occupations
991 92 -899 -91%
Legal Occupations 11520 12177 657 6%
Arts, Design, Entertainment, Sports, and Media Occupations
7566 10769 3203 42%
All Other 2535 4822 2287 90%
Total 45604 66302 20698 45%
Center for Labor Markets and Policy | Drexel University
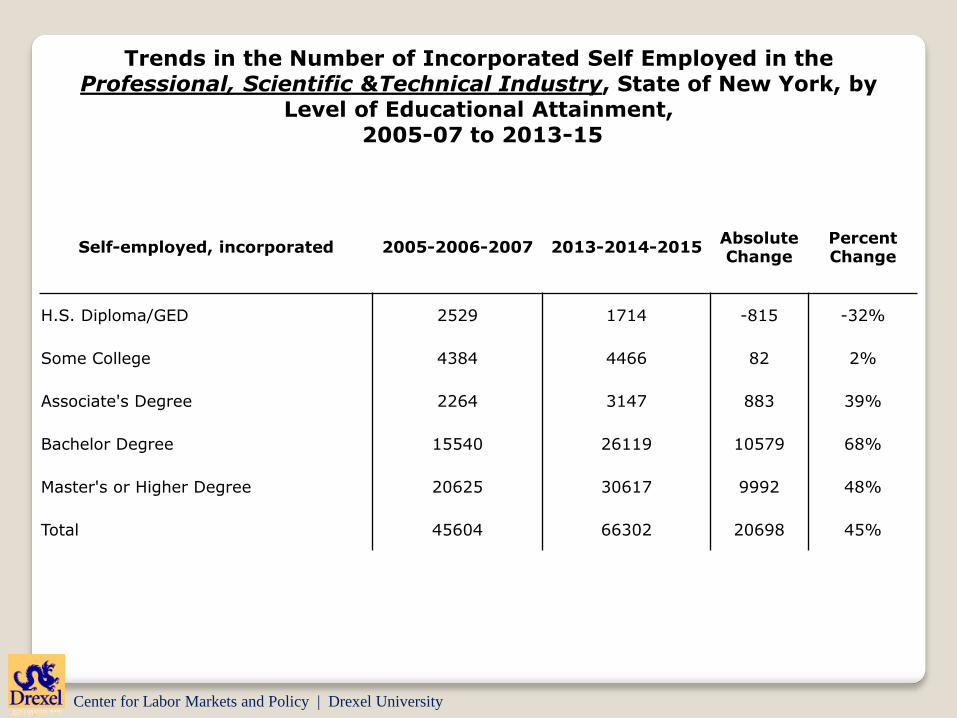
Self-employed, incorporated 2005-2006-2007 2013-2014-2015Absolute Change
Percent Change
H.S. Diploma/GED 2529 1714 -815 -32%
Some College 4384 4466 82 2%
Associate's Degree 2264 3147 883 39%
Bachelor Degree 15540 26119 10579 68%
Master's or Higher Degree 20625 30617 9992 48%
Total 45604 66302 20698 45%
Trends in the Number of Incorporated Self Employed in the Professional, Scientific &Technical Industry, State of New York, by
Level of Educational Attainment,2005-07 to 2013-15
Center for Labor Markets and Policy | Drexel University
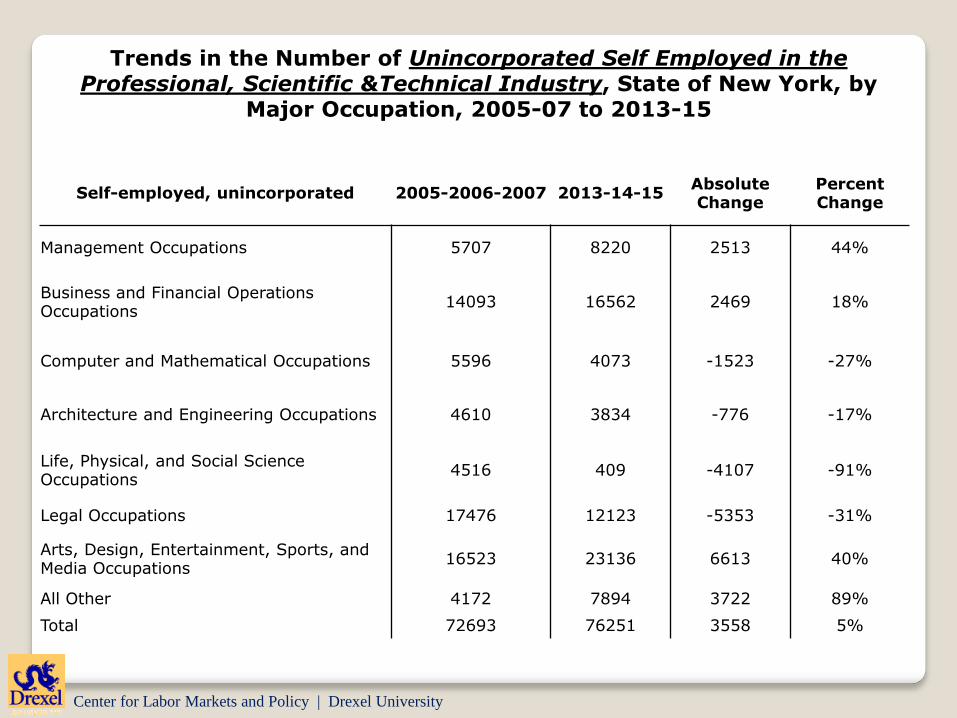
Self-employed, unincorporated 2005-2006-2007 2013-14-15Absolute Change
Percent Change
Management Occupations 5707 8220 2513 44%
Business and Financial Operations Occupations
14093 16562 2469 18%
Computer and Mathematical Occupations 5596 4073 -1523 -27%
Architecture and Engineering Occupations 4610 3834 -776 -17%
Life, Physical, and Social Science Occupations
4516 409 -4107 -91%
Legal Occupations 17476 12123 -5353 -31%
Arts, Design, Entertainment, Sports, and Media Occupations
16523 23136 6613 40%
All Other 4172 7894 3722 89%
Total 72693 76251 3558 5%
Trends in the Number of Unincorporated Self Employed in the Professional, Scientific &Technical Industry, State of New York, by
Major Occupation, 2005-07 to 2013-15
Center for Labor Markets and Policy | Drexel University
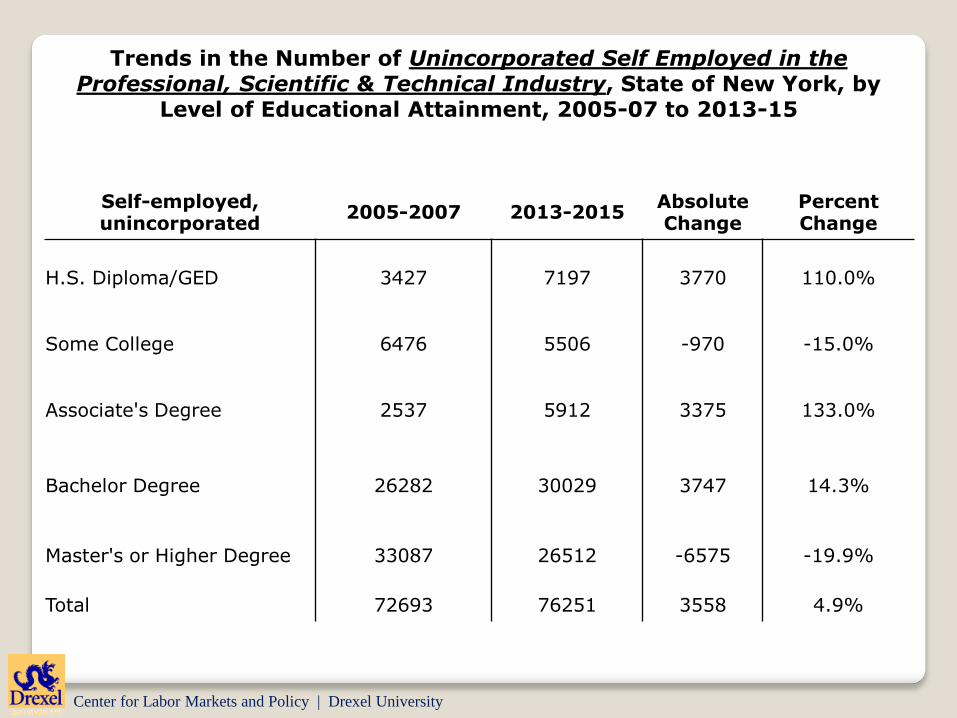
Self-employed, unincorporated
2005-2007 2013-2015Absolute Change
Percent Change
H.S. Diploma/GED 3427 7197 3770 110.0%
Some College 6476 5506 -970 -15.0%
Associate's Degree 2537 5912 3375 133.0%
Bachelor Degree 26282 30029 3747 14.3%
Master's or Higher Degree 33087 26512 -6575 -19.9%
Total 72693 76251 3558 4.9%
Trends in the Number of Unincorporated Self Employed in the Professional, Scientific & Technical Industry, State of New York, by
Level of Educational Attainment, 2005-07 to 2013-15
Center for Labor Markets and Policy | Drexel University
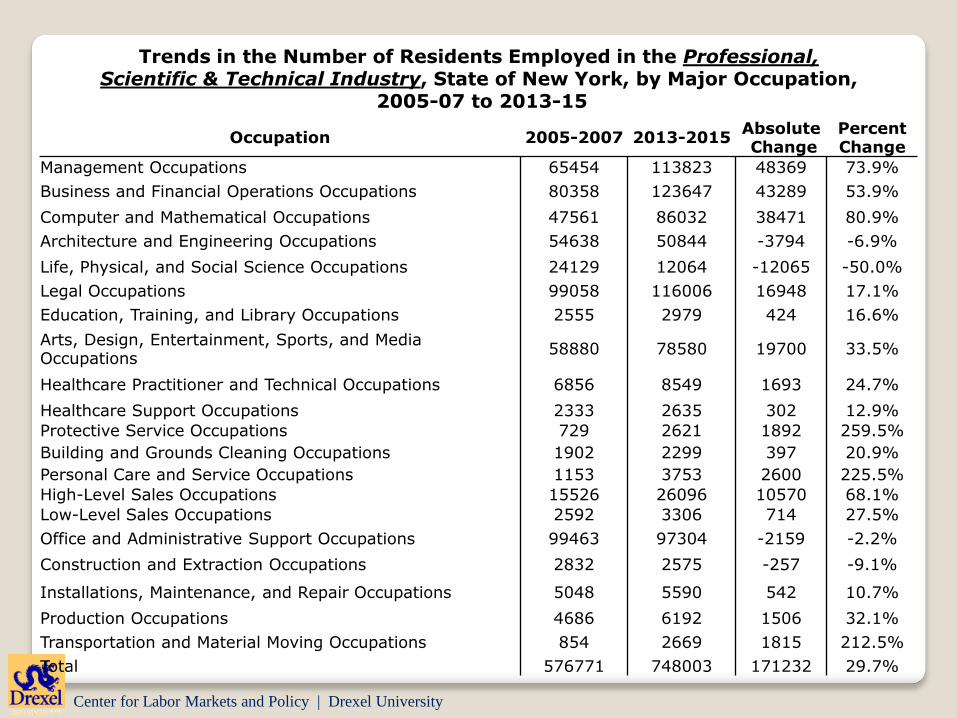
Occupation 2005-2007 2013-2015AbsoluteChange
Percent Change
Management Occupations 65454 113823 48369 73.9%
Business and Financial Operations Occupations 80358 123647 43289 53.9%
Computer and Mathematical Occupations 47561 86032 38471 80.9%
Architecture and Engineering Occupations 54638 50844 -3794 -6.9%
Life, Physical, and Social Science Occupations 24129 12064 -12065 -50.0%
Legal Occupations 99058 116006 16948 17.1%
Education, Training, and Library Occupations 2555 2979 424 16.6%
Arts, Design, Entertainment, Sports, and Media Occupations
58880 78580 19700 33.5%
Healthcare Practitioner and Technical Occupations 6856 8549 1693 24.7%
Healthcare Support Occupations 2333 2635 302 12.9%
Protective Service Occupations 729 2621 1892 259.5%
Building and Grounds Cleaning Occupations 1902 2299 397 20.9%
Personal Care and Service Occupations 1153 3753 2600 225.5%
High-Level Sales Occupations 15526 26096 10570 68.1%
Low-Level Sales Occupations 2592 3306 714 27.5%
Office and Administrative Support Occupations 99463 97304 -2159 -2.2%
Construction and Extraction Occupations 2832 2575 -257 -9.1%
Installations, Maintenance, and Repair Occupations 5048 5590 542 10.7%
Production Occupations 4686 6192 1506 32.1%
Transportation and Material Moving Occupations 854 2669 1815 212.5%
Total 576771 748003 171232 29.7%
Trends in the Number of Residents Employed in the Professional,Scientific & Technical Industry, State of New York, by Major Occupation,
2005-07 to 2013-15
Center for Labor Markets and Policy | Drexel University
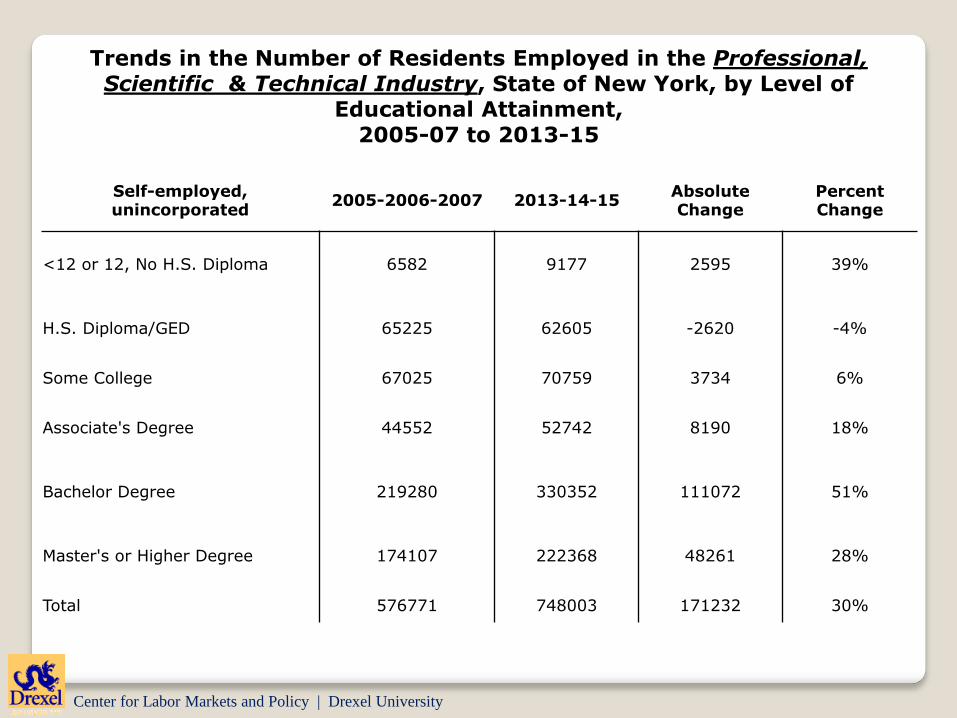
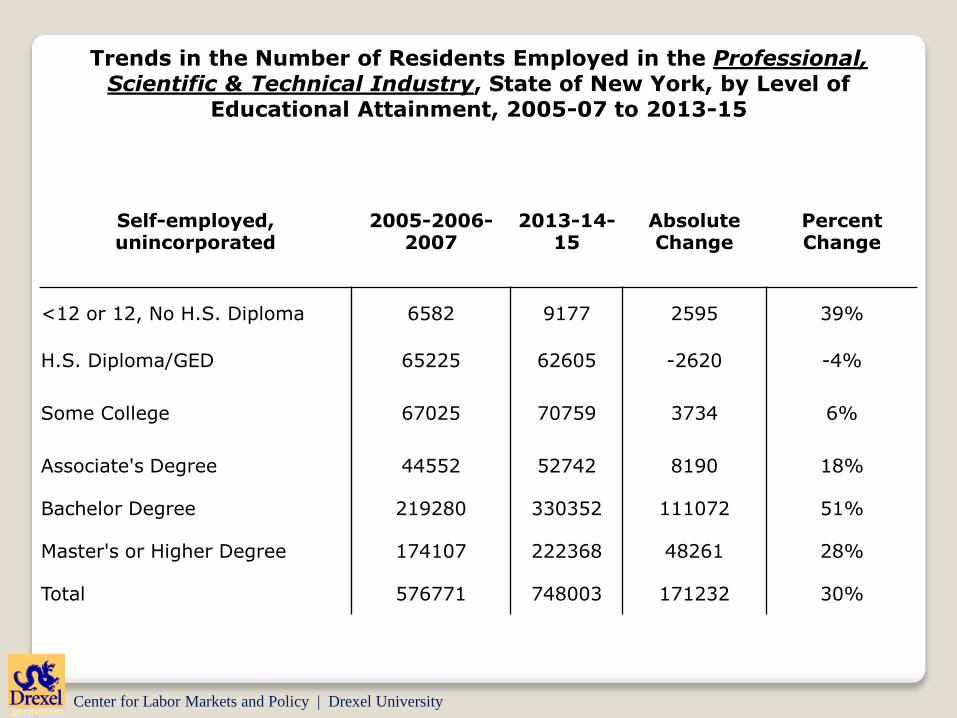
Trends in the Number of Residents Employed in the Professional,Scientific & Technical Industry, State of New York, by Level of
Educational Attainment,2005-07 to 2013-15
Self-employed, unincorporated
2005-2006-2007 2013-14-15Absolute Change
Percent Change
<12 or 12, No H.S. Diploma 6582 9177 2595 39%
H.S. Diploma/GED 65225 62605 -2620 -4%
Some College 67025 70759 3734 6%
Associate's Degree 44552 52742 8190 18%
Bachelor Degree 219280 330352 111072 51%
Master's or Higher Degree 174107 222368 48261 28%
Total 576771 748003 171232 30%
Center for Labor Markets and Policy | Drexel University
Trends in the Number of Residents Employed in the Professional,Scientific & Technical Industry, State of New York, by Level of
Educational Attainment, 2005-07 to 2013-15
Self-employed, unincorporated
2005-2006-2007
2013-14-15
Absolute Change
Percent Change
<12 or 12, No H.S. Diploma 6582 9177 2595 39%
H.S. Diploma/GED 65225 62605 -2620 -4%
Some College 67025 70759 3734 6%
Associate's Degree 44552 52742 8190 18%
Bachelor Degree 219280 330352 111072 51%
Master's or Higher Degree 174107 222368 48261 28%
Total 576771 748003 171232 30%
Center for Labor Markets and Policy | Drexel University
Hudson Valley Self Employment
Center for Labor Markets and Policy | Drexel University
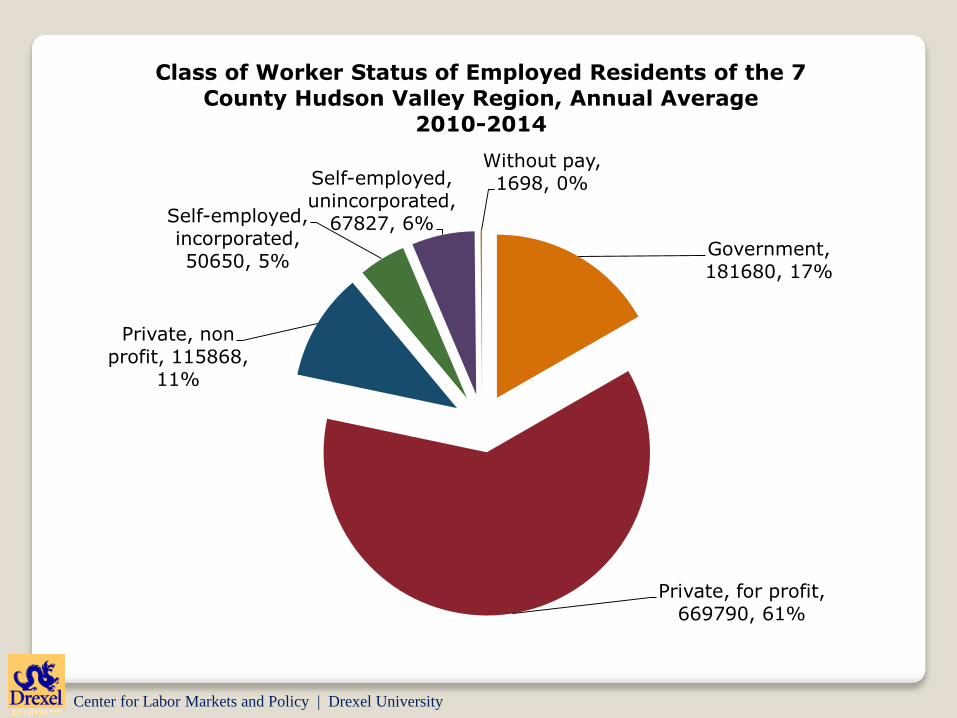
Government, 181680, 17%
Private, for profit, 669790, 61%
Private, non profit, 115868,
11%
Self-employed, incorporated, 50650, 5%
Self-employed, unincorporated,
67827, 6%
Without pay, 1698, 0%
Class of Worker Status of Employed Residents of the 7
County Hudson Valley Region, Annual Average
2010-2014
Center for Labor Markets and Policy | Drexel University
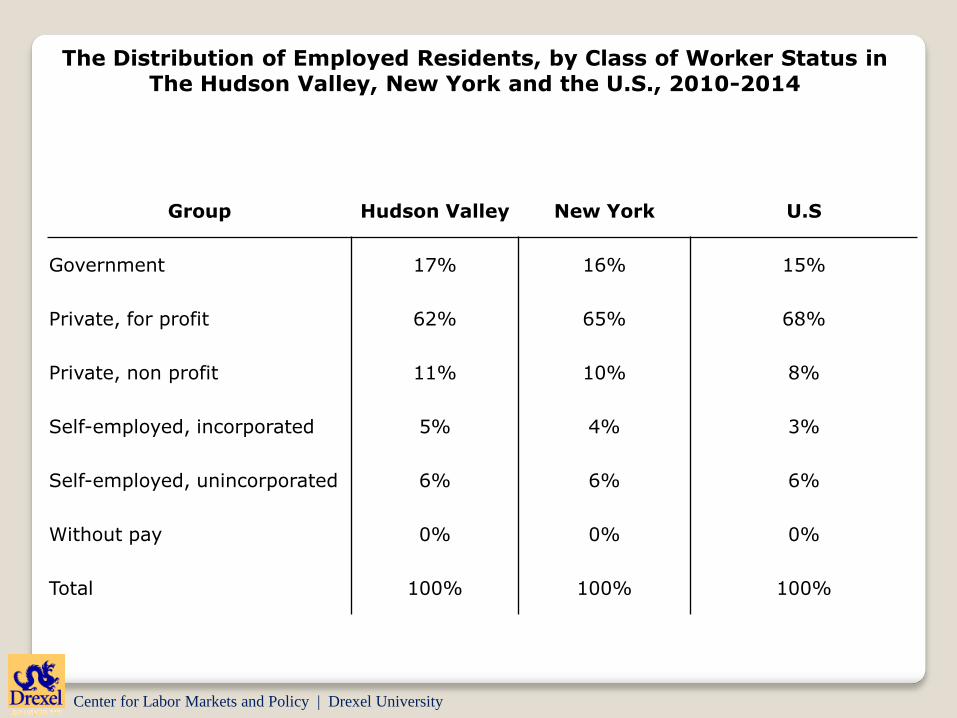
The Distribution of Employed Residents, by Class of Worker Status in The Hudson Valley, New York and the U.S., 2010-2014
Group Hudson Valley New York U.S
Government 17% 16% 15%
Private, for profit 62% 65% 68%
Private, non profit 11% 10% 8%
Self-employed, incorporated 5% 4% 3%
Self-employed, unincorporated 6% 6% 6%
Without pay 0% 0% 0%
Total 100% 100% 100%
Center for Labor Markets and Policy | Drexel University
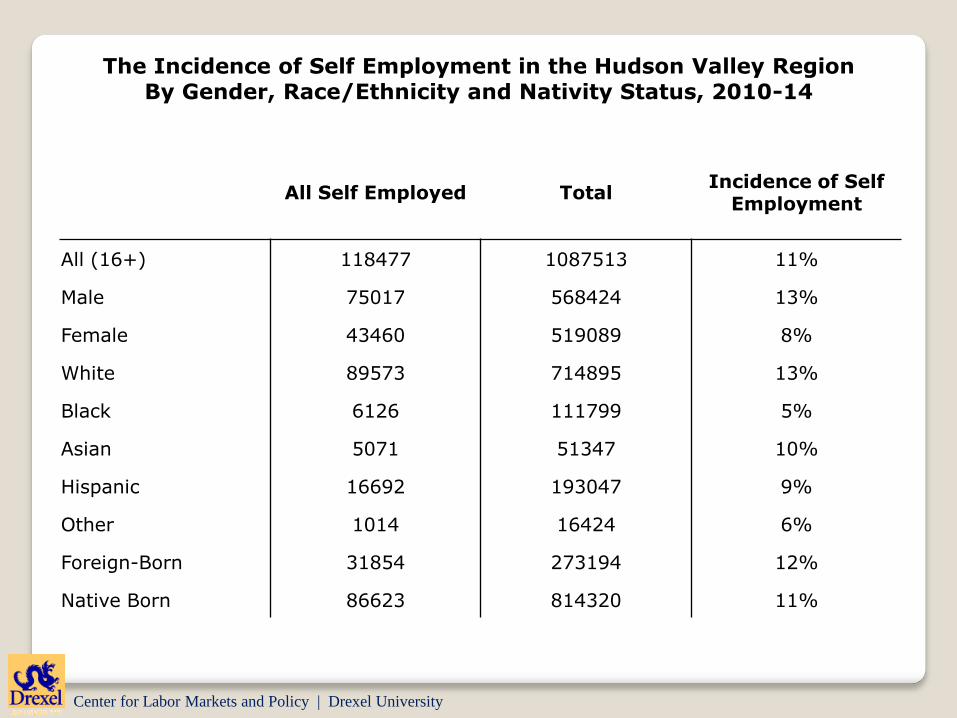
The Incidence of Self Employment in the Hudson Valley RegionBy Gender, Race/Ethnicity and Nativity Status, 2010-14
All Self Employed TotalIncidence of Self
Employment
All (16+) 118477 1087513 11%
Male 75017 568424 13%
Female 43460 519089 8%
White 89573 714895 13%
Black 6126 111799 5%
Asian 5071 51347 10%
Hispanic 16692 193047 9%
Other 1014 16424 6%
Foreign-Born 31854 273194 12%
Native Born 86623 814320 11%
Center for Labor Markets and Policy | Drexel University
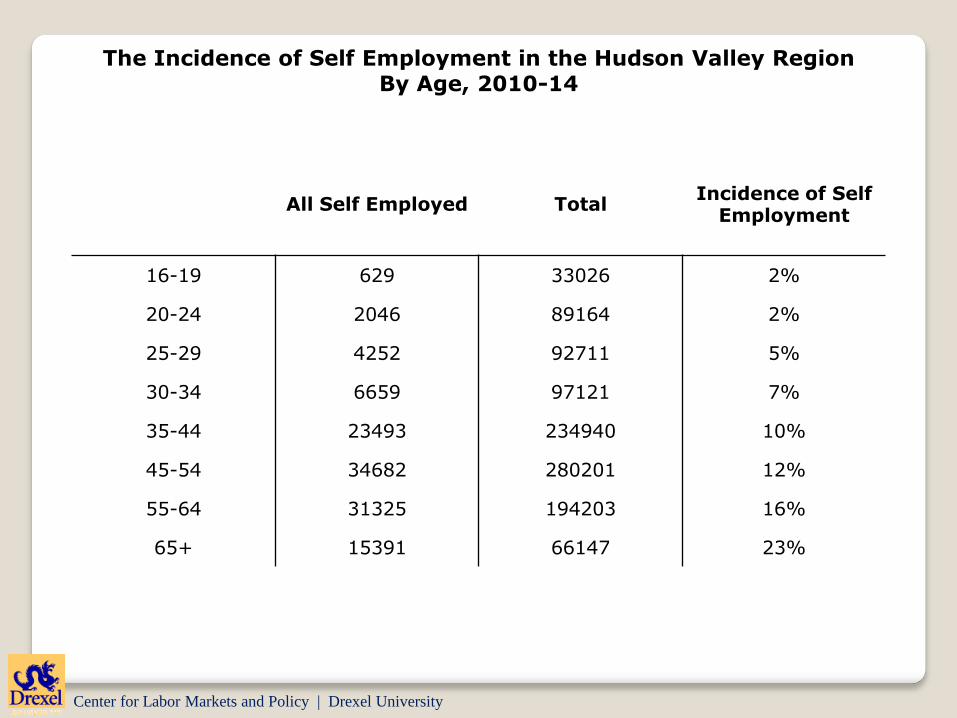
The Incidence of Self Employment in the Hudson Valley RegionBy Age, 2010-14
All Self Employed TotalIncidence of Self
Employment
16-19 629 33026 2%
20-24 2046 89164 2%
25-29 4252 92711 5%
30-34 6659 97121 7%
35-44 23493 234940 10%
45-54 34682 280201 12%
55-64 31325 194203 16%
65+ 15391 66147 23%
Center for Labor Markets and Policy | Drexel University
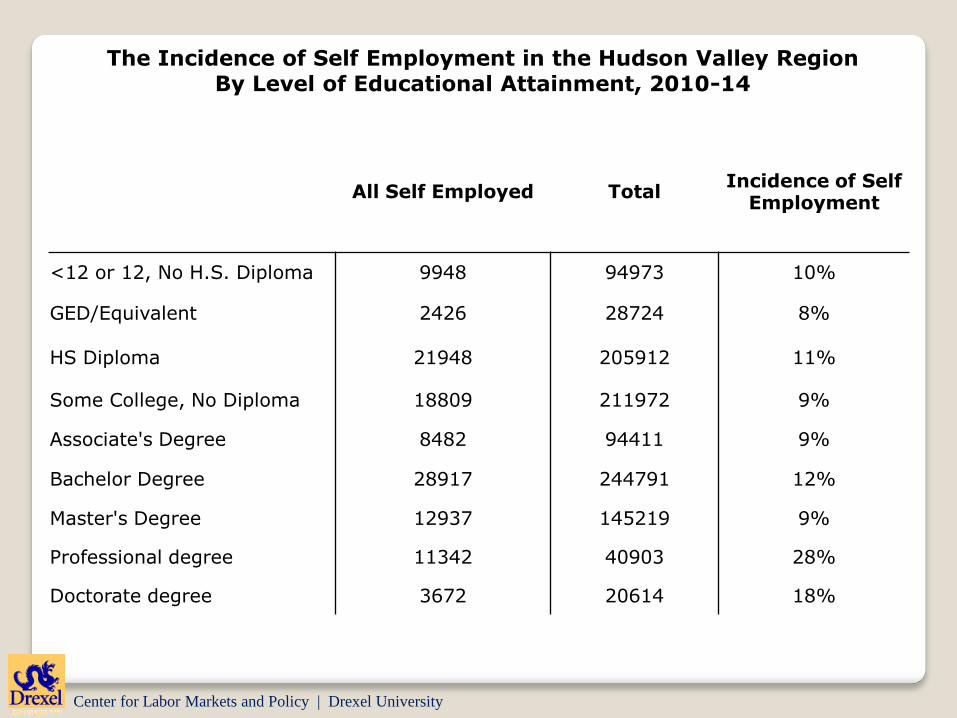
The Incidence of Self Employment in the Hudson Valley RegionBy Level of Educational Attainment, 2010-14
All Self Employed TotalIncidence of Self
Employment
<12 or 12, No H.S. Diploma 9948 94973 10%
GED/Equivalent 2426 28724 8%
HS Diploma 21948 205912 11%
Some College, No Diploma 18809 211972 9%
Associate's Degree 8482 94411 9%
Bachelor Degree 28917 244791 12%
Master's Degree 12937 145219 9%
Professional degree 11342 40903 28%
Doctorate degree 3672 20614 18%
Center for Labor Markets and Policy | Drexel University
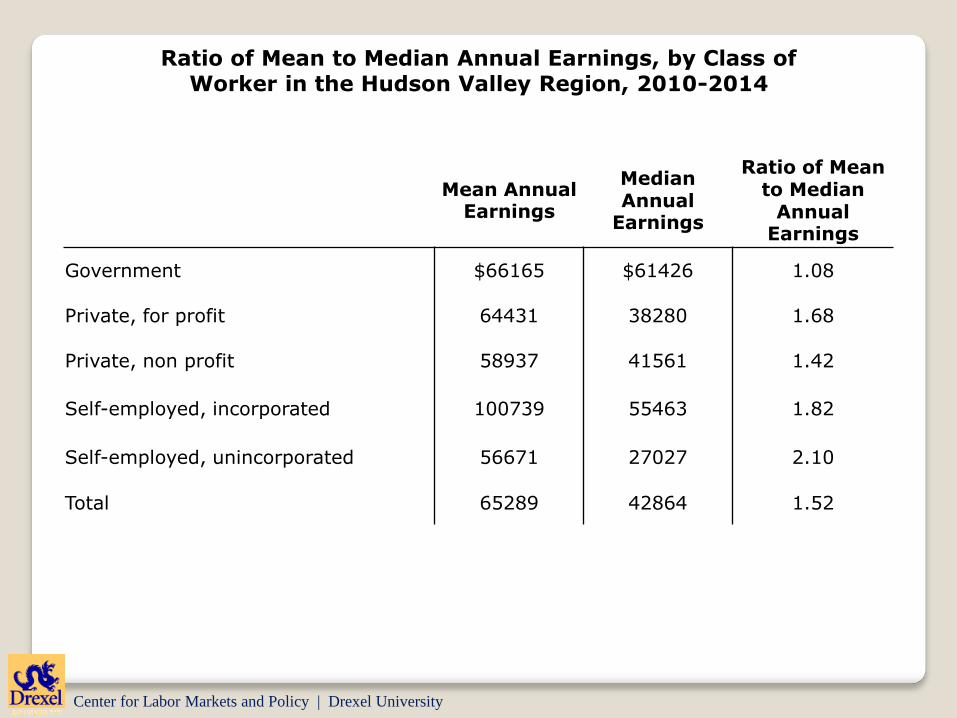
Ratio of Mean to Median Annual Earnings, by Class of Worker in the Hudson Valley Region, 2010-2014
Mean Annual Earnings
Median Annual
Earnings
Ratio of Mean to Median
Annual Earnings
Government $66165 $61426 1.08
Private, for profit 64431 38280 1.68
Private, non profit 58937 41561 1.42
Self-employed, incorporated 100739 55463 1.82
Self-employed, unincorporated 56671 27027 2.10
Total 65289 42864 1.52
Center for Labor Markets and Policy | Drexel University
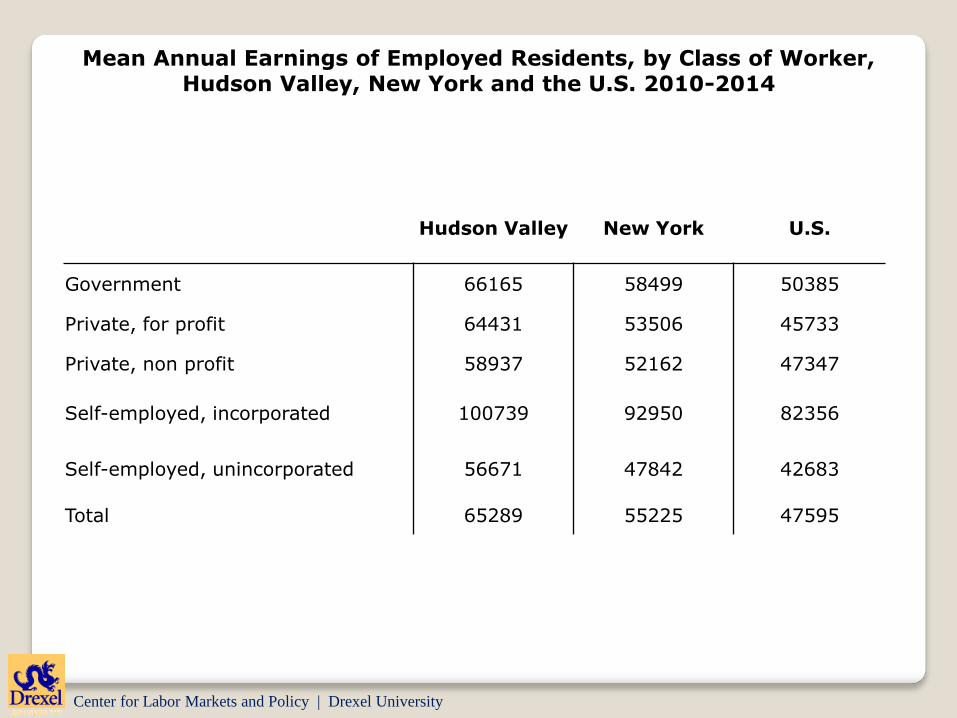
Hudson Valley New York U.S.
Government 66165 58499 50385
Private, for profit 64431 53506 45733
Private, non profit 58937 52162 47347
Self-employed, incorporated 100739 92950 82356
Self-employed, unincorporated 56671 47842 42683
Total 65289 55225 47595
Mean Annual Earnings of Employed Residents, by Class of Worker,Hudson Valley, New York and the U.S. 2010-2014
Center for Labor Markets and Policy | Drexel University
Self-employed, incorporated
Mean Annual
Earnings
Median Annual
Earnings
Ratio of Mean to Median
Earnings
Distribution of Employed
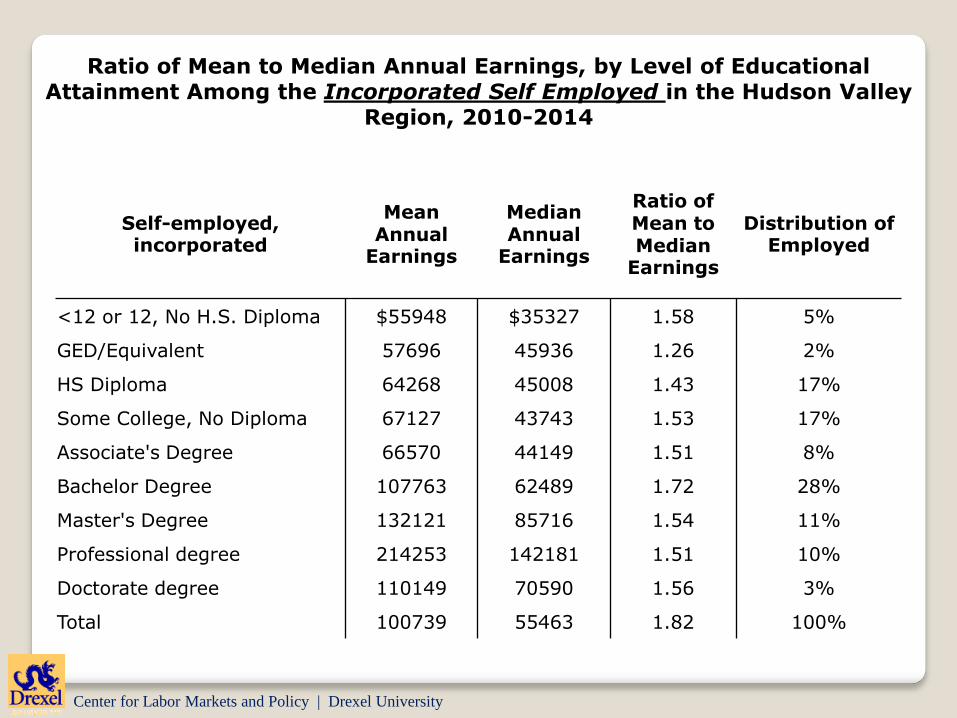
<12 or 12, No H.S. Diploma $55948 $35327 1.58 5%
GED/Equivalent 57696 45936 1.26 2%
HS Diploma 64268 45008 1.43 17%
Some College, No Diploma 67127 43743 1.53 17%
Associate's Degree 66570 44149 1.51 8%
Bachelor Degree 107763 62489 1.72 28%
Master's Degree 132121 85716 1.54 11%
Professional degree 214253 142181 1.51 10%
Doctorate degree 110149 70590 1.56 3%
Total 100739 55463 1.82 100%
Ratio of Mean to Median Annual Earnings, by Level of Educational Attainment Among the Incorporated Self Employed in the Hudson Valley
Region, 2010-2014
Center for Labor Markets and Policy | Drexel University
Self-employed,incorporated
Self-employed, unincorporated
Total Employed
NumberPercent
DistributionNumber
Percent Distribution
NumberPercent
Distribution
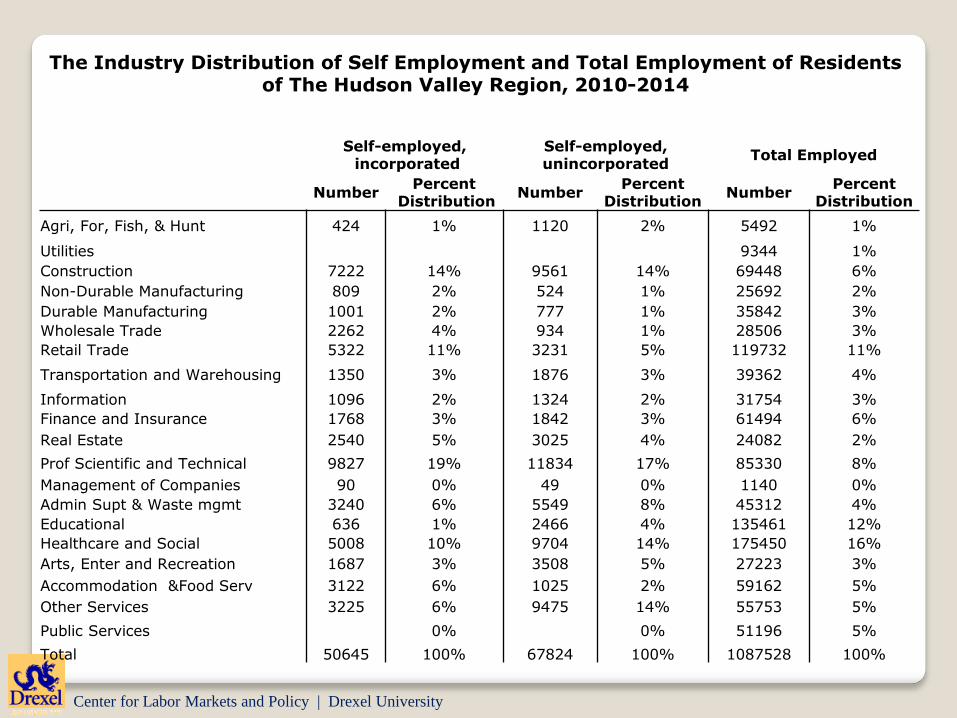
Agri, For, Fish, & Hunt 424 1% 1120 2% 5492 1%
Utilities 9344 1%
Construction 7222 14% 9561 14% 69448 6%
Non-Durable Manufacturing 809 2% 524 1% 25692 2%
Durable Manufacturing 1001 2% 777 1% 35842 3%
Wholesale Trade 2262 4% 934 1% 28506 3%
Retail Trade 5322 11% 3231 5% 119732 11%
Transportation and Warehousing 1350 3% 1876 3% 39362 4%
Information 1096 2% 1324 2% 31754 3%
Finance and Insurance 1768 3% 1842 3% 61494 6%
Real Estate 2540 5% 3025 4% 24082 2%
Prof Scientific and Technical 9827 19% 11834 17% 85330 8%
Management of Companies 90 0% 49 0% 1140 0%
Admin Supt & Waste mgmt 3240 6% 5549 8% 45312 4%
Educational 636 1% 2466 4% 135461 12%
Healthcare and Social 5008 10% 9704 14% 175450 16%
Arts, Enter and Recreation 1687 3% 3508 5% 27223 3%
Accommodation &Food Serv 3122 6% 1025 2% 59162 5%
Other Services 3225 6% 9475 14% 55753 5%
Public Services 0% 0% 51196 5%
Total 50645 100% 67824 100% 1087528 100%
The Industry Distribution of Self Employment and Total Employment of Residents of The Hudson Valley Region, 2010-2014
Center for Labor Markets and Policy | Drexel University
Self-employed, incorporated
Self-employed, unincorporated
Total Employed
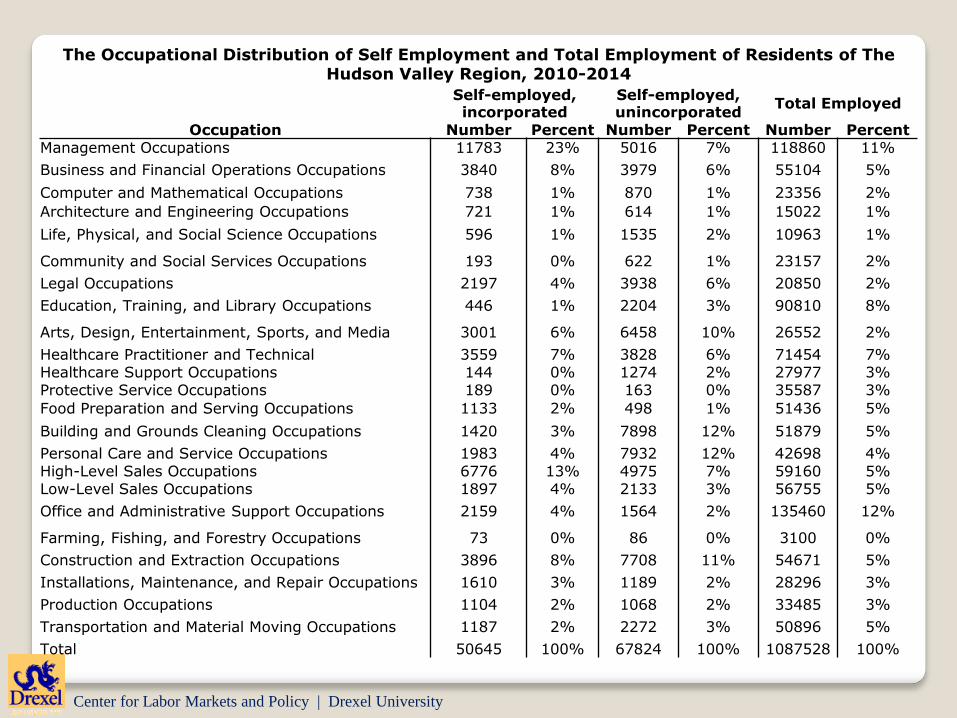
Occupation Number Percent Number Percent Number PercentManagement Occupations 11783 23% 5016 7% 118860 11%
Business and Financial Operations Occupations 3840 8% 3979 6% 55104 5%
Computer and Mathematical Occupations 738 1% 870 1% 23356 2%
Architecture and Engineering Occupations 721 1% 614 1% 15022 1%
Life, Physical, and Social Science Occupations 596 1% 1535 2% 10963 1%
Community and Social Services Occupations 193 0% 622 1% 23157 2%
Legal Occupations 2197 4% 3938 6% 20850 2%
Education, Training, and Library Occupations 446 1% 2204 3% 90810 8%
Arts, Design, Entertainment, Sports, and Media 3001 6% 6458 10% 26552 2%
Healthcare Practitioner and Technical 3559 7% 3828 6% 71454 7%Healthcare Support Occupations 144 0% 1274 2% 27977 3%Protective Service Occupations 189 0% 163 0% 35587 3%
Food Preparation and Serving Occupations 1133 2% 498 1% 51436 5%
Building and Grounds Cleaning Occupations 1420 3% 7898 12% 51879 5%
Personal Care and Service Occupations 1983 4% 7932 12% 42698 4%High-Level Sales Occupations 6776 13% 4975 7% 59160 5%Low-Level Sales Occupations 1897 4% 2133 3% 56755 5%
Office and Administrative Support Occupations 2159 4% 1564 2% 135460 12%
Farming, Fishing, and Forestry Occupations 73 0% 86 0% 3100 0%
Construction and Extraction Occupations 3896 8% 7708 11% 54671 5%
Installations, Maintenance, and Repair Occupations 1610 3% 1189 2% 28296 3%
Production Occupations 1104 2% 1068 2% 33485 3%
Transportation and Material Moving Occupations 1187 2% 2272 3% 50896 5%
Total 50645 100% 67824 100% 1087528 100%
The Occupational Distribution of Self Employment and Total Employment of Residents of The Hudson Valley Region, 2010-2014
Center for Labor Markets and Policy | Drexel University
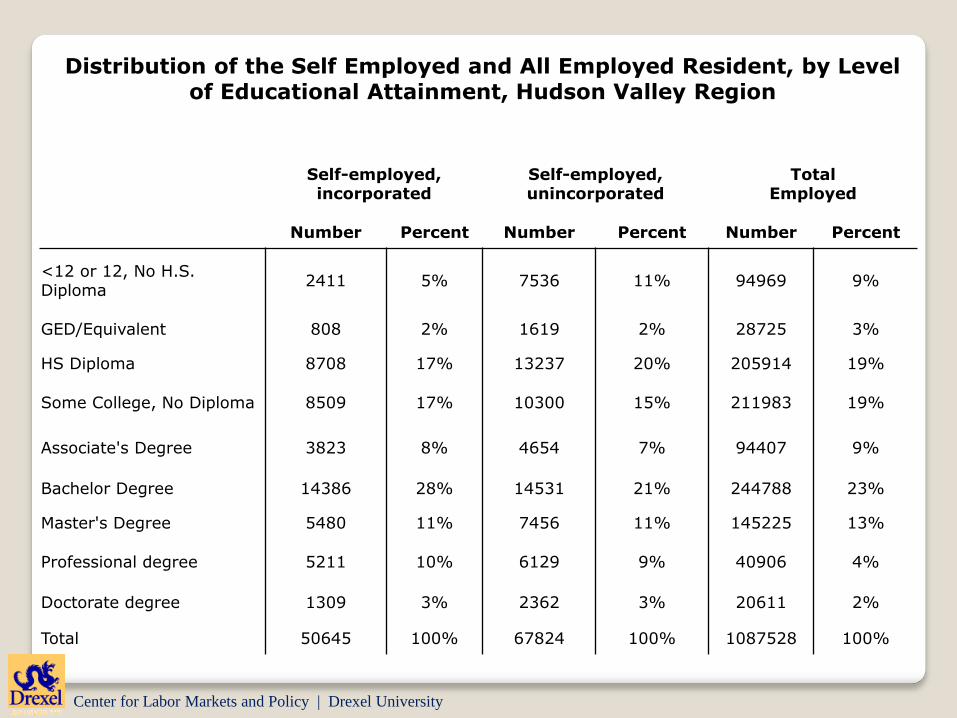
Self-employed, incorporated
Self-employed, unincorporated
Total Employed
Number Percent Number Percent Number Percent
<12 or 12, No H.S. Diploma
2411 5% 7536 11% 94969 9%
GED/Equivalent 808 2% 1619 2% 28725 3%
HS Diploma 8708 17% 13237 20% 205914 19%
Some College, No Diploma 8509 17% 10300 15% 211983 19%
Associate's Degree 3823 8% 4654 7% 94407 9%
Bachelor Degree 14386 28% 14531 21% 244788 23%
Master's Degree 5480 11% 7456 11% 145225 13%
Professional degree 5211 10% 6129 9% 40906 4%
Doctorate degree 1309 3% 2362 3% 20611 2%
Total 50645 100% 67824 100% 1087528 100%
Distribution of the Self Employed and All Employed Resident, by Level of Educational Attainment, Hudson Valley Region
Center for Labor Markets and Policy | Drexel University
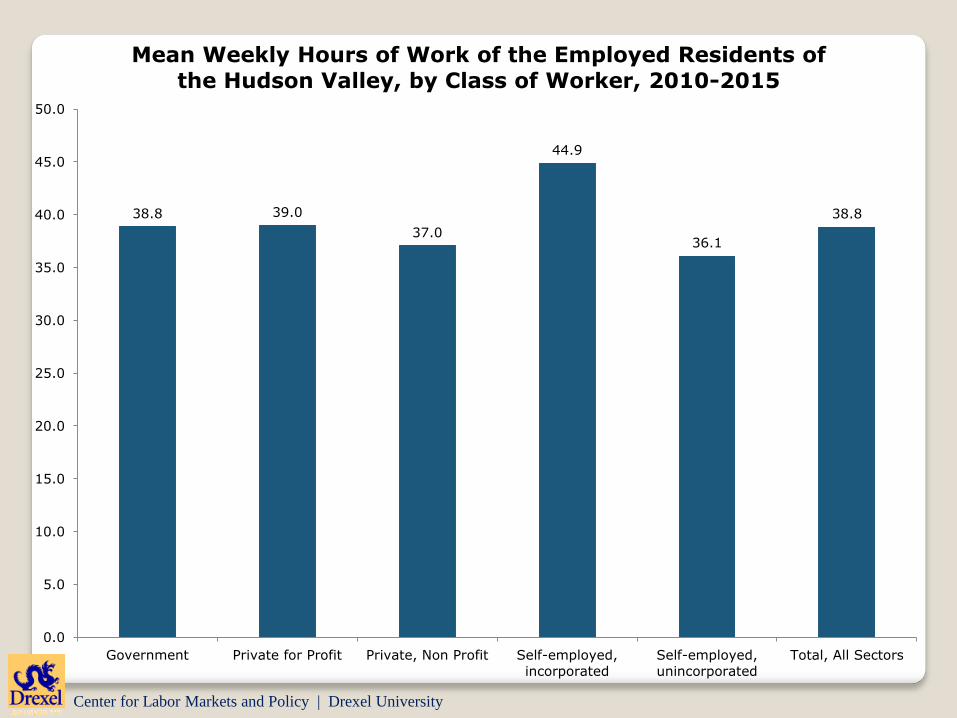
38.8 39.0
37.0
44.9
36.1
38.8
0.0
5.0
10.0
15.0
20.0
25.0
30.0
35.0
40.0
45.0
50.0
Government Private for Profit Private, Non Profit Self-employed,
incorporated
Self-employed,
unincorporated
Total, All Sectors
Mean Weekly Hours of Work of the Employed Residents of
the Hudson Valley, by Class of Worker, 2010-2015

Center for Labor Markets and Policy | Drexel University
Center for Labor Markets and Policy | Drexel University
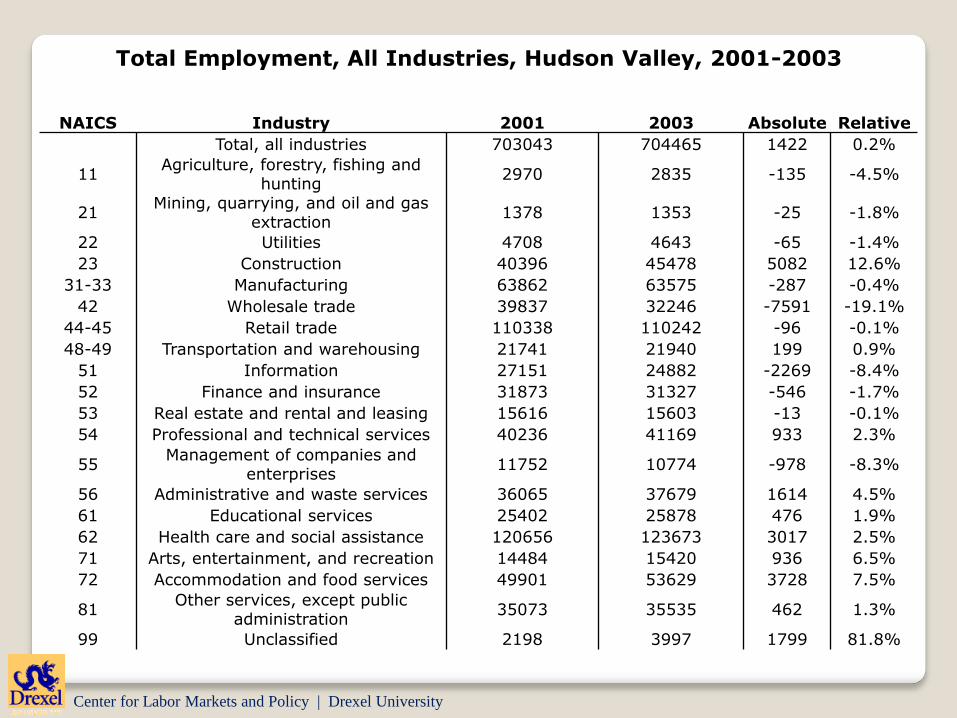
NAICS Industry 2001 2003 Absolute Relative
Total, all industries 703043 704465 1422 0.2%
11Agriculture, forestry, fishing and
hunting2970 2835 -135 -4.5%
21Mining, quarrying, and oil and gas
extraction1378 1353 -25 -1.8%
22 Utilities 4708 4643 -65 -1.4%
23 Construction 40396 45478 5082 12.6%
31-33 Manufacturing 63862 63575 -287 -0.4%
42 Wholesale trade 39837 32246 -7591 -19.1%
44-45 Retail trade 110338 110242 -96 -0.1%
48-49 Transportation and warehousing 21741 21940 199 0.9%
51 Information 27151 24882 -2269 -8.4%
52 Finance and insurance 31873 31327 -546 -1.7%
53 Real estate and rental and leasing 15616 15603 -13 -0.1%
54 Professional and technical services 40236 41169 933 2.3%
55Management of companies and
enterprises11752 10774 -978 -8.3%
56 Administrative and waste services 36065 37679 1614 4.5%
61 Educational services 25402 25878 476 1.9%
62 Health care and social assistance 120656 123673 3017 2.5%
71 Arts, entertainment, and recreation 14484 15420 936 6.5%
72 Accommodation and food services 49901 53629 3728 7.5%
81Other services, except public
administration35073 35535 462 1.3%
99 Unclassified 2198 3997 1799 81.8%
Total Employment, All Industries, Hudson Valley, 2001-2003
Center for Labor Markets and Policy | Drexel University
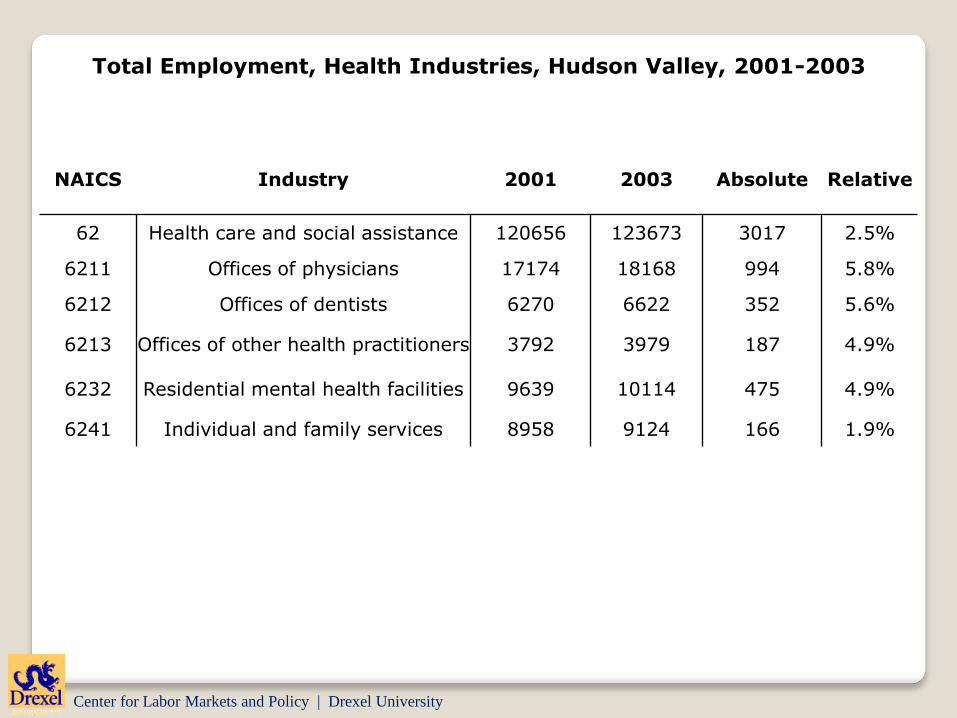
NAICS Industry 2001 2003 Absolute Relative
62 Health care and social assistance 120656 123673 3017 2.5%
6211 Offices of physicians 17174 18168 994 5.8%
6212 Offices of dentists 6270 6622 352 5.6%
6213 Offices of other health practitioners 3792 3979 187 4.9%
6232 Residential mental health facilities 9639 10114 475 4.9%
6241 Individual and family services 8958 9124 166 1.9%
Total Employment, Health Industries, Hudson Valley, 2001-2003
Center for Labor Markets and Policy | Drexel University
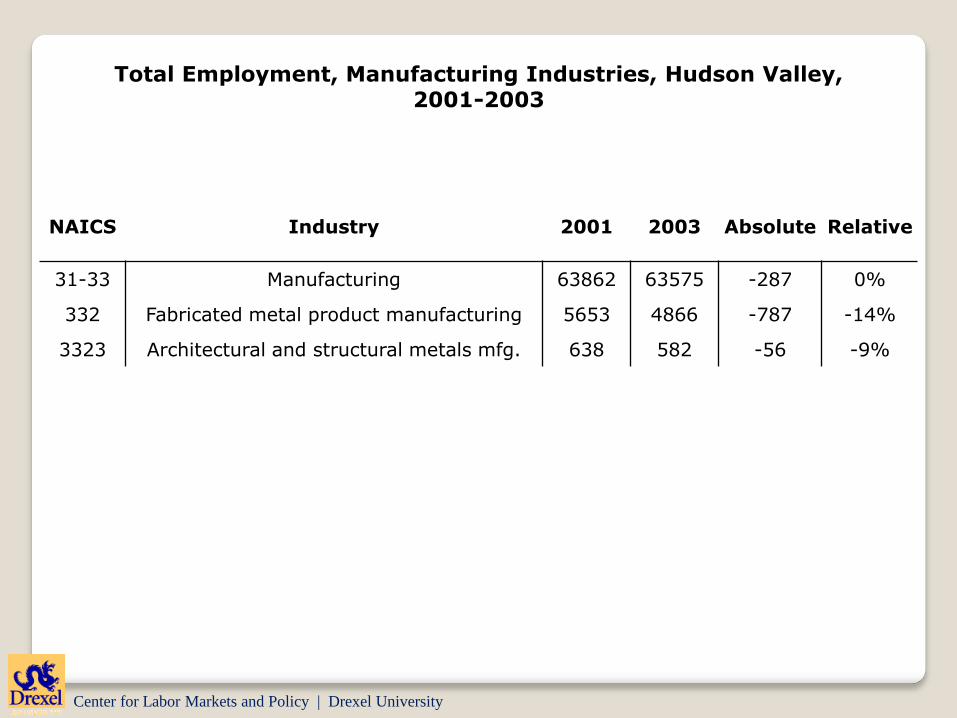
Total Employment, Manufacturing Industries, Hudson Valley, 2001-2003
NAICS Industry 2001 2003 Absolute Relative
31-33 Manufacturing 63862 63575 -287 0%
332 Fabricated metal product manufacturing 5653 4866 -787 -14%
3323 Architectural and structural metals mfg. 638 582 -56 -9%
Center for Labor Markets and Policy | Drexel University
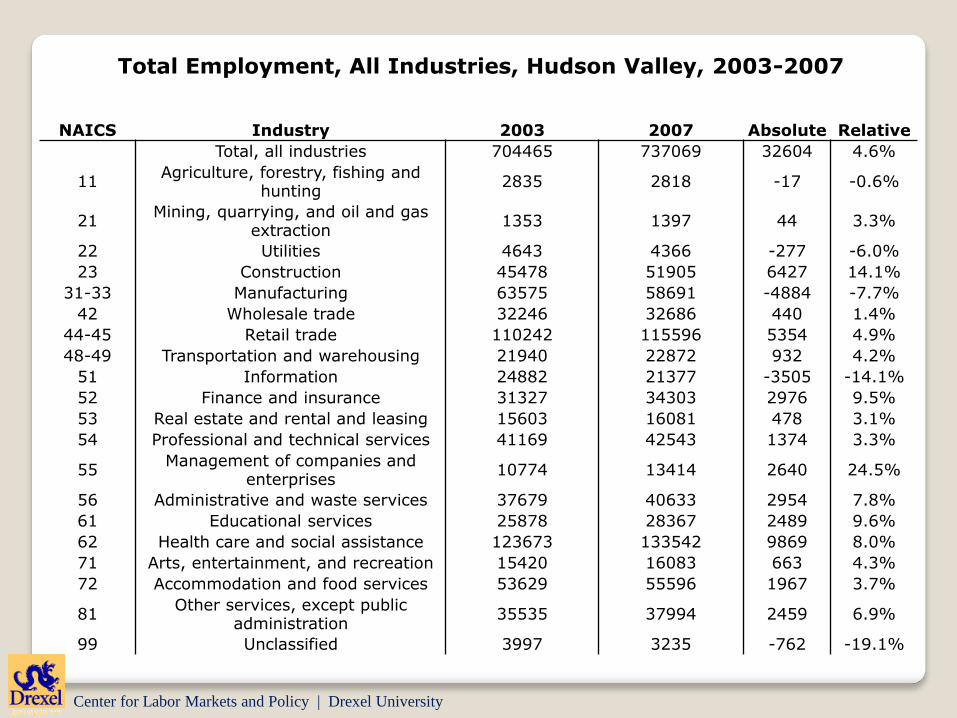
NAICS Industry 2003 2007 Absolute Relative
Total, all industries 704465 737069 32604 4.6%
11Agriculture, forestry, fishing and
hunting2835 2818 -17 -0.6%
21Mining, quarrying, and oil and gas
extraction1353 1397 44 3.3%
22 Utilities 4643 4366 -277 -6.0%
23 Construction 45478 51905 6427 14.1%
31-33 Manufacturing 63575 58691 -4884 -7.7%
42 Wholesale trade 32246 32686 440 1.4%
44-45 Retail trade 110242 115596 5354 4.9%
48-49 Transportation and warehousing 21940 22872 932 4.2%
51 Information 24882 21377 -3505 -14.1%
52 Finance and insurance 31327 34303 2976 9.5%
53 Real estate and rental and leasing 15603 16081 478 3.1%
54 Professional and technical services 41169 42543 1374 3.3%
55Management of companies and
enterprises10774 13414 2640 24.5%
56 Administrative and waste services 37679 40633 2954 7.8%
61 Educational services 25878 28367 2489 9.6%
62 Health care and social assistance 123673 133542 9869 8.0%
71 Arts, entertainment, and recreation 15420 16083 663 4.3%
72 Accommodation and food services 53629 55596 1967 3.7%
81Other services, except public
administration35535 37994 2459 6.9%
99 Unclassified 3997 3235 -762 -19.1%
Total Employment, All Industries, Hudson Valley, 2003-2007
Center for Labor Markets and Policy | Drexel University
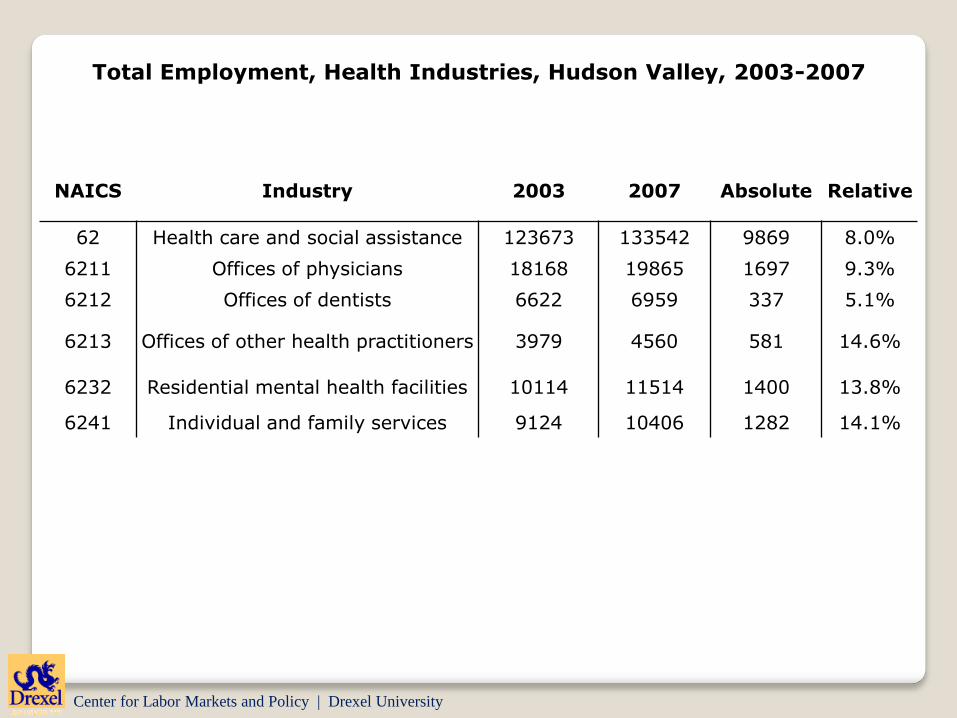
Total Employment, Health Industries, Hudson Valley, 2003-2007
NAICS Industry 2003 2007 Absolute Relative
62 Health care and social assistance 123673 133542 9869 8.0%
6211 Offices of physicians 18168 19865 1697 9.3%
6212 Offices of dentists 6622 6959 337 5.1%
6213 Offices of other health practitioners 3979 4560 581 14.6%
6232 Residential mental health facilities 10114 11514 1400 13.8%
6241 Individual and family services 9124 10406 1282 14.1%
Center for Labor Markets and Policy | Drexel University
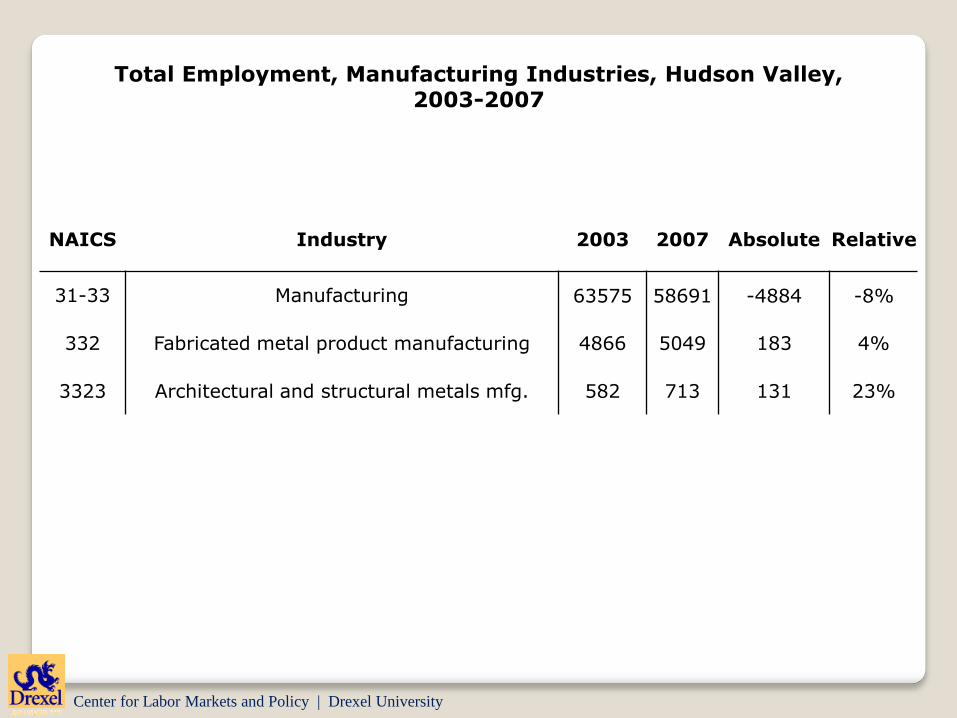
Total Employment, Manufacturing Industries, Hudson Valley, 2003-2007
NAICS Industry 2003 2007 Absolute Relative
31-33 Manufacturing 63575 58691 -4884 -8%
332 Fabricated metal product manufacturing 4866 5049 183 4%
3323 Architectural and structural metals mfg. 582 713 131 23%
Center for Labor Markets and Policy | Drexel University
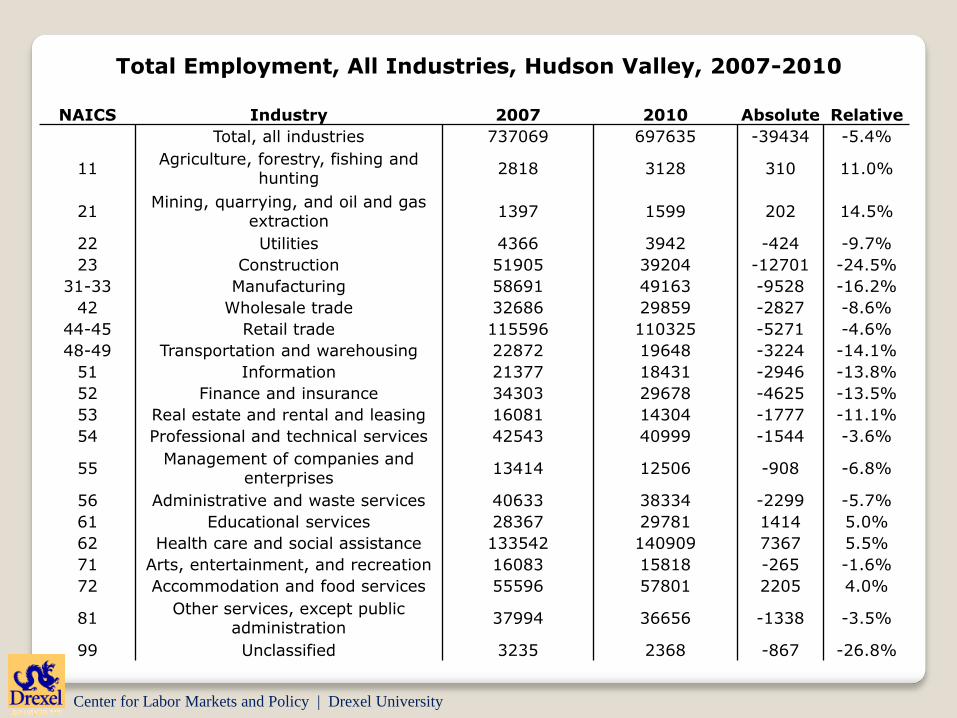
Total Employment, All Industries, Hudson Valley, 2007-2010
NAICS Industry 2007 2010 Absolute Relative
Total, all industries 737069 697635 -39434 -5.4%
11Agriculture, forestry, fishing and
hunting2818 3128 310 11.0%
21Mining, quarrying, and oil and gas
extraction1397 1599 202 14.5%
22 Utilities 4366 3942 -424 -9.7%
23 Construction 51905 39204 -12701 -24.5%
31-33 Manufacturing 58691 49163 -9528 -16.2%
42 Wholesale trade 32686 29859 -2827 -8.6%
44-45 Retail trade 115596 110325 -5271 -4.6%
48-49 Transportation and warehousing 22872 19648 -3224 -14.1%
51 Information 21377 18431 -2946 -13.8%
52 Finance and insurance 34303 29678 -4625 -13.5%
53 Real estate and rental and leasing 16081 14304 -1777 -11.1%
54 Professional and technical services 42543 40999 -1544 -3.6%
55Management of companies and
enterprises13414 12506 -908 -6.8%
56 Administrative and waste services 40633 38334 -2299 -5.7%
61 Educational services 28367 29781 1414 5.0%
62 Health care and social assistance 133542 140909 7367 5.5%
71 Arts, entertainment, and recreation 16083 15818 -265 -1.6%
72 Accommodation and food services 55596 57801 2205 4.0%
81Other services, except public
administration37994 36656 -1338 -3.5%
99 Unclassified 3235 2368 -867 -26.8%

Center for Labor Markets and Policy | Drexel University
Total Employment, Health Industries, Hudson Valley, 2007-2010
NAICS Industry 2007 2010 Absolute Relative
62 Health care and social assistance 133542 140909 7367 5.5%
6211 Offices of physicians 19865 21266 1401 7.1%
6212 Offices of dentists 6959 6870 -89 -1.3%
6213 Offices of other health practitioners 4560 4891 331 7.3%
6232 Residential mental health facilities 11514 12718 1204 10.5%
6241 Individual and family services 10406 12447 2041 19.6%
Center for Labor Markets and Policy | Drexel University
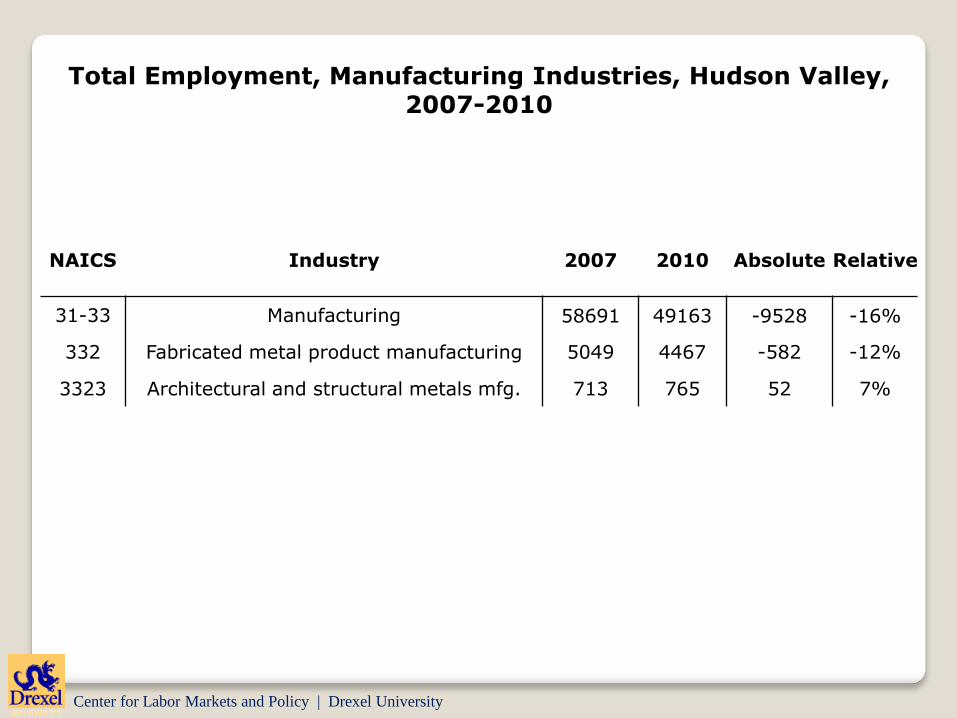
Total Employment, Manufacturing Industries, Hudson Valley, 2007-2010
NAICS Industry 2007 2010 Absolute Relative
31-33 Manufacturing 58691 49163 -9528 -16%
332 Fabricated metal product manufacturing 5049 4467 -582 -12%
3323 Architectural and structural metals mfg. 713 765 52 7%
Center for Labor Markets and Policy | Drexel University
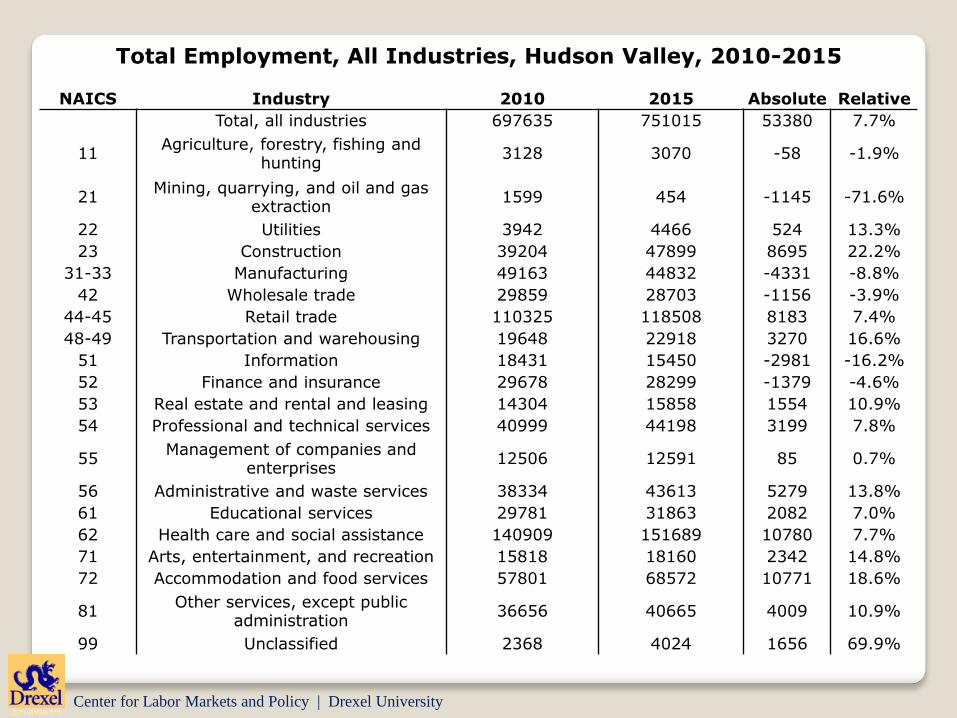
Total Employment, All Industries, Hudson Valley, 2010-2015
NAICS Industry 2010 2015 Absolute Relative
Total, all industries 697635 751015 53380 7.7%
11Agriculture, forestry, fishing and
hunting3128 3070 -58 -1.9%
21Mining, quarrying, and oil and gas
extraction1599 454 -1145 -71.6%
22 Utilities 3942 4466 524 13.3%
23 Construction 39204 47899 8695 22.2%
31-33 Manufacturing 49163 44832 -4331 -8.8%
42 Wholesale trade 29859 28703 -1156 -3.9%
44-45 Retail trade 110325 118508 8183 7.4%
48-49 Transportation and warehousing 19648 22918 3270 16.6%
51 Information 18431 15450 -2981 -16.2%
52 Finance and insurance 29678 28299 -1379 -4.6%
53 Real estate and rental and leasing 14304 15858 1554 10.9%
54 Professional and technical services 40999 44198 3199 7.8%
55Management of companies and
enterprises12506 12591 85 0.7%
56 Administrative and waste services 38334 43613 5279 13.8%
61 Educational services 29781 31863 2082 7.0%
62 Health care and social assistance 140909 151689 10780 7.7%
71 Arts, entertainment, and recreation 15818 18160 2342 14.8%
72 Accommodation and food services 57801 68572 10771 18.6%
81Other services, except public
administration36656 40665 4009 10.9%
99 Unclassified 2368 4024 1656 69.9%
Center for Labor Markets and Policy | Drexel University
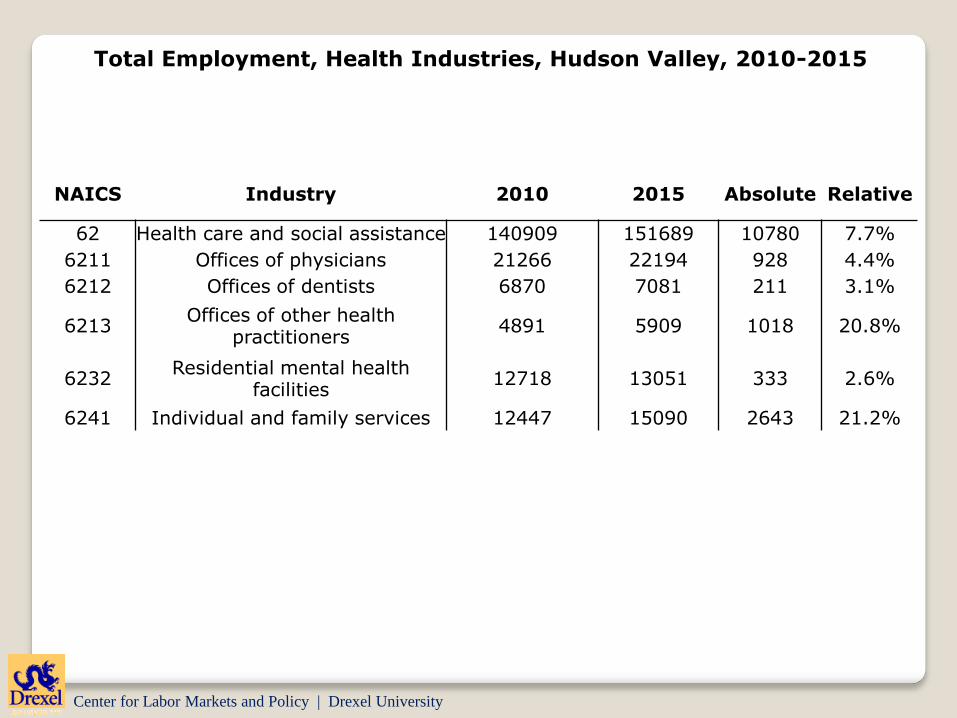
Total Employment, Health Industries, Hudson Valley, 2010-2015
NAICS Industry 2010 2015 Absolute Relative
62 Health care and social assistance 140909 151689 10780 7.7%
6211 Offices of physicians 21266 22194 928 4.4%
6212 Offices of dentists 6870 7081 211 3.1%
6213Offices of other health
practitioners4891 5909 1018 20.8%
6232Residential mental health
facilities12718 13051 333 2.6%
6241 Individual and family services 12447 15090 2643 21.2%
Center for Labor Markets and Policy | Drexel University
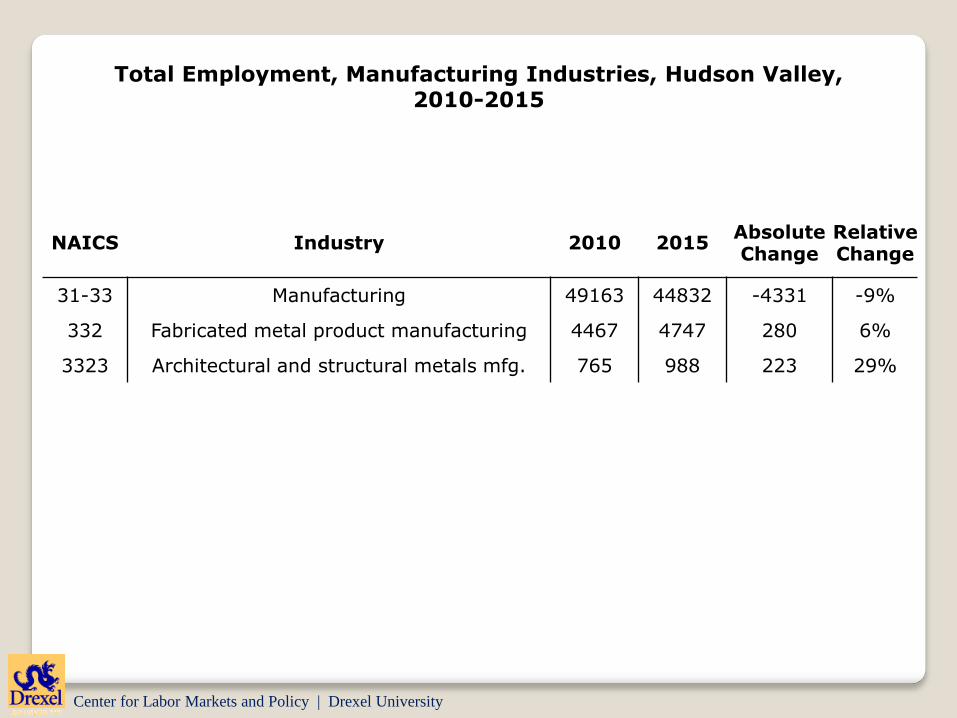
Total Employment, Manufacturing Industries, Hudson Valley, 2010-2015
NAICS Industry 2010 2015Absolute Change
Relative Change
31-33 Manufacturing 49163 44832 -4331 -9%
332 Fabricated metal product manufacturing 4467 4747 280 6%
3323 Architectural and structural metals mfg. 765 988 223 29%
Center for Labor Markets and Policy | Drexel University
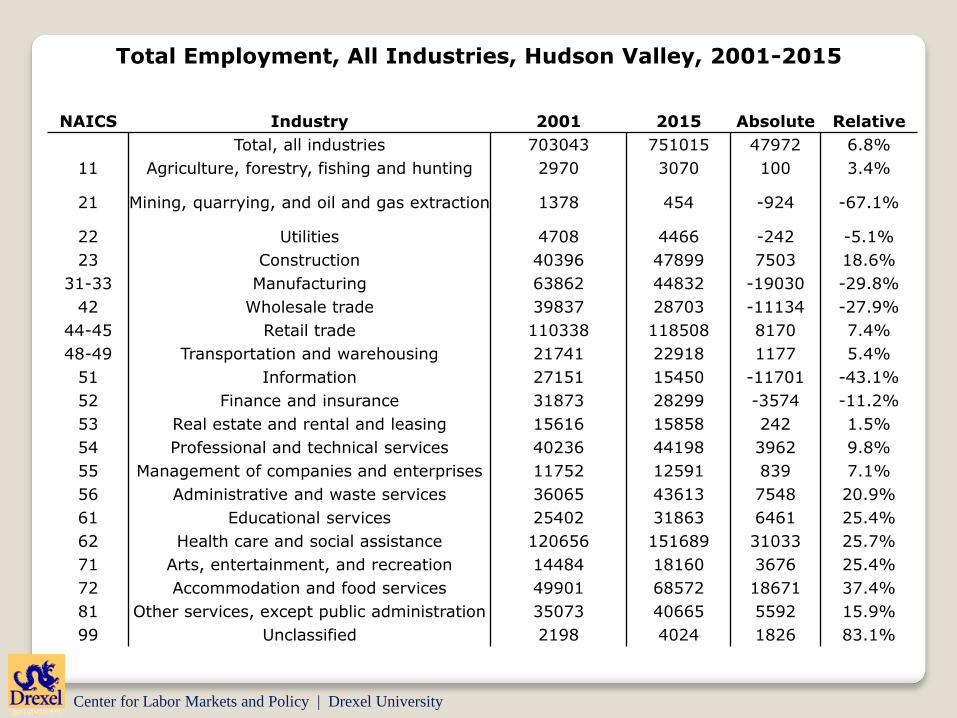
Total Employment, All Industries, Hudson Valley, 2001-2015
NAICS Industry 2001 2015 Absolute Relative
Total, all industries 703043 751015 47972 6.8%
11 Agriculture, forestry, fishing and hunting 2970 3070 100 3.4%
21 Mining, quarrying, and oil and gas extraction 1378 454 -924 -67.1%
22 Utilities 4708 4466 -242 -5.1%
23 Construction 40396 47899 7503 18.6%
31-33 Manufacturing 63862 44832 -19030 -29.8%
42 Wholesale trade 39837 28703 -11134 -27.9%
44-45 Retail trade 110338 118508 8170 7.4%
48-49 Transportation and warehousing 21741 22918 1177 5.4%
51 Information 27151 15450 -11701 -43.1%
52 Finance and insurance 31873 28299 -3574 -11.2%
53 Real estate and rental and leasing 15616 15858 242 1.5%
54 Professional and technical services 40236 44198 3962 9.8%
55 Management of companies and enterprises 11752 12591 839 7.1%
56 Administrative and waste services 36065 43613 7548 20.9%
61 Educational services 25402 31863 6461 25.4%
62 Health care and social assistance 120656 151689 31033 25.7%
71 Arts, entertainment, and recreation 14484 18160 3676 25.4%
72 Accommodation and food services 49901 68572 18671 37.4%
81 Other services, except public administration 35073 40665 5592 15.9%
99 Unclassified 2198 4024 1826 83.1%
Center for Labor Markets and Policy | Drexel University
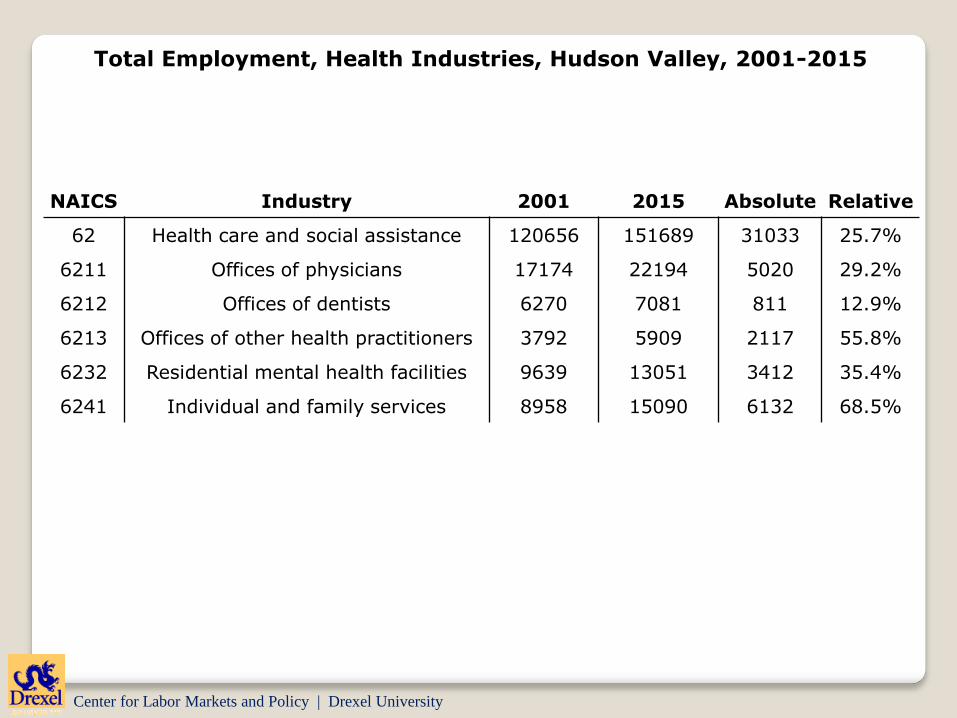
Total Employment, Health Industries, Hudson Valley, 2001-2015
NAICS Industry 2001 2015 Absolute Relative
62 Health care and social assistance 120656 151689 31033 25.7%
6211 Offices of physicians 17174 22194 5020 29.2%
6212 Offices of dentists 6270 7081 811 12.9%
6213 Offices of other health practitioners 3792 5909 2117 55.8%
6232 Residential mental health facilities 9639 13051 3412 35.4%
6241 Individual and family services 8958 15090 6132 68.5%
Center for Labor Markets and Policy | Drexel University
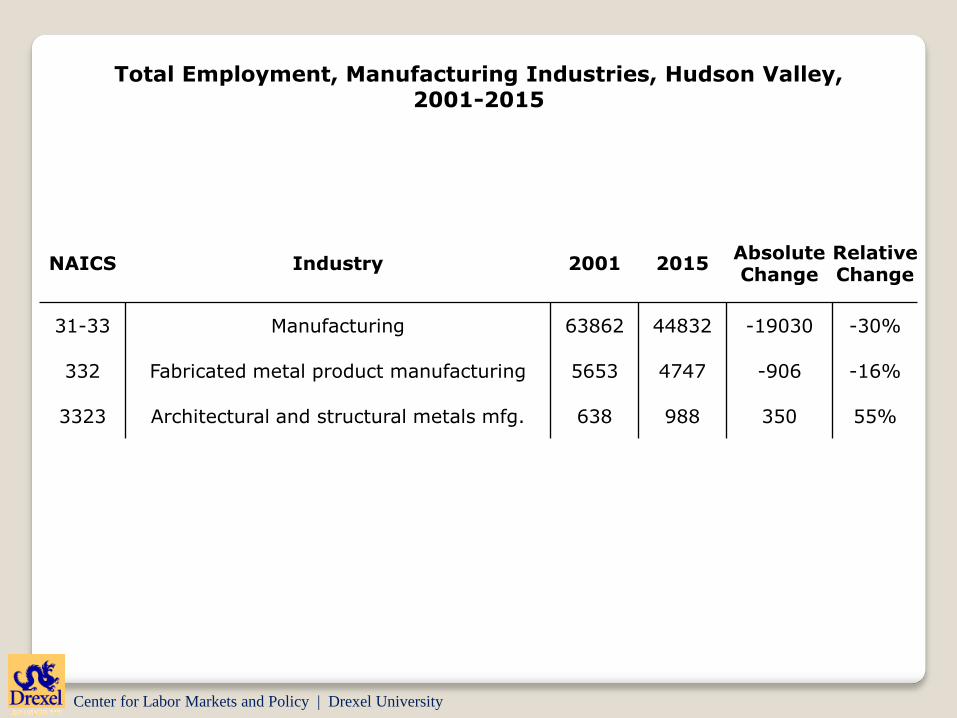
Total Employment, Manufacturing Industries, Hudson Valley, 2001-2015
NAICS Industry 2001 2015Absolute Change
Relative Change
31-33 Manufacturing 63862 44832 -19030 -30%
332 Fabricated metal product manufacturing 5653 4747 -906 -16%
3323 Architectural and structural metals mfg. 638 988 350 55%
Center for Labor Markets and Policy | Drexel University
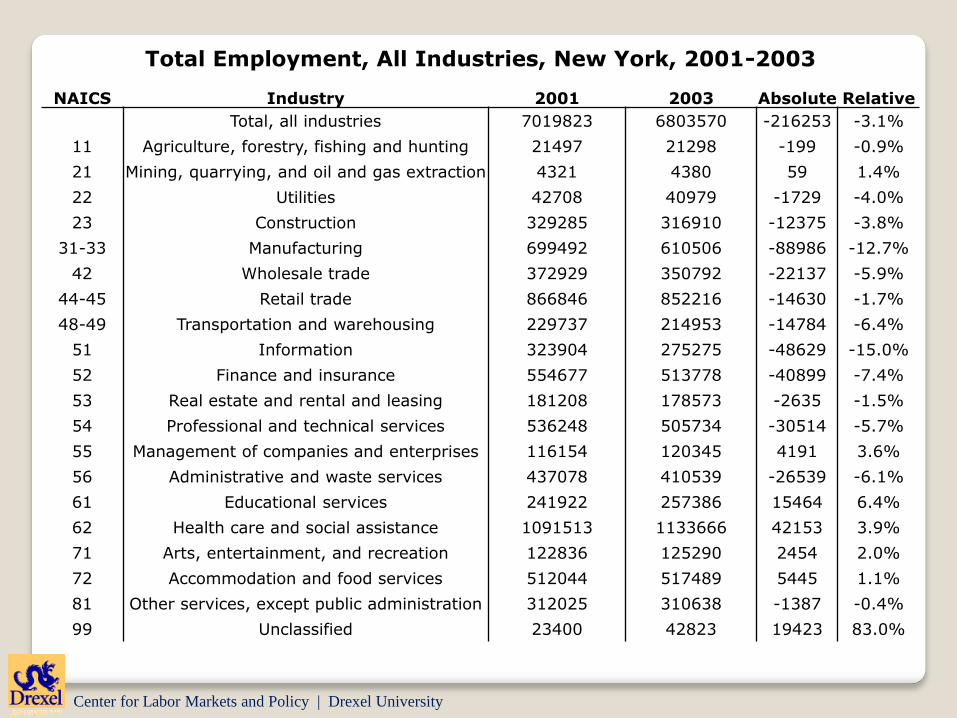
Total Employment, All Industries, New York, 2001-2003
NAICS Industry 2001 2003 Absolute Relative
Total, all industries 7019823 6803570 -216253 -3.1%
11 Agriculture, forestry, fishing and hunting 21497 21298 -199 -0.9%
21 Mining, quarrying, and oil and gas extraction 4321 4380 59 1.4%
22 Utilities 42708 40979 -1729 -4.0%
23 Construction 329285 316910 -12375 -3.8%
31-33 Manufacturing 699492 610506 -88986 -12.7%
42 Wholesale trade 372929 350792 -22137 -5.9%
44-45 Retail trade 866846 852216 -14630 -1.7%
48-49 Transportation and warehousing 229737 214953 -14784 -6.4%
51 Information 323904 275275 -48629 -15.0%
52 Finance and insurance 554677 513778 -40899 -7.4%
53 Real estate and rental and leasing 181208 178573 -2635 -1.5%
54 Professional and technical services 536248 505734 -30514 -5.7%
55 Management of companies and enterprises 116154 120345 4191 3.6%
56 Administrative and waste services 437078 410539 -26539 -6.1%
61 Educational services 241922 257386 15464 6.4%
62 Health care and social assistance 1091513 1133666 42153 3.9%
71 Arts, entertainment, and recreation 122836 125290 2454 2.0%
72 Accommodation and food services 512044 517489 5445 1.1%
81 Other services, except public administration 312025 310638 -1387 -0.4%
99 Unclassified 23400 42823 19423 83.0%
Center for Labor Markets and Policy | Drexel University
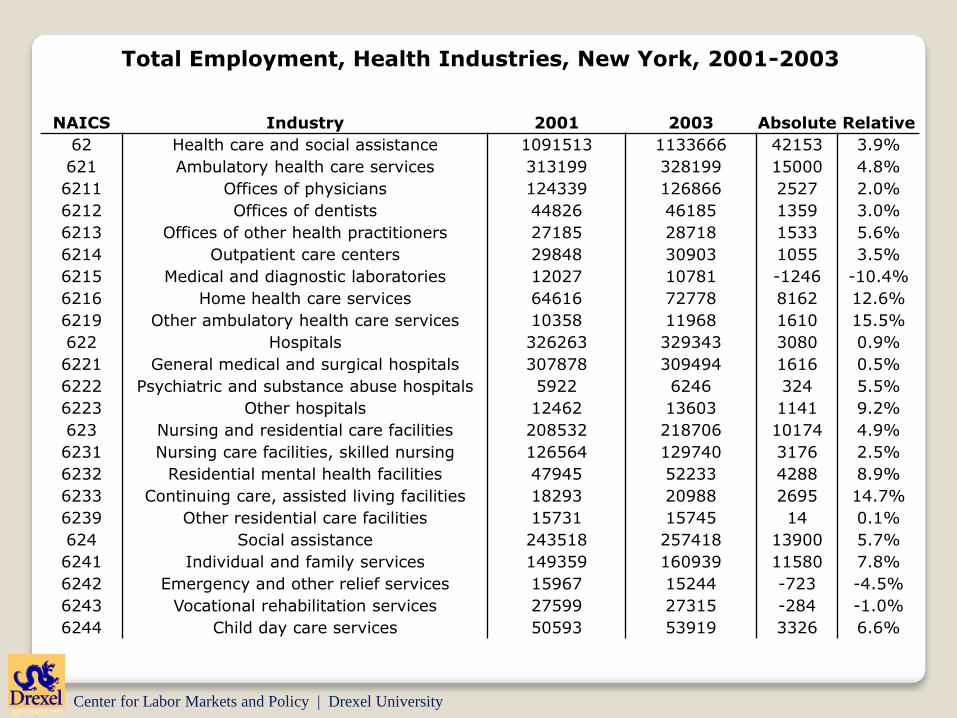
Total Employment, Health Industries, New York, 2001-2003
NAICS Industry 2001 2003 Absolute Relative
62 Health care and social assistance 1091513 1133666 42153 3.9%
621 Ambulatory health care services 313199 328199 15000 4.8%
6211 Offices of physicians 124339 126866 2527 2.0%
6212 Offices of dentists 44826 46185 1359 3.0%
6213 Offices of other health practitioners 27185 28718 1533 5.6%
6214 Outpatient care centers 29848 30903 1055 3.5%
6215 Medical and diagnostic laboratories 12027 10781 -1246 -10.4%
6216 Home health care services 64616 72778 8162 12.6%
6219 Other ambulatory health care services 10358 11968 1610 15.5%
622 Hospitals 326263 329343 3080 0.9%
6221 General medical and surgical hospitals 307878 309494 1616 0.5%
6222 Psychiatric and substance abuse hospitals 5922 6246 324 5.5%
6223 Other hospitals 12462 13603 1141 9.2%
623 Nursing and residential care facilities 208532 218706 10174 4.9%
6231 Nursing care facilities, skilled nursing 126564 129740 3176 2.5%
6232 Residential mental health facilities 47945 52233 4288 8.9%
6233 Continuing care, assisted living facilities 18293 20988 2695 14.7%
6239 Other residential care facilities 15731 15745 14 0.1%
624 Social assistance 243518 257418 13900 5.7%
6241 Individual and family services 149359 160939 11580 7.8%
6242 Emergency and other relief services 15967 15244 -723 -4.5%
6243 Vocational rehabilitation services 27599 27315 -284 -1.0%
6244 Child day care services 50593 53919 3326 6.6%
Center for Labor Markets and Policy | Drexel University
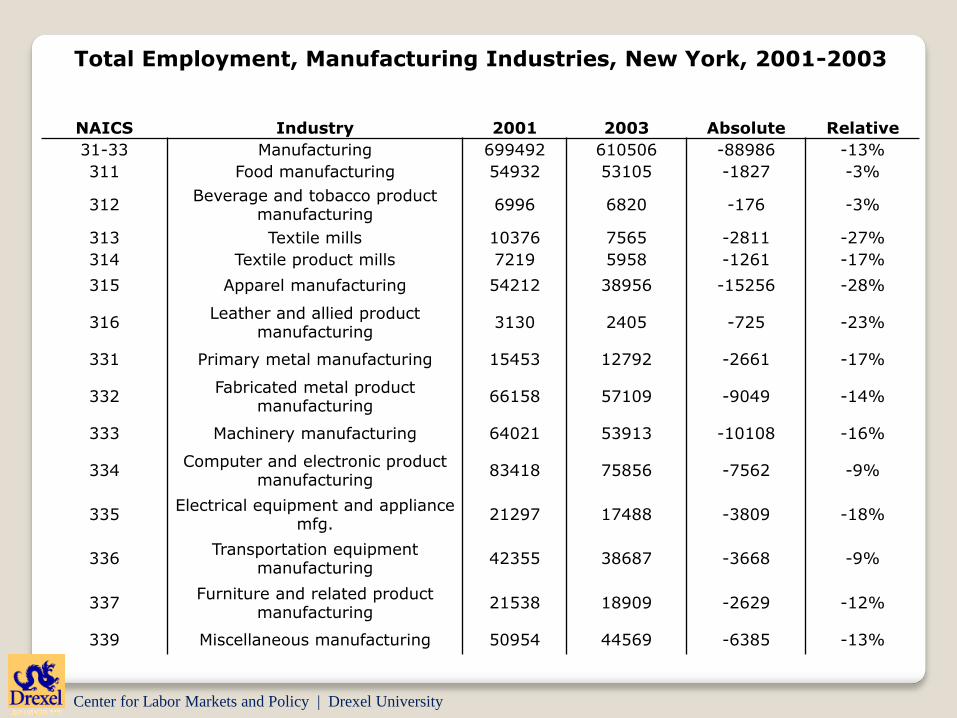
Total Employment, Manufacturing Industries, New York, 2001-2003
NAICS Industry 2001 2003 Absolute Relative
31-33 Manufacturing 699492 610506 -88986 -13%
311 Food manufacturing 54932 53105 -1827 -3%
312Beverage and tobacco product
manufacturing6996 6820 -176 -3%
313 Textile mills 10376 7565 -2811 -27%
314 Textile product mills 7219 5958 -1261 -17%
315 Apparel manufacturing 54212 38956 -15256 -28%
316Leather and allied product
manufacturing3130 2405 -725 -23%
331 Primary metal manufacturing 15453 12792 -2661 -17%
332Fabricated metal product
manufacturing66158 57109 -9049 -14%
333 Machinery manufacturing 64021 53913 -10108 -16%
334Computer and electronic product
manufacturing83418 75856 -7562 -9%
335Electrical equipment and appliance
mfg.21297 17488 -3809 -18%
336Transportation equipment
manufacturing42355 38687 -3668 -9%
337Furniture and related product
manufacturing21538 18909 -2629 -12%
339 Miscellaneous manufacturing 50954 44569 -6385 -13%
Center for Labor Markets and Policy | Drexel University
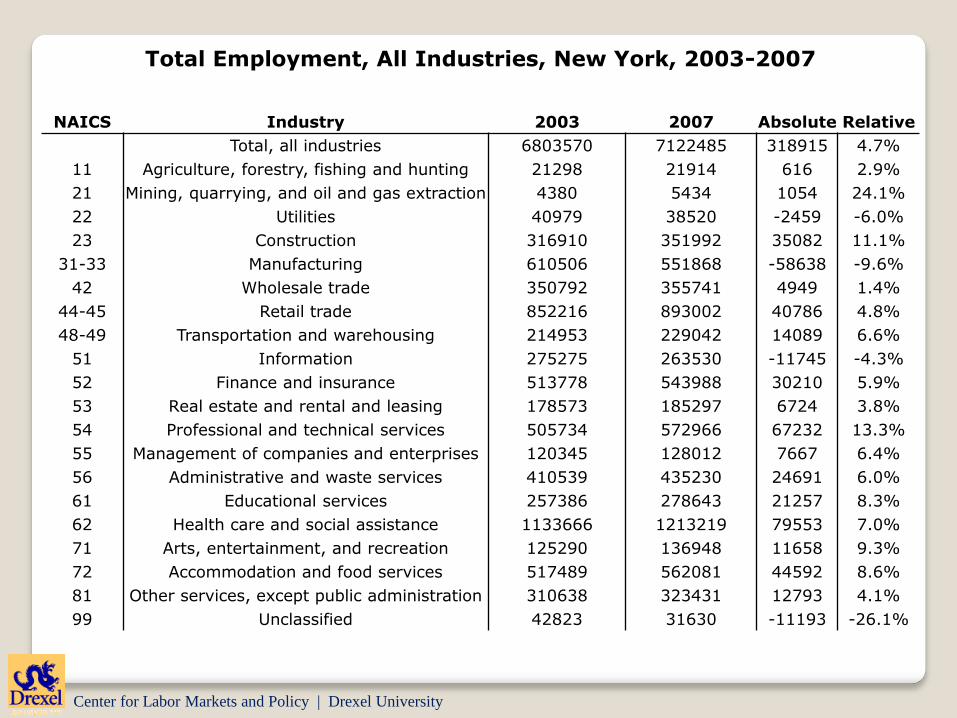
Total Employment, All Industries, New York, 2003-2007
NAICS Industry 2003 2007 Absolute Relative
Total, all industries 6803570 7122485 318915 4.7%
11 Agriculture, forestry, fishing and hunting 21298 21914 616 2.9%
21 Mining, quarrying, and oil and gas extraction 4380 5434 1054 24.1%
22 Utilities 40979 38520 -2459 -6.0%
23 Construction 316910 351992 35082 11.1%
31-33 Manufacturing 610506 551868 -58638 -9.6%
42 Wholesale trade 350792 355741 4949 1.4%
44-45 Retail trade 852216 893002 40786 4.8%
48-49 Transportation and warehousing 214953 229042 14089 6.6%
51 Information 275275 263530 -11745 -4.3%
52 Finance and insurance 513778 543988 30210 5.9%
53 Real estate and rental and leasing 178573 185297 6724 3.8%
54 Professional and technical services 505734 572966 67232 13.3%
55 Management of companies and enterprises 120345 128012 7667 6.4%
56 Administrative and waste services 410539 435230 24691 6.0%
61 Educational services 257386 278643 21257 8.3%
62 Health care and social assistance 1133666 1213219 79553 7.0%
71 Arts, entertainment, and recreation 125290 136948 11658 9.3%
72 Accommodation and food services 517489 562081 44592 8.6%
81 Other services, except public administration 310638 323431 12793 4.1%
99 Unclassified 42823 31630 -11193 -26.1%
Center for Labor Markets and Policy | Drexel University
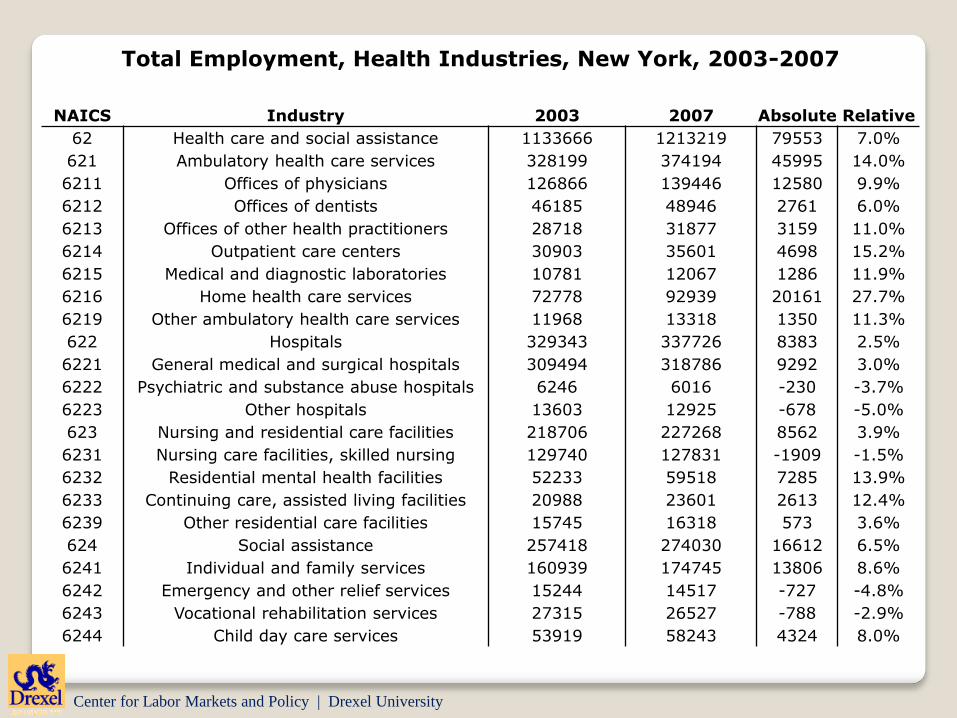
Total Employment, Health Industries, New York, 2003-2007
NAICS Industry 2003 2007 Absolute Relative
62 Health care and social assistance 1133666 1213219 79553 7.0%
621 Ambulatory health care services 328199 374194 45995 14.0%
6211 Offices of physicians 126866 139446 12580 9.9%
6212 Offices of dentists 46185 48946 2761 6.0%
6213 Offices of other health practitioners 28718 31877 3159 11.0%
6214 Outpatient care centers 30903 35601 4698 15.2%
6215 Medical and diagnostic laboratories 10781 12067 1286 11.9%
6216 Home health care services 72778 92939 20161 27.7%
6219 Other ambulatory health care services 11968 13318 1350 11.3%
622 Hospitals 329343 337726 8383 2.5%
6221 General medical and surgical hospitals 309494 318786 9292 3.0%
6222 Psychiatric and substance abuse hospitals 6246 6016 -230 -3.7%
6223 Other hospitals 13603 12925 -678 -5.0%
623 Nursing and residential care facilities 218706 227268 8562 3.9%
6231 Nursing care facilities, skilled nursing 129740 127831 -1909 -1.5%
6232 Residential mental health facilities 52233 59518 7285 13.9%
6233 Continuing care, assisted living facilities 20988 23601 2613 12.4%
6239 Other residential care facilities 15745 16318 573 3.6%
624 Social assistance 257418 274030 16612 6.5%
6241 Individual and family services 160939 174745 13806 8.6%
6242 Emergency and other relief services 15244 14517 -727 -4.8%
6243 Vocational rehabilitation services 27315 26527 -788 -2.9%
6244 Child day care services 53919 58243 4324 8.0%
Center for Labor Markets and Policy | Drexel University
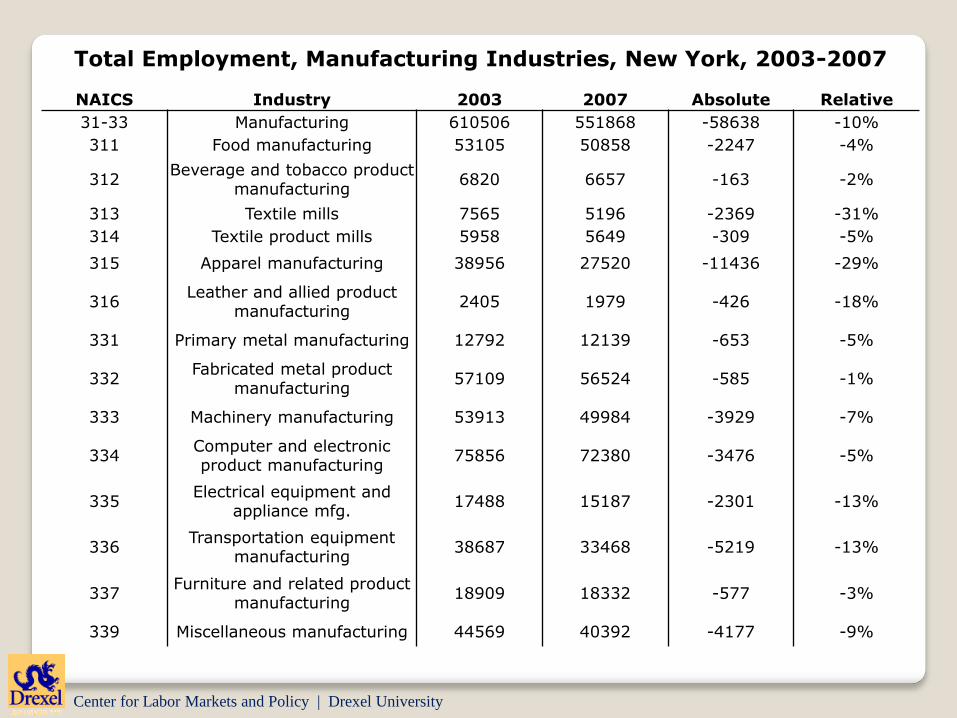
Total Employment, Manufacturing Industries, New York, 2003-2007
NAICS Industry 2003 2007 Absolute Relative
31-33 Manufacturing 610506 551868 -58638 -10%
311 Food manufacturing 53105 50858 -2247 -4%
312Beverage and tobacco product
manufacturing6820 6657 -163 -2%
313 Textile mills 7565 5196 -2369 -31%
314 Textile product mills 5958 5649 -309 -5%
315 Apparel manufacturing 38956 27520 -11436 -29%
316Leather and allied product
manufacturing2405 1979 -426 -18%
331 Primary metal manufacturing 12792 12139 -653 -5%
332Fabricated metal product
manufacturing57109 56524 -585 -1%
333 Machinery manufacturing 53913 49984 -3929 -7%
334Computer and electronic product manufacturing
75856 72380 -3476 -5%
335Electrical equipment and
appliance mfg.17488 15187 -2301 -13%
336Transportation equipment
manufacturing38687 33468 -5219 -13%
337Furniture and related product
manufacturing18909 18332 -577 -3%
339 Miscellaneous manufacturing 44569 40392 -4177 -9%

Center for Labor Markets and Policy | Drexel University
Total Employment, All Industries, New York, 2007-2010
NAICS Industry 2007 2010 Absolute Relative
Total, all industries 7122485 6905804 -216681 -3.0%
11 Agriculture, forestry, fishing and hunting 21914 22532 618 2.8%
21 Mining, quarrying, and oil and gas extraction 5434 4624 -810 -14.9%
22 Utilities 38520 38194 -326 -0.8%
23 Construction 351992 305601 -46391 -13.2%
31-33 Manufacturing 551868 455689 -96179 -17.4%
42 Wholesale trade 355741 324589 -31152 -8.8%
44-45 Retail trade 893002 872979 -20023 -2.2%
48-49 Transportation and warehousing 229042 215188 -13854 -6.0%
51 Information 263530 251171 -12359 -4.7%
52 Finance and insurance 543988 487075 -56913 -10.5%
53 Real estate and rental and leasing 185297 176175 -9122 -4.9%
54 Professional and technical services 572966 551710 -21256 -3.7%
55 Management of companies and enterprises 128012 131620 3608 2.8%
56 Administrative and waste services 435230 412425 -22805 -5.2%
61 Educational services 278643 296605 17962 6.4%
62 Health care and social assistance 1213219 1282508 69289 5.7%
71 Arts, entertainment, and recreation 136948 139114 2166 1.6%
72 Accommodation and food services 562081 593008 30927 5.5%
81 Other services, except public administration 323431 319678 -3753 -1.2%
99 Unclassified 31630 25320 -6310 -19.9%
Center for Labor Markets and Policy | Drexel University
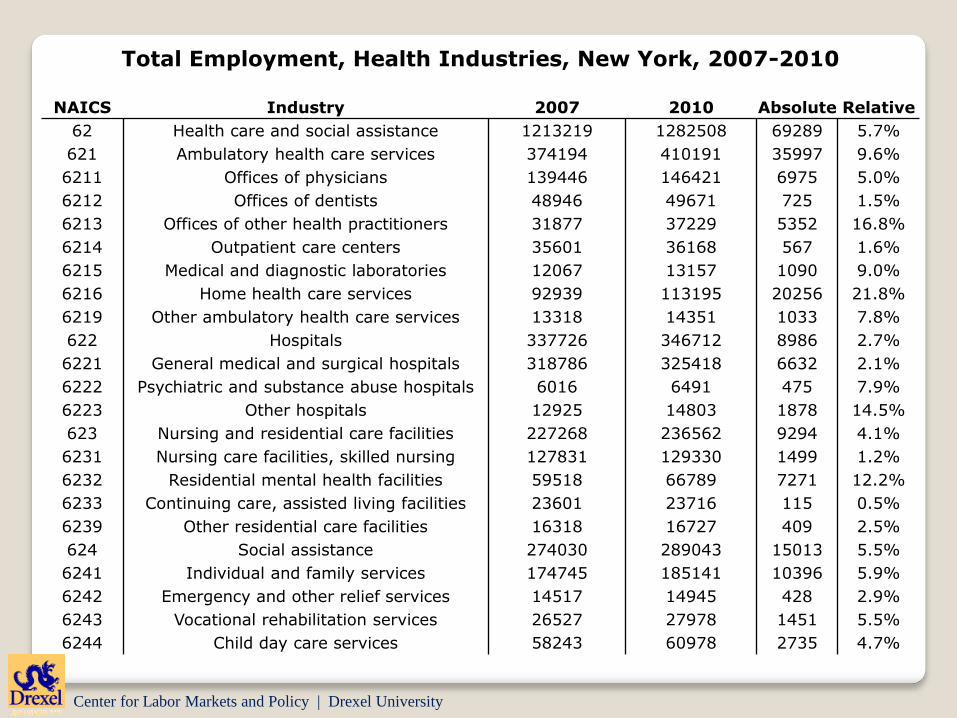
Total Employment, Health Industries, New York, 2007-2010
NAICS Industry 2007 2010 Absolute Relative
62 Health care and social assistance 1213219 1282508 69289 5.7%
621 Ambulatory health care services 374194 410191 35997 9.6%
6211 Offices of physicians 139446 146421 6975 5.0%
6212 Offices of dentists 48946 49671 725 1.5%
6213 Offices of other health practitioners 31877 37229 5352 16.8%
6214 Outpatient care centers 35601 36168 567 1.6%
6215 Medical and diagnostic laboratories 12067 13157 1090 9.0%
6216 Home health care services 92939 113195 20256 21.8%
6219 Other ambulatory health care services 13318 14351 1033 7.8%
622 Hospitals 337726 346712 8986 2.7%
6221 General medical and surgical hospitals 318786 325418 6632 2.1%
6222 Psychiatric and substance abuse hospitals 6016 6491 475 7.9%
6223 Other hospitals 12925 14803 1878 14.5%
623 Nursing and residential care facilities 227268 236562 9294 4.1%
6231 Nursing care facilities, skilled nursing 127831 129330 1499 1.2%
6232 Residential mental health facilities 59518 66789 7271 12.2%
6233 Continuing care, assisted living facilities 23601 23716 115 0.5%
6239 Other residential care facilities 16318 16727 409 2.5%
624 Social assistance 274030 289043 15013 5.5%
6241 Individual and family services 174745 185141 10396 5.9%
6242 Emergency and other relief services 14517 14945 428 2.9%
6243 Vocational rehabilitation services 26527 27978 1451 5.5%
6244 Child day care services 58243 60978 2735 4.7%
Center for Labor Markets and Policy | Drexel University
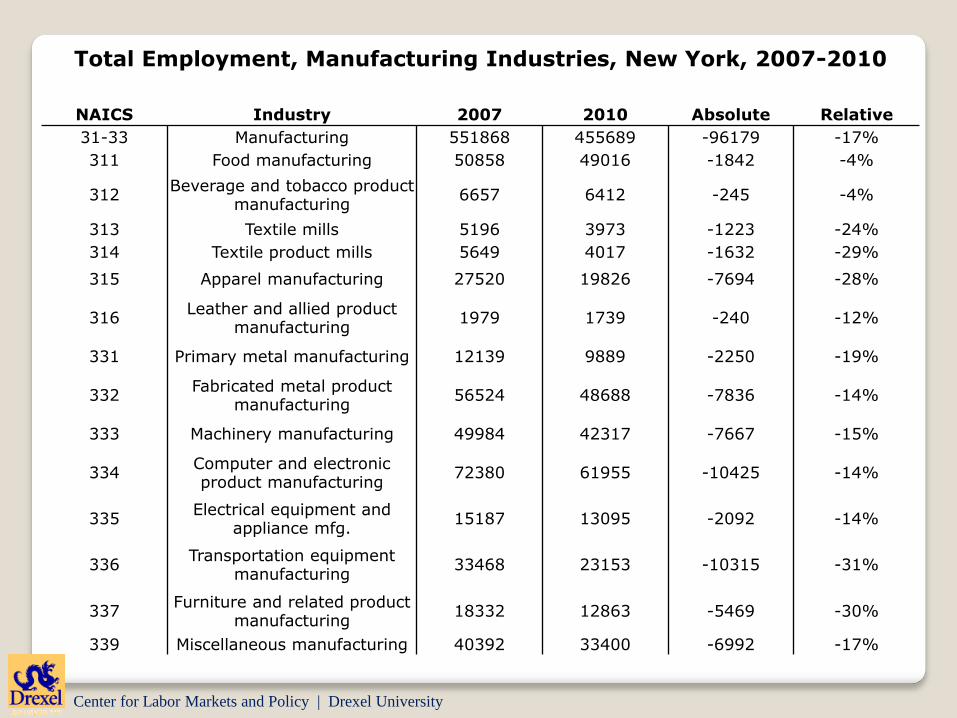
Total Employment, Manufacturing Industries, New York, 2007-2010
NAICS Industry 2007 2010 Absolute Relative
31-33 Manufacturing 551868 455689 -96179 -17%
311 Food manufacturing 50858 49016 -1842 -4%
312Beverage and tobacco product
manufacturing6657 6412 -245 -4%
313 Textile mills 5196 3973 -1223 -24%
314 Textile product mills 5649 4017 -1632 -29%
315 Apparel manufacturing 27520 19826 -7694 -28%
316Leather and allied product
manufacturing1979 1739 -240 -12%
331 Primary metal manufacturing 12139 9889 -2250 -19%
332Fabricated metal product
manufacturing56524 48688 -7836 -14%
333 Machinery manufacturing 49984 42317 -7667 -15%
334Computer and electronic product manufacturing
72380 61955 -10425 -14%
335Electrical equipment and
appliance mfg.15187 13095 -2092 -14%
336Transportation equipment
manufacturing33468 23153 -10315 -31%
337Furniture and related product
manufacturing18332 12863 -5469 -30%
339 Miscellaneous manufacturing 40392 33400 -6992 -17%
Center for Labor Markets and Policy | Drexel University
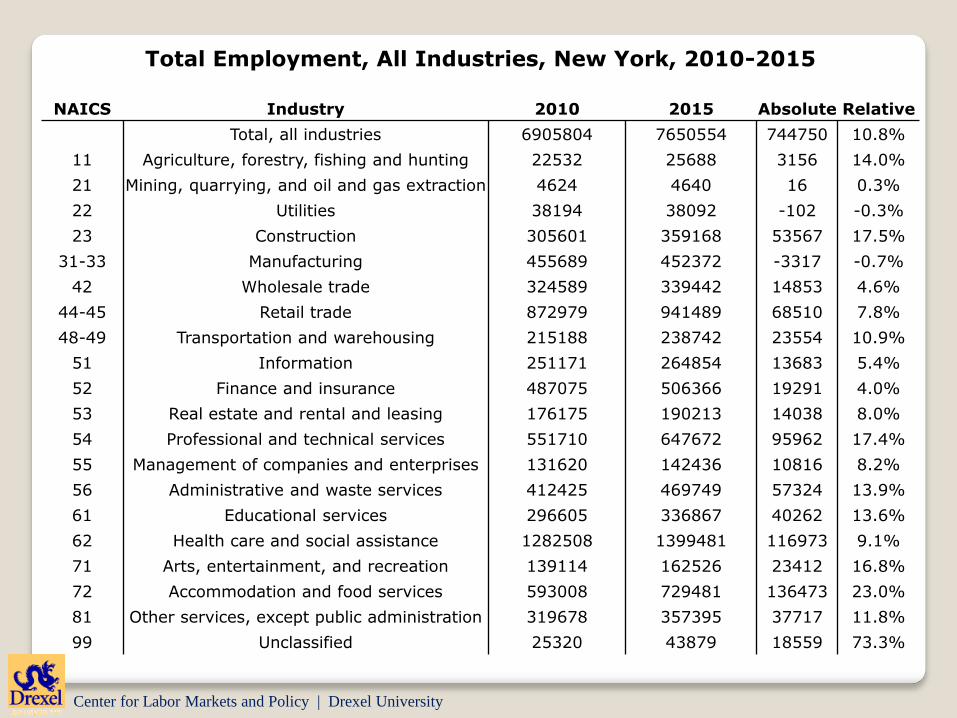
Total Employment, All Industries, New York, 2010-2015
NAICS Industry 2010 2015 Absolute Relative
Total, all industries 6905804 7650554 744750 10.8%
11 Agriculture, forestry, fishing and hunting 22532 25688 3156 14.0%
21 Mining, quarrying, and oil and gas extraction 4624 4640 16 0.3%
22 Utilities 38194 38092 -102 -0.3%
23 Construction 305601 359168 53567 17.5%
31-33 Manufacturing 455689 452372 -3317 -0.7%
42 Wholesale trade 324589 339442 14853 4.6%
44-45 Retail trade 872979 941489 68510 7.8%
48-49 Transportation and warehousing 215188 238742 23554 10.9%
51 Information 251171 264854 13683 5.4%
52 Finance and insurance 487075 506366 19291 4.0%
53 Real estate and rental and leasing 176175 190213 14038 8.0%
54 Professional and technical services 551710 647672 95962 17.4%
55 Management of companies and enterprises 131620 142436 10816 8.2%
56 Administrative and waste services 412425 469749 57324 13.9%
61 Educational services 296605 336867 40262 13.6%
62 Health care and social assistance 1282508 1399481 116973 9.1%
71 Arts, entertainment, and recreation 139114 162526 23412 16.8%
72 Accommodation and food services 593008 729481 136473 23.0%
81 Other services, except public administration 319678 357395 37717 11.8%
99 Unclassified 25320 43879 18559 73.3%
Center for Labor Markets and Policy | Drexel University
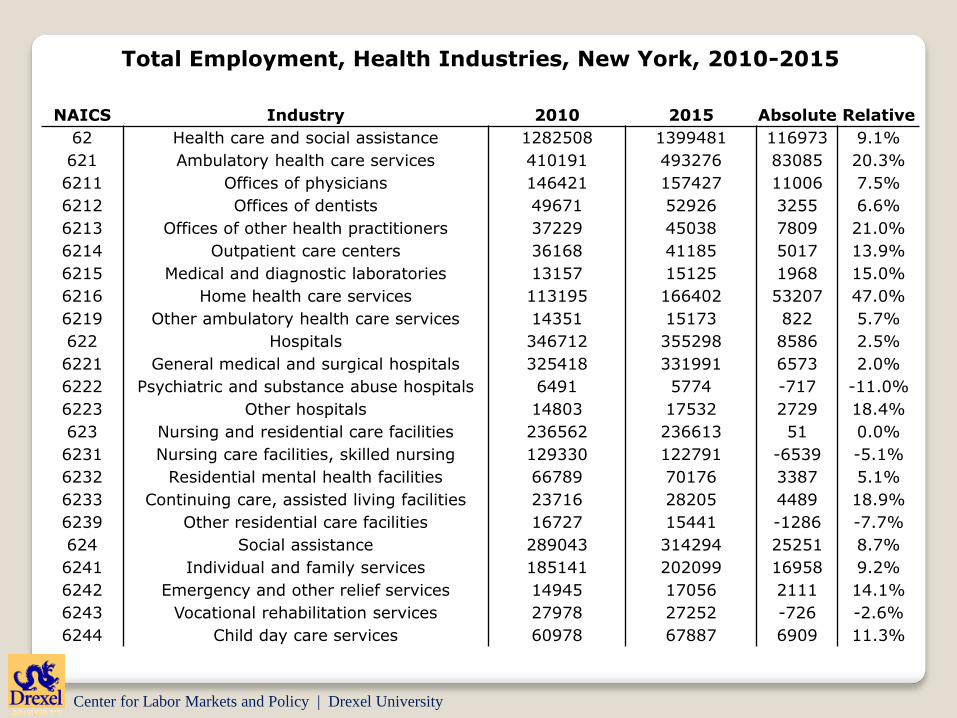
Total Employment, Health Industries, New York, 2010-2015
NAICS Industry 2010 2015 Absolute Relative
62 Health care and social assistance 1282508 1399481 116973 9.1%
621 Ambulatory health care services 410191 493276 83085 20.3%
6211 Offices of physicians 146421 157427 11006 7.5%
6212 Offices of dentists 49671 52926 3255 6.6%
6213 Offices of other health practitioners 37229 45038 7809 21.0%
6214 Outpatient care centers 36168 41185 5017 13.9%
6215 Medical and diagnostic laboratories 13157 15125 1968 15.0%
6216 Home health care services 113195 166402 53207 47.0%
6219 Other ambulatory health care services 14351 15173 822 5.7%
622 Hospitals 346712 355298 8586 2.5%
6221 General medical and surgical hospitals 325418 331991 6573 2.0%
6222 Psychiatric and substance abuse hospitals 6491 5774 -717 -11.0%
6223 Other hospitals 14803 17532 2729 18.4%
623 Nursing and residential care facilities 236562 236613 51 0.0%
6231 Nursing care facilities, skilled nursing 129330 122791 -6539 -5.1%
6232 Residential mental health facilities 66789 70176 3387 5.1%
6233 Continuing care, assisted living facilities 23716 28205 4489 18.9%
6239 Other residential care facilities 16727 15441 -1286 -7.7%
624 Social assistance 289043 314294 25251 8.7%
6241 Individual and family services 185141 202099 16958 9.2%
6242 Emergency and other relief services 14945 17056 2111 14.1%
6243 Vocational rehabilitation services 27978 27252 -726 -2.6%
6244 Child day care services 60978 67887 6909 11.3%
Center for Labor Markets and Policy | Drexel University
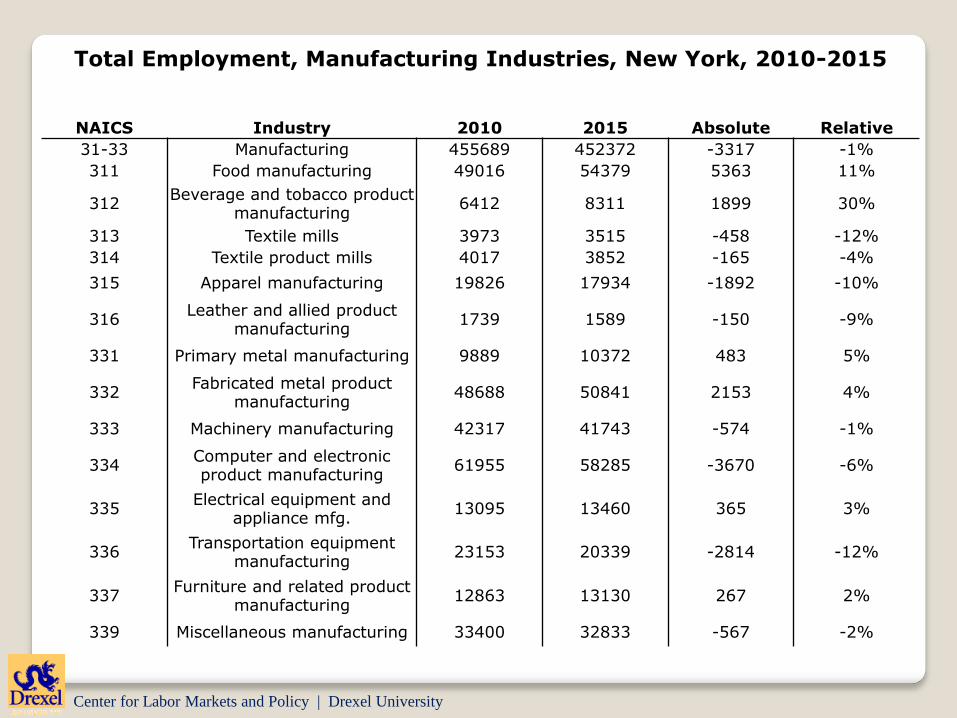
Total Employment, Manufacturing Industries, New York, 2010-2015
NAICS Industry 2010 2015 Absolute Relative
31-33 Manufacturing 455689 452372 -3317 -1%
311 Food manufacturing 49016 54379 5363 11%
312Beverage and tobacco product
manufacturing6412 8311 1899 30%
313 Textile mills 3973 3515 -458 -12%
314 Textile product mills 4017 3852 -165 -4%
315 Apparel manufacturing 19826 17934 -1892 -10%
316Leather and allied product
manufacturing1739 1589 -150 -9%
331 Primary metal manufacturing 9889 10372 483 5%
332Fabricated metal product
manufacturing48688 50841 2153 4%
333 Machinery manufacturing 42317 41743 -574 -1%
334Computer and electronic product manufacturing
61955 58285 -3670 -6%
335Electrical equipment and
appliance mfg.13095 13460 365 3%
336Transportation equipment
manufacturing23153 20339 -2814 -12%
337Furniture and related product
manufacturing12863 13130 267 2%
339 Miscellaneous manufacturing 33400 32833 -567 -2%
Center for Labor Markets and Policy | Drexel University
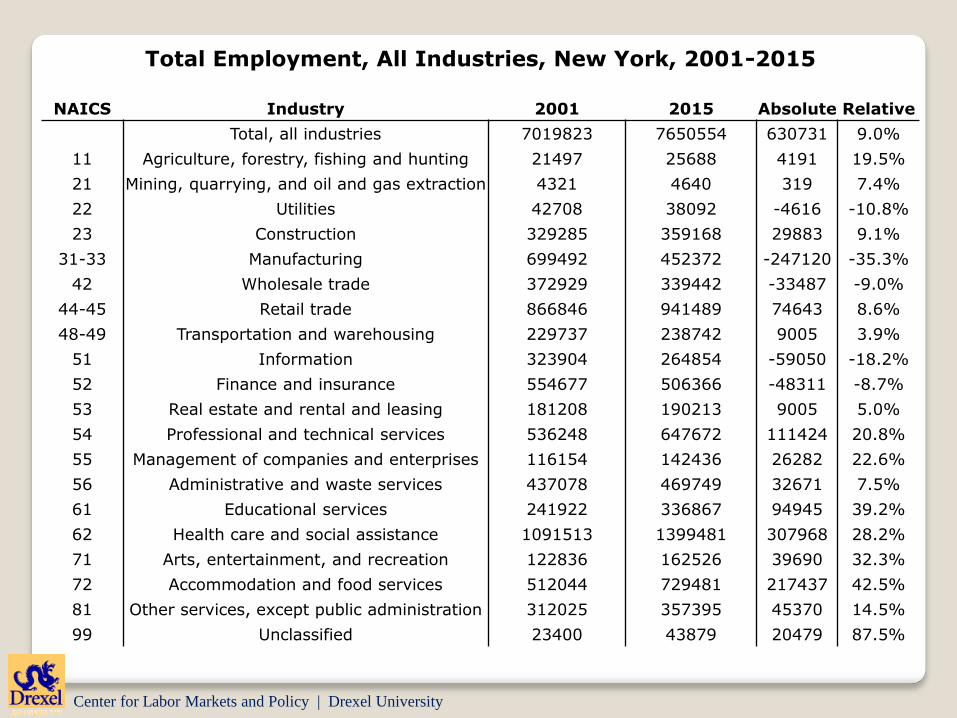
Total Employment, All Industries, New York, 2001-2015
NAICS Industry 2001 2015 Absolute Relative
Total, all industries 7019823 7650554 630731 9.0%
11 Agriculture, forestry, fishing and hunting 21497 25688 4191 19.5%
21 Mining, quarrying, and oil and gas extraction 4321 4640 319 7.4%
22 Utilities 42708 38092 -4616 -10.8%
23 Construction 329285 359168 29883 9.1%
31-33 Manufacturing 699492 452372 -247120 -35.3%
42 Wholesale trade 372929 339442 -33487 -9.0%
44-45 Retail trade 866846 941489 74643 8.6%
48-49 Transportation and warehousing 229737 238742 9005 3.9%
51 Information 323904 264854 -59050 -18.2%
52 Finance and insurance 554677 506366 -48311 -8.7%
53 Real estate and rental and leasing 181208 190213 9005 5.0%
54 Professional and technical services 536248 647672 111424 20.8%
55 Management of companies and enterprises 116154 142436 26282 22.6%
56 Administrative and waste services 437078 469749 32671 7.5%
61 Educational services 241922 336867 94945 39.2%
62 Health care and social assistance 1091513 1399481 307968 28.2%
71 Arts, entertainment, and recreation 122836 162526 39690 32.3%
72 Accommodation and food services 512044 729481 217437 42.5%
81 Other services, except public administration 312025 357395 45370 14.5%
99 Unclassified 23400 43879 20479 87.5%

Center for Labor Markets and Policy | Drexel University
Total Employment, Health Industries, New York, 2001-2015
NAICS Industry 2001 2015 Absolute Relative
62 Health care and social assistance 1091513 1399481 307968 28.2%
621 Ambulatory health care services 313199 493276 180077 57.5%
6211 Offices of physicians 124339 157427 33088 26.6%
6212 Offices of dentists 44826 52926 8100 18.1%
6213 Offices of other health practitioners 27185 45038 17853 65.7%
6214 Outpatient care centers 29848 41185 11337 38.0%
6215 Medical and diagnostic laboratories 12027 15125 3098 25.8%
6216 Home health care services 64616 166402 101786 157.5%
6219 Other ambulatory health care services 10358 15173 4815 46.5%
622 Hospitals 326263 355298 29035 8.9%
6221 General medical and surgical hospitals 307878 331991 24113 7.8%
6222 Psychiatric and substance abuse hospitals 5922 5774 -148 -2.5%
6223 Other hospitals 12462 17532 5070 40.7%
623 Nursing and residential care facilities 208532 236613 28081 13.5%
6231 Nursing care facilities, skilled nursing 126564 122791 -3773 -3.0%
6232 Residential mental health facilities 47945 70176 22231 46.4%
6233 Continuing care, assisted living facilities 18293 28205 9912 54.2%
6239 Other residential care facilities 15731 15441 -290 -1.8%
624 Social assistance 243518 314294 70776 29.1%
6241 Individual and family services 149359 202099 52740 35.3%
6242 Emergency and other relief services 15967 17056 1089 6.8%
6243 Vocational rehabilitation services 27599 27252 -347 -1.3%
6244 Child day care services 50593 67887 17294 34.2%
Center for Labor Markets and Policy | Drexel University
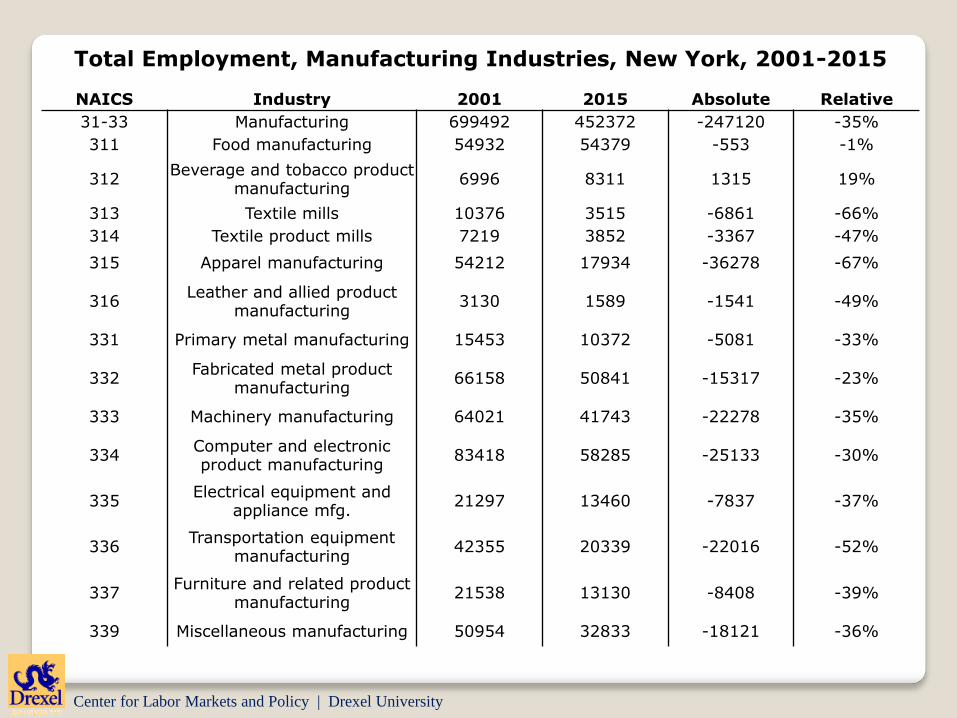
Total Employment, Manufacturing Industries, New York, 2001-2015
NAICS Industry 2001 2015 Absolute Relative
31-33 Manufacturing 699492 452372 -247120 -35%
311 Food manufacturing 54932 54379 -553 -1%
312Beverage and tobacco product
manufacturing6996 8311 1315 19%
313 Textile mills 10376 3515 -6861 -66%
314 Textile product mills 7219 3852 -3367 -47%
315 Apparel manufacturing 54212 17934 -36278 -67%
316Leather and allied product
manufacturing3130 1589 -1541 -49%
331 Primary metal manufacturing 15453 10372 -5081 -33%
332Fabricated metal product
manufacturing66158 50841 -15317 -23%
333 Machinery manufacturing 64021 41743 -22278 -35%
334Computer and electronic product manufacturing
83418 58285 -25133 -30%
335Electrical equipment and
appliance mfg.21297 13460 -7837 -37%
336Transportation equipment
manufacturing42355 20339 -22016 -52%
337Furniture and related product
manufacturing21538 13130 -8408 -39%
339 Miscellaneous manufacturing 50954 32833 -18121 -36%
Center for Labor Markets and Policy | Drexel University
Trends in the Number of Employed 16-19 Year Olds in New York, by Major Industry Sector, 2005-2007 to 2013-2015
16-19 2005-2007 2013-2015AbsoluteChange
Relative Change
Agri, Forestry, Fishing, and Hunting 2865 3659 794 27.7
Mining na na na na
Utilities na na na na
Construction 10356 8239 -2117 -20%
Non-Durable Manufacturing 4617 3548 -1069 -23%
Durable Manufacturing 3683 4458 775 21%
Wholesale Trade 3591 1765 -1826 -51%
Retail Trade 98719 63126 -35593 -36%
Transportation and Warehousing 4401 3929 -472 -11%
Information 4478 4139 -339 -8%
Finanace and Insurance 5162 1019 -4143 -80%
Real Estate, Rental and Leasing 2469 2087 -382 -15%
Professional, Scientific, and Technical 5964 3576 -2388 -40%
Mgmt of Companies and Enterprises na na na na
Administrative Support & Waste Mgmt 9973 4790 -5183 -52%
Educational 19537 13378 -6159 -32%
Healthcare and Social 24094 16138 -7956 -33%
Arts, Entertainment and Recreation 15936 12234 -3702 -23%
Accommodation and Food Services 77907 62290 -15617 -20%
Other Services 16527 9443 -7084 -43%
Public Services 3047 1608 -1439 -47%
Total 313417 219657 -93760 -30%

Center for Labor Markets and Policy | Drexel University
Trends in the Number of Employed 16-19 Year Olds in New York, by Major Occupation, 2005-2007 to 2013-2015
16-19 2005-2007 2013-2015Absolute Change
Relative Change
Management Occupations na na na na
Business and Financial Operations Occupations na na na na
Computer and Mathematical Occupations na na na na
Architecture and Engineering Occupations na na na na
Life, Physical, and Social Science Occupations na na na na
Community and Social Services Occupations 2967 1172 -1795 -60%
Legal Occupations na na na na
Education, Training, and Library Occupations 8123 7719 -404 -5%
Arts, Design, Entertainment, Sports, and Media 3237 3332 95 3%
Healthcare Practitioner and Technical na na na naHealthcare Support Occupations 5013 4508 -505 -10%Protective Service Occupations 11235 3630 -7605 -68%
Food Preparation and Serving Occupations 71890 47106 -24784 -34%
Building and Grounds Cleaning Occupations 12177 10967 -1210 -10%
Personal Care and Service Occupations 20041 15760 -4281 -21%
High-Level Sales Occupations 4974 5600 626 13%
Low-Level Sales Occupations 81268 54335 -26933 -33%
Office and Administrative Support 47858 25567 -22291 -47%
Farming, Fishing, and Forestry Occupations 3147 2925 -222 -7%
Construction and Extraction Occupations 10309 7797 -2512 -24%
Installations, Maintenance, and Repair Occupations 4425 2023 -2402 -54%
Production Occupations 4788 5634 846 18%
Transportation and Material Moving Occupations 14029 12637 -1392 -10%
Total 313417 219660 -93757 -30%
Center for Labor Markets and Policy | Drexel University
Trends in the Number of Employed 20-24 Year Olds in New York, by Major Industry Sector, 2005-2007 to 2013-2015
20-24 2005-2007 2013-2015AbsoluteChange
RelativeChange
Agri, Forestry, Fishing, and Hunting 3732 3597 -135 -4%
Mining 485 217 -268 -55%
Utilities 2010 1620 -390 -19%
Construction 52708 32490 -20218 -38%
Non-Durable Manufacturing 15017 15116 99 1%
Durable Manufacturing 17684 21913 4229 24%
Wholesale Trade 17507 8721 -8786 -50%
Retail Trade 162600 173188 10588 7%
Transportation and Warehousing 27055 23527 -3528 -13%
Information 24445 22766 -1679 -7%
Finance and Insurance 40558 40346 -212 -1%
Real Estate, Rental and Leasing 19970 16786 -3184 -16%
Professional, Scientific, and Technical 32323 47648 15325 47%
Management of Companies and Enterprises na na na na
Administrative Support and Waste Management 27458 30102 2644 10%
Educational 66754 51655 -15099 -23%
Healthcare and Social 90728 100995 10267 11%
Arts, Entertainment and Recreation 23339 31429 8090 35%
Accomodation and Food Services 99611 124111 24500 25%
Other Services 42900 37946 -4954 -12%
Public Services 15407 10196 -5211 -34%
Total 782643 794496 11853 2%
Center for Labor Markets and Policy | Drexel University
Trends in the Number of Employed 20-24 Year Olds in New York, by Major Occupation, 2005-2007 to 2013-2015
20-to-24 2005-2007 2013-2015AbsoluteChange
Relative Change
Management Occupations 30363 26623 -3740 -12%
Business and Financial Operations Occupations 22499 31521 9022 40%
Computer and Mathematical Occupations 9107 20564 11457 126%Architecture and Engineering Occupations 7660 4983 -2677 -35%
Life, Physical, and Social Science Occupations 6612 4946 -1666 -25%
Community and Social Services Occupations 9097 11735 2638 29%
Legal Occupations 4872 4205 -667 -14%Education, Training, and Library Occupations 47873 35318 -12555 -26%
Arts, Design, Entertainment, Sports, and Media Occupations
16245 21851 5606 35%
Healthcare Practitioner and Technical Occupations 21346 19619 -1727 -8%
Healthcare Support Occupations 19371 31278 11907 61%
Protective Service Occupations 18285 14482 -3803 -21%
Food Preparation and Serving Occupations 89375 113234 23859 27%
Building and Grounds Cleaning Occupations 27676 25844 -1832 -7%
Personal Care and Service Occupations 36804 49184 12380 34%
High-Level Sales Occupations 39470 35573 -3897 -10%
Low-Level Sales Occupations 95350 110942 15592 16%
Office and Administrative Support Occupations 138030 114364 -23666 -17%Farming, Fishing, and Forestry Occupations 3649 2808 -841 -23%Construction and Extraction Occupations 48494 30483 -18011 -37%
Installations, Maintenance, and Repair Occupations
20332 20296 -36 0%
Production Occupations 28468 25058 -3410 -12%
Transportation and Material Moving Occupations 41666 39585 -2081 -5%Total 782644 794496 11852 2%
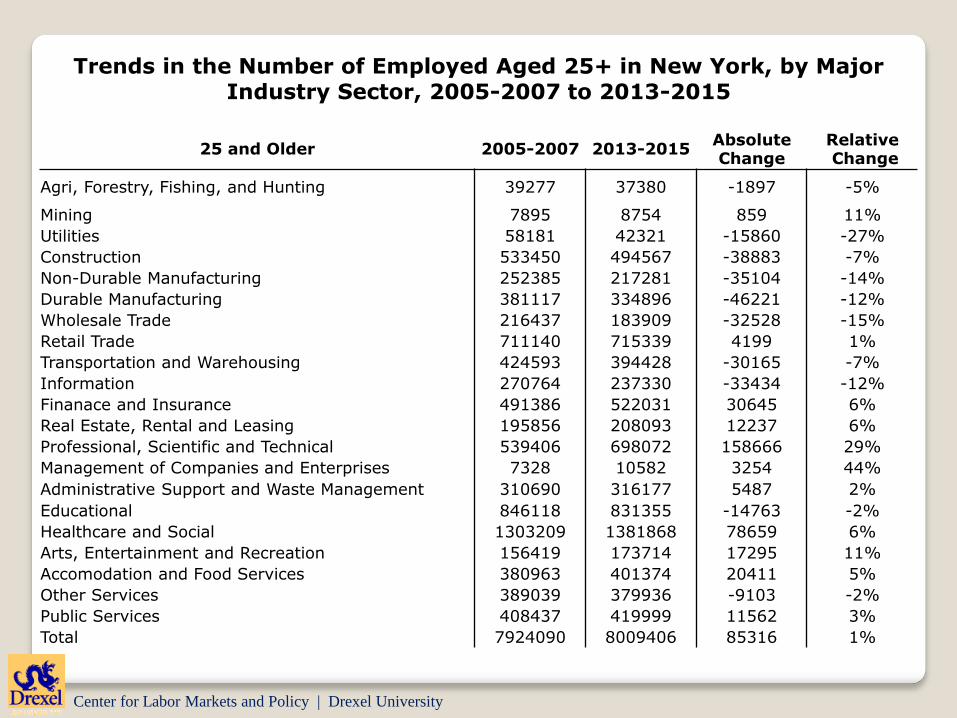
Center for Labor Markets and Policy | Drexel University
Trends in the Number of Employed Aged 25+ in New York, by Major Industry Sector, 2005-2007 to 2013-2015
25 and Older 2005-2007 2013-2015Absolute Change
RelativeChange
Agri, Forestry, Fishing, and Hunting 39277 37380 -1897 -5%
Mining 7895 8754 859 11%
Utilities 58181 42321 -15860 -27%
Construction 533450 494567 -38883 -7%
Non-Durable Manufacturing 252385 217281 -35104 -14%
Durable Manufacturing 381117 334896 -46221 -12%
Wholesale Trade 216437 183909 -32528 -15%
Retail Trade 711140 715339 4199 1%
Transportation and Warehousing 424593 394428 -30165 -7%
Information 270764 237330 -33434 -12%
Finanace and Insurance 491386 522031 30645 6%
Real Estate, Rental and Leasing 195856 208093 12237 6%
Professional, Scientific and Technical 539406 698072 158666 29%
Management of Companies and Enterprises 7328 10582 3254 44%
Administrative Support and Waste Management 310690 316177 5487 2%
Educational 846118 831355 -14763 -2%
Healthcare and Social 1303209 1381868 78659 6%
Arts, Entertainment and Recreation 156419 173714 17295 11%
Accomodation and Food Services 380963 401374 20411 5%
Other Services 389039 379936 -9103 -2%
Public Services 408437 419999 11562 3%
Total 7924090 8009406 85316 1%

Center for Labor Markets and Policy | Drexel University
Trends in the Number of Employed 25+ in New York, by Major Occupation, 2005-2007 to 2013-2015
25 and Older 2005-2007 2013-2015Absolute Change
Relative Change
Management Occupations 805791 918427 112636 14%
Business and Financial Operations Occupations 342523 455178 112655 33%
Computer and Mathematical Occupations 159289 218383 59094 37%Architecture and Engineering Occupations 129552 127198 -2354 -2%Life, Physical, and Social Science Occupations 86407 64653 -21754 -25%Community and Social Services Occupations 153892 172884 18992 12%Legal Occupations 133217 168052 34835 26%Education, Training, and Library Occupations 566047 567123 1076 0%
Arts, Design, Entertainment, Sports, and Media 226557 265067 38510 17%
Healthcare Practitioner and Technical Occupations
479696 521352 41656 9%
Healthcare Support Occupations 284699 293251 8552 3%Protective Service Occupations 220279 238463 18184 8%
Food Preparation and Serving Occupations 309242 312440 3198 1%
Building and Grounds Cleaning Occupations 333049 326714 -6335 -2%
Personal Care and Service Occupations 288913 314738 25825 9%
High-Level Sales Occupations 470390 418863 -51527 -11%Low-Level Sales Occupations 311324 324367 13043 4%Office and Administrative Support Occupations 1069340 950890 -118450 -11%Farming, Fishing, and Forestry Occupations 11705 11289 -416 -4%Construction and Extraction Occupations 452616 368462 -84154 -19%
Installations, Maintenance, and Repair Occupations
243013 227134 -15879 -7%
Production Occupations 398728 303326 -95402 -24%Transportation and Material Moving Occupations 447823 441152 -6671 -1%Total 7924092 8009406 85314 1%

Center for Labor Markets and Policy | Drexel University
0
2000
4000
6000
8000
10000
12000
14000
16000
18000
Dec 2
000
Apr
2001
Aug 2
001
Dec 2
001
Apr
2002
Aug 2
002
Dec 2
002
Apr
2003
Aug 2
003
Dec 2
003
Apr
2004
Aug 2
004
Dec 2
004
Apr
2005
Aug 2
005
Dec 2
005
Apr
2006
Aug 2
006
Dec 2
006
Apr
2007
Aug 2
007
Dec 2
007
Apr
2008
Aug 2
008
Dec 2
008
Apr
2009
Aug 2
009
Dec 2
009
Apr
2010
Aug 2
010
Dec 2
010
Apr
2011
Aug 2
011
Dec 2
011
Apr
2012
Aug 2
012
Dec 2
012
Apr
2013
Aug 2
013
Dec 2
013
Apr
2014
Aug 2
014
Dec 2
014
Apr
2015
Aug 2
015
Dec 2
015
Nu
mb
ers (
Th
ou
san
ds)
Month, Year
Vacant Job
Unemployment
U:V ratio = 2.78Jun 2003
U:V ratio = 1.42Apr 2007
U:V ratio = 6.40Oct 2009
Trends in the Number of Unemployed Workers and Vacant Jobs in the U.S. 2000 to 2016
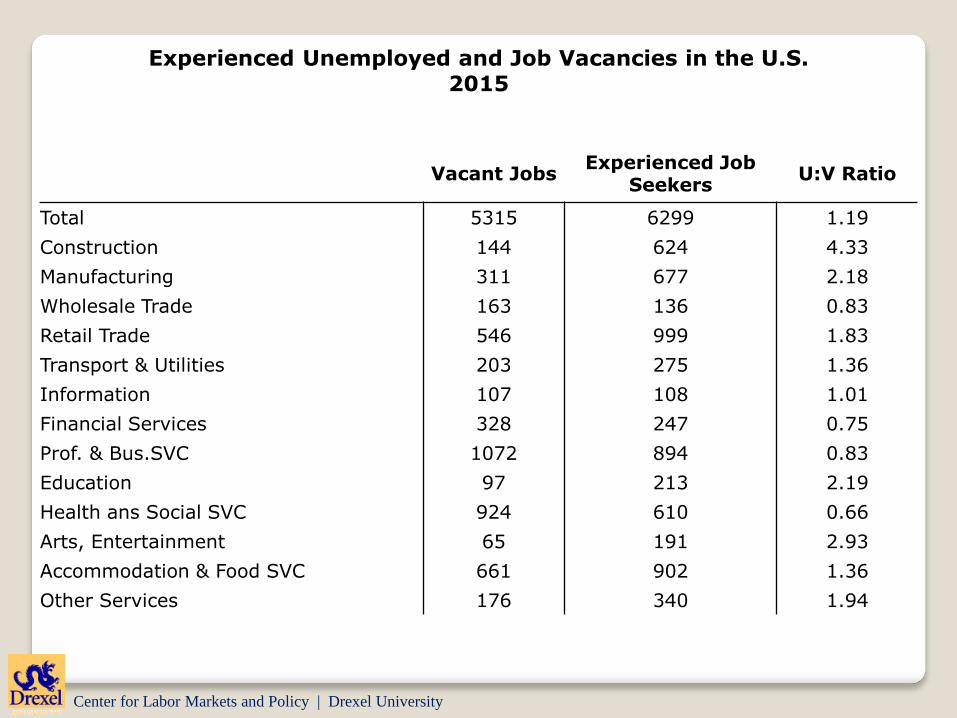
Center for Labor Markets and Policy | Drexel University
Vacant JobsExperienced Job
SeekersU:V Ratio
Total 5315 6299 1.19
Construction 144 624 4.33
Manufacturing 311 677 2.18
Wholesale Trade 163 136 0.83
Retail Trade 546 999 1.83
Transport & Utilities 203 275 1.36
Information 107 108 1.01
Financial Services 328 247 0.75
Prof. & Bus.SVC 1072 894 0.83
Education 97 213 2.19
Health ans Social SVC 924 610 0.66
Arts, Entertainment 65 191 2.93
Accommodation & Food SVC 661 902 1.36
Other Services 176 340 1.94
Experienced Unemployed and Job Vacancies in the U.S.2015
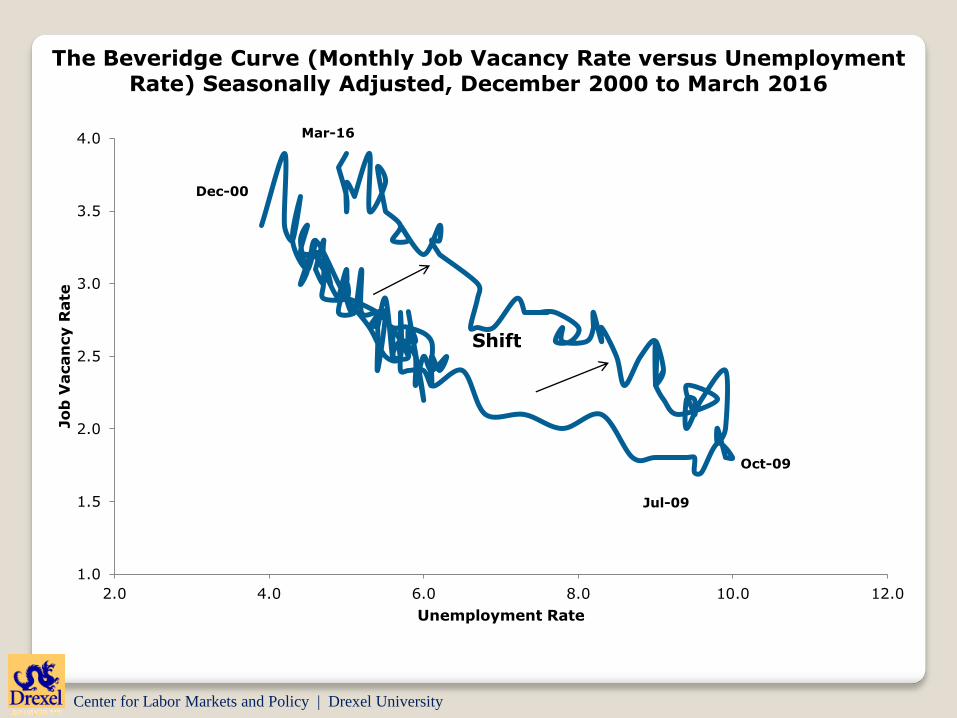
Center for Labor Markets and Policy | Drexel University
1.0
1.5
2.0
2.5
3.0
3.5
4.0
2.0 4.0 6.0 8.0 10.0 12.0
Jo
b V
acan
cy R
ate
Unemployment Rate
Dec-00
Jul-09
Oct-09
Mar-16
Shift
The Beveridge Curve (Monthly Job Vacancy Rate versus Unemployment Rate) Seasonally Adjusted, December 2000 to March 2016
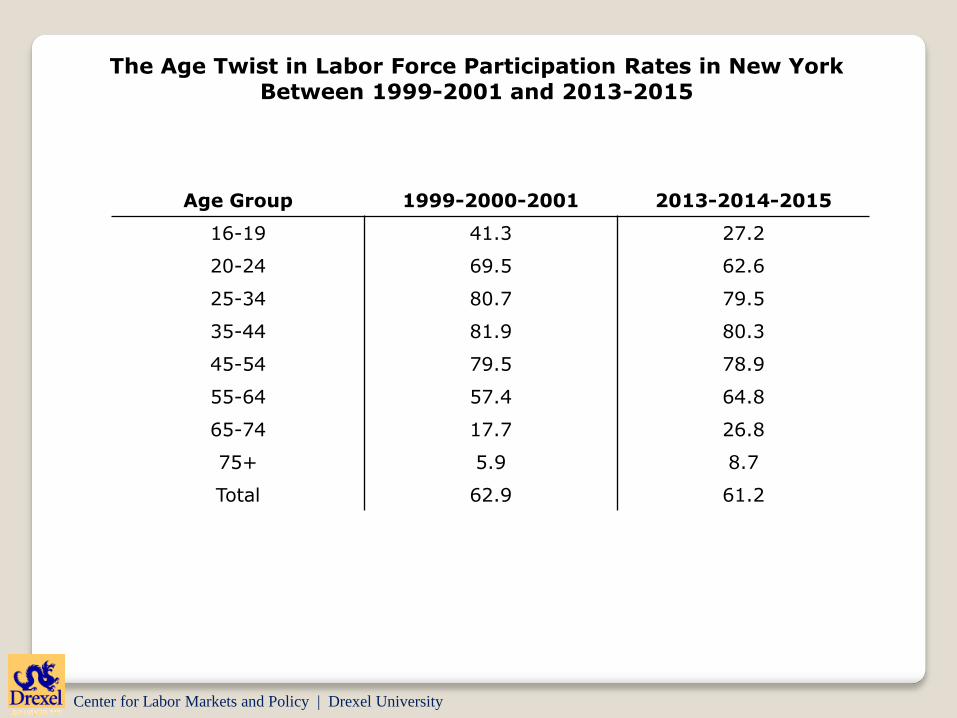
Center for Labor Markets and Policy | Drexel University
Age Group 1999-2000-2001 2013-2014-2015
16-19 41.3 27.2
20-24 69.5 62.6
25-34 80.7 79.5
35-44 81.9 80.3
45-54 79.5 78.9
55-64 57.4 64.8
65-74 17.7 26.8
75+ 5.9 8.7
Total 62.9 61.2
The Age Twist in Labor Force Participation Rates in New YorkBetween 1999-2001 and 2013-2015
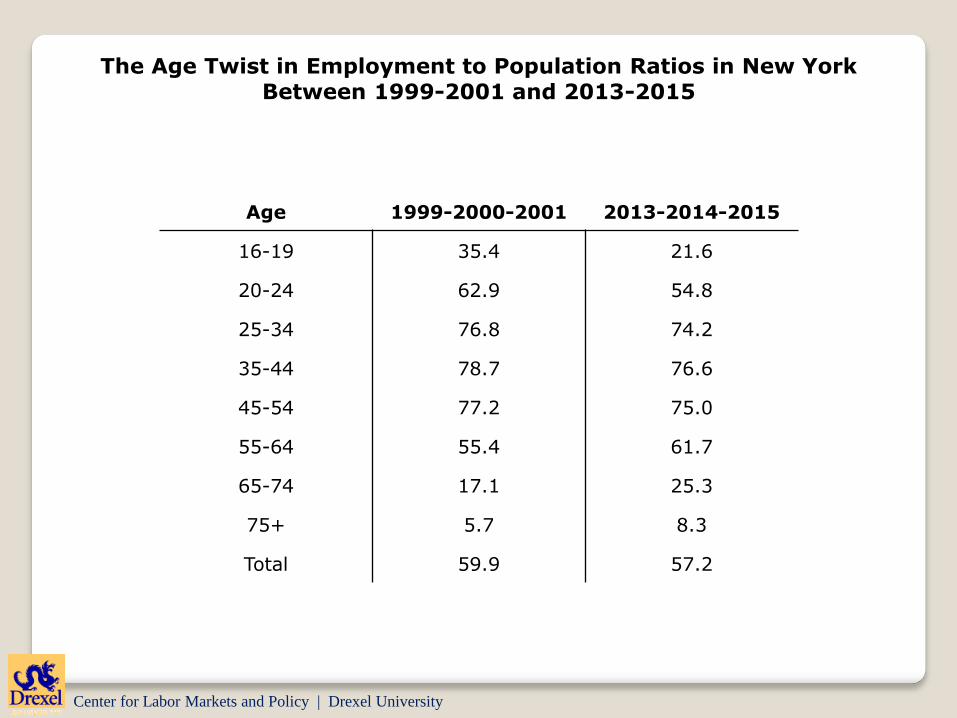
Center for Labor Markets and Policy | Drexel University
Age 1999-2000-2001 2013-2014-2015
16-19 35.4 21.6
20-24 62.9 54.8
25-34 76.8 74.2
35-44 78.7 76.6
45-54 77.2 75.0
55-64 55.4 61.7
65-74 17.1 25.3
75+ 5.7 8.3
Total 59.9 57.2
The Age Twist in Employment to Population Ratios in New YorkBetween 1999-2001 and 2013-2015
![Changing Hudson Valley - Population Trends · [CHANGING HUDSON VALLEY - POPULATION TRENDS] Hudson Valley Pattern for Progress Page 3 REPORT HIGHLIGHTS New York state has lost a net](https://img.pdfslide.us/doc/110x75/5e13efb79ef44d1d877e4208/changing-hudson-valley-population-changing-hudson-valley-population-trends.jpg)