Embed Size (px)
Citation preview
Self-Employment, Family-Business Ownership, and Economic Mobility ELIZABETH BROWN AND AUSTIN NICHOLS AN OPPORTUNITY AND OWNERSHIP INITIATIVE REPORT MAY 2014
Copyright © May 2014. Urban Institute. Permission is granted for reproduction of this file, with attribution to the Urban Institute.
Cover photograph © 2009. Associated Press/Rich Pedroncelli.
Elizabeth Brown gratefully acknowledges funding from the Pardee RAND Graduate School via the Eugene Rosenfeld Dissertation Award and the Kip and Mary Ann Hagopian Dissertation Award. This research was also funded in part by the Annie E. Casey Foundation. We thank them for their support and acknowledge that the findings and conclusions presented are those of the authors alone, and do not necessarily reflect the opinions of any funders. The authors thank Opportunity and Ownership seminar participants for helpful comments.
The Urban Institute is a nonprofit, nonpartisan policy research and educational organization that examines the social, economic, and governance problems facing the nation. The views expressed are those of the authors and should not be attributed to the Urban Institute, its trustees, or its funders.
Contents
Introduction 1
Data 2
Transition Matrix Results 4
Effect of Self-Employment and Family-Business Ownership on Income Mobility 6
Rank 6
Upward and Downward Mobility 7
Mobility from the Bottom of the Distribution 9
Mobility of Two Deciles or More 9
Instrumental Variables Specification 11
Intergenerational Comparisons 14
Conclusions 16
References 18

Introduction
The American Dream has often included the idea of getting ahead by founding a successful small
business. Upward mobility driven by entrepreneurship is a notion invoked by policymakers at
the highest levels, most recently by President Obama who declared November 2013 National
Entrepreneurship Month. Hundreds of government, nongovernmental, and foundation
programs throughout the United States promote self-employment and small business ownership
as a path out of unemployment or welfare rolls. While many Americans choose self-employment
or start their own business in search of fortune, others are motivated by a desire for ownership,
or independence, a better quality of life, or a more accommodating schedule. The choice to
become self-employed or start a family business may have long-term consequences, but there is
little evidence on the impacts of entrepreneurship on economic mobility.
The entrepreneurial risk-reward trade-off is well-known. Entrepreneurs can garner a higher
average level of income but face a risk of business failure and ongoing uncertainty in family
income associated with more volatile business income. Higher incomes and greater risk can
both lead to greater economic mobility on average. But do higher-than-average incomes actually
lead entrepreneurs to experience greater economic advancement relative to paid workers?
Previous studies that examine the effects of entrepreneurship and self-employment on
income mobility find mixed results (Brown 2013). Using Panel Study of Income Dynamics
(PSID) data from 1969 to 1990, Holtz-Eakin, Rosen, and Weathers (2000) characterize the
income mobility of self-employed individuals over one-, two-, and five-year intervals. Their
analysis shows a greater likelihood of new entrepreneurs to move both up and down the income
distribution, relative to working individuals. Using data from the National Longitudinal Survey
of Youth, Fairlie (2004) finds that young, less-educated self-employed individuals experience
faster earnings growth in comparison to wage and salary workers. A subsequent paper reports
mixed results by gender (Fairlie 2005).
We test the notion that entrepreneurship is a path to economic advancement in the United
States by comparing the income mobility of self-employed and family-business owning
entrepreneurs to the income mobility of wage and salary workers, using data from the PSID
covering 1968–2007. In some models, we address selection into entrepreneurship using
variation in the progressivity of state tax schedules to adjust for differential incentives for
entrepreneurship.
2 URBAN INSTITUTE
One might suppose that people who become entrepreneurs are “positively selected,”
meaning they have a drive and talent that would have led them to succeed had they not started a
business. In that case, any observed advantage of entrepreneurs over wage-and-salary workers
would overstate the true impact of entrepreneurship on outcomes. However, people who
become entrepreneurs might be “negatively selected,” deciding to work for themselves only after
discovering that their job prospects are more dismal than they had hoped. In this case their
traits would have led them to fail had they not started a business. We find suggestive evidence of
negative selection in examining both upward and downward mobility, using instrumental
variables to address selection into entrepreneurship, meaning that those induced to work in
family businesses would have had worse outcomes as wage-and-salary workers.
Family-business ownership is associated with faster upward mobility than observed in paid
work once selection is addressed. In contrast to the regressions assuming exogeneity of business
ownership, using state tax progressivity as an excluded instrument yields a positive and
significant instrumental variables coefficient on family-business ownership, where the outcome
is upward income mobility from 1980 to 1999. In separate tests of downward mobility, the
instrumental variables coefficient is negative and significant, indicating that family-business
ownership improved mobility prospects in both directions, after adjusting for selection.
Taken together, the instrumental variables regressions suggest that family-business
ownership led to a higher level of economic advancement relative to working for someone else in
the 1980s and 1990s. Owning or having a management stake in a small business had an
unambiguously positive effect on upward income mobility during the 1980s and 1990s after
controlling for resources in the 1970s.
In contrast, we find no evidence that self-employment provides any particular advantage in
improving upward mobility or in protecting against downward mobility for the worker, but may
improve outcomes for the worker's children. Analysis of intergenerational mobility suggests the
children of self-employed fathers experience more upward income mobility, relative to the
children of wage-and-salary workers. This effect is more pronounced among self-employed
fathers with lower initial income, so self-employment may play an equalizing role. Long-run
intergenerational differentials are small, and the evidence merely suggestive, however.
Data
The data for this study come from the 1968 through 2009 interview years of the PSID,
corresponding to 1967 through 2008 calendar years. The sample contains about 6,600
SELF-EMPLOYMENT, FAMILY-BUSINESS OWNERSHIP, AND ECONOMIC MOBILITY 3
respondents in each year in the 1968–2009 period, for a total of 237,163 observation-years. The
number of observations ranged from 5,225 in 1997 to 7,494 in 1994. The sample was 53 percent
female, and 16 percent of respondents were nonwhite (all reported statistics and estimates are
weighted using the PSID core individual weight).
Self-employment and family-business ownership are annual indicators of entrepreneurial
status derived from PSID survey questions. The question determining self-employment status:
“(Are/Were) you (HEAD) self-employed, (are/were) you employed by someone else, or what?”
captures individuals who report being self-employed exclusively and those who report both
working for someone else and being self-employed. However, individuals who report they do not
currently work for money have been removed from the sample of self-employed individuals—
about 20 percent of those responding.
The question determining family-business ownership is generated from the question: “Did
you (or anyone else in the family there) own a business at any time in (year X) or have a
financial interest in any business enterprise?” This could include a side business owned by a
wage-and-salary worker. In contrast, self-employed business owners are defined by their main
job activity rather than by the activities of others in the household.
The percentage of individuals reporting self-employment or family-business ownership
varies from year to year. On average, about 14 percent of the sample respondents reported self-
employment; the lowest estimated fraction was 12.5 percent in 1999, and the reported peak was
15.5 percent in 1983. On average, 15 percent of individuals reported family-business ownership,
with a low of 10.6 percent in 1968 and a high of 18.3 percent in 1997. Fourteen percent of self-
employed respondents indicated they had not achieved a high school degree, whereas 9 percent
of family-business owners did.
The families of the self-employed and family-business owners are similar along other
observed dimensions such as gender, family composition change, race, age, marital status, and
numbers of children. A substantial percentage of respondents (57 percent) in our sample report
having participated in either self-employment or family-business ownership for as little as one
year at any point during 1968–2009. Those ever entrepreneurs are less likely to be nonwhite
and unmarried, and more likely to be college-educated and to have no children.
4 URBAN INSTITUTE
Transition Matrix Results
One common way of measuring income or status mobility uses a transition matrix. It shows the
proportion of people starting out in one segment of the distribution (for example, the bottom
fifth or the middle third) who wind up in the same segment, a higher segment, or a lower
segment. We estimate a large number of matrices using thirds of the needs-adjusted income
distribution. If movements into self-employment or business operation are correlated with
family change, then adjusting for family structure may conflate changes in income and changes
in need. But the broad pattern of results holds without adjusting for changing family
composition, so we present only results using needs-adjusted income here.
The transition matrix showing income and occupational mobility over 1980 to 1984 is
roughly representative of the full transition matrices for each period. Of course, businesses may
develop over a longer period, but transitions across five years already show very different
mobility out of the bottom third of the distribution among those who transition out of wage-
and-salary work into entrepreneurship. Table 1 was developed using data for family-business
owners. Tables for the self-employed show comparable but not identical transition rates.
Individuals are classified by their position in the 1980 income distribution, and estimates are
presented separately according to their starting period and ending occupations:
Staying worker: Start and end as wage-and-salary worker
Staying entrepreneur: Start and end as entrepreneur
Switching worker: Start as entrepreneur and end as wage-and-salary worker
Switching entrepreneur: Start as wage-and-salary worker and end as entrepreneur
The cell percentages represent the proportion of individuals transitioning between different
levels of the income distribution over the five-year time step. For example, 75 percent of staying
workers remained at the bottom of the income distribution, 22 percent moved from the bottom
to the middle, and 4 percent moved from the bottom to the top.
SELF-EMPLOYMENT, FAMILY-BUSINESS OWNERSHIP, AND ECONOMIC MOBILITY 5
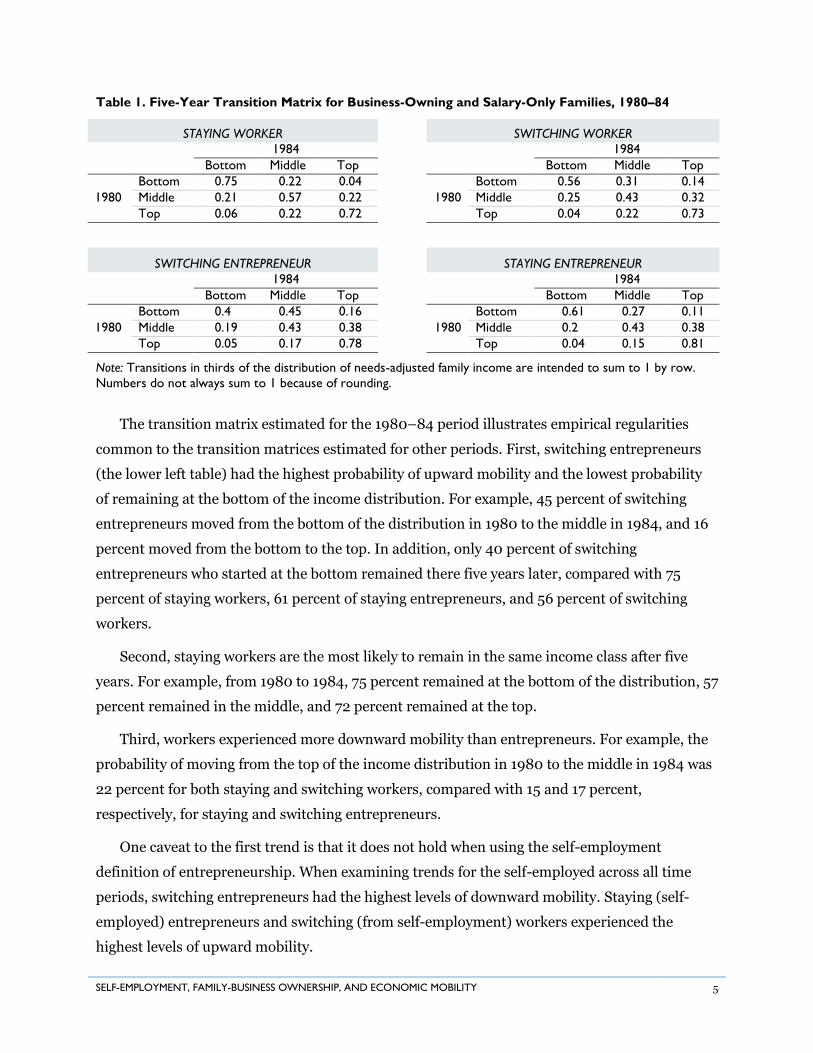
Table 1. Five-Year Transition Matrix for Business-Owning and Salary-Only Families, 1980–84
STAYING WORKER
SWITCHING WORKER
1984
1984
Bottom Middle Top Bottom Middle Top
1980
Bottom 0.75 0.22 0.04
1980
Bottom 0.56 0.31 0.14
Middle 0.21 0.57 0.22 Middle 0.25 0.43 0.32
Top 0.06 0.22 0.72 Top 0.04 0.22 0.73
SWITCHING ENTREPRENEUR STAYING ENTREPRENEUR
1984
1984
Bottom Middle Top Bottom Middle Top
1980
Bottom 0.4 0.45 0.16
1980
Bottom 0.61 0.27 0.11
Middle 0.19 0.43 0.38 Middle 0.2 0.43 0.38
Top 0.05 0.17 0.78 Top 0.04 0.15 0.81
Note: Transitions in thirds of the distribution of needs-adjusted family income are intended to sum to 1 by row.
Numbers do not always sum to 1 because of rounding.
The transition matrix estimated for the 1980–84 period illustrates empirical regularities
common to the transition matrices estimated for other periods. First, switching entrepreneurs
(the lower left table) had the highest probability of upward mobility and the lowest probability
of remaining at the bottom of the income distribution. For example, 45 percent of switching
entrepreneurs moved from the bottom of the distribution in 1980 to the middle in 1984, and 16
percent moved from the bottom to the top. In addition, only 40 percent of switching
entrepreneurs who started at the bottom remained there five years later, compared with 75
percent of staying workers, 61 percent of staying entrepreneurs, and 56 percent of switching
workers.
Second, staying workers are the most likely to remain in the same income class after five
years. For example, from 1980 to 1984, 75 percent remained at the bottom of the distribution, 57
percent remained in the middle, and 72 percent remained at the top.
Third, workers experienced more downward mobility than entrepreneurs. For example, the
probability of moving from the top of the income distribution in 1980 to the middle in 1984 was
22 percent for both staying and switching workers, compared with 15 and 17 percent,
respectively, for staying and switching entrepreneurs.
One caveat to the first trend is that it does not hold when using the self-employment
definition of entrepreneurship. When examining trends for the self-employed across all time
periods, switching entrepreneurs had the highest levels of downward mobility. Staying (self-
employed) entrepreneurs and switching (from self-employment) workers experienced the
highest levels of upward mobility.
6 URBAN INSTITUTE
In short, simple trends with few controls suggest that the self-employed experience no
greater chance of upward mobility than their working counterparts, in sharp contrast to those
operating family businesses. In addition, those switching from work to self-employment
experienced some of the highest levels of downward mobility over the five years.
Effect of Self-Employment and Family-Business Ownership on
Income Mobility
We next separately estimate the effects of self-employment and family-business ownership on
various outcome measures of income mobility using nonlinear panel data regression. The key
outcome measures are family rank in the income distribution and relative mobility indicators for
the movement across tenths of the family income distribution. Each outcome is regressed on a
vector of individual controls including self-employment, family business, and worker status
using a generalized linear model with a logit link.
The primary relationship of interest pertains to the two measures of entrepreneurship
entrepTit where T indicates the type of entrepreneurship: either self-employment or family-
business ownership. The vector of individual characteristics Xit includes a constant, the
individual's initial income-to-needs rank or category, gender, age, squared-age, mean lagged
family income (averaged over three years and lagged 10 years), the individual's highest level of
educational attainment, household head's marital status, household head’s race, and an
indicator of whether the family's composition has changed over the prior year.
Rank
The outcome rankit indexes the individual's relative position in the annual distribution of
family incomes, scaled to the unit interval (0,1); i indexes individuals and t indexes years. The
primary coefficients in table 2 report the mean difference in the relative position of self-
employed and family-business owners versus wage-and-salary workers in the income
distribution over the measurement period. The coefficients on each regressor reflect its marginal
impact on individual rank in the income distribution (as measured in deciles) over the estimated
period.
On average, self-employed individuals were positioned 19.8 percentage points lower in the
income distribution in relation to workers with similar starting incomes during 1980–2007. The
trend is also negative, and significant income differences persisted in each of the observed ten-
SELF-EMPLOYMENT, FAMILY-BUSINESS OWNERSHIP, AND ECONOMIC MOBILITY 7
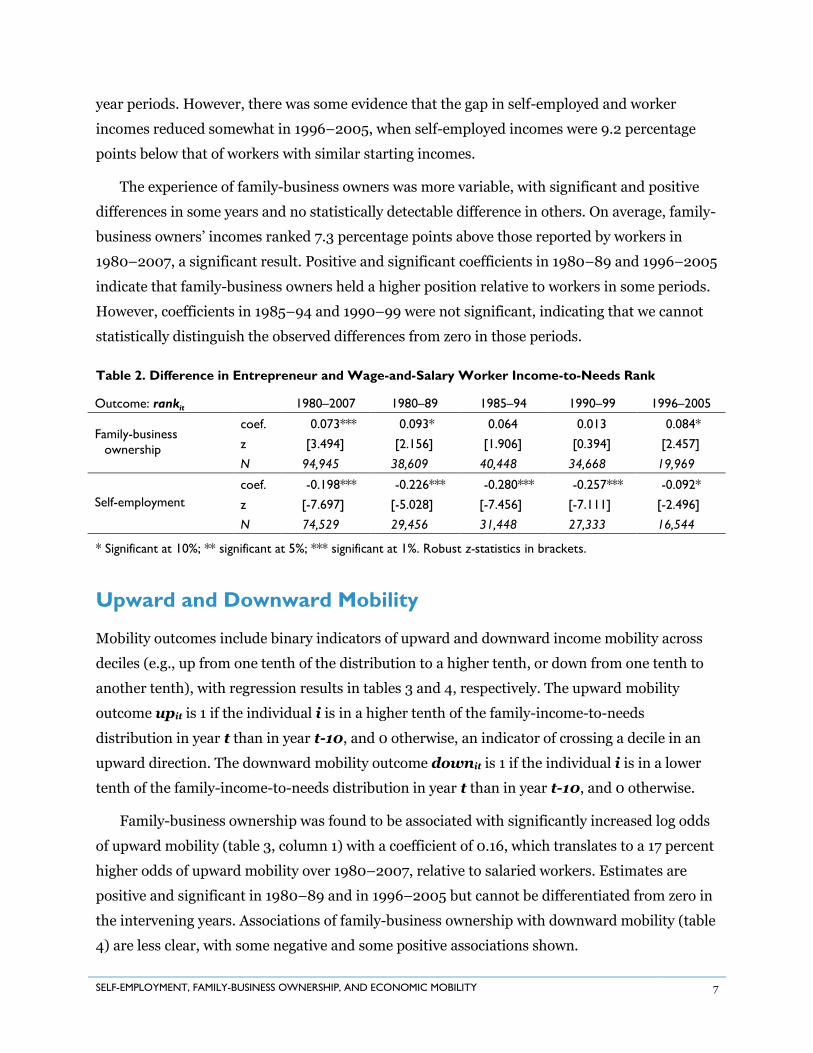
year periods. However, there was some evidence that the gap in self-employed and worker
incomes reduced somewhat in 1996–2005, when self-employed incomes were 9.2 percentage
points below that of workers with similar starting incomes.
The experience of family-business owners was more variable, with significant and positive
differences in some years and no statistically detectable difference in others. On average, family-
business owners’ incomes ranked 7.3 percentage points above those reported by workers in
1980–2007, a significant result. Positive and significant coefficients in 1980–89 and 1996–2005
indicate that family-business owners held a higher position relative to workers in some periods.
However, coefficients in 1985–94 and 1990–99 were not significant, indicating that we cannot
statistically distinguish the observed differences from zero in those periods.
Table 2. Difference in Entrepreneur and Wage-and-Salary Worker Income-to-Needs Rank
Outcome: rankit 1980–2007 1980–89 1985–94 1990–99 1996–2005
Family-business
ownership
coef. 0.073*** 0.093* 0.064 0.013 0.084*
z [3.494] [2.156] [1.906] [0.394] [2.457]
N 94,945 38,609 40,448 34,668 19,969
Self-employment
coef. -0.198*** -0.226*** -0.280*** -0.257*** -0.092*
z [-7.697] [-5.028] [-7.456] [-7.111] [-2.496]
N 74,529 29,456 31,448 27,333 16,544
* Significant at 10%; ** significant at 5%; *** significant at 1%. Robust z-statistics in brackets.
Upward and Downward Mobility
Mobility outcomes include binary indicators of upward and downward income mobility across
deciles (e.g., up from one tenth of the distribution to a higher tenth, or down from one tenth to
another tenth), with regression results in tables 3 and 4, respectively. The upward mobility
outcome upit is 1 if the individual i is in a higher tenth of the family-income-to-needs
distribution in year t than in year t-10, and 0 otherwise, an indicator of crossing a decile in an
upward direction. The downward mobility outcome downit is 1 if the individual i is in a lower
tenth of the family-income-to-needs distribution in year t than in year t-10, and 0 otherwise.
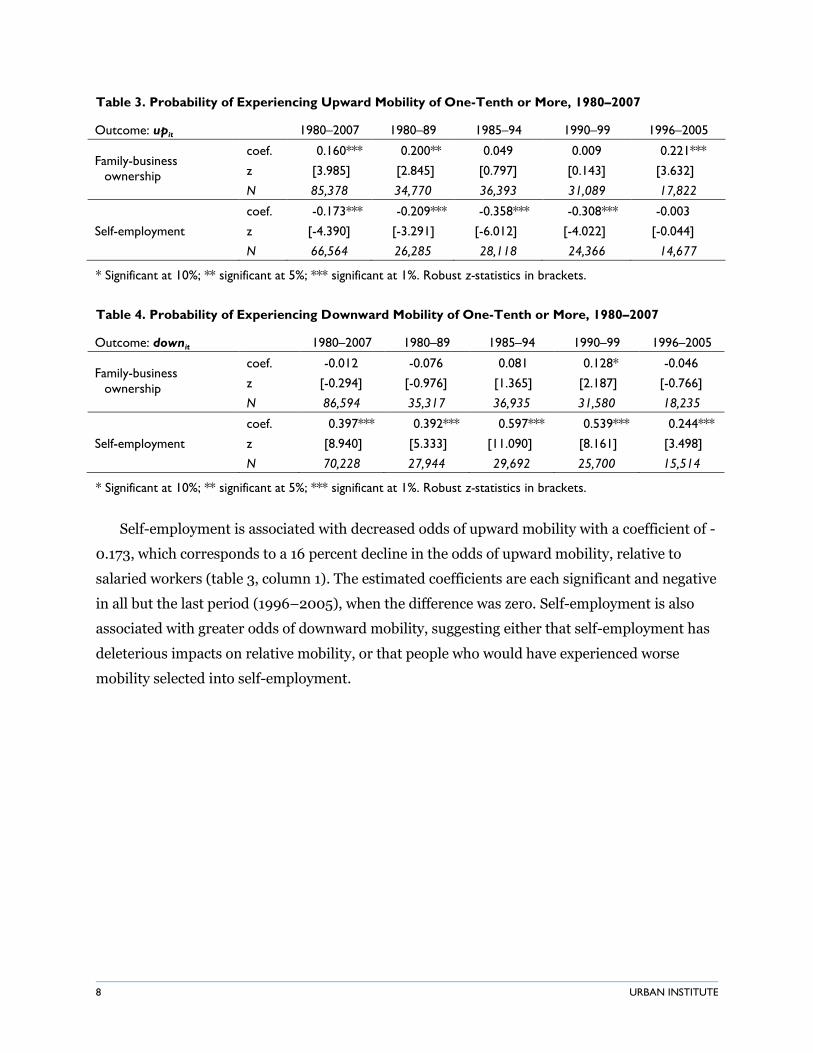
Family-business ownership was found to be associated with significantly increased log odds
of upward mobility (table 3, column 1) with a coefficient of 0.16, which translates to a 17 percent
higher odds of upward mobility over 1980–2007, relative to salaried workers. Estimates are
positive and significant in 1980–89 and in 1996–2005 but cannot be differentiated from zero in
the intervening years. Associations of family-business ownership with downward mobility (table
4) are less clear, with some negative and some positive associations shown.
8 URBAN INSTITUTE
Table 3. Probability of Experiencing Upward Mobility of One-Tenth or More, 1980–2007
Outcome: upit 1980–2007 1980–89 1985–94 1990–99 1996–2005
Family-business
ownership
coef. 0.160*** 0.200** 0.049 0.009 0.221***
z [3.985] [2.845] [0.797] [0.143] [3.632]
N 85,378 34,770 36,393 31,089 17,822
coef. -0.173*** -0.209*** -0.358*** -0.308*** -0.003
Self-employment z [-4.390] [-3.291] [-6.012] [-4.022] [-0.044]
N 66,564 26,285 28,118 24,366 14,677
* Significant at 10%; ** significant at 5%; *** significant at 1%. Robust z-statistics in brackets.
Table 4. Probability of Experiencing Downward Mobility of One-Tenth or More, 1980–2007
Outcome: downit 1980–2007 1980–89 1985–94 1990–99 1996–2005
Family-business
ownership
coef. -0.012 -0.076 0.081 0.128* -0.046
z [-0.294] [-0.976] [1.365] [2.187] [-0.766]
N 86,594 35,317 36,935 31,580 18,235
coef. 0.397*** 0.392*** 0.597*** 0.539*** 0.244***
Self-employment z [8.940] [5.333] [11.090] [8.161] [3.498]
N 70,228 27,944 29,692 25,700 15,514
* Significant at 10%; ** significant at 5%; *** significant at 1%. Robust z-statistics in brackets.
Self-employment is associated with decreased odds of upward mobility with a coefficient of -
0.173, which corresponds to a 16 percent decline in the odds of upward mobility, relative to
salaried workers (table 3, column 1). The estimated coefficients are each significant and negative
in all but the last period (1996–2005), when the difference was zero. Self-employment is also
associated with greater odds of downward mobility, suggesting either that self-employment has
deleterious impacts on relative mobility, or that people who would have experienced worse
mobility selected into self-employment.
SELF-EMPLOYMENT, FAMILY-BUSINESS OWNERSHIP, AND ECONOMIC MOBILITY 9
Mobility from the Bottom of the Distribution
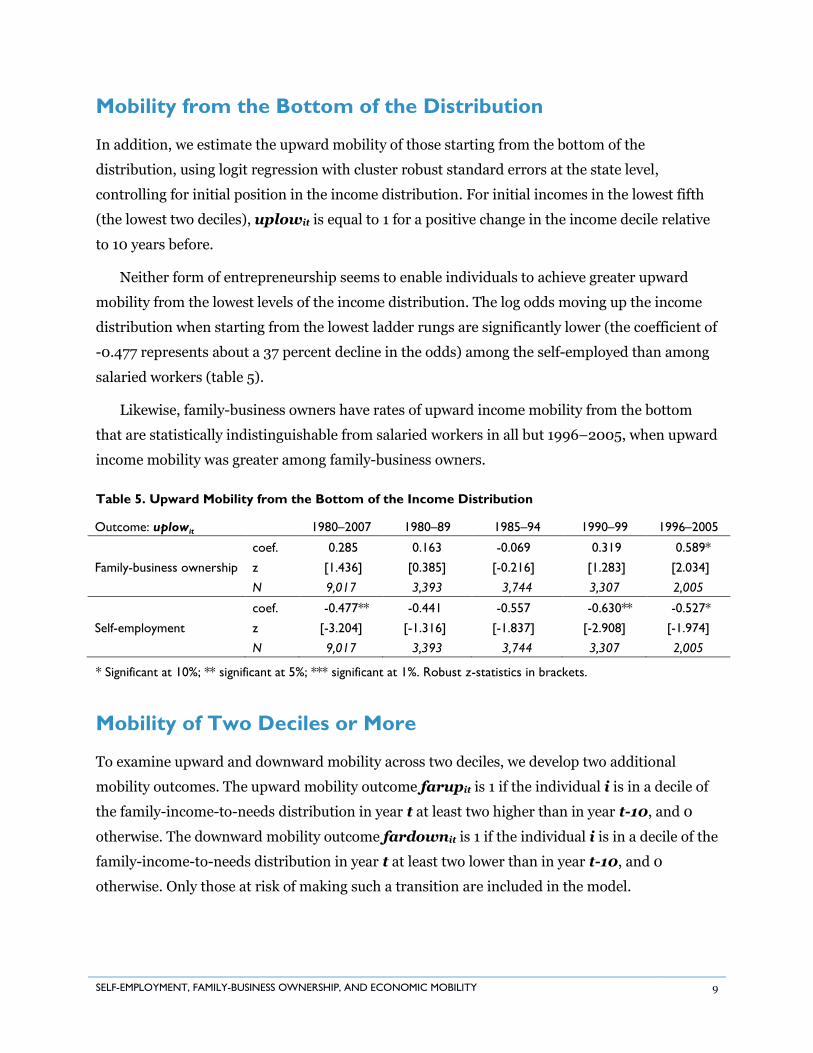
In addition, we estimate the upward mobility of those starting from the bottom of the
distribution, using logit regression with cluster robust standard errors at the state level,
controlling for initial position in the income distribution. For initial incomes in the lowest fifth
(the lowest two deciles), uplowit is equal to 1 for a positive change in the income decile relative
to 10 years before.
Neither form of entrepreneurship seems to enable individuals to achieve greater upward
mobility from the lowest levels of the income distribution. The log odds moving up the income
distribution when starting from the lowest ladder rungs are significantly lower (the coefficient of
-0.477 represents about a 37 percent decline in the odds) among the self-employed than among
salaried workers (table 5).
Likewise, family-business owners have rates of upward income mobility from the bottom
that are statistically indistinguishable from salaried workers in all but 1996–2005, when upward
income mobility was greater among family-business owners.
Table 5. Upward Mobility from the Bottom of the Income Distribution
Outcome: uplowit 1980–2007 1980–89 1985–94 1990–99 1996–2005
coef. 0.285 0.163 -0.069 0.319 0.589*
Family-business ownership z [1.436] [0.385] [-0.216] [1.283] [2.034]
N 9,017 3,393 3,744 3,307 2,005
coef. -0.477** -0.441 -0.557 -0.630** -0.527*
Self-employment z [-3.204] [-1.316] [-1.837] [-2.908] [-1.974]
N 9,017 3,393 3,744 3,307 2,005
* Significant at 10%; ** significant at 5%; *** significant at 1%. Robust z-statistics in brackets.
Mobility of Two Deciles or More
To examine upward and downward mobility across two deciles, we develop two additional
mobility outcomes. The upward mobility outcome farupit is 1 if the individual i is in a decile of
the family-income-to-needs distribution in year t at least two higher than in year t-10, and 0
otherwise. The downward mobility outcome fardownit is 1 if the individual i is in a decile of the
family-income-to-needs distribution in year t at least two lower than in year t-10, and 0
otherwise. Only those at risk of making such a transition are included in the model.
10 URBAN INSTITUTE
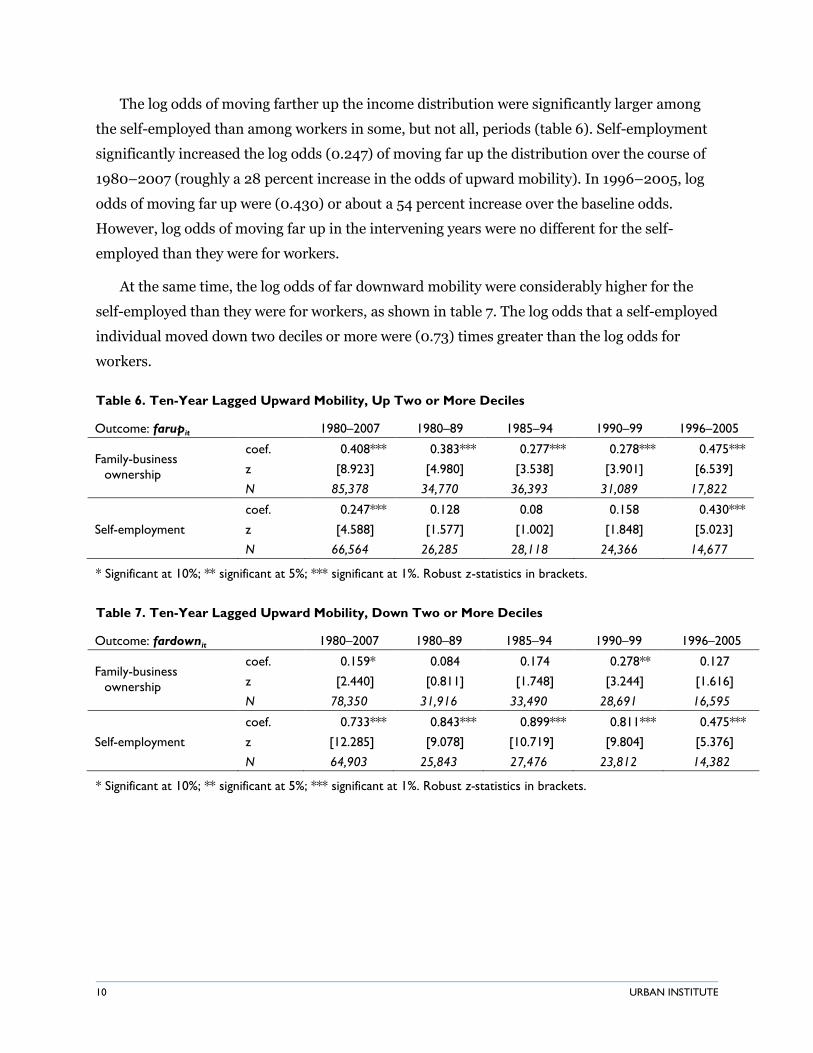
The log odds of moving farther up the income distribution were significantly larger among
the self-employed than among workers in some, but not all, periods (table 6). Self-employment
significantly increased the log odds (0.247) of moving far up the distribution over the course of
1980–2007 (roughly a 28 percent increase in the odds of upward mobility). In 1996–2005, log
odds of moving far up were (0.430) or about a 54 percent increase over the baseline odds.
However, log odds of moving far up in the intervening years were no different for the self-
employed than they were for workers.
At the same time, the log odds of far downward mobility were considerably higher for the
self-employed than they were for workers, as shown in table 7. The log odds that a self-employed
individual moved down two deciles or more were (0.73) times greater than the log odds for
workers.
Table 6. Ten-Year Lagged Upward Mobility, Up Two or More Deciles
Outcome: farupit 1980–2007 1980–89 1985–94 1990–99 1996–2005
Family-business
ownership
coef. 0.408*** 0.383*** 0.277*** 0.278*** 0.475***
z [8.923] [4.980] [3.538] [3.901] [6.539]
N 85,378 34,770 36,393 31,089 17,822
coef. 0.247*** 0.128 0.08 0.158 0.430***
Self-employment z [4.588] [1.577] [1.002] [1.848] [5.023]
N 66,564 26,285 28,118 24,366 14,677
* Significant at 10%; ** significant at 5%; *** significant at 1%. Robust z-statistics in brackets.
Table 7. Ten-Year Lagged Upward Mobility, Down Two or More Deciles
Outcome: fardownit 1980–2007 1980–89 1985–94 1990–99 1996–2005
Family-business
ownership
coef. 0.159* 0.084 0.174 0.278** 0.127
z [2.440] [0.811] [1.748] [3.244] [1.616]
N 78,350 31,916 33,490 28,691 16,595
coef. 0.733*** 0.843*** 0.899*** 0.811*** 0.475***
Self-employment z [12.285] [9.078] [10.719] [9.804] [5.376]
N 64,903 25,843 27,476 23,812 14,382
* Significant at 10%; ** significant at 5%; *** significant at 1%. Robust z-statistics in brackets.
SELF-EMPLOYMENT, FAMILY-BUSINESS OWNERSHIP, AND ECONOMIC MOBILITY 11
Instrumental Variables Specification
As Domar and Musgrave (1944) famously pointed out, higher tax rates may discourage
economic activity more broadly, but they also increase the government’s participation in risky
ventures, and therefore encourage more risk-taking, indicating that higher tax rates may
encourage entrepreneurship relative to wage and salary jobs. More progressive taxes, however,
tend to discourage risk-taking. We use the progressivity of the state tax schedule as an excluded
instrument to adjust for differential selection into entrepreneurship, while adjusting both
selection and outcomes using average tax rates.
A progressive tax schedule implies lower expected returns for riskier ventures, discouraging
entry (Gentry and Hubbard 2005). Businesses, however, can more easily shift income from
labor to capital income tax schedules, and when capital income is taxed more favorably, there is
greater incentive to be an entrepreneur, in various forms. Entrepreneurship is also encouraged
by the option to incorporate (Cullen and Gordon 2007; Gordon and Slemrod 2000), essentially
choosing to shift income between personal and corporate tax schedules. Entrepreneurs may also
reinvest retained earnings in expensible investments and defer or avoid taxes, perhaps
employing international tax avoidance strategies.
We take state marginal tax rates on earnings at average real wages in 2000, and the
difference between state marginal tax rates on labor and capital income of that amount, as two
indicators of the policies affecting entrepreneurship, namely tax rates and the gap between labor
and capital income taxes. We take measures of progressivity due to Kakwani (1976) and Domar
and Musgrave (1944) based on state taxes applied to the 1996 distribution of family-size-
adjusted income as measured in the 1997 March Current Population Survey, inflated using the
consumer price index to reflect changes over time due to inflation only. This approach holds
income and population shifts constant over time, allowing us to look only at shifts in state tax
policy (noting that measures of progressivity are sensitive to the distribution of pretax income).
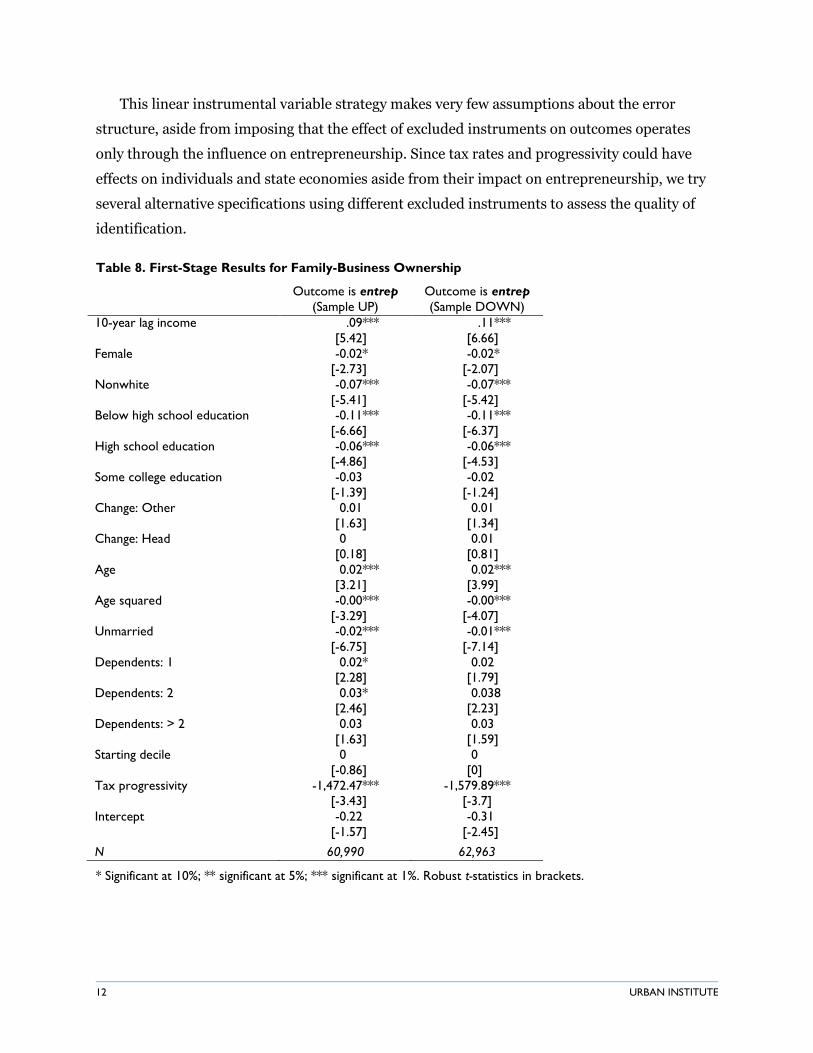
The estimated effects of excluded instruments on participation in family-business ownership
are shown in table 8 for two samples used in regression in table 9. Income tax policies may also
have general equilibrium effects that result in violations of the exclusion restrictions justifying
instrumental variables, if the progressivity of taxes affects not only differential selection into
entrepreneurship but outcomes as well. Our results pass overidentification tests indicating
exclusion restrictions are satisfied, but instrument strength may not be great enough in many
cases for such tests to have good power to reject the null. As a result of these limitations,
instrumental variable results should be interpreted with some caution.
12 URBAN INSTITUTE
This linear instrumental variable strategy makes very few assumptions about the error
structure, aside from imposing that the effect of excluded instruments on outcomes operates
only through the influence on entrepreneurship. Since tax rates and progressivity could have
effects on individuals and state economies aside from their impact on entrepreneurship, we try
several alternative specifications using different excluded instruments to assess the quality of
identification.
Table 8. First-Stage Results for Family-Business Ownership
Outcome is entrep
(Sample UP)
Outcome is entrep
(Sample DOWN)
10-year lag income .09***
[5.42]
.11***
[6.66]
Female -0.02*
[-2.73]
-0.02*
[-2.07]
Nonwhite -0.07***
[-5.41]
-0.07***
[-5.42]
Below high school education -0.11***
[-6.66]
-0.11***
[-6.37]
High school education -0.06***
[-4.86]
-0.06***
[-4.53]
Some college education -0.03
[-1.39]
-0.02
[-1.24]
Change: Other 0.01
[1.63]
0.01
[1.34]
Change: Head 0
[0.18]
0.01
[0.81]
Age 0.02***
[3.21]
0.02***
[3.99]
Age squared -0.00***
[-3.29]
-0.00***
[-4.07]
Unmarried -0.02***
[-6.75]
-0.01***
[-7.14]
Dependents: 1 0.02*
[2.28]
0.02
[1.79]
Dependents: 2 0.03*
[2.46]
0.038
[2.23]
Dependents: > 2 0.03
[1.63]
0.03
[1.59]
Starting decile 0
[-0.86]
0
[0]
Tax progressivity -1,472.47***
[-3.43]
-1,579.89***
[-3.7]
Intercept -0.22
[-1.57]
-0.31
[-2.45]
N 60,990 62,963
* Significant at 10%; ** significant at 5%; *** significant at 1%. Robust t-statistics in brackets.
SELF-EMPLOYMENT, FAMILY-BUSINESS OWNERSHIP, AND ECONOMIC MOBILITY 13
Table 9. Linear Regression (LR) and Instrumental Variables (IV) Results
Outcome: Upward Mobility
across Deciles
Outcome: Downward Mobility
across Deciles
LR IV LR IV
Family-business ownership 0.02
[1.92]
1.26**
[2.96]
0.01
[0.42]
-0.90**
[-2.63]
10-year lag income -0.21
[-11.25]
-0.33***
[-6.19]
0.15
[8.40]
0.25***
[5.62]
Female -0.01
[-1.42]
0.01
[0.97]
0.014*
[2.345]
0
[0.13]
Nonwhite -0.05*
[-2.56]
0.03
[1.01]
0.03
[1.24]
-0.03
[-1.18]
Below high school education -0.20***
[-12.31]
-0.05
[-0.80]
0.18***
[11.14]
0.08
[1.6]
High school education -0.13***
[-9.66]
-0.05
[-1.39]
0.12***
[9.20]
0.06*
[2.34]
Some college education -0.07***
[-5.40]
-0.04
[-1.32]
0.07***
[5.53]
0.05*
[2.4]
Change: Other 0.08***
[9.16]
0.08***
[6.12]
-0.06***
[-7.45]
-0.06***
[-5.59]
Change: Head 0.02
[1.89]
0.02
[1.04]
0.01
[0.23]
0.01
[0.46]
Age 0.10***
[22.63]
0.08***
[7.71]
-0.11***
[-22.04]
-0.09***
[-8.78]
Age squared -0.00***
[-23.42]
-0.00***
[-7.79]
0.00***
[22.70]
0.00***
[8.81]
Unmarried -0.04***
[-16.25]
-0.02*
[-1.97]
0.04***
[19.91]
0.02***
[3.42]
Dependents: 1 -0.03**
[-2.79]
-0.06***
[-3.57]
0.03**
[3.01]
0.05***
[3.44]
Dependents: 2 -0.16***
[-11.59]
-0.19***
[-9.05]
0.15***
[11.14]
0.18***
[8.4]
Dependents: > 2 -0.24***
[-15.17]
-0.27***
[-10.85]
0.22***
[15.59]
0.24***
[12.24]
Starting decile 0
[0.50]
0
[-0.82]
0
[0.34]
0
[0.27]
Intercept -1.44***
[-14.03]
-1.26***
[-6.04]
2.49***
[22.37]
2.28***
[12.07]
N 65,859 60,990 66,897 62,963
* Significant at 10%; ** significant at 5%; *** significant at 1%. Robust t-statistics in brackets.
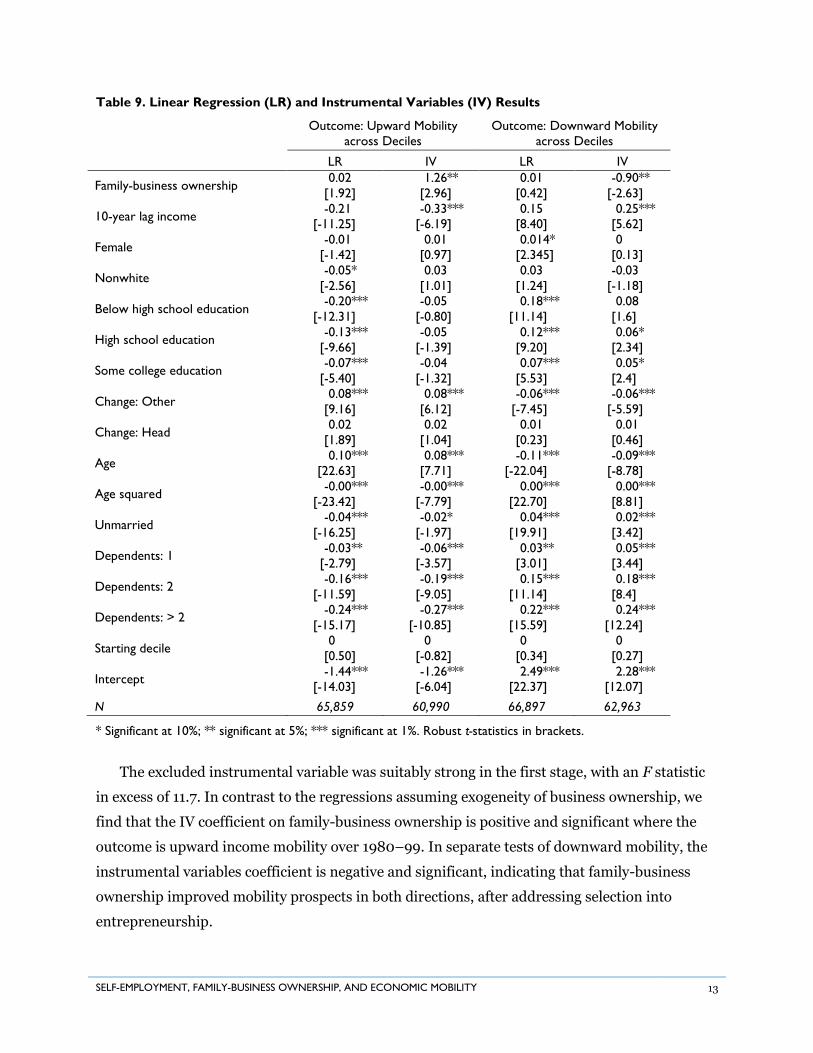
The excluded instrumental variable was suitably strong in the first stage, with an F statistic
in excess of 11.7. In contrast to the regressions assuming exogeneity of business ownership, we
find that the IV coefficient on family-business ownership is positive and significant where the
outcome is upward income mobility over 1980–99. In separate tests of downward mobility, the
instrumental variables coefficient is negative and significant, indicating that family-business
ownership improved mobility prospects in both directions, after addressing selection into
entrepreneurship.
14 URBAN INSTITUTE
Taken together, the instrumental variables regressions (table 9) suggest that owning or
having a management stake in a small business had a positive effect on incremental upward
income mobility during the 1980s and 1990s after controlling for resources in the 1970s. This
result implies family-business ownership led to a higher level of economic advancement relative
to wage-and-salary work in the 1980s and 1990s.
The IV results are consistent with the story that ordinary linear regression suffers from
selection bias, where some workers who select into running a family business (and out of wage-
and-salary work) would have had much worse outcomes in wage-and-salary work had they not
had the option of running a family business. This kind of “negative selection” on unobservable
potential upward mobility means that the observed mobility rates turn out to be similar for both
groups, but the causal impact of running a family business is increased upward mobility and
decreased downward mobility.
The causal impact, in the case of heterogeneous impacts of running a family business, is a
“local average treatment effect,” capturing the mean gain in mobility among those who were
induced to become entrepreneurs by a shift in the excluded instrument—that is, by a decrease in
the progressivity of the state tax schedule. There are various plausible objections to the
exclusion restriction, but either the negative selection story or measurement error implies
ordinary linear regression estimates are biased toward zero (equivalent mobility outcomes for
entrepreneurs and wage-and-salary workers), and it is possible that IV solves both problems.
Intergenerational Comparisons
When thinking about family income, we care about not only economic mobility over a decade or
even several decades, but also the prospects faced by a worker and entrepreneur’s children. That
is, we want to compare economic mobility across generations to see if the choice to become an
entrepreneur affects economic prospects of children as well. We compare intergenerational
income mobility using regressions estimating the percentage gain in a child’s needs-adjusted
income for a given gain in a parent’s needs-adjusted income or “intergenerational elasticity” of
income. That is, we regress children’s log average family needs-adjusted income on parents’ log
average family needs-adjusted income, for both working and entrepreneurial parents. We take a
rolling average of income over a five-year period. The means of parent and child incomes are
computed during the same age range, when each was between 25 and 40 years old.
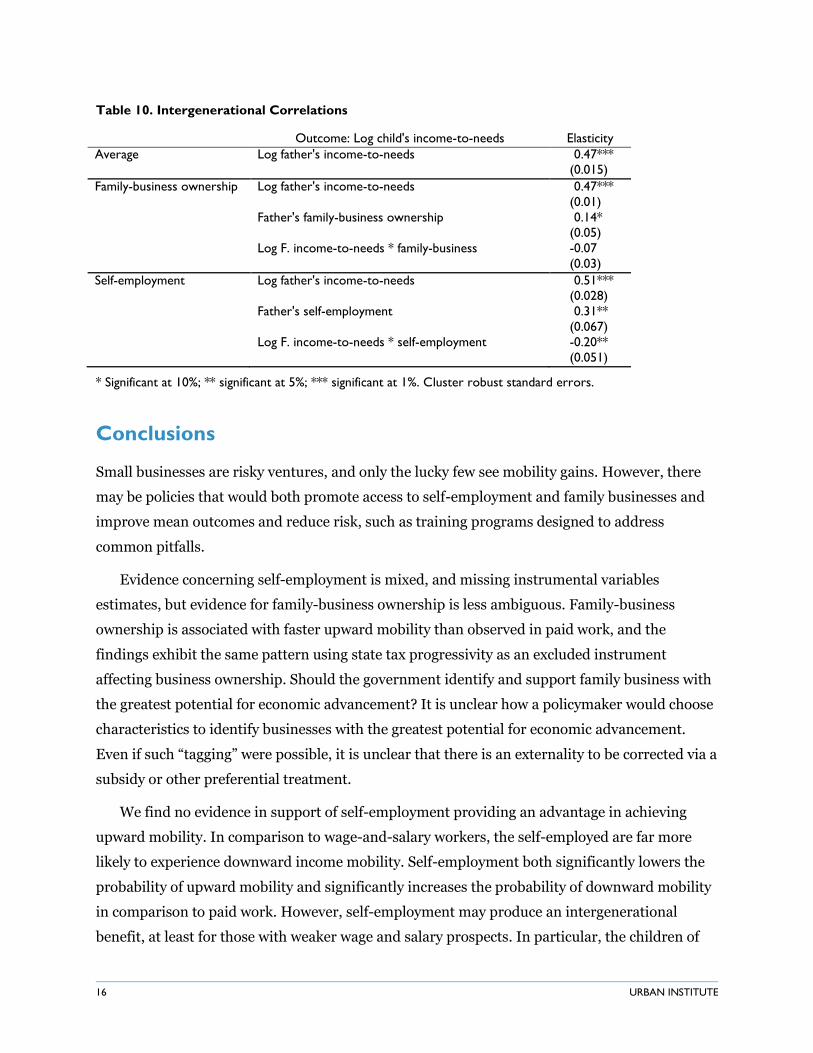
We estimate that the intergenerational elasticity of father and child's income is 0.47 in the
absence of covariates. Controlling for father's self-employment gives 0.51 as the
SELF-EMPLOYMENT, FAMILY-BUSINESS OWNERSHIP, AND ECONOMIC MOBILITY 15
intergenerational elasticity of wage-and-salary worker father and child's income, indicating that
the children of self-employed fathers have incomes less highly correlated with that of their
fathers, relative to the children of wage and salary workers. In addition, we interact father's
income and self-employment to estimate how they work in concert. The coefficient on the
interaction term is negative and significant at the 1 percent level.
This evidence is suggestive that the children of lower-income self-employed fathers
experience greater levels of upward mobility than the children of wage-and-salary workers with
comparable incomes, up to a crossing point at about 4.7 times the poverty level (the ratio of 0.31
to 0.2, exponentiated). The children of richer self-employed dads, above 4.7 times the poverty
level, seem to experience lower levels of upward mobility than children of wage-and-salary
workers with comparable incomes. Thus, self-employment may play an equalizing role over a
generation.
However, the role of self-employment in equalizing outcomes over generations may be
largely the effect of increased variance in earnings. Because of bankruptcy protections, lower-
income entrepreneurs face less intrinsic risk from new business ventures, all else equal; they
have smaller stores of resources to invest in a new venture. For this and other reasons, greater
variance in business incomes will have relatively larger effects on the incomes of the poor
relative to the rich and will therefore be more meaningful to their long-run mobility.
The evidence on family-business ownership is different. The intergenerational coefficient
remains at .47 after controlling for father's family-business ownership. Although the interaction
term is negative, its effect size is much smaller. As with self-employment, the children of more
resource-constrained family-business owners did better than those whose business-owning
fathers had higher incomes, but the coefficient on this interaction term was not significant.
16 URBAN INSTITUTE
Table 10. Intergenerational Correlations
Outcome: Log child's income-to-needs Elasticity
Average Log father's income-to-needs 0.47***
(0.015)
Family-business ownership Log father's income-to-needs 0.47***
(0.01)
Father's family-business ownership 0.14*
(0.05)
Log F. income-to-needs * family-business -0.07
(0.03)
Self-employment Log father's income-to-needs 0.51***
(0.028)
Father's self-employment 0.31**
(0.067)
Log F. income-to-needs * self-employment -0.20**
(0.051)
* Significant at 10%; ** significant at 5%; *** significant at 1%. Cluster robust standard errors.
Conclusions
Small businesses are risky ventures, and only the lucky few see mobility gains. However, there
may be policies that would both promote access to self-employment and family businesses and
improve mean outcomes and reduce risk, such as training programs designed to address
common pitfalls.
Evidence concerning self-employment is mixed, and missing instrumental variables
estimates, but evidence for family-business ownership is less ambiguous. Family-business
ownership is associated with faster upward mobility than observed in paid work, and the
findings exhibit the same pattern using state tax progressivity as an excluded instrument
affecting business ownership. Should the government identify and support family business with
the greatest potential for economic advancement? It is unclear how a policymaker would choose
characteristics to identify businesses with the greatest potential for economic advancement.
Even if such “tagging” were possible, it is unclear that there is an externality to be corrected via a
subsidy or other preferential treatment.
We find no evidence in support of self-employment providing an advantage in achieving
upward mobility. In comparison to wage-and-salary workers, the self-employed are far more
likely to experience downward income mobility. Self-employment both significantly lowers the
probability of upward mobility and significantly increases the probability of downward mobility
in comparison to paid work. However, self-employment may produce an intergenerational
benefit, at least for those with weaker wage and salary prospects. In particular, the children of
SELF-EMPLOYMENT, FAMILY-BUSINESS OWNERSHIP, AND ECONOMIC MOBILITY 17
more income-constrained self-employed fathers experience relatively greater levels of upward
mobility than the children of wage-and-salary workers, and in relation to the children of richer
self-employed fathers. This finding implies that self-employment may play an equalizing role
over the course of a generation.
Even though the case for increasing self-employment as a means of promoting economic
mobility is weak in our data and the case for family business promoting economic mobility is
strong, there is no clear evidence that any family is better off on average from pursuing either
option, since variability of outcomes are greater as well. Further, while we may suspect that
society as a whole benefits from risky ventures, substantial preferential treatment is already
available to entrepreneurs and small business owners, and it is unclear that further
encouragement is indicated in the absence of clear evidence of still-uncorrected externalities.
Cost-benefit calculations for new policies promoting entrepreneurship or the operation of
small businesses should take into account both changes in mean outcomes for the current
generation and their children and the risks of increased volatility in incomes associated with
entrepreneurship. However, some policies could improve outcomes for those already on track to
become entrepreneurs, especially around improving financial literacy and budgeting, and
understanding the risks of entrepreneurship so that families can make informed decisions in
their own economic interest.
18 URBAN INSTITUTE
References
Brown, Elizabeth D. 2013. “Three Essays on Entrepreneurship in India and the U.S: Policies, Social Ties and Mobility.” Santa Monica, CA: Pardee RAND Graduate School. http://www.rand.org/content/dam/rand/pubs/rgs_dissertations/RGSD200/RGSD297/RAND_RGSD297.pdf.
Cullen, Julie Berry, and Roger H. Gordon. 2007. “Taxes and Entrepreneurial Risk-Taking: Theory and Evidence for the US.” Journal of Public Economics 91 (7/8): 1479–1505.
Domar, Evsey D., and Richard A. Musgrave. 1944. “Proportional Income Taxation and Risk-Taking.” Quarterly Journal of Economics 58 (3): 388–422.
Fairlie, Robert W. 2004. “Earnings Growth among Young Less-Educated Business Owners.” Industrial Relations 43: 634–59.
———. 2005. “Entrepreneurship and Earnings among Young Adults from Disadvantaged Families.” Small Business Economics 25: 223–36.
Gentry, William M., and R. Glenn Hubbard. 2005. “ ‘Success Taxes,’ Entrepreneurial Entry, and Innovation.” In Innovation Policy and the Economy, vol. 5, edited by Adam Jaffe, Josh Lerner, and Scott Stern (87–108). Cambridge, MA: MIT Press.
Gordon, Roger H., and Joel Slemrod. 2000. “Are ‘Real’ Responses to Taxes Simply Income Shifting between Corporate and Personal Tax Bases?” In Does Atlas Shrug? The Economic Consequences of Taxing the Rich, edited by Joel Slemrod (240–80). New York: Russell Sage Foundation.
Holtz-Eakin, Douglas, Harvey S. Rosen, and Robert Weathers. 2000. “Horatio Alger Meets the Mobility Tables.” Small Business Economics 14 (4): 243–74.
Kakwani, Nanak C. 1976. “Measurement of Tax Progressivity: An International Comparison.” Economic Journal 87: 71–80.