Embed Size (px)
Citation preview

Self-Assembly of Bicyclic Dinuclear tris-(Ditopic Diphosphane)
Complexes of Zerovalent Group 10 Metals
Daniel Tofan
Christopher C. Cummins∗
Department of Chemistry, Massachusetts Institute of Technology, Cambridge MA 02139-4307
E-mail: [email protected]
May 2, 2012
∗To whom correspondence should be addressed
S.1
Electronic Supplementary Material (ESI) for Chemical ScienceThis journal is © The Royal Society of Chemistry 2012
Table of Contents
S.1 Synthetic and Spectroscopic Details S.3
S.1.1 General Procedures . . . . . . . . . . . . . . . . . . . . . . . . . . . . . . . . . . . . . . . . . . S.3
S.1.2 Synthesis of Complex (η1-1)Ni(µ-1)3Ni(η1-1) (2) . . . . . . . . . . . . . . . . . . . . . . . . . S.3
S.1.3 Synthesis of Complex (Ph3P)Ni(µ-1)3Ni(PPh3) (3-Ni) . . . . . . . . . . . . . . . . . . . . . . . S.6
S.1.4 Synthesis of Complex (Ph3As)Ni(µ-1)3Ni(AsPh3) (4) . . . . . . . . . . . . . . . . . . . . . . . . S.8
S.1.5 Synthesis of Complex (Ph3Sb)Ni(µ-1)3Ni(SbPh3) (5) . . . . . . . . . . . . . . . . . . . . . . . . S.10
S.1.6 Synthesis of Complex (Ph3P)Pd(µ-1)3Pd(PPh3) (3-Pd) . . . . . . . . . . . . . . . . . . . . . . . S.11
S.1.7 Synthesis of Complex (Ph3P)Pt(µ-1)3Pt(PPh3) (3-Pt) . . . . . . . . . . . . . . . . . . . . . . . . S.11
S.1.8 Streamlined Synthesis of Diphosphane 1 . . . . . . . . . . . . . . . . . . . . . . . . . . . . . . . S.13
S.1.9 Treatment of Complexes 4 and 5 with PPh3 . . . . . . . . . . . . . . . . . . . . . . . . . . . . . S.15
S.1.10 Treatment of Complexes 3-Ni and 5 with 4 . . . . . . . . . . . . . . . . . . . . . . . . . . . . . S.15
S.1.11 Treatment of Ni(cod)2, Pd(PPh3)4 and Pt(PPh3)4 with P2Ph4 . . . . . . . . . . . . . . . . . . . S.17
S.1.12 Thermal decomposition of solid 3-Ni . . . . . . . . . . . . . . . . . . . . . . . . . . . . . . . . S.19
S.2 Crystallographic Details S.21
S.2.1 General X-ray Refinement Methods . . . . . . . . . . . . . . . . . . . . . . . . . . . . . . . . . S.21
S.2.2 Specific X-ray Refinement Details . . . . . . . . . . . . . . . . . . . . . . . . . . . . . . . . . . S.22
S.2.3 X-ray Crystallographic Tables . . . . . . . . . . . . . . . . . . . . . . . . . . . . . . . . . . . . S.23
S.2
Electronic Supplementary Material (ESI) for Chemical ScienceThis journal is © The Royal Society of Chemistry 2012
S.1 Synthetic and Spectroscopic Details
S.1.1 General Procedures
All manipulations were performed in a Vacuum Atmospheres model MO-40M glove box under an inert atmo-
sphere of purified N2. Solvents were obtained anhydrous and oxygen-free by bubble degassing (N2) and purifica-
tion using a Glass Contours Solvent Purification System built by SG Water. Deuterated solvents were purchased
from Cambridge Isotope Laboratories, degassed, and stored over molecular sieves prior to use. All glassware was
oven-dried at temperatures greater than 170 ◦C prior to use. Celite 435 (EM Science) was dried by heating above
200 ◦C under a dynamic vacuum for at least 48 h prior to use, while alumina (activated, basic, Brockman I) was
dried similarly for at least 7 days prior to use. 1H, 13C and 31P NMR spectra were obtained on Varian Mercury
300, Varian Inova 500, or Bruker Avance 400 instruments equipped with Oxford Instruments superconducting
magnets, and were referenced to appropriate solvent resonances.1 31P NMR spectra were referenced externally to
85% H3PO4 (0 ppm). Elemental analyses were performed by Midwest Microlab LLC, Indianapolis, IN. White
phosphorus was acquired from Thermphos International, while all other reagents were purchased from commercial
sources.
S.1.2 Synthesis of Complex (η1-1)Ni(µ-1)3Ni(η1-1) (2)
A solution of 1 (102 mg, 0.45 mmol, 5.0 equiv) in THF (5 mL) was added to a THF (4 mL) solution of Ni(cod)2
(50 mg, 0.18 mmol, 2.0 equiv) under stirring. The mixture turned immediately from yellow to orange, and then to
dark brown. After 15 min, all volatile materials were removed under reduced pressure and the remaining residue
was redissolved in THF (3 mL). The mixture was stored at –35 ◦C and the precipitate that formed was collected
via suction filtration on a fritted glass filter, washed with cold pentane, and dried under reduced pressure to yield
bright yellow solids containing analytically pure complex 2 (54 mg, 0.043 mmol, 48% yield). 1H NMR (C6D6,
20 ◦C, 400 MHz) δ : 2.75–2.70 (m, 4 H, η1CH2), 2.69 (d, 2JHH = 14.4 Hz, 12 H, µ CHH), 2.53 (d, 12 H, µ CHH),
2.33–2.17 (m, 12 H, η1CH2), 1.90 (s, 12 H, η1
CH3), 1.81 (s, 36 H, µ CH3), 1.77 (s, 12 H, η1CH3) ppm (Figure
S.1); assignments were made based on the 1H–1H COSY NMR spectrum (Figure S.2). 13C{1H} NMR (C6D6, 20
◦C, 100.6 MHz) δ : 126.5 (η1CH0), 126.3 (µCH0), 125.1 (d, 2JCP = 7 Hz, η1
CH0), 40.6 (µCH2), 40.1 (η1CH2),
28.5 (1JCP = 34.0 Hz, η1CH2), 23.4 (µCH3), 23.2 (η1
CH3), 22.0 (η1CH3) ppm (Figure S.3). 31P{1H} NMR (C6D6,
20 ◦C, 121.5 MHz) δ : –7.3 (d-vsept, 1JPP = 344 Hz, 2 P, NiPAPM), –30.2 (vt-vt, 2+3JPP = 55.9 Hz, 3+4JPP = 22.1
Hz, 6 P, NiPX PX Ni), –62.1 (d-vsept, 2 P, NiPAPM) ppm (Figure S.4). Elemental analysis [%] found (and calcd. for
C60H100Ni2P10): C 58.03 (57.72); H 7.85 (8.07); N none (0.00); P 24.46 (24.81).
S.3
Electronic Supplementary Material (ESI) for Chemical ScienceThis journal is © The Royal Society of Chemistry 2012

PPM 2.90 2.80 2.70 2.60 2.50 2.40 2.30 2.20 2.10 2.00 1.90 1.80 1.70 1.60 1.50
2.7033
2.6673
2.5483
2.5129
2.2675
2.2671
1.8976
1.8074
1.7731
Figure S.1: 1H NMR spectrum of complex 2.
PPM (F2) 2.6 2.4 2.2 2.0 1.8
PPM (F1)
2.70
2.60
2.50
2.40
2.30
2.20
2.10
2.00
1.90
1.80
1.70
Figure S.2: 1H-1H COSY spectrum of complex 2 with separate coupling patterns at bridging (blue) and terminal(green) diphosphane ligands.
S.4
Electronic Supplementary Material (ESI) for Chemical ScienceThis journal is © The Royal Society of Chemistry 2012

PPM 160 150 140 130 120 110 100 90 80 70 60 50 40 30 20 10 0
126.5090
126.2768
126.2766
125.1857
125.1141
40.5992
40.1688
28.6782
28.3311
23.4356
23.2348
21.9697
Figure S.3: 13C{1H} NMR spectrum of complex 2.
PPM -8 -12 -16 -20 -24 -28 -32 -36 -40 -44 -48 -52 -56 -60 -64
-6.1898
-8.3234
-30.2475
-61.0142
-63.1347
Figure S.4: 31P{1H} NMR spectrum of complex 2.
S.5
Electronic Supplementary Material (ESI) for Chemical ScienceThis journal is © The Royal Society of Chemistry 2012
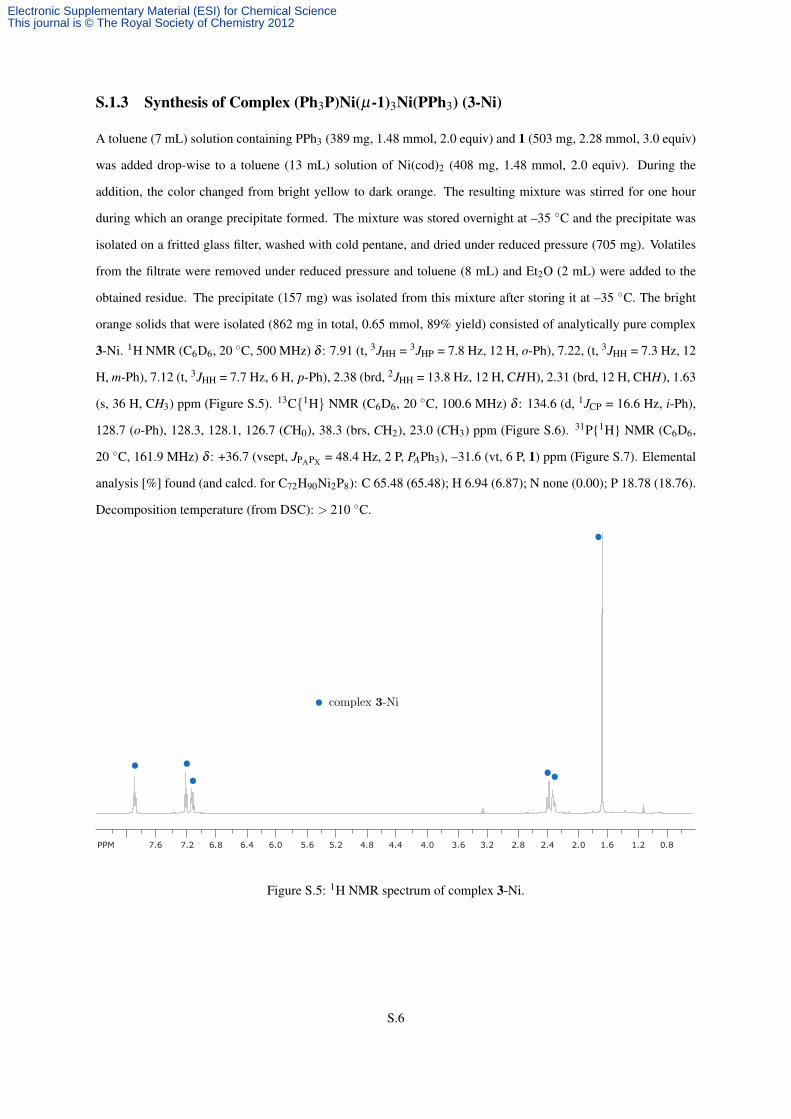
S.1.3 Synthesis of Complex (Ph3P)Ni(µ-1)3Ni(PPh3) (3-Ni)
A toluene (7 mL) solution containing PPh3 (389 mg, 1.48 mmol, 2.0 equiv) and 1 (503 mg, 2.28 mmol, 3.0 equiv)
was added drop-wise to a toluene (13 mL) solution of Ni(cod)2 (408 mg, 1.48 mmol, 2.0 equiv). During the
addition, the color changed from bright yellow to dark orange. The resulting mixture was stirred for one hour
during which an orange precipitate formed. The mixture was stored overnight at –35 ◦C and the precipitate was
isolated on a fritted glass filter, washed with cold pentane, and dried under reduced pressure (705 mg). Volatiles
from the filtrate were removed under reduced pressure and toluene (8 mL) and Et2O (2 mL) were added to the
obtained residue. The precipitate (157 mg) was isolated from this mixture after storing it at –35 ◦C. The bright
orange solids that were isolated (862 mg in total, 0.65 mmol, 89% yield) consisted of analytically pure complex
3-Ni. 1H NMR (C6D6, 20 ◦C, 500 MHz) δ : 7.91 (t, 3JHH = 3JHP = 7.8 Hz, 12 H, o-Ph), 7.22, (t, 3JHH = 7.3 Hz, 12
H, m-Ph), 7.12 (t, 3JHH = 7.7 Hz, 6 H, p-Ph), 2.38 (brd, 2JHH = 13.8 Hz, 12 H, CHH), 2.31 (brd, 12 H, CHH), 1.63
(s, 36 H, CH3) ppm (Figure S.5). 13C{1H} NMR (C6D6, 20 ◦C, 100.6 MHz) δ : 134.6 (d, 1JCP = 16.6 Hz, i-Ph),
128.7 (o-Ph), 128.3, 128.1, 126.7 (CH0), 38.3 (brs, CH2), 23.0 (CH3) ppm (Figure S.6). 31P{1H} NMR (C6D6,
20 ◦C, 161.9 MHz) δ : +36.7 (vsept, JPAPX = 48.4 Hz, 2 P, PAPh3), –31.6 (vt, 6 P, 1) ppm (Figure S.7). Elemental
analysis [%] found (and calcd. for C72H90Ni2P8): C 65.48 (65.48); H 6.94 (6.87); N none (0.00); P 18.78 (18.76).
Decomposition temperature (from DSC): > 210 ◦C.
PPM 7.6 7.2 6.8 6.4 6.0 5.6 5.2 4.8 4.4 4.0 3.6 3.2 2.8 2.4 2.0 1.6 1.2 0.8
Figure S.5: 1H NMR spectrum of complex 3-Ni.
S.6
Electronic Supplementary Material (ESI) for Chemical ScienceThis journal is © The Royal Society of Chemistry 2012

PPM 230 210 190 170 150 130 110 90 70 50 30 10 -10 -30134.3665
134.2345
128.6992
128.0944
126.6580
38.3430
22.9976
Figure S.6: 13C{1H} NMR spectrum of complex 3-Ni.
PPM 80 60 40 20 0 -20 -40 -60 -80
-31.3134
-31.6120
-31.9110
38.5 37.5 36.5 35.5 34.5
37.5457
37.2481
36.9498
36.6510
36.3524
36.0538
35.7533
Figure S.7: 31P{1H} NMR spectrum of complex 3-Ni.
S.7
Electronic Supplementary Material (ESI) for Chemical ScienceThis journal is © The Royal Society of Chemistry 2012

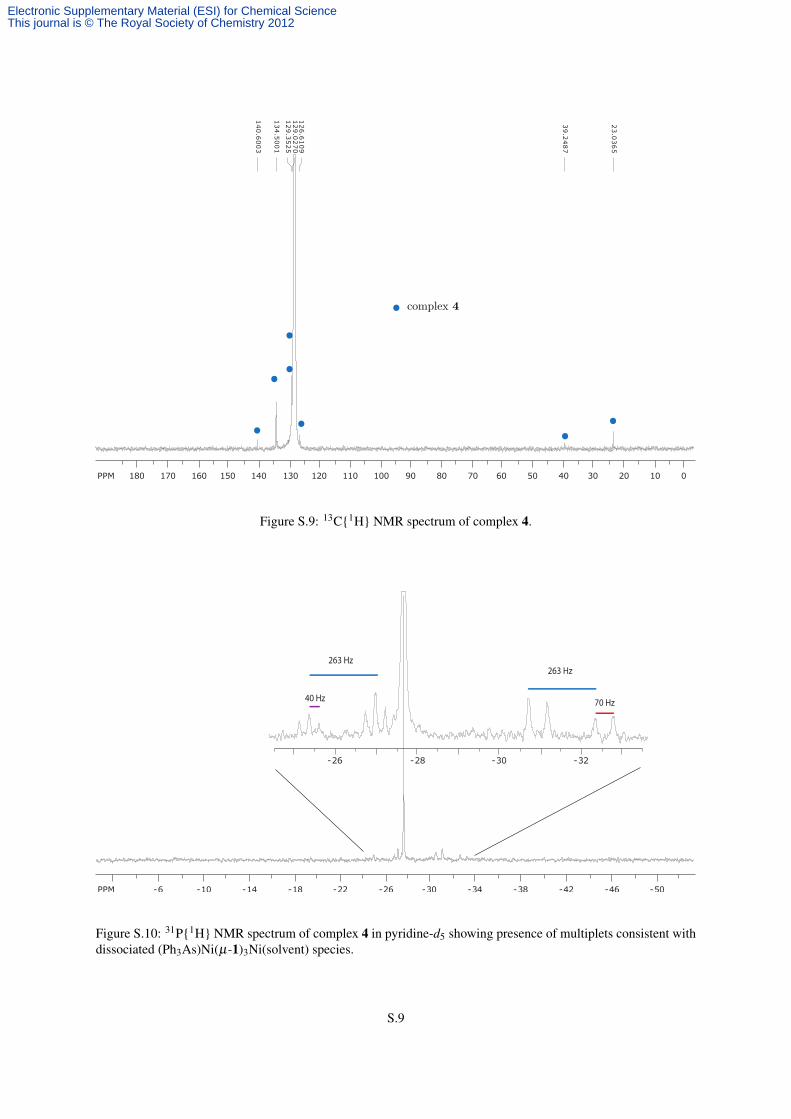
S.1.4 Synthesis of Complex (Ph3As)Ni(µ-1)3Ni(AsPh3) (4)
A toluene (20 mL) solution containing AsPh3 (451 mg, 1.47 mmol, 2.0 equiv) and 1 (500 mg, 2.21 mmol, 3.0
equiv) was added drop-wise, over 5 mins, to a freshly prepared, stirring toluene (30 mL) solution of Ni(cod)2 (405
mg, 1.47 mmol, 2.0 equiv). During the addition, the color changed from bright yellow to orange and eventually
to dark brown. After stirring for one hour, the solution was diluted with pentane (50 mL) and stirred for another
15 minutes. A bright yellow precipitate formed, which was isolated on a fritted glass filter, washed with copious
amounts of pentane (20 mL) and diethyl ether (10 mL), and dried under reduced pressure (582 mg). Volatiles from
the filtrate were removed under reduced pressure and pentane was added to the resulting residue. The mixture was
stirred, and the precipitate was isolated on the fritted glass filter, washed with diethyl ether, and dried for a second
batch (331 mg). A total of 913 mg (0.65 mmol, 88% yield) of bright yellow-orange solids containing analytically
pure complex 4 were isolated. 1H NMR (C6D6, 20 ◦C, 500 MHz) δ : 7.91 (dd, 3JHH = 6.9 Hz, 4JHH = 1.3 Hz, 12
H, o-Ph), 7.21, (t, 3JHH = 7.4 Hz, 12 H, m-Ph), 7.13 (tt, 3JHH = 7.4 Hz, 4JHH = 1.5 Hz, 6 H, p-Ph), 2.41 (brd, 2JHH
= 13.8 Hz, 12 H, CHH), 2.31 (brd, 12 H, CHH), 1.62 (s, 36 H, CH3) ppm (Figure S.8).13C{1H} NMR (C6D6,
20 ◦C, 100.6 MHz) δ : 140.6 (i-Ph), 134.5 (o-Ph), 129.4 (m-Ph), 129.0 (p-Ph), 126.6 (CH0), 39.3 (brs, CH2),
23.0 (CH3) ppm (Figure S.9). 31P{1H} NMR (C6D6, 20 ◦C, 161.9 MHz) δ : –28.2 ppm (Figure S.10). Elemental
analysis [%] found (and calcd. for C72H90Ni2As2P6): C 60.92 (61.39); H 6.32 (6.44); N none (0.00); P 13.49
(13.19). Decomposition temperature (from DSC): > 185 ◦C.
PPM 8.0 7.6 7.2 6.8 6.4 6.0 5.6 5.2 4.8 4.4 4.0 3.6 3.2 2.8 2.4 2.0 1.6 1.2 0.8
7.9189
7.9052
7.2195
7.2142
7.2049
7.1899
7.1324
7.1302
7.1177
2.4295
2.4020
2.3268
2.3262
2.3001
2.2991
1.6247
Figure S.8: 1H NMR spectrum of isolated pure complex 4 indicating presence of dissociated AsPh3.
S.8
Electronic Supplementary Material (ESI) for Chemical ScienceThis journal is © The Royal Society of Chemistry 2012
PPM 180 170 160 150 140 130 120 110 100 90 80 70 60 50 40 30 20 10 0
140.6003
134.5001
129.3525
129.0270
126.6109
39.2487
23.0365
Figure S.9: 13C{1H} NMR spectrum of complex 4.
PPM -6 -10 -14 -18 -22 -26 -30 -34 -38 -42 -46 -50
-26 -28 -30 -32
40 Hz
263 Hz 263 Hz
70 Hz
Figure S.10: 31P{1H} NMR spectrum of complex 4 in pyridine-d5 showing presence of multiplets consistent withdissociated (Ph3As)Ni(µ-1)3Ni(solvent) species.
S.9
Electronic Supplementary Material (ESI) for Chemical ScienceThis journal is © The Royal Society of Chemistry 2012
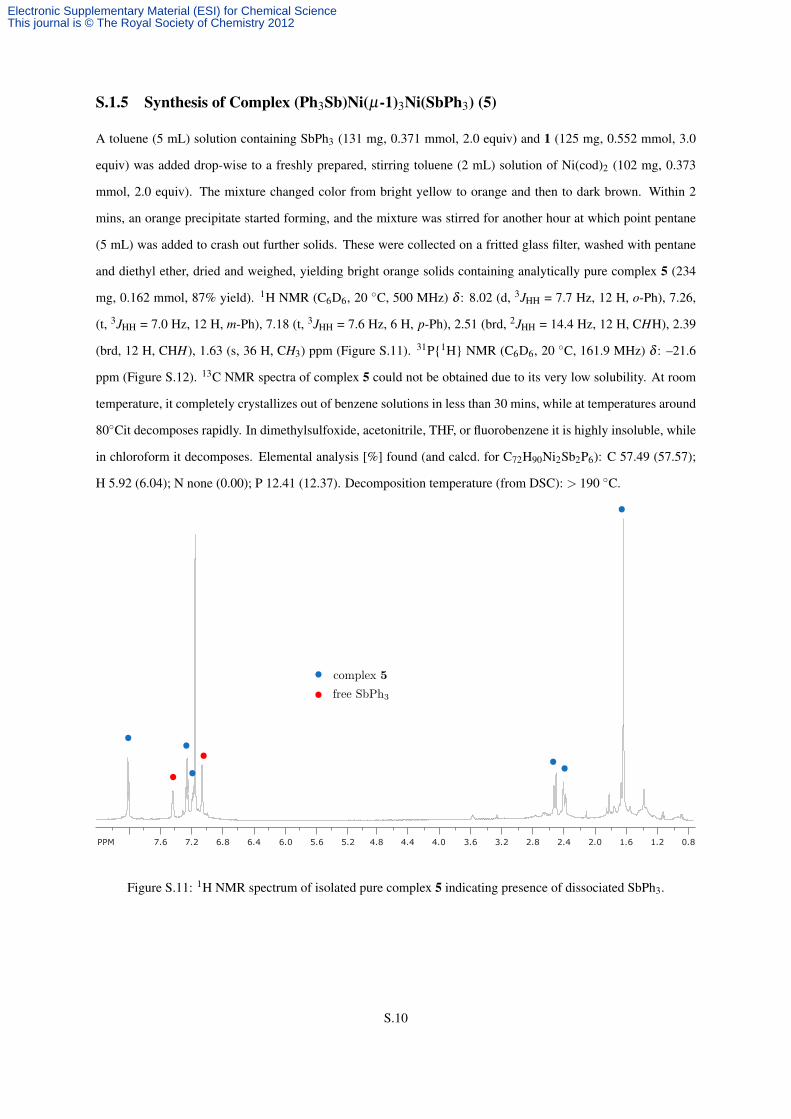
S.1.5 Synthesis of Complex (Ph3Sb)Ni(µ-1)3Ni(SbPh3) (5)
A toluene (5 mL) solution containing SbPh3 (131 mg, 0.371 mmol, 2.0 equiv) and 1 (125 mg, 0.552 mmol, 3.0
equiv) was added drop-wise to a freshly prepared, stirring toluene (2 mL) solution of Ni(cod)2 (102 mg, 0.373
mmol, 2.0 equiv). The mixture changed color from bright yellow to orange and then to dark brown. Within 2
mins, an orange precipitate started forming, and the mixture was stirred for another hour at which point pentane
(5 mL) was added to crash out further solids. These were collected on a fritted glass filter, washed with pentane
and diethyl ether, dried and weighed, yielding bright orange solids containing analytically pure complex 5 (234
mg, 0.162 mmol, 87% yield). 1H NMR (C6D6, 20 ◦C, 500 MHz) δ : 8.02 (d, 3JHH = 7.7 Hz, 12 H, o-Ph), 7.26,
(t, 3JHH = 7.0 Hz, 12 H, m-Ph), 7.18 (t, 3JHH = 7.6 Hz, 6 H, p-Ph), 2.51 (brd, 2JHH = 14.4 Hz, 12 H, CHH), 2.39
(brd, 12 H, CHH), 1.63 (s, 36 H, CH3) ppm (Figure S.11). 31P{1H} NMR (C6D6, 20 ◦C, 161.9 MHz) δ : –21.6
ppm (Figure S.12). 13C NMR spectra of complex 5 could not be obtained due to its very low solubility. At room
temperature, it completely crystallizes out of benzene solutions in less than 30 mins, while at temperatures around
80◦Cit decomposes rapidly. In dimethylsulfoxide, acetonitrile, THF, or fluorobenzene it is highly insoluble, while
in chloroform it decomposes. Elemental analysis [%] found (and calcd. for C72H90Ni2Sb2P6): C 57.49 (57.57);
H 5.92 (6.04); N none (0.00); P 12.41 (12.37). Decomposition temperature (from DSC): > 190 ◦C.
PPM 7.6 7.2 6.8 6.4 6.0 5.6 5.2 4.8 4.4 4.0 3.6 3.2 2.8 2.4 2.0 1.6 1.2 0.8
Figure S.11: 1H NMR spectrum of isolated pure complex 5 indicating presence of dissociated SbPh3.
S.10
Electronic Supplementary Material (ESI) for Chemical ScienceThis journal is © The Royal Society of Chemistry 2012

PPM 140 120 100 80 60 40 20 0 -20 -40 -60 -80 -100 -120
Figure S.12: 31P{1H} NMR spectrum of complex 5.
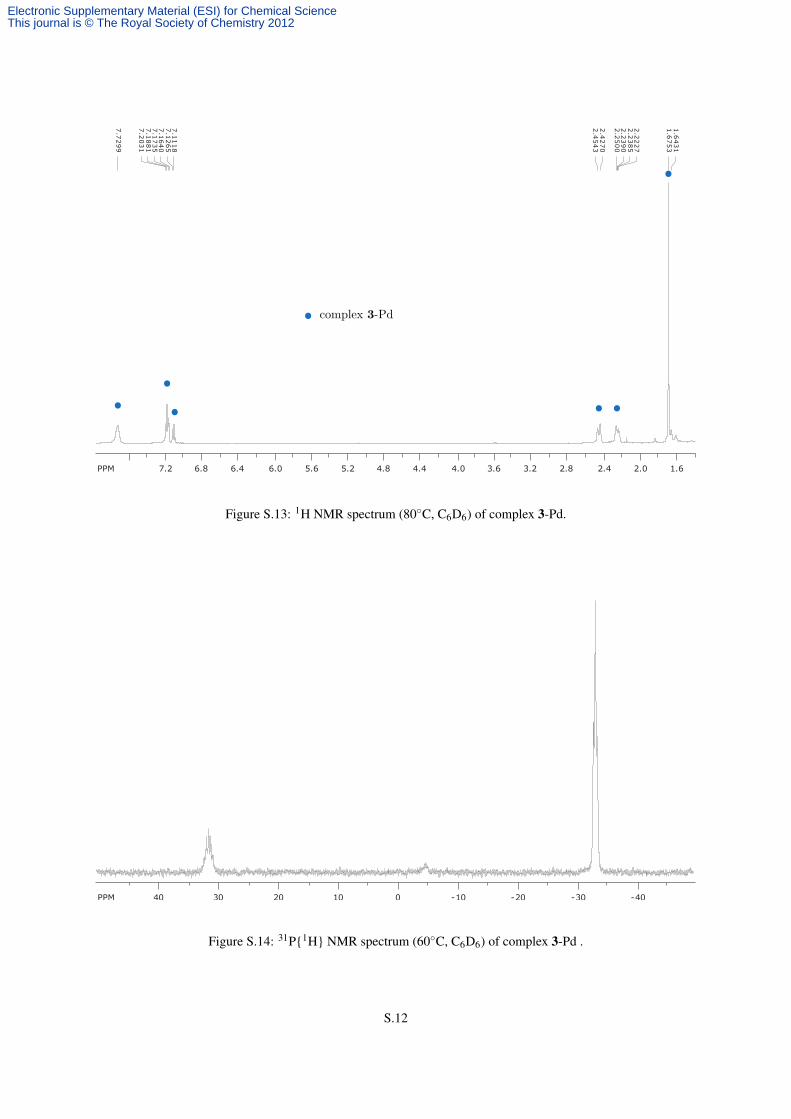
S.1.6 Synthesis of Complex (Ph3P)Pd(µ-1)3Pd(PPh3) (3-Pd)
A toluene (2 mL) solution of 1 (86 mg, 0.38 mmol, 3.0 equiv) was added to a clear, yellow solution of Pd(PPh3)4
(292 mg, 0.25 mmol, 2.0 equiv) in toluene (15 mL) and the resulting mixture was stirred for one hour, leading
to the formation of small amounts of a yellow precipitate. Pentane (1 mL) was added and the resulting mixture
was stored at –35 ◦C. The precipitate was isolated on a fritted glass filter, washed with pentane, and dried under
reduced pressure to yield bright yellow solids containing analytically pure complex 3-Pd (117 mg, 0.083 mmol,
65% yield). 1H NMR (C6D6, 20 ◦C, 500 MHz) δ : 7.97 (brs, 12 H, o-Ph), 7.24, (brs, 12 H, m-Ph), 7.12 (brs, 6 H,
p-Ph), 2.41 (brd, 2JHH = 13.3 Hz, 12 H, CHH), 2.22 (brd, 12 H, CHH), 1.69 (s, 36 H, CH3) ppm (Figure S.13).
13C NMR (C6D6, 80◦C, 125.8 MHz) δ : 134.6 (d, 1JCP = 19.0 Hz, i-Ph), 128.9, 128.7, 128.2, 126.3 (CH0), 37.3
(brs, CH2), 22.6 (CH3) ppm. 31P{1H} NMR (C6D6, 20 ◦C, 161.9 MHz) δ : +31.2 (vsept, JPAPX = 56.8 Hz, 2 P,
PAPh3), –33.7 (vt, 6 P, 1) ppm (Figure S.14). Elemental analysis [%] found (and calcd. for C72H90Pd2P8): C 61.17
(61.07); H 6.41 (6.41); N none (0.00); P 17.35 (17.50). Decomposition temperature (from DSC): > 205 ◦C.
S.1.7 Synthesis of Complex (Ph3P)Pt(µ-1)3Pt(PPh3) (3-Pt)
A toluene (2 mL) solution of 1 (98.8 mg, 0.437 mmol , 3.0 equiv) was added to a clear, pale-orange solution of
Pt(PPh3)4 (362.4 mg, 0.291 mmol, 2.0 equiv) in toluene (8 mL). During the addition, the color darkened to intense
orange. The mixture was stirred for one hour, after which it was layered with 10 mL pentane and stored at –35
◦C. The precipitate that formed was isolated on a fritted glass filter, washed with pentane, and dried under reduced
S.11
Electronic Supplementary Material (ESI) for Chemical ScienceThis journal is © The Royal Society of Chemistry 2012
PPM 7.2 6.8 6.4 6.0 5.6 5.2 4.8 4.4 4.0 3.6 3.2 2.8 2.4 2.0 1.6
7.7299
7.2031
7.1881
7.1735
7.1640
7.1265
7.1118
2.4543
2.4270
2.2500
2.2390
2.2385
2.2227
1.6753
1.6431
Figure S.13: 1H NMR spectrum (80◦C, C6D6) of complex 3-Pd.
PPM 40 30 20 10 0 -10 -20 -30 -40
Figure S.14: 31P{1H} NMR spectrum (60◦C, C6D6) of complex 3-Pd .
S.12
Electronic Supplementary Material (ESI) for Chemical ScienceThis journal is © The Royal Society of Chemistry 2012
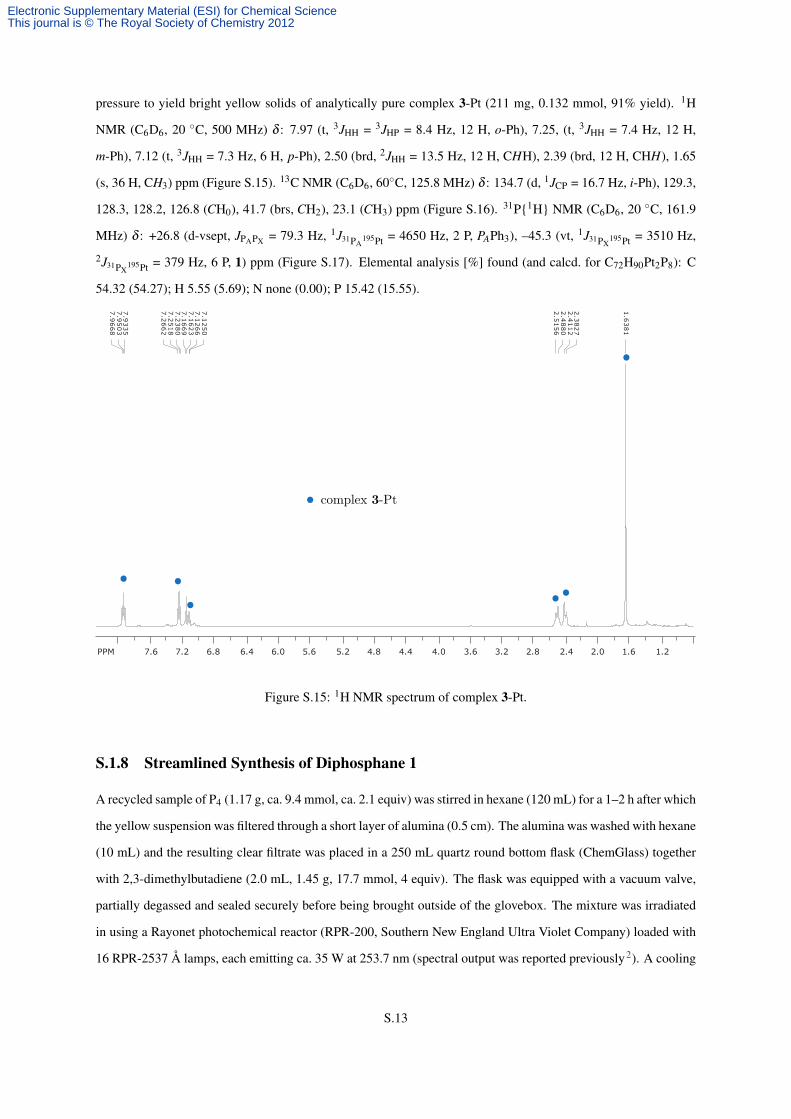
pressure to yield bright yellow solids of analytically pure complex 3-Pt (211 mg, 0.132 mmol, 91% yield). 1H
NMR (C6D6, 20 ◦C, 500 MHz) δ : 7.97 (t, 3JHH = 3JHP = 8.4 Hz, 12 H, o-Ph), 7.25, (t, 3JHH = 7.4 Hz, 12 H,
m-Ph), 7.12 (t, 3JHH = 7.3 Hz, 6 H, p-Ph), 2.50 (brd, 2JHH = 13.5 Hz, 12 H, CHH), 2.39 (brd, 12 H, CHH), 1.65
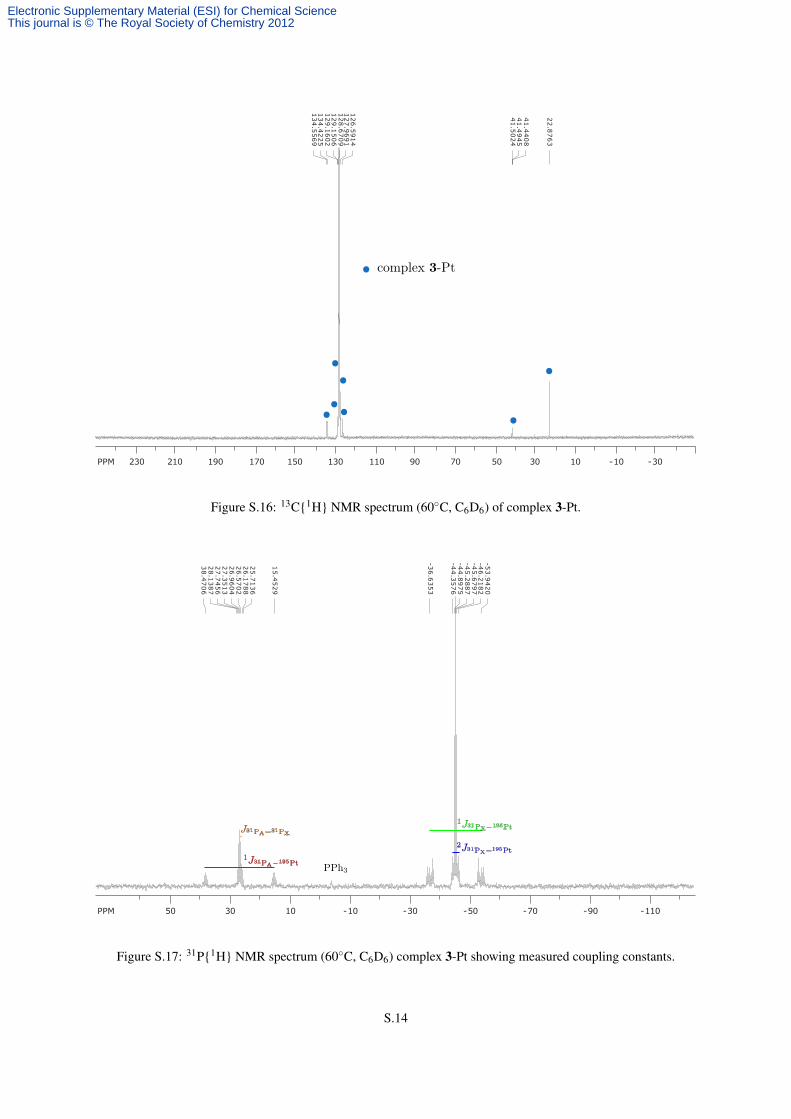
(s, 36 H, CH3) ppm (Figure S.15). 13C NMR (C6D6, 60◦C, 125.8 MHz) δ : 134.7 (d, 1JCP = 16.7 Hz, i-Ph), 129.3,
128.3, 128.2, 126.8 (CH0), 41.7 (brs, CH2), 23.1 (CH3) ppm (Figure S.16). 31P{1H} NMR (C6D6, 20 ◦C, 161.9
MHz) δ : +26.8 (d-vsept, JPAPX = 79.3 Hz, 1J31PA195Pt = 4650 Hz, 2 P, PAPh3), –45.3 (vt, 1J31PX
195Pt = 3510 Hz,
2J31PX195Pt = 379 Hz, 6 P, 1) ppm (Figure S.17). Elemental analysis [%] found (and calcd. for C72H90Pt2P8): C
54.32 (54.27); H 5.55 (5.69); N none (0.00); P 15.42 (15.55).
PPM 7.6 7.2 6.8 6.4 6.0 5.6 5.2 4.8 4.4 4.0 3.6 3.2 2.8 2.4 2.0 1.6 1.2
7.9668
7.9503
7.9335
7.2662
7.2518
7.2380
7.1669
7.1623
7.1266
7.1250
2.5156
2.4880
2.4112
2.3827
1.6381
Figure S.15: 1H NMR spectrum of complex 3-Pt.
S.1.8 Streamlined Synthesis of Diphosphane 1
A recycled sample of P4 (1.17 g, ca. 9.4 mmol, ca. 2.1 equiv) was stirred in hexane (120 mL) for a 1–2 h after which
the yellow suspension was filtered through a short layer of alumina (0.5 cm). The alumina was washed with hexane
(10 mL) and the resulting clear filtrate was placed in a 250 mL quartz round bottom flask (ChemGlass) together
with 2,3-dimethylbutadiene (2.0 mL, 1.45 g, 17.7 mmol, 4 equiv). The flask was equipped with a vacuum valve,
partially degassed and sealed securely before being brought outside of the glovebox. The mixture was irradiated
in using a Rayonet photochemical reactor (RPR-200, Southern New England Ultra Violet Company) loaded with
16 RPR-2537 Å lamps, each emitting ca. 35 W at 253.7 nm (spectral output was reported previously2). A cooling
S.13
Electronic Supplementary Material (ESI) for Chemical ScienceThis journal is © The Royal Society of Chemistry 2012
PPM 230 210 190 170 150 130 110 90 70 50 30 10 -10 -30
134.5569
134.4225
129.1602
129.1506
128.6709
127.9691
126.5914
41.5024
41.4945
41.4408
22.8763
Figure S.16: 13C{1H} NMR spectrum (60◦C, C6D6) of complex 3-Pt.
PPM 50 30 10 -10 -30 -50 -70 -90 -110
38.4706
28.1387
27.7456
27.3513
26.9604
26.5702
26.1788
25.7136
15.4529
-36.6353
-44.3576
-44.8975
-45.2887
-45.6797
-46.2182
-53.9420
Figure S.17: 31P{1H} NMR spectrum (60◦C, C6D6) complex 3-Pt showing measured coupling constants.
S.14
Electronic Supplementary Material (ESI) for Chemical ScienceThis journal is © The Royal Society of Chemistry 2012

fan was used to keep the temperature inside the photolysis chamber at ca. 55–65◦C in order to prevent the P4 from
condensing above the solution and form a yellow coating which would block the UV radiation from reaching the
solution. After irradiating for 14–16 hours, the resulting yellow suspension was cooled and brought back into the
glovebox. The procedure was repeated two times and the resulting mixtures were worked-up at the same time.
Each batch was passed separately through a layer of alumina (2 cm) and washed with pentane (50 mL) to
remove the unreacted P4. The after removing under vacuum the volatiles from the pentane filtrates, a white solid
consisting of mostly P4 (ca. 1.5 g, ca. 40% of the total amount used) was recovered, which can be reused for other
photolytic batches. The alumina layers were washed with diethyl ether (150 mL each) and the three resulting pale-
yellow filtrates were merged together. After removing the volatiles from the diethyl ether washings under vacuum,
a pale-yellow solid was obtained (ca. 3.5 g). This was dissolved in hot toluene (ca. 8 mL) and the resulting solution
was allowed to cool down and stored at –35◦C for about 12 hours. The colorless crystals were collected on a fritted
glass filter, washed with cold pentane, dried, and weighted (ca. 1.0 g). The filtrate was redissolved in hot toluene
(ca. 3 mL) and another batch (0.3 g) was obtained after storing at –35◦C. A total of ca. 1.4–1.5 g (∼12% yield
based on diene) of crystalline white solids of diphosphane 1 were collected after the third recrystallization.
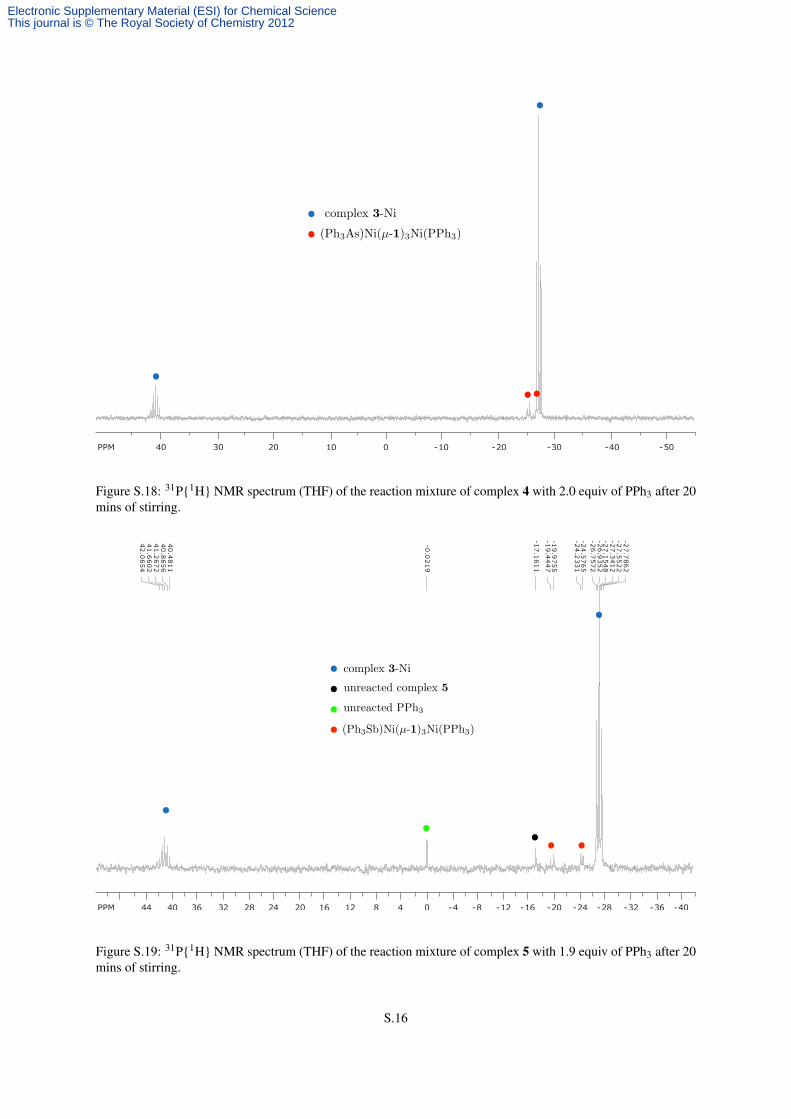
S.1.9 Treatment of Complexes 4 and 5 with PPh3
To a solution of 4 (24.0 mg, 0.017 mmol, 1.0 equiv) in THF (2 mL), PPh3 (7.9 mg, 0.035 mmol, 2.0 equiv) was
added as a solution in THF (0.5 mL). The mixture was stirred for 10 mins, without any obvious color change, and
after 30 mins it was analyzed by 31P NMR spectroscopy. This indicated complete, selective formation of complex
3-Ni and the absence of unreacted PPh3 (Figure S.18).
To a slurry of 5 (23.6 mg, 0.016 mmol, 1.0 equiv) in THF (2 mL), PPh3 (7.9 mg, 0.030 mmol, 1.9 equiv) was
added as a solution in THF (0.5 mL). The mixture was stirred for 10 mins, without any obvious change in the
appearance of precipitate. A 31P NMR spectrum was obtained of an aliquot after 30 mins of stirring the mixture
in which incomplete formation of 3-Ni complex could be observed. Signals for unreacted PPh3 and 5 were also
observed, together with multiplets around –20 ppm that are consistent with mixed (Ph3P)Ni(1)3Ni(SbPh3) species
(Figure S.19).
S.1.10 Treatment of Complexes 3-Ni and 5 with 4
A suspension of complex 3-Ni (11.2 mg, 0.0080 mmol, 1.0 equiv) in C6D6 (0.5 mL) was added to a stirring
suspension of 4 (10.5 mg, 0.0101 mmol, 1.0 equiv) in C6D6 (0.5 mL) which let to the dissolution of most of the
solids within a minute. NMR spectroscopic analysis indicated the presence of multiplets in the 31P NMR spectrum
consistent with (Ph3P)Ni(1)3Ni(AsPh3) species (Figure S.20).
A suspension of complex 5 (15.3 mg, 0.0101 mmol, 1.0 equiv) in C6D6 (0.5 mL) was added to a stirring
S.15
Electronic Supplementary Material (ESI) for Chemical ScienceThis journal is © The Royal Society of Chemistry 2012
PPM 40 30 20 10 0 -10 -20 -30 -40 -50
Figure S.18: 31P{1H} NMR spectrum (THF) of the reaction mixture of complex 4 with 2.0 equiv of PPh3 after 20mins of stirring.
PPM 44 40 36 32 28 24 20 16 12 8 4 0 -4 -8 -12 -16 -20 -24 -28 -32 -36 -40
42.0654
41.6602
41.2672
40.8656
40.4811
-0.0219
-17.1611
-19.4447
-19.9755
-24.2331
-24.5765
-26.7572
-26.9352
-27.1548
-27.3412
-27.5522
-27.7862
Figure S.19: 31P{1H} NMR spectrum (THF) of the reaction mixture of complex 5 with 1.9 equiv of PPh3 after 20mins of stirring.
S.16
Electronic Supplementary Material (ESI) for Chemical ScienceThis journal is © The Royal Society of Chemistry 2012

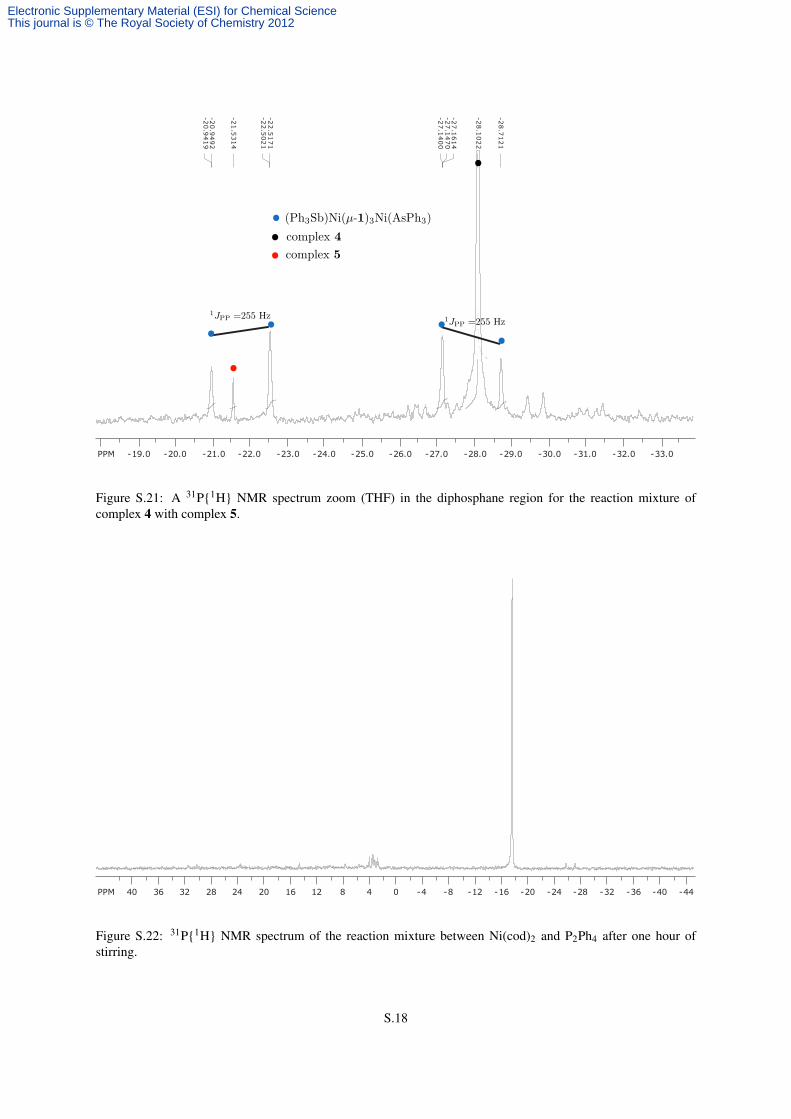
suspension of 4 (14.3 mg, 0.0101 mmol, 1.0 equiv) in C6D6 (0.5 mL) which produced no obvious color change.
The sample was stirred well and after 10 mins it was analyzed by NMR spectroscopy. The appearance of doublets
in the 31P NMR spectrum consistent with the (Ph3As)Ni(1)3Ni(SbPh3) complex was observed (Figure S.21).
PPM -26.0 -27.0 -28.0 -29.0 -30.0 -31.0 -32.0 -33.0 -34.0 -35.0 -36.0 -37.0
-29.5874
-31.0303
-31.1636
-31.3688
-31.4445
-32.7980
-33.0968
-33.3957
Figure S.20: A 31P{1H} NMR spectrum zoom (in THF) in the diphosphane region for the reaction mixture ofcomplex 4 with complex 3-Ni. Second-order coupling in the mixed-ligand complex (between doublets labeled inred and green) leads to the other half of the expected doublet to be obscured by the other peaks.
S.1.11 Treatment of Ni(cod)2, Pd(PPh3)4 and Pt(PPh3)4 with P2Ph4
A suspension of P2Ph4 (55 mg, 0.15 mmol, 2.5 equiv) in C6D6 (0.5 mL) was added to a suspension of Ni(cod)2
(17 mg, 0.06 mmol, 1.0 equiv) in C6D6 (0.5 mL) under stirring. The mixture turned immediately from yellow to
orange, red, and then to brown. After 30 mins of stirring the mixture had turned green-brown. At this point, NMR
spectroscopy indicated the presence of unreacted P2Ph4 and free 1,5-COD, but no other major NMR-active prod-
ucts (Figure S.22). After a day, green crystals had formed and were determined by X-ray diffraction spectroscopy
to consist of the previously-reported complex Ni(HPPh2)4.3
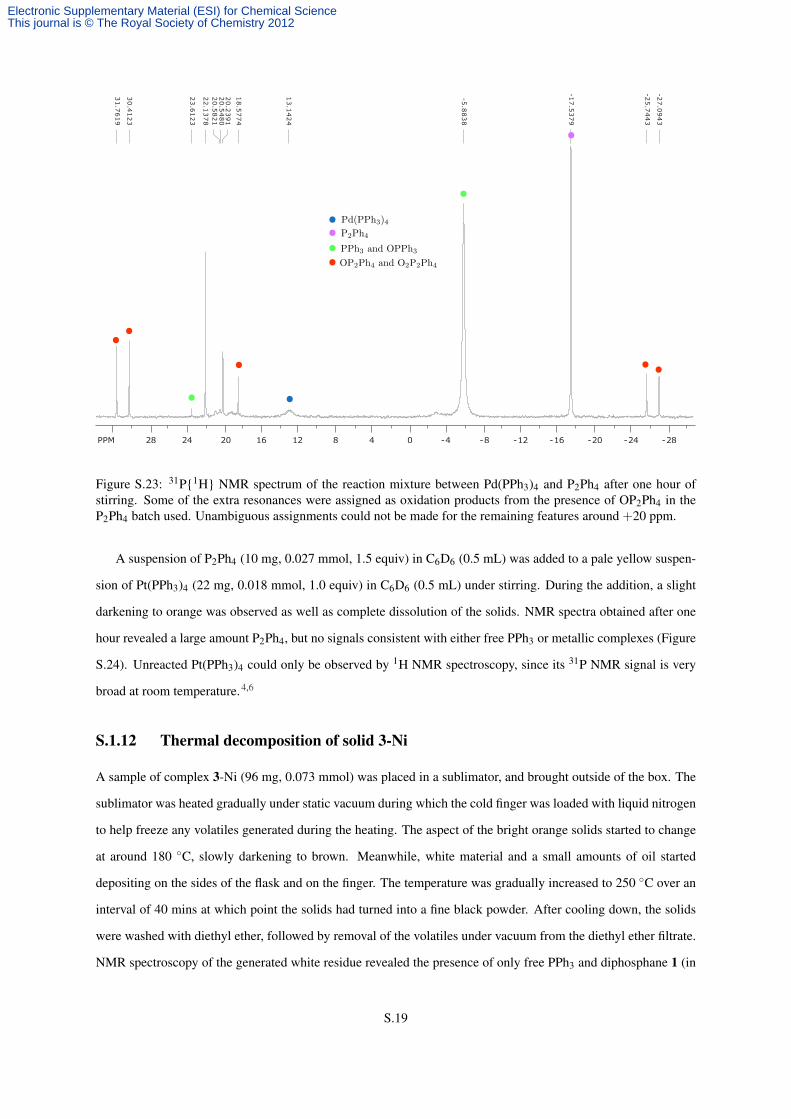
A suspension of P2Ph4 (55 mg, 0.023 mmol, 1.5 equiv) in C6D6 (0.5 mL) was added to a pale yellow sus-
pension of Pd(PPh3)4 (17 mg, 0.016 mmol, 1.0 equiv) in C6D6 (0.5 mL) under stirring. Upon addition, all the
solids dissolved as the color of the mixture turned to orange and then to red. NMR spectra obtained after one hour
revealed large amounts of free PPh3 and P2Ph4, some unreacted Pd(PPh3)4,4,5 but no 31P NMR signals consistent
with the formation of bimetallic species (Figure S.23).
S.17
Electronic Supplementary Material (ESI) for Chemical ScienceThis journal is © The Royal Society of Chemistry 2012
PPM -19.0 -20.0 -21.0 -22.0 -23.0 -24.0 -25.0 -26.0 -27.0 -28.0 -29.0 -30.0 -31.0 -32.0 -33.0
-20.9419
-20.9492
-21.5314
-22.5021
-22.5171
-27.1400
-27.1470
-27.1614
-28.1022
-28.7121
Figure S.21: A 31P{1H} NMR spectrum zoom (THF) in the diphosphane region for the reaction mixture ofcomplex 4 with complex 5.
PPM 40 36 32 28 24 20 16 12 8 4 0 -4 -8 -12 -16 -20 -24 -28 -32 -36 -40 -44
Figure S.22: 31P{1H} NMR spectrum of the reaction mixture between Ni(cod)2 and P2Ph4 after one hour ofstirring.
S.18
Electronic Supplementary Material (ESI) for Chemical ScienceThis journal is © The Royal Society of Chemistry 2012
PPM 28 24 20 16 12 8 4 0 -4 -8 -12 -16 -20 -24 -28
31.7619
30.4123
23.6123
22.1378
20.5821
20.5480
20.2391
18.5774
13.1424
-5.8838
-17.5379
-25.7443
-27.0943
Figure S.23: 31P{1H} NMR spectrum of the reaction mixture between Pd(PPh3)4 and P2Ph4 after one hour ofstirring. Some of the extra resonances were assigned as oxidation products from the presence of OP2Ph4 in theP2Ph4 batch used. Unambiguous assignments could not be made for the remaining features around +20 ppm.
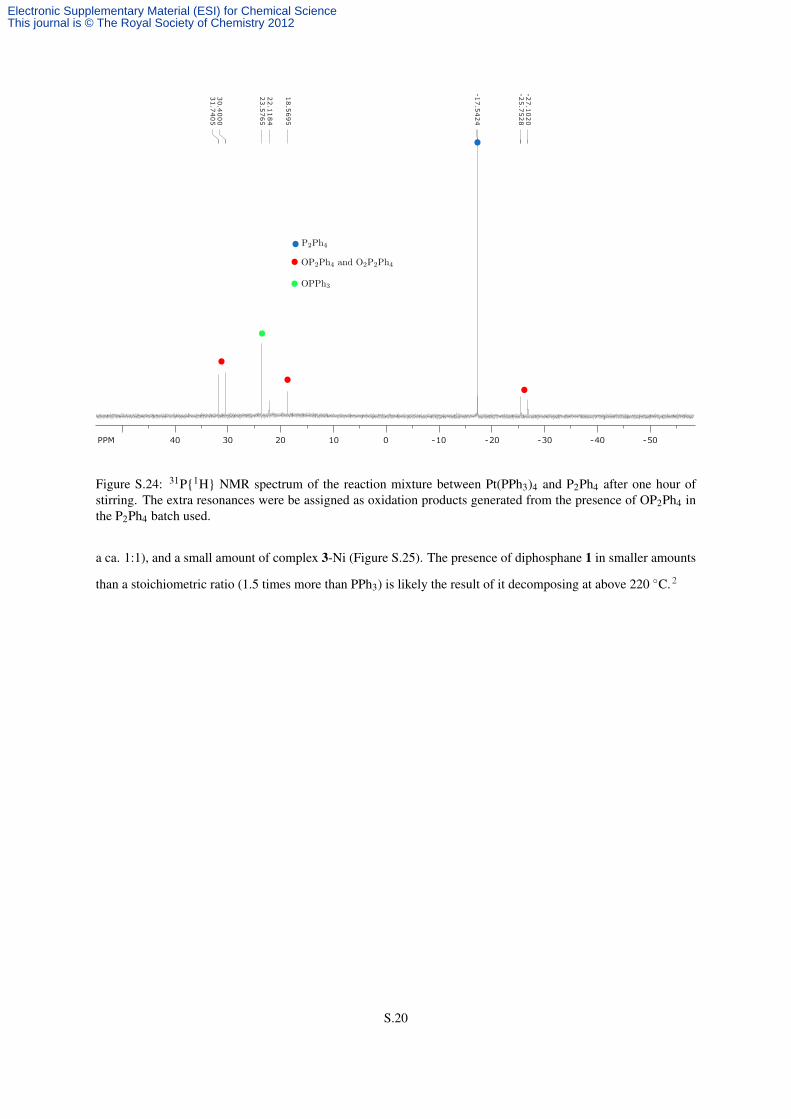
A suspension of P2Ph4 (10 mg, 0.027 mmol, 1.5 equiv) in C6D6 (0.5 mL) was added to a pale yellow suspen-
sion of Pt(PPh3)4 (22 mg, 0.018 mmol, 1.0 equiv) in C6D6 (0.5 mL) under stirring. During the addition, a slight
darkening to orange was observed as well as complete dissolution of the solids. NMR spectra obtained after one
hour revealed a large amount P2Ph4, but no signals consistent with either free PPh3 or metallic complexes (Figure
S.24). Unreacted Pt(PPh3)4 could only be observed by 1H NMR spectroscopy, since its 31P NMR signal is very
broad at room temperature.4,6
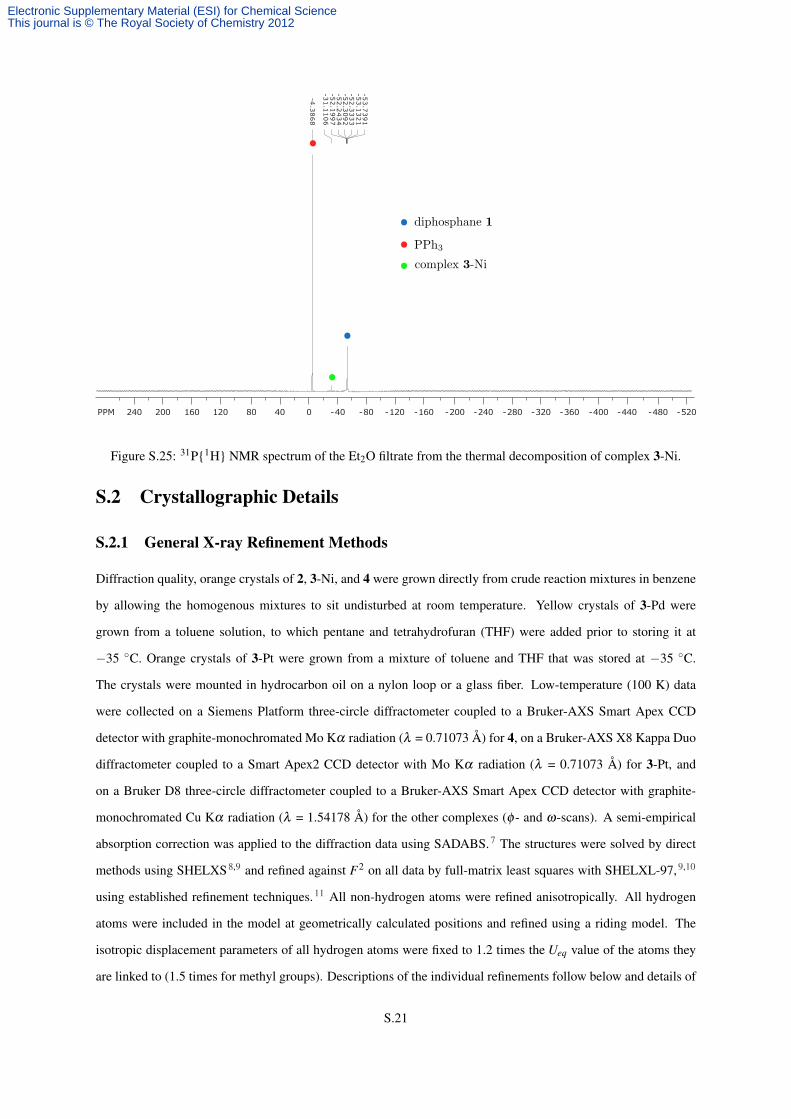
S.1.12 Thermal decomposition of solid 3-Ni
A sample of complex 3-Ni (96 mg, 0.073 mmol) was placed in a sublimator, and brought outside of the box. The
sublimator was heated gradually under static vacuum during which the cold finger was loaded with liquid nitrogen
to help freeze any volatiles generated during the heating. The aspect of the bright orange solids started to change
at around 180 ◦C, slowly darkening to brown. Meanwhile, white material and a small amounts of oil started
depositing on the sides of the flask and on the finger. The temperature was gradually increased to 250 ◦C over an
interval of 40 mins at which point the solids had turned into a fine black powder. After cooling down, the solids
were washed with diethyl ether, followed by removal of the volatiles under vacuum from the diethyl ether filtrate.
NMR spectroscopy of the generated white residue revealed the presence of only free PPh3 and diphosphane 1 (in
S.19
Electronic Supplementary Material (ESI) for Chemical ScienceThis journal is © The Royal Society of Chemistry 2012
PPM 40 30 20 10 0 -10 -20 -30 -40 -50
31.7405
30.4000
23.5765
22.1184
18.5695
-17.5424
-25.7528
-27.1020
Figure S.24: 31P{1H} NMR spectrum of the reaction mixture between Pt(PPh3)4 and P2Ph4 after one hour ofstirring. The extra resonances were be assigned as oxidation products generated from the presence of OP2Ph4 inthe P2Ph4 batch used.
a ca. 1:1), and a small amount of complex 3-Ni (Figure S.25). The presence of diphosphane 1 in smaller amounts
than a stoichiometric ratio (1.5 times more than PPh3) is likely the result of it decomposing at above 220 ◦C.2
S.20
Electronic Supplementary Material (ESI) for Chemical ScienceThis journal is © The Royal Society of Chemistry 2012
PPM 240 200 160 120 80 40 0 -40 -80 -120 -160 -200 -240 -280 -320 -360 -400 -440 -480 -520
-4.3868
-31.1106
-52.1997
-52.2434
-52.3092
-52.3333
-53.1321
-53.7391
Figure S.25: 31P{1H} NMR spectrum of the Et2O filtrate from the thermal decomposition of complex 3-Ni.
S.2 Crystallographic Details
S.2.1 General X-ray Refinement Methods
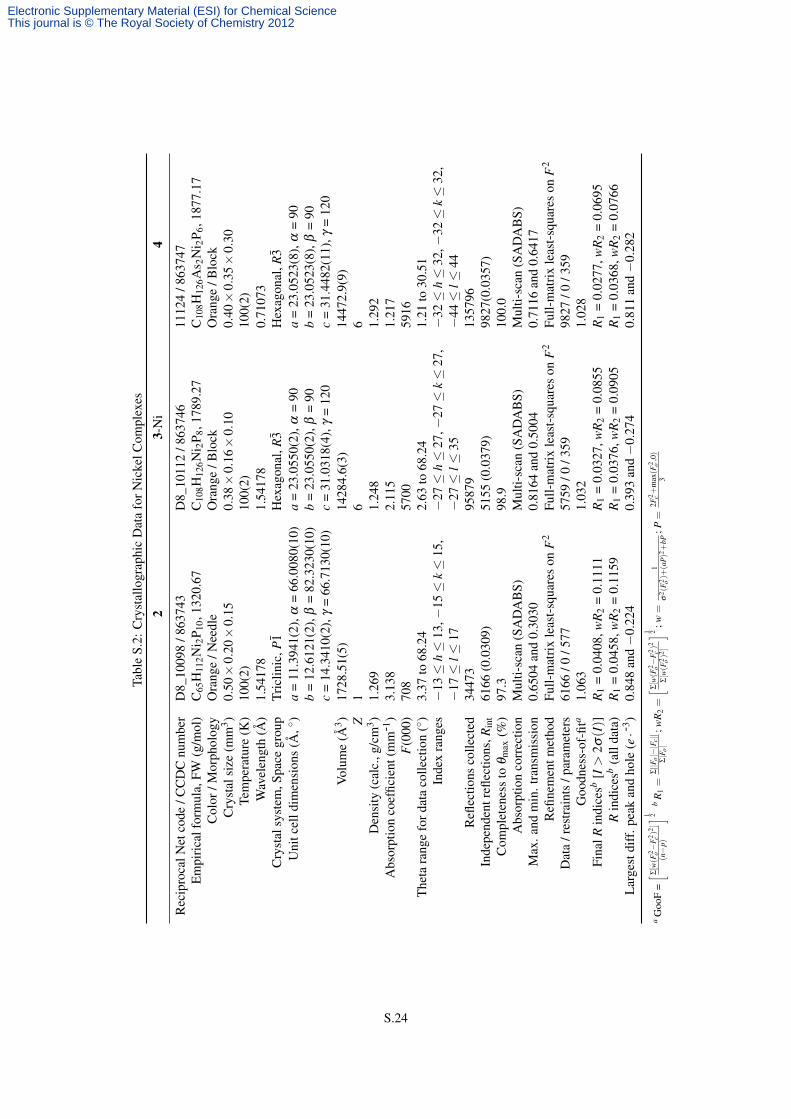
Diffraction quality, orange crystals of 2, 3-Ni, and 4 were grown directly from crude reaction mixtures in benzene
by allowing the homogenous mixtures to sit undisturbed at room temperature. Yellow crystals of 3-Pd were
grown from a toluene solution, to which pentane and tetrahydrofuran (THF) were added prior to storing it at
−35 ◦C. Orange crystals of 3-Pt were grown from a mixture of toluene and THF that was stored at −35 ◦C.
The crystals were mounted in hydrocarbon oil on a nylon loop or a glass fiber. Low-temperature (100 K) data
were collected on a Siemens Platform three-circle diffractometer coupled to a Bruker-AXS Smart Apex CCD
detector with graphite-monochromated Mo Kα radiation (λ = 0.71073 Å) for 4, on a Bruker-AXS X8 Kappa Duo
diffractometer coupled to a Smart Apex2 CCD detector with Mo Kα radiation (λ = 0.71073 Å) for 3-Pt, and
on a Bruker D8 three-circle diffractometer coupled to a Bruker-AXS Smart Apex CCD detector with graphite-
monochromated Cu Kα radiation (λ = 1.54178 Å) for the other complexes (φ - and ω-scans). A semi-empirical
absorption correction was applied to the diffraction data using SADABS.7 The structures were solved by direct
methods using SHELXS8,9 and refined against F2 on all data by full-matrix least squares with SHELXL-97,9,10
using established refinement techniques.11 All non-hydrogen atoms were refined anisotropically. All hydrogen
atoms were included in the model at geometrically calculated positions and refined using a riding model. The
isotropic displacement parameters of all hydrogen atoms were fixed to 1.2 times the Ueq value of the atoms they
are linked to (1.5 times for methyl groups). Descriptions of the individual refinements follow below and details of
S.21
Electronic Supplementary Material (ESI) for Chemical ScienceThis journal is © The Royal Society of Chemistry 2012

the data quality and a summary of the residual values of the refinements for all structures are given in the following
tables. Further details are provided in the form of .cif files available from the CCDC.12
S.2.2 Specific X-ray Refinement Details
The compound 2 crystallized in the triclinic space group P1̄ with half a molecule of complex and one molecule
of pentane per asymmetric unit. The presence of the inversion center in the middle of the Ni–Ni line leads to the
three diphosphane 1 bridges to be disordered over two symmetry-imposed positions each, while the two {NiPPh3}
fragments were not disordered. The model contains no restraints on either the target molecule and the solvent.
A crystallographic summary is provided in Table S.2, while a list of select interatomic distances and angles is
provided in Table S.4.
The compounds 3-Ni and 4 crystallized in the hexagonal space group R3̄ with a third of a molecule of complex
and two molecules of benzene per asymmetric unit. The model contains no restraints on either the target molecules
or the solvents. Crystallographic summaries are provided in Table S.2, while lists of select interatomic distances
and angles are provided in Tables S.4 and S.5, respectively.
The compound 3-Pd crystallized in the triclinic space group P1̄ with a whole molecule of complex, one
molecule of toluene and one molecule of THF per asymmetric unit. The THF molecule is disordered over two po-
sitions. Similarity restraints on 1–2 and 1–3 distances and displacement parameters as well as rigid bond restraints
for anisotropic displacement parameters were applied to all atoms in the THF molecules. In addition, similarity
restraints were applied to geometrically relate the two THF molecules to one another. The ratio between the two
components was refined freely, and the sum of the two occupancies was constrained to unity.13 The model con-
tains no restraints on either the target molecules or the toluene molecule. A crystallographic summary is provided
in Table S.3, while a list of select interatomic distances and angles is provided in Table S.7.
The compound 3-Pt crystallized in the monoclinic space group Cc with one molecule of complex, one toluene,
and two THF molecules per asymmetric unit. One phenyl ring of one of the PPh3 ligands and one of the THF
molecules are disordered over two positions. Similarity restraints on 1–2 and 1–3 distances and displacement
parameters as well as rigid bond restraints for anisotropic displacement parameters were applied to the three
solvent molecules and the disordered phenyl ring. In addition, similarity restraints were applied to geometrically
relate the three THF molecules to one another. The ratio between the two components of each disorder was refined
freely, and the sum of the two occupancies for each pair was constrained to unity.13 A crystallographic summary
is provided in Table S.3, while a list of select interatomic distances and angles is provided in Table S.8.
The estimated angles between the diphosphane lone pairs listed in Table 1 can be estimated precisely using
the formula:
θ′ = 180◦−2× (180◦−α) = 2×α−180◦, where:
S.22
Electronic Supplementary Material (ESI) for Chemical ScienceThis journal is © The Royal Society of Chemistry 2012
α = arccos(cos(6 P−P−M)
cos(6 M−P−P−M
2 )).
This α = 6 P−P−M when the dihedral angle M–P–P–M is zero and MPPM becomes a planar trapezoid, in which
case θ ′ = θ from Table 1. The values for θ and θ ′ are listed below in Table S.1.
Table S.1: Diphosphane 1 lone pair angle
θ θ ′
2 45.38 45.483-Ni 46.86 46.933-Pd 45.42 45.563-Pt 47.62 47.644 44.12 44.17
Av. 45.88 45.96
S.2.3 X-ray Crystallographic Tables
S.23
Electronic Supplementary Material (ESI) for Chemical ScienceThis journal is © The Royal Society of Chemistry 2012
Tabl
eS.
2:C
ryst
allo
grap
hic
Dat
afo
rNic
kelC
ompl
exes
23-
Ni
4
Rec
ipro
calN
etco
de/C
CD
Cnu
mbe
rD
8_10
098
/863
743
D8_
1011
2/8
6374
611
124
/863
747
Em
piri
calf
orm
ula,
FW(g
/mol
)C
65H
112N
i 2P 1
0,13
20.6
7C
108H
126N
i 2P 8
,178
9.27
C10
8H12
6As 2
Ni 2
P 6,1
877.
17C
olor
/Mor
phol
ogy
Ora
nge
/Nee
dle
Ora
nge
/Blo
ckO
rang
e/B
lock
Cry
stal
size
(mm
3 )0.
50×
0.20×
0.15
0.38×
0.16×
0.10
0.40×
0.35×
0.30
Tem
pera
ture
(K)
100(
2)10
0(2)
100(
2)W
avel
engt
h(Å
)1.
5417
81.
5417
80.
7107
3C
ryst
alsy
stem
,Spa
cegr
oup
Tric
linic
,P1̄
Hex
agon
al,R
3̄H
exag
onal
,R3̄
Uni
tcel
ldim
ensi
ons
(Å,◦
)a
=11
.394
1(2)
,α=
66.0
080(
10)
a=
23.0
550(
2),α
=90
a=
23.0
523(
8),α
=90
b=
12.6
121(
2),β
=82
.323
0(10
)b
=23
.055
0(2)
,β=
90b
=23
.052
3(8)
,β=
90c
=14
.341
0(2)
,γ=
66.7
130(
10)
c=
31.0
318(
4),γ
=12
0c
=31
.448
2(11
),γ
=12
0Vo
lum
e(Å
3 )17
28.5
1(5)
1428
4.6(
3)14
472.
9(9)
Z1
66
Den
sity
(cal
c.,g
/cm
3 )1.
269
1.24
81.
292
Abs
orpt
ion
coef
ficie
nt(m
m-1
)3.
138
2.11
51.
217
F(0
00)
708
5700
5916
The
tara
nge
ford
ata
colle
ctio
n(◦
)3.
37to
68.2
42.
63to
68.2
41.
21to
30.5
1In
dex
rang
es−
13≤
h≤
13,−
15≤
k≤
15,
−27≤
h≤
27,−
27≤
k≤
27,−
32≤
h≤
32,−
32≤
k≤
32,
−17≤
l≤17
−27≤
l≤35
−44≤
l≤44
Refl
ectio
nsco
llect
ed34
473
9587
913
5796
Inde
pend
entr
eflec
tions
,Rin
t61
66(0
.030
9)51
55(0
.037
9)98
27(0
.035
7)C
ompl
eten
ess
toθ
max
(%)
97.3
98.9
100.
0A
bsor
ptio
nco
rrec
tion
Mul
ti-sc
an(S
AD
AB
S)M
ulti-
scan
(SA
DA
BS)
Mul
ti-sc
an(S
AD
AB
S)M
ax.a
ndm
in.t
rans
mis
sion
0.65
04an
d0.
3030
0.81
64an
d0.
5004
0.71
16an
d0.
6417
Refi
nem
entm
etho
dFu
ll-m
atri
xle
ast-
squa
res
onF
2Fu
ll-m
atri
xle
ast-
squa
res
onF
2Fu
ll-m
atri
xle
ast-
squa
res
onF
2
Dat
a/r
estr
aint
s/p
aram
eter
s61
66/0
/577
5759
/0/3
5998
27/0
/359
Goo
dnes
s-of
-fita
1.06
31.
032
1.02
8Fi
nalR
indi
cesb
[I>
2σ(I)]
R1
=0.
0408
,wR
2=
0.11
11R
1=
0.03
27,w
R2
=0.
0855
R1
=0.
0277
,wR
2=
0.06
95R
indi
cesb
(all
data
)R
1=
0.04
58,w
R2
=0.
1159
R1
=0.
0376
,wR
2=
0.09
05R
1=
0.03
68,w
R2
=0.
0766
Lar
gest
diff
.pea
kan
dho
le(e·-
3 )0.
848
and−
0.22
40.
393
and−
0.27
40.
811
and−
0.28
2
aG
ooF
=[ Σ
[w(F
2 o−
F2 c)2]
(n−
p)
]1 2b
R1=
Σ||F
o|−|F
c||
Σ|F
o|
;wR
2=[ Σ
[w(F
2 o−
F2 c)2
Σ[w(F
2 o)2]
]1 2;w
=1
σ2 (
F2 o)+
(aP)2+
bP;P
=2F
2 c+
max(F
2 o,0)
3
S.24
Electronic Supplementary Material (ESI) for Chemical ScienceThis journal is © The Royal Society of Chemistry 2012

Tabl
eS.
3:C
ryst
allo
grap
hic
Dat
afo
rPal
ladi
uman
dPl
atin
umC
ompl
exes
3-Pd
3-Pt
Rec
ipro
calN
etco
de/C
CD
Cnu
mbe
rD
8_10
132
/863
745
X8_
1008
1/8
6374
4E
mpi
rica
lfor
mul
a,FW
(g/m
ol)
C83
H10
6OP 8
Pd2,
1580
.24
C87
H11
4O2P
8Pt 2
,182
9.72
Col
or/M
orph
olog
yY
ello
w/P
rism
Ora
nge
/Blo
ckC
ryst
alsi
ze(m
m3 )
0.40×
0.30×
0.12
0.05×
0.02×
0.01
Tem
pera
ture
(K)
100(
2)10
0(2)
Wav
elen
gth
(Å)
1.54
178
0.71
073
Cry
stal
syst
em,S
pace
grou
pTr
iclin
ic,P
1̄M
onoc
linic
,Cc
Uni
tcel
ldim
ensi
ons
(Å,◦
)a
=12
.352
1(3)
,α=
74.0
590(
10)
a=
20.4
091(
11),
α=
90b
=14
.019
8(3)
,β=
80.7
290(
10)
b=
16.3
489(
9),β
=11
1.97
00(1
0)c
=23
.348
7(3)
,γ=
82.8
510(
10)
c=
26.2
219(
18),
γ=
90Vo
lum
e(Å
3 )38
23.3
9(15
)81
14.0
(8Z
24
Den
sity
(cal
c.,g
/cm
3 )1.
373
1.49
8A
bsor
ptio
nco
effic
ient
(mm
-1)
5.71
63.
649
F(0
00)
1648
3712
The
tara
nge
ford
ata
colle
ctio
n(◦
)1.
99to
68.2
41.
65to
30.5
1In
dex
rang
es−
10≤
h≤
14,−
16≤
k≤
16,
−28≤
h≤
29,−
23≤
k≤
23,
−28≤
l≤28
−37≤
l≤37
Refl
ectio
nsco
llect
ed73
677
1059
60In
depe
nden
trefl
ectio
ns,R
int
1354
2(0
.035
0)24
728
(0.0
580)
Com
plet
enes
sto
θm
ax(%
)10
0.0
100.
0A
bsor
ptio
nco
rrec
tion
Mul
ti-sc
an(S
AD
AB
S)M
ulti-
scan
(SA
DA
BS)
Max
.and
min
.tra
nsm
issi
on0.
5471
and
0.20
830.
9644
and
0.83
86R
efine
men
tmet
hod
Full-
mat
rix
leas
t-sq
uare
son
F2
Full-
mat
rix
leas
t-sq
uare
son
F2
Dat
a/r
estr
aint
s/p
aram
eter
s13
542
/172
/906
2472
8/4
69/9
88G
oodn
ess-
of-fi
ta1.
264
1.01
5Fi
nalR
indi
cesb
[I>
2σ(I)]
R1
=0.
0539
,wR
2=
0.15
87R
1=
0.03
29,w
R2
=0.
0571
Rin
dice
sb(a
llda
ta)
R1
=0.
0594
,wR
2=
0.16
24R
1=
0.04
59,w
R2
=0.
0612
Lar
gest
diff
.pea
kan
dho
le(e·-
3 )1.
960
and−
0.85
91.
095
and−
1.06
7
aG
ooF
=[ Σ
[w(F
2 o−
F2 c)2]
(n−
p)
]1 2b
R1=
Σ||F
o|−|F
c||
Σ|F
o|
;wR
2=[ Σ
[w(F
2 o−
F2 c)2
Σ[w(F
2 o)2]
]1 2;w
=1
σ2 (
F2 o)+
(aP)2+
bP;P
=2F
2 c+
max(F
2 o,0)
3
S.25
Electronic Supplementary Material (ESI) for Chemical ScienceThis journal is © The Royal Society of Chemistry 2012

Table S.4: Select interatomic distances [Å]and angles [◦] in complex 2
Ni1–Ni1a 3.9085(5)P1–P2 2.2239(8)P3–P4 2.2280(14)P5–P6 2.2262(14)P7–P8 2.2241(14)Ni1–P1 2.1425(6)Ni1–P3 2.1857(11)Ni1–P5 2.1811(11)Ni1–P7 2.0610(11)Ni1–P4a 2.2412(10)Ni1–P6a 2.2436(11)Ni1–P8a 2.1142(11)Ni1–P1–P2 114.54(3)Ni1–P3–P4 109.21(5)Ni1–P5–P6 112.71(5)Ni1–P7–P8 111.75(5)P3–P4–Ni1a 115.16(5)P5–P6–Ni1a 111.82(5)P7–P8–Ni1a 115.46(5)P1–Ni1–P3 115.87(3)P1–Ni1–P5 108.82(3)P7–Ni1–P1 109.20(3)P1a–Ni1a–P4 108.86(3)P1a–Ni1a–P6 115.45(3)P1a–Ni1a–P8 118.82(3)P7–Ni1–P5 109.05(4)P7–Ni1–P3 109.83(4)P5–Ni1–P3 103.81(4)P8–Ni1a–P4 105.71(4)P8–Ni1a–P6 104.98(4)P4–Ni1a–P6 101.23(4)P1–Ni1–Ni1a 180Ni1–Ni1a–P1a 180P1–Ni1–Ni1a–P1a 180.00(0)Ni1–P3–P4–Ni1a 7.09(8)Ni1–P5–P6–Ni1a 5.89(8)Ni1–P7–P8–Ni1a 9.06(9)P3–Ni1–P4a 135.09(4)P5–Ni1–P6a 135.10(4)P7–Ni1–P8a 131.97(4)P8a–Ni1–P5 56.69(4)P8a–Ni1–P3 48.33(4)P7–Ni1–P4a 56.07(4)P5–Ni1–P4a 55.84(4)P7–Ni1–P6a 49.44(4)P3–Ni1–P6a 63.35(4)
Table S.5: Select interatomic distances [Å] and angles[◦] in complex 3-Ni
Ni1–Ni2 3.9607(6)P1–P2 2.2274(6)Ni1–P1 2.1664(4)Ni1–P1a 2.1664(4)Ni1–P1b 2.1664(4)Ni2–P2 2.1790(4)Ni2–P2a 2.1790(4)Ni2–P2b 2.1790(4)Ni1–P3 2.1419(8)Ni2–P4 2.1637(8)
Ni1–P1–P2 112.74(2)Ni2–P2–P1 114.11(2)P3–Ni1–P1 113.001(15)P3–Ni1–P1a 113.003(15)P3–Ni1–P1b 113.003(15)P4–Ni2–P2 114.108(15)P4–Ni2–P2a 114.109(15)P4–Ni2–P2b 114.109(15)P1–Ni1–P1a 105.721(16)P1–Ni1–P1b 105.722(16)P1a–Ni1–P1b 105.720(16)P2–Ni2–P2a 104.463(17)P2–Ni2–P2b 104.461(17)P2a–Ni2–P2b 104.461(17)P3–Ni1–Ni2 180Ni1–Ni2–P4 180P3–Ni1–Ni2–P4 0.00(0)Ni1–P1–P2–Ni2 6.13(4)
Table S.6: Select interatomic distances [Å] and angles[◦] in complex 4
Ni1–Ni2 3.8532(4)P1–P2 2.2258(4)Ni1–As1 2.2769(3)Ni2–As2 2.2492(3)Ni1–P1b 2.1682(3)Ni1–P1a 2.1682(3)Ni1–P1 2.1681(3)Ni2–P2 2.1519(3)Ni2–P2b 2.1519(3)Ni2–P2a 2.1519(3)
Ni1–P1–P2 112.694(17)Ni2–P2–P1 111.432(17)P1b–Ni1–P1a 105.995(12)P1b–Ni1–P1 105.996(12)P1a–Ni1–P1 105.996(12)P2–Ni2–P2b 107.287(11)P2–Ni2–P2a 107.286(11)P2b–Ni2–P2a 107.288(11)P1b–Ni1–As1 112.757(10)P1a–Ni1–As1 112.757(11)P1–Ni1–As1 112.755(11)P2–Ni2–As2 111.578(10)P2b–Ni2–As2 111.575(10)P2a–Ni2–As2 111.575(10)As1–Ni1–Ni2 180.0(0)Ni1–Ni2–As2 180.0(0)As1–Ni1–Ni2–As2 0.00(±6.60)Ni1–P1–P2–Ni2 5.38(3)
S.26
Electronic Supplementary Material (ESI) for Chemical ScienceThis journal is © The Royal Society of Chemistry 2012
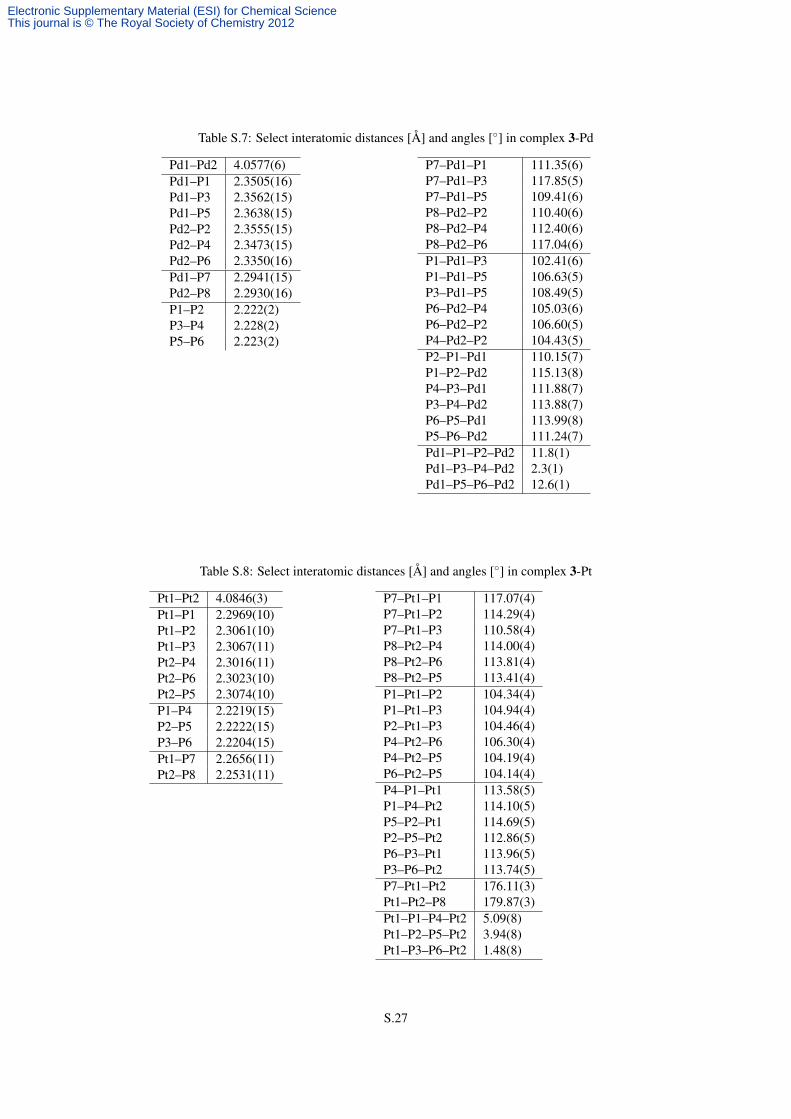
Table S.7: Select interatomic distances [Å] and angles [◦] in complex 3-Pd
Pd1–Pd2 4.0577(6)Pd1–P1 2.3505(16)Pd1–P3 2.3562(15)Pd1–P5 2.3638(15)Pd2–P2 2.3555(15)Pd2–P4 2.3473(15)Pd2–P6 2.3350(16)Pd1–P7 2.2941(15)Pd2–P8 2.2930(16)P1–P2 2.222(2)P3–P4 2.228(2)P5–P6 2.223(2)
P7–Pd1–P1 111.35(6)P7–Pd1–P3 117.85(5)P7–Pd1–P5 109.41(6)P8–Pd2–P2 110.40(6)P8–Pd2–P4 112.40(6)P8–Pd2–P6 117.04(6)P1–Pd1–P3 102.41(6)P1–Pd1–P5 106.63(5)P3–Pd1–P5 108.49(5)P6–Pd2–P4 105.03(6)P6–Pd2–P2 106.60(5)P4–Pd2–P2 104.43(5)P2–P1–Pd1 110.15(7)P1–P2–Pd2 115.13(8)P4–P3–Pd1 111.88(7)P3–P4–Pd2 113.88(7)P6–P5–Pd1 113.99(8)P5–P6–Pd2 111.24(7)Pd1–P1–P2–Pd2 11.8(1)Pd1–P3–P4–Pd2 2.3(1)Pd1–P5–P6–Pd2 12.6(1)
Table S.8: Select interatomic distances [Å] and angles [◦] in complex 3-Pt
Pt1–Pt2 4.0846(3)Pt1–P1 2.2969(10)Pt1–P2 2.3061(10)Pt1–P3 2.3067(11)Pt2–P4 2.3016(11)Pt2–P6 2.3023(10)Pt2–P5 2.3074(10)P1–P4 2.2219(15)P2–P5 2.2222(15)P3–P6 2.2204(15)Pt1–P7 2.2656(11)Pt2–P8 2.2531(11)
P7–Pt1–P1 117.07(4)P7–Pt1–P2 114.29(4)P7–Pt1–P3 110.58(4)P8–Pt2–P4 114.00(4)P8–Pt2–P6 113.81(4)P8–Pt2–P5 113.41(4)P1–Pt1–P2 104.34(4)P1–Pt1–P3 104.94(4)P2–Pt1–P3 104.46(4)P4–Pt2–P6 106.30(4)P4–Pt2–P5 104.19(4)P6–Pt2–P5 104.14(4)P4–P1–Pt1 113.58(5)P1–P4–Pt2 114.10(5)P5–P2–Pt1 114.69(5)P2–P5–Pt2 112.86(5)P6–P3–Pt1 113.96(5)P3–P6–Pt2 113.74(5)P7–Pt1–Pt2 176.11(3)Pt1–Pt2–P8 179.87(3)Pt1–P1–P4–Pt2 5.09(8)Pt1–P2–P5–Pt2 3.94(8)Pt1–P3–P6–Pt2 1.48(8)
S.27
Electronic Supplementary Material (ESI) for Chemical ScienceThis journal is © The Royal Society of Chemistry 2012
References
[1] G. R. Fulmer, A. J. M. Miller, N. H. Sherden, H. E. Gottlieb, A. Nudelman, B. M. Stoltz, J. E. Bercaw and
K. I. Goldberg, Organometallics, 2010, 29, 2176–2179.
[2] D. Tofan and C. C. Cummins, Angew. Chem., Int. Ed., 2010, 49, 7516–7518.
[3] J. Langer, H. Görls, G. Gillies and D. Walther, Z. Anorg. Allg. Chem., 2005, 631, 2719–2726.
[4] C. A. Tolman, W. C. Seidel and D. H. Gerlach, J. Am. Chem. Soc., 1972, 94, 2669–2676.
[5] D. R. Coulson, L. C. Satek and S. O. Grim, in Inorganic Syntheses, ed. R. J. Angelici, John Wiley & Sons,
Inc., 2007, vol. 28, pp. 107–109.
[6] R. Ugo, F. Cariati, G. L. Monica and J. J. Mrowca, in Inorganic Syntheses, ed. R. J. Angelici, John Wiley &
Sons, Inc., 2007, vol. 28, pp. 123–126.
[7] G. M. Sheldrick, SHELXTL; Bruker AXS, Inc.: Madison, WI (USA), 2005–2011.
[8] G. M. Sheldrick, Acta Crystallogr., Sect. A: Fundam. Crystallogr., 1990, 46, 467–473.
[9] G. M. Sheldrick, Acta Crystallogr. A, 2008, 64, 112–122.
[10] G. M. Sheldrick, SHELXL-97: Program for crystal structure determination; University of Göttingen, 1997.
[11] P. Müller, Crystallogr. Rev., 2009, 15, 57–83.
[12] These data can be obtained free of charge from The Cambridge Crystallographic Data Centre via
http://www.ccdc.cam.ac.uk/data_request/cif under the Cambridge Structural Database deposition numbers
863743–863747.
[13] P. Müller, R. Herbst-Irmer, A. L. Spek, T. R. Schneider and M. R. Sawaya, Crystal Structure Refinement:
A Crystallographer’s Guide to SHELXL, IUCr Texts on Crystallography; Oxford University Press: Oxford,
2006.
S.28
Electronic Supplementary Material (ESI) for Chemical ScienceThis journal is © The Royal Society of Chemistry 2012


![Synthesis of [c]‐Fused Bicyclic Proline Analogues](https://img.pdfslide.us/doc/110x75/588c73de1a28ab98208b9116/synthesis-of-cfused-bicyclic-proline-analogues.jpg)