Embed Size (px)
Citation preview

1
Supplementary Information
Self-assembled RNA-triple-helix hydrogel scaffold for
microRNA modulation in the tumor microenvironment
João Conde1,2,*, Nuria Oliva1, Mariana Atilano1,3, Hyun Seok Song1,4 and Natalie Artzi1,5,6,*
1 Massachusetts Institute of Technology, Institute for Medical Engineering and Science, Harvard-MIT
Division for Health Sciences and Technology, Cambridge, Massachusetts, USA.2 School of Engineering and Materials Science, Queen Mary University of London, London, UK.3 Grup d’Enginyeria de Materials, Institut Químic de Sarrià-Universitat Ramon Llull, Barcelona, Spain.4 Division of Bioconvergence Analysis, Korea Basic Science Institute, Yuseong, Daejeon, Republic of
Korea.5 Broad Institute of MIT and Harvard, Cambridge, Massachusetts, USA.6 Department of Medicine, Biomedical Engineering Division, Brigham and Women’s Hospital, Harvard
Medical School, Boston, Massachusetts, USA.
* Corresponding authors: João Conde, [email protected] and Natalie Artzi, [email protected]
This document file includes:
Supplementary Figures S1 to S29
Additional references
Self-assembled RNA-triple-helix hydrogelscaffold for microRNA modulation in the
tumour microenvironment
SUPPLEMENTARY INFORMATIONDOI: 10.1038/NMAT4497
NATURE MATERIALS | www.nature.com/naturematerials 1
© 2015 Macmillan Publishers Limited. All rights reserved
2
Figure S1. Characterization of RNA-dendrimer nanoconjugates. (a-d) High-resolution SEM images of the
3D structure of the RNA triple-helix formations. The samples were coated with gold (10-15 nm thickness).
Micron level RNA aggregates (a-c) are formed by interactions between the RNA triplex nanoparticles (d).
© 2015 Macmillan Publishers Limited. All rights reserved
3
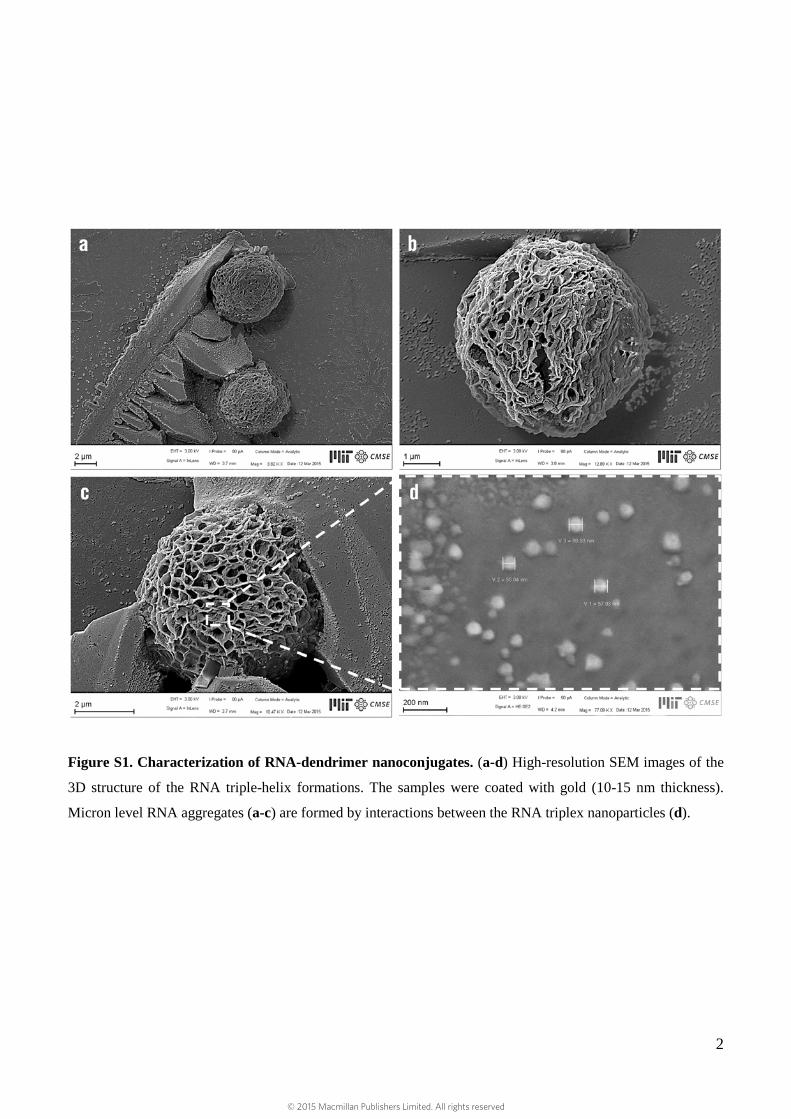
Figure S2. Characterization of naked dendrimer and RNA-dendrimer nanoconjugates. Cryo-EM images
of naked PAMAM dendrimer with 5.3±0.7 nm in diameter (a-b) and RNA triple-helix dendrimer nanoconjugates
52.2±2.4 nm in diameter (c-d). Scale bars, 50 nm. (e) Fluorescence microscope image of RNA triple-helix
dendrimer nanoconjugates after staining with SYBR Green II RNA stain, an RNA-specific dye. Scale bar, 50
nm.
© 2015 Macmillan Publishers Limited. All rights reserved
4
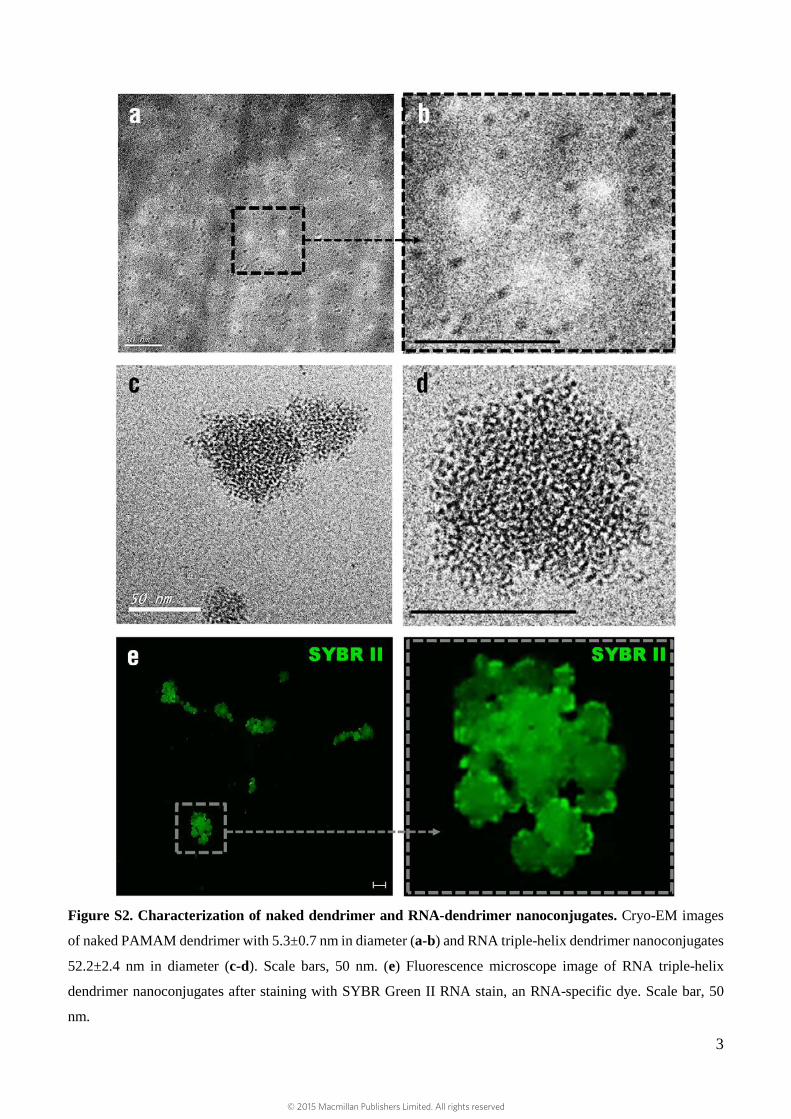
Figure S3. Characterization of RNA nanoconjugates embedded on dextran-dendrimer scaffolds. (a-g)
High-resolution SEM images of the 3D structure of the RNA triple-helix formations doped on the dextran-
dendrimer hydrogel scaffolds. The samples were coated with gold/palladium (10-15 nm thickness).
© 2015 Macmillan Publishers Limited. All rights reserved
5
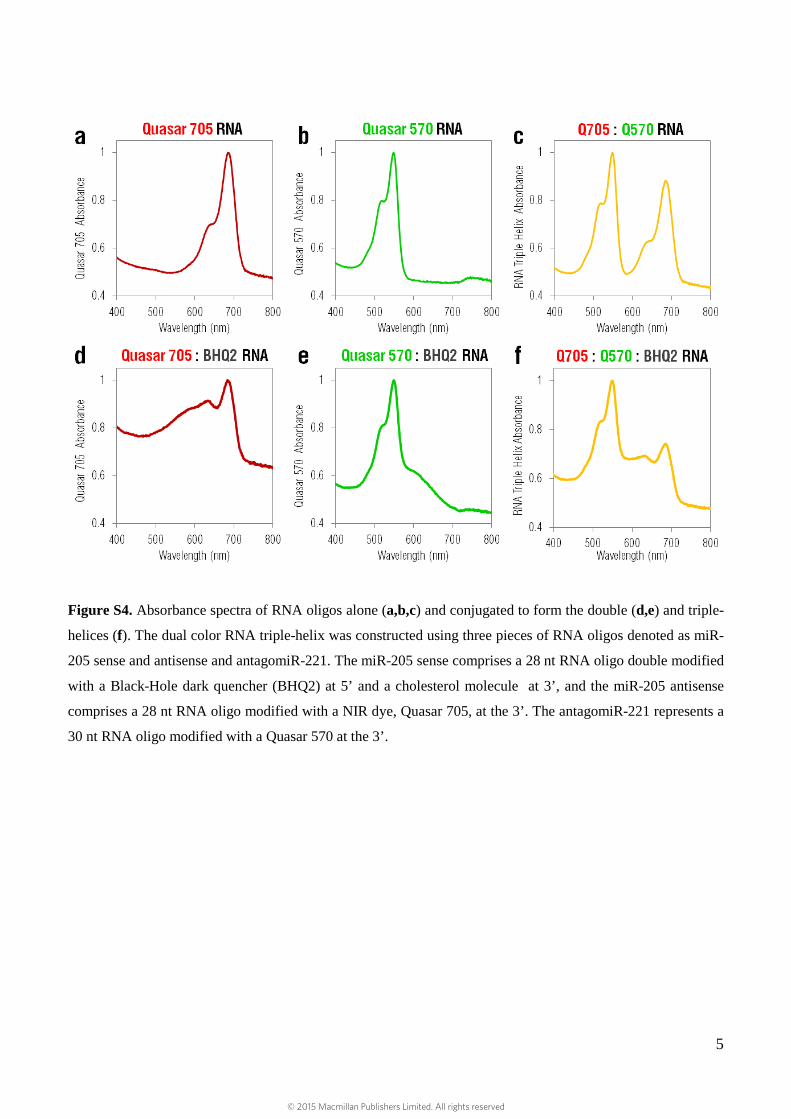
Figure S4. Absorbance spectra of RNA oligos alone (a,b,c) and conjugated to form the double (d,e) and triple-
helices (f). The dual color RNA triple-helix was constructed using three pieces of RNA oligos denoted as miR-
205 sense and antisense and antagomiR-221. The miR-205 sense comprises a 28 nt RNA oligo double modified
with a Black-Hole dark quencher (BHQ2) at 5’ and a cholesterol molecule at 3’, and the miR-205 antisense
comprises a 28 nt RNA oligo modified with a NIR dye, Quasar 705, at the 3’. The antagomiR-221 represents a
30 nt RNA oligo modified with a Quasar 570 at the 3’.
© 2015 Macmillan Publishers Limited. All rights reserved
6
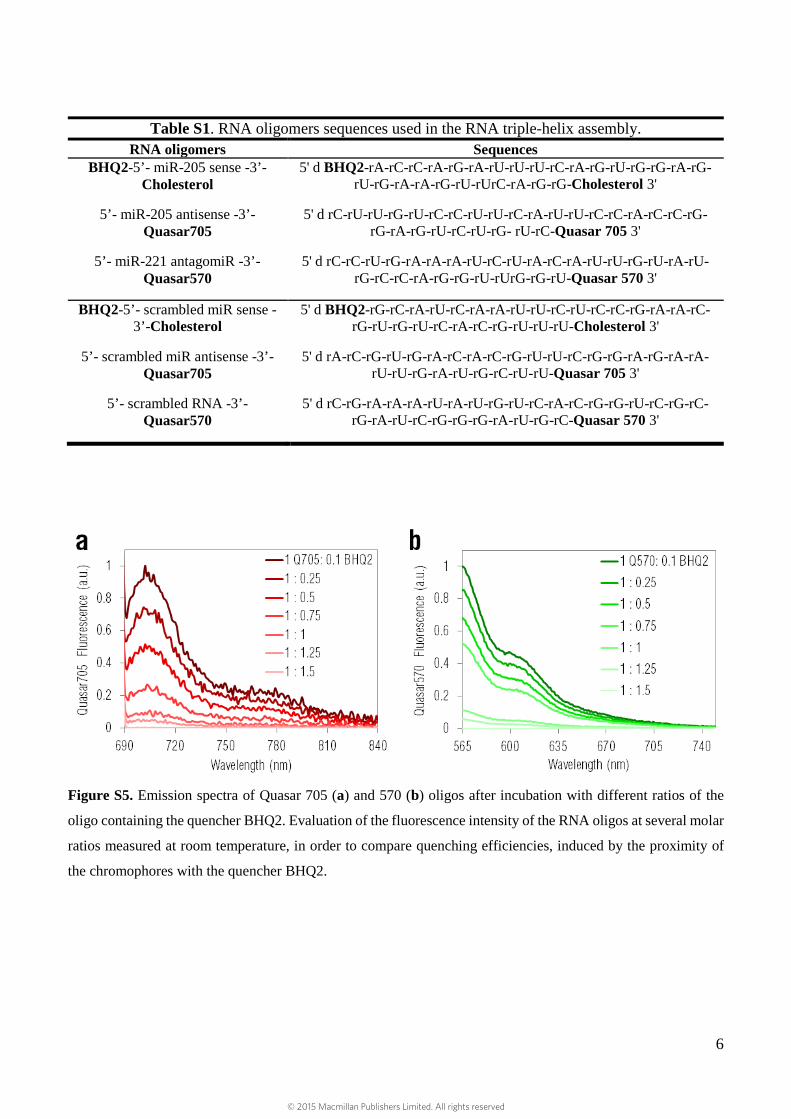
Table S1. RNA oligomers sequences used in the RNA triple-helix assembly. RNA oligomers Sequences
BHQ2-5’- miR-205 sense -3’-Cholesterol
5' d BHQ2-rA-rC-rC-rA-rG-rA-rU-rU-rU-rC-rA-rG-rU-rG-rG-rA-rG-rU-rG-rA-rA-rG-rU-rUrC-rA-rG-rG-Cholesterol 3'
5’- miR-205 antisense -3’-Quasar705
5' d rC-rU-rU-rG-rU-rC-rC-rU-rU-rC-rA-rU-rU-rC-rC-rA-rC-rC-rG-rG-rA-rG-rU-rC-rU-rG- rU-rC-Quasar 705 3'
5’- miR-221 antagomiR -3’-Quasar570
5' d rC-rC-rU-rG-rA-rA-rA-rU-rC-rU-rA-rC-rA-rU-rU-rG-rU-rA-rU-rG-rC-rC-rA-rG-rG-rU-rUrG-rG-rU-Quasar 570 3'
BHQ2-5’- scrambled miR sense -3’-Cholesterol
5' d BHQ2-rG-rC-rA-rU-rC-rA-rA-rU-rU-rC-rU-rC-rC-rG-rA-rA-rC-rG-rU-rG-rU-rC-rA-rC-rG-rU-rU-rU-Cholesterol 3'
5’- scrambled miR antisense -3’-Quasar705
5' d rA-rC-rG-rU-rG-rA-rC-rA-rC-rG-rU-rU-rC-rG-rG-rA-rG-rA-rA-rU-rU-rG-rA-rU-rG-rC-rU-rU-Quasar 705 3'
5’- scrambled RNA -3’-Quasar570
5' d rC-rG-rA-rA-rA-rU-rA-rU-rG-rU-rC-rA-rC-rG-rG-rU-rC-rG-rC-rG-rA-rU-rC-rG-rG-rG-rA-rU-rG-rC-Quasar 570 3'
Figure S5. Emission spectra of Quasar 705 (a) and 570 (b) oligos after incubation with different ratios of the
oligo containing the quencher BHQ2. Evaluation of the fluorescence intensity of the RNA oligos at several molar
ratios measured at room temperature, in order to compare quenching efficiencies, induced by the proximity of
the chromophores with the quencher BHQ2.
© 2015 Macmillan Publishers Limited. All rights reserved
7
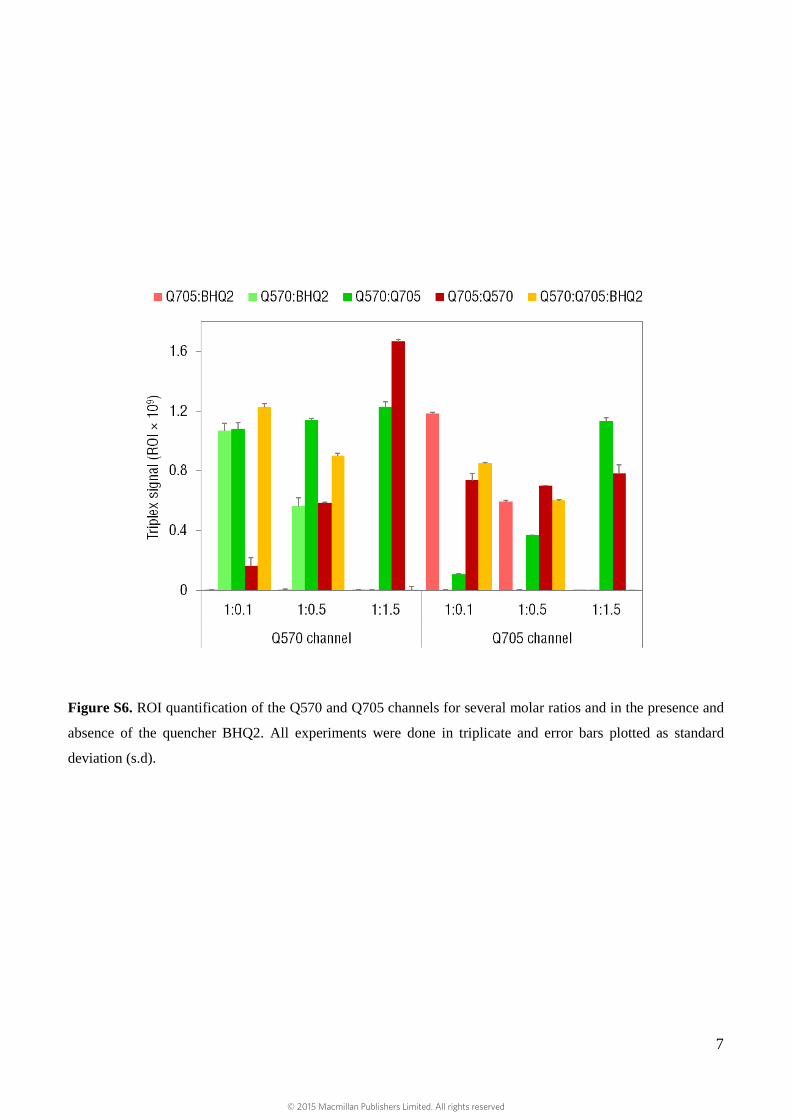
Figure S6. ROI quantification of the Q570 and Q705 channels for several molar ratios and in the presence and
absence of the quencher BHQ2. All experiments were done in triplicate and error bars plotted as standard
deviation (s.d).
© 2015 Macmillan Publishers Limited. All rights reserved
8
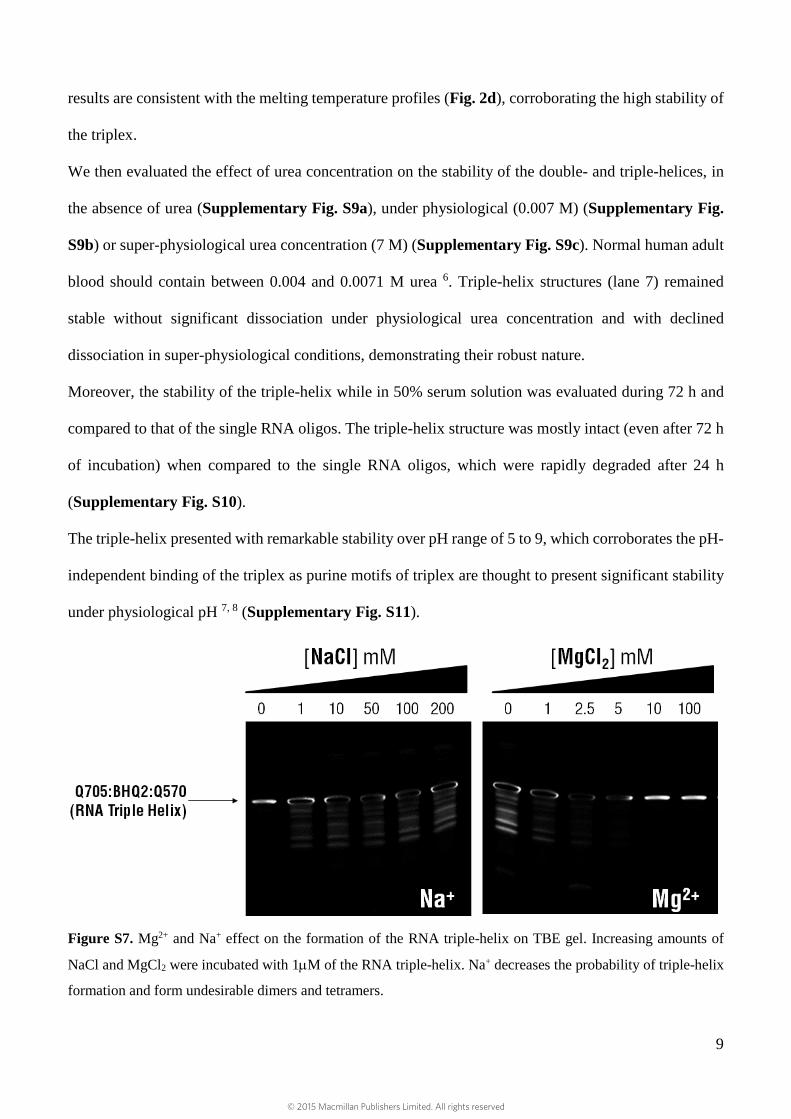
Characterization and competition assays: (Supplementary Figs. S7 to S11)
Efficient formation of the triple-helix composed of the three oligos, miR-205 sense and antisense and
antagomiR-221, occurs at a 1:1:1 molar ratio at room temperature in incubation buffer, 10 mM Tris
buffer (pH 7) supplemented with 10 mM MgCl2, 1 mM spermine and 0.8 mM of CuSO4. The copper
ions were introduced to favor the intercalation of the nitrogen atoms in the minor groove of the triplex
where copper binding occurs 1. The spermine is a natural polyamine used to improve triplex formation,
by reducing the electrostatic repulsive forces between the negatively charged phosphate backbones of
the RNA strands 2. The interaction between Mg2+, Na+, or a combination of the two and the DNA triple-
helix has been thoroughly investigated 3, 4. Mg2+ was included in the incubation buffer (10 mM MgCl2)
since it is considered to be an enhancer of DNA triple-helix formation. The main mechanism of
stabilization is charge neutralization given that the DNA triple helix has a higher charge density than
that of either duplex or single stranded DNA. Additionally, Mg2+ binds to the phosphate groups,
reducing the repulsion between the three phosphate frameworks increasing the efficiency of the triple-
helix formation (Supplementary Fig. S7). Contrary to the Mg2+ effect, Na+ has been appointed as an
inhibitor of the DNA triple-helix formation (Supplementary Fig. S7). The hindering effect of Na+
against forming triple-helix can be explained by the polyelectrolyte effect: a high concentration of Na+
lowers the population of Mg2+ in the vicinity of DNA or RNA, decreasing the probability of triple-helix
formation. Na+ also has the ability to form undesirable dimers and tetramers, decreasing the efficiency
of triplex formation 5 as also confirmed herein (Supplementary Fig. S7).
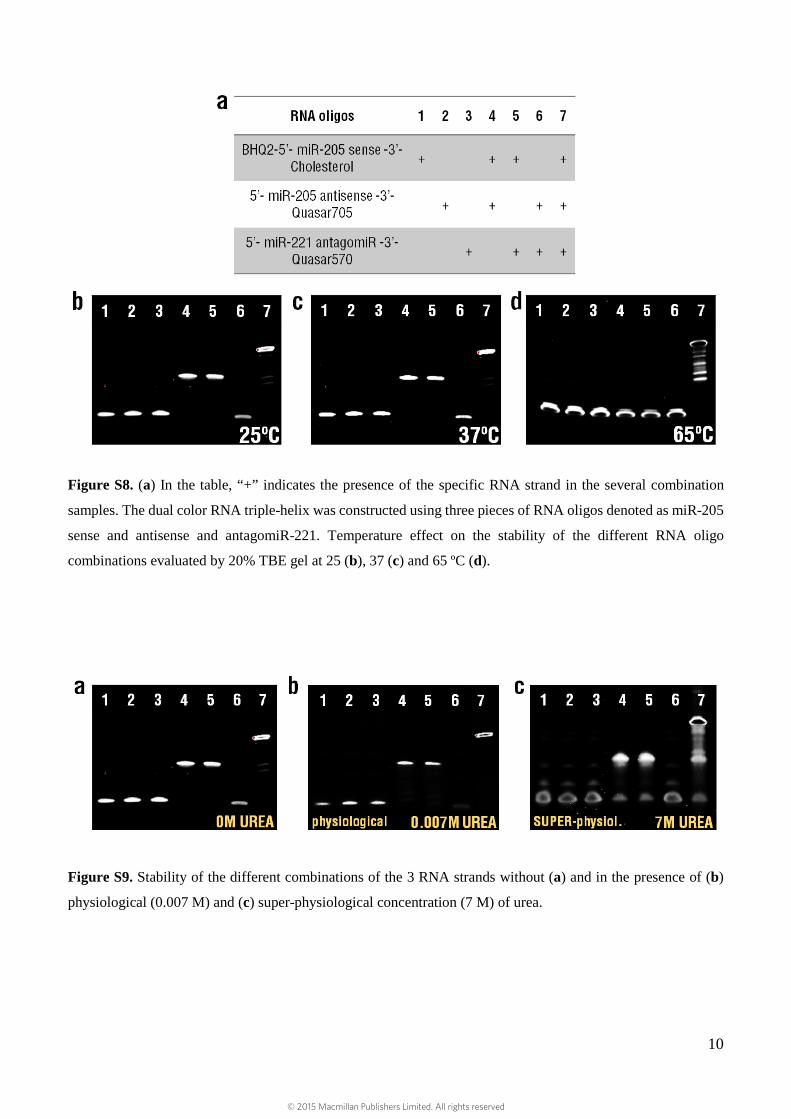
The effect of temperature on the stability of the triple-helix was also evaluated by gel electrophoresis.
A fixed concentration of the different combinations of the RNA oligos (1µM) was incubated at 25, 37
and 65ºC. At room temperature of 25ºC and at 37ºC, the stability of the triple-helix and the double-
helices was identical (Supplementary Fig. S8). At 65ºC (close to the Tm of the double-helix formed
between miR-205 sense as well as antisense and between miR-205 sense and antagomiR-221),
dissociation of the double-helix occurs with no changes in stability for the triple-helix structure. These
© 2015 Macmillan Publishers Limited. All rights reserved
9
results are consistent with the melting temperature profiles (Fig. 2d), corroborating the high stability of
the triplex.
We then evaluated the effect of urea concentration on the stability of the double- and triple-helices, in
the absence of urea (Supplementary Fig. S9a), under physiological (0.007 M) (Supplementary Fig.
S9b) or super-physiological urea concentration (7 M) (Supplementary Fig. S9c). Normal human adult
blood should contain between 0.004 and 0.0071 M urea 6. Triple-helix structures (lane 7) remained
stable without significant dissociation under physiological urea concentration and with declined
dissociation in super-physiological conditions, demonstrating their robust nature.
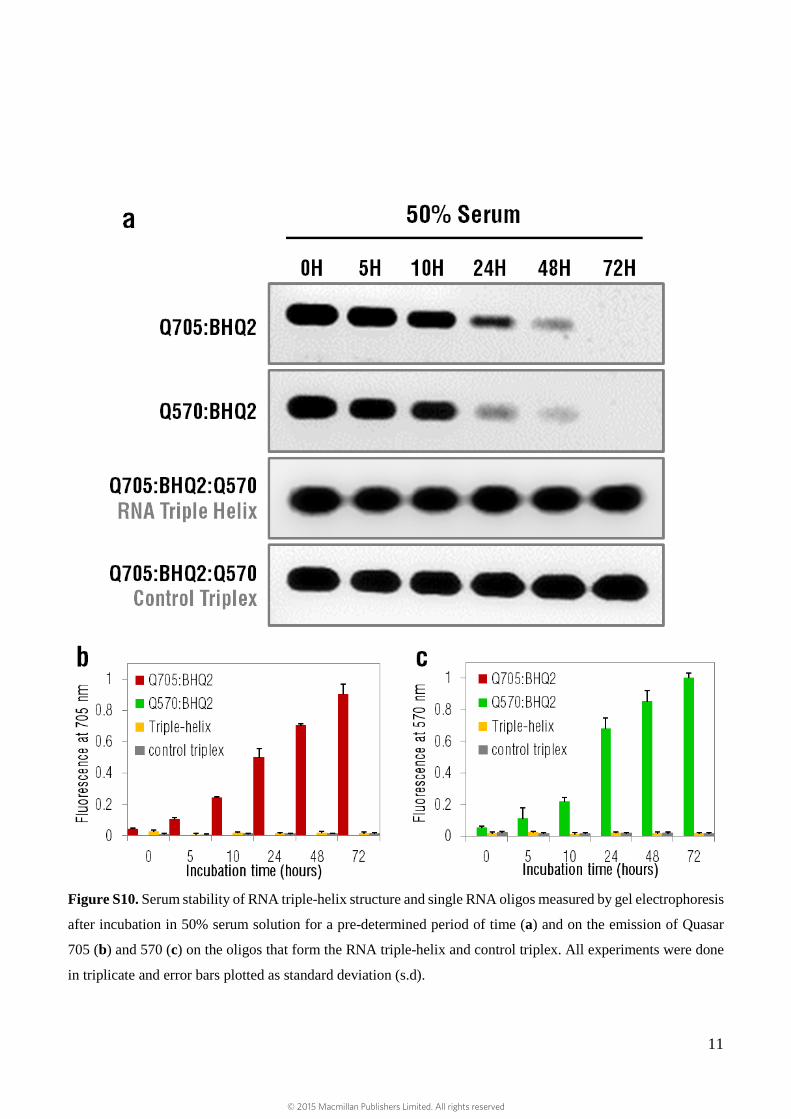
Moreover, the stability of the triple-helix while in 50% serum solution was evaluated during 72 h and
compared to that of the single RNA oligos. The triple-helix structure was mostly intact (even after 72 h
of incubation) when compared to the single RNA oligos, which were rapidly degraded after 24 h
(Supplementary Fig. S10).
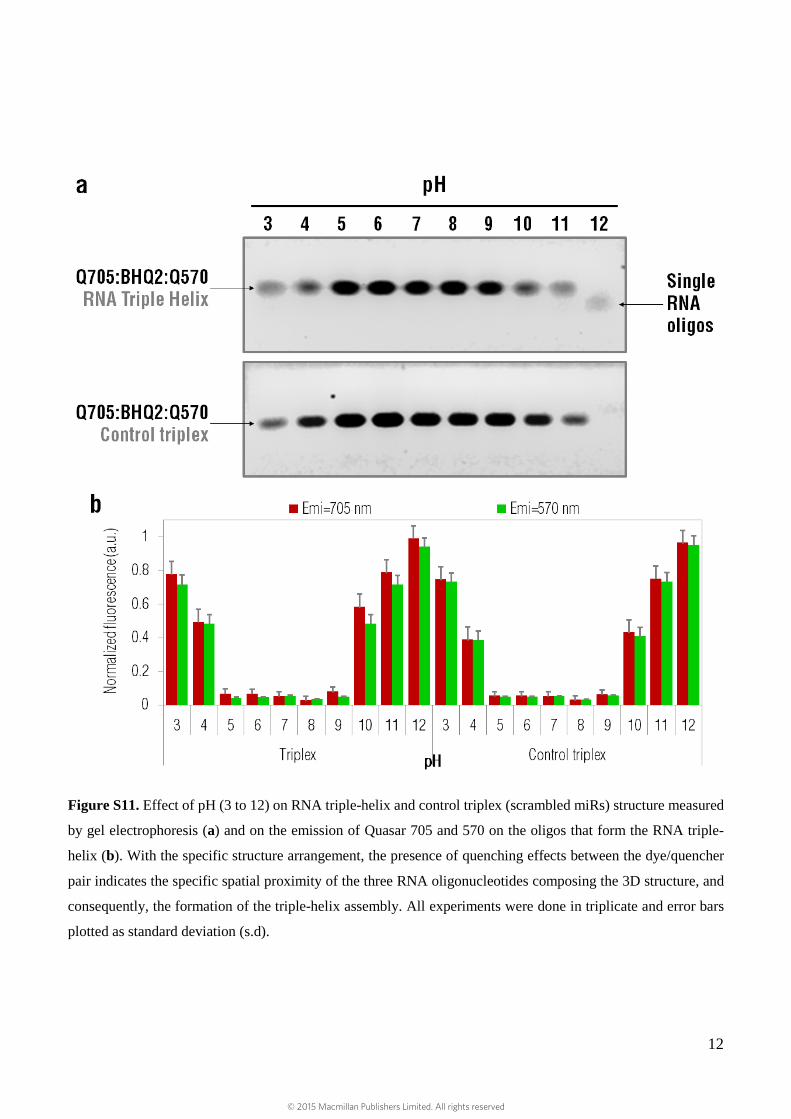
The triple-helix presented with remarkable stability over pH range of 5 to 9, which corroborates the pH-
independent binding of the triplex as purine motifs of triplex are thought to present significant stability
under physiological pH 7, 8 (Supplementary Fig. S11).
Figure S7. Mg2+ and Na+ effect on the formation of the RNA triple-helix on TBE gel. Increasing amounts of
NaCl and MgCl2 were incubated with 1µM of the RNA triple-helix. Na+ decreases the probability of triple-helix
formation and form undesirable dimers and tetramers.
© 2015 Macmillan Publishers Limited. All rights reserved
10
Figure S8. (a) In the table, “+” indicates the presence of the specific RNA strand in the several combination
samples. The dual color RNA triple-helix was constructed using three pieces of RNA oligos denoted as miR-205
sense and antisense and antagomiR-221. Temperature effect on the stability of the different RNA oligo
combinations evaluated by 20% TBE gel at 25 (b), 37 (c) and 65 ºC (d).
Figure S9. Stability of the different combinations of the 3 RNA strands without (a) and in the presence of (b)
physiological (0.007 M) and (c) super-physiological concentration (7 M) of urea.
© 2015 Macmillan Publishers Limited. All rights reserved
11
Figure S10. Serum stability of RNA triple-helix structure and single RNA oligos measured by gel electrophoresis
after incubation in 50% serum solution for a pre-determined period of time (a) and on the emission of Quasar
705 (b) and 570 (c) on the oligos that form the RNA triple-helix and control triplex. All experiments were done
in triplicate and error bars plotted as standard deviation (s.d).
© 2015 Macmillan Publishers Limited. All rights reserved
12
Figure S11. Effect of pH (3 to 12) on RNA triple-helix and control triplex (scrambled miRs) structure measured
by gel electrophoresis (a) and on the emission of Quasar 705 and 570 on the oligos that form the RNA triple-
helix (b). With the specific structure arrangement, the presence of quenching effects between the dye/quencher
pair indicates the specific spatial proximity of the three RNA oligonucleotides composing the 3D structure, and
consequently, the formation of the triple-helix assembly. All experiments were done in triplicate and error bars
plotted as standard deviation (s.d).
© 2015 Macmillan Publishers Limited. All rights reserved

13
Figure S12. AGO2 and DICER activity. TBE gel electrophoresis of RNA triple-helix structures were incubated
with recombinant human Dicer (a) and AGO2/EIF2C2 enzymes (c). Fluorescence spectra of the RNA triple-
helix incubated with increasing amounts of Dicer (b) and AGO2/EIF2C2 (d) enzymes. All experiments were
done in triplicate and error bars plotted as standard deviation (s.d).
The fluorescence signal of the dyes present in the triple-helix (Q570 and Q705) is activated only at high AGO2
concentrations. AGO2 is the only enzyme able to recognize and cleave the ~20-30 nt RNA oligos into ~9-10
oligo fragments. The Dicer is not able to recognize ~20-30 nt RNA oligos (only dsRNAs larger than 300 nt), as
confirmed by the absence of RNA cleaved products (a) and by the absence of fluorescence signal from the triple-
helix dyes (b). These results confirm the key role of AGO2 in the recognition of the RNA triple-helix
© 2015 Macmillan Publishers Limited. All rights reserved
14
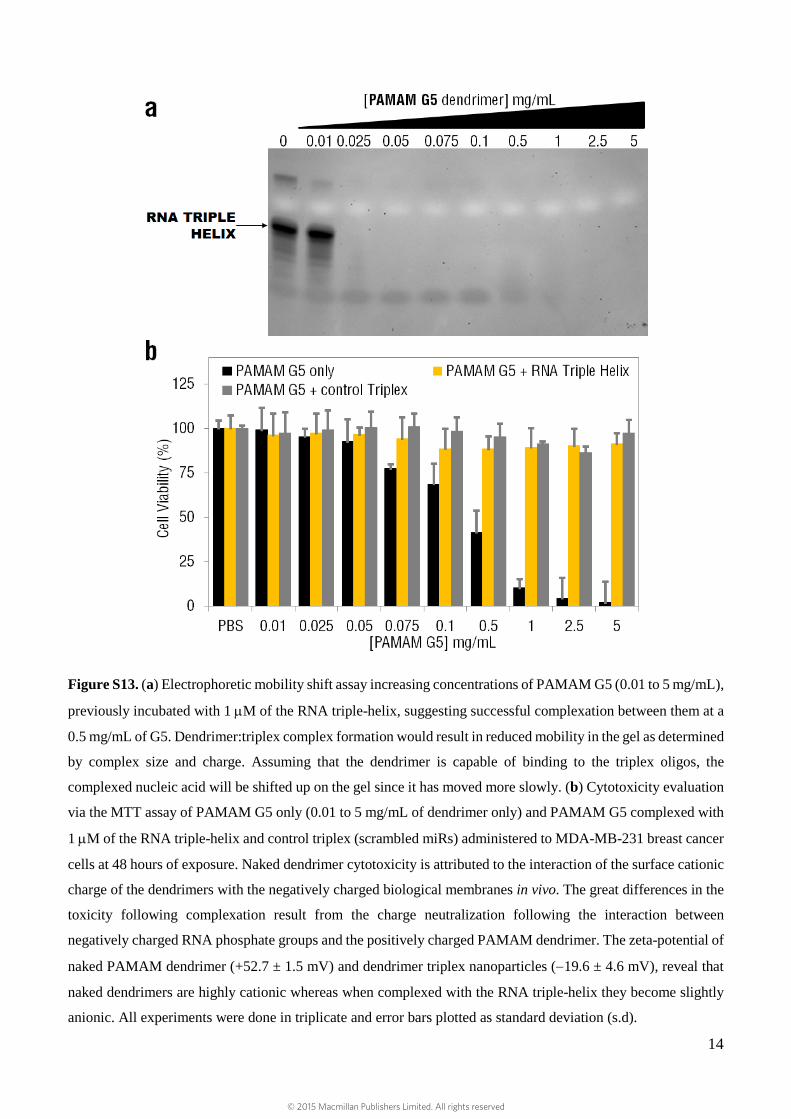
Figure S13. (a) Electrophoretic mobility shift assay increasing concentrations of PAMAM G5 (0.01 to 5 mg/mL),
previously incubated with 1 µM of the RNA triple-helix, suggesting successful complexation between them at a
0.5 mg/mL of G5. Dendrimer:triplex complex formation would result in reduced mobility in the gel as determined
by complex size and charge. Assuming that the dendrimer is capable of binding to the triplex oligos, the
complexed nucleic acid will be shifted up on the gel since it has moved more slowly. (b) Cytotoxicity evaluation
via the MTT assay of PAMAM G5 only (0.01 to 5 mg/mL of dendrimer only) and PAMAM G5 complexed with
1 µM of the RNA triple-helix and control triplex (scrambled miRs) administered to MDA-MB-231 breast cancer
cells at 48 hours of exposure. Naked dendrimer cytotoxicity is attributed to the interaction of the surface cationic
charge of the dendrimers with the negatively charged biological membranes in vivo. The great differences in the
toxicity following complexation result from the charge neutralization following the interaction between
negatively charged RNA phosphate groups and the positively charged PAMAM dendrimer. The zeta-potential of
naked PAMAM dendrimer (+52.7 ± 1.5 mV) and dendrimer triplex nanoparticles (−19.6 ± 4.6 mV), reveal that
naked dendrimers are highly cationic whereas when complexed with the RNA triple-helix they become slightly
anionic. All experiments were done in triplicate and error bars plotted as standard deviation (s.d).
© 2015 Macmillan Publishers Limited. All rights reserved
15
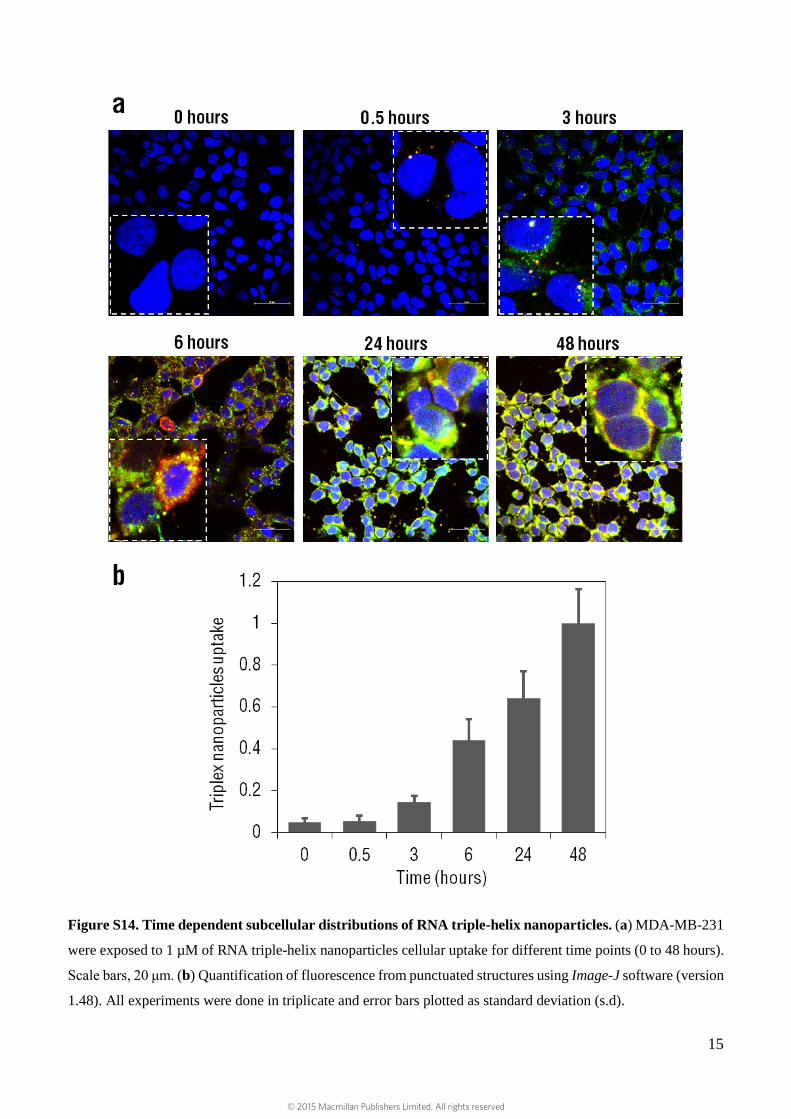
Figure S14. Time dependent subcellular distributions of RNA triple-helix nanoparticles. (a) MDA-MB-231
were exposed to 1 µM of RNA triple-helix nanoparticles cellular uptake for different time points (0 to 48 hours).
Scale bars, 20 μm. (b) Quantification of fluorescence from punctuated structures using Image-J software (version
1.48). All experiments were done in triplicate and error bars plotted as standard deviation (s.d).
© 2015 Macmillan Publishers Limited. All rights reserved
16
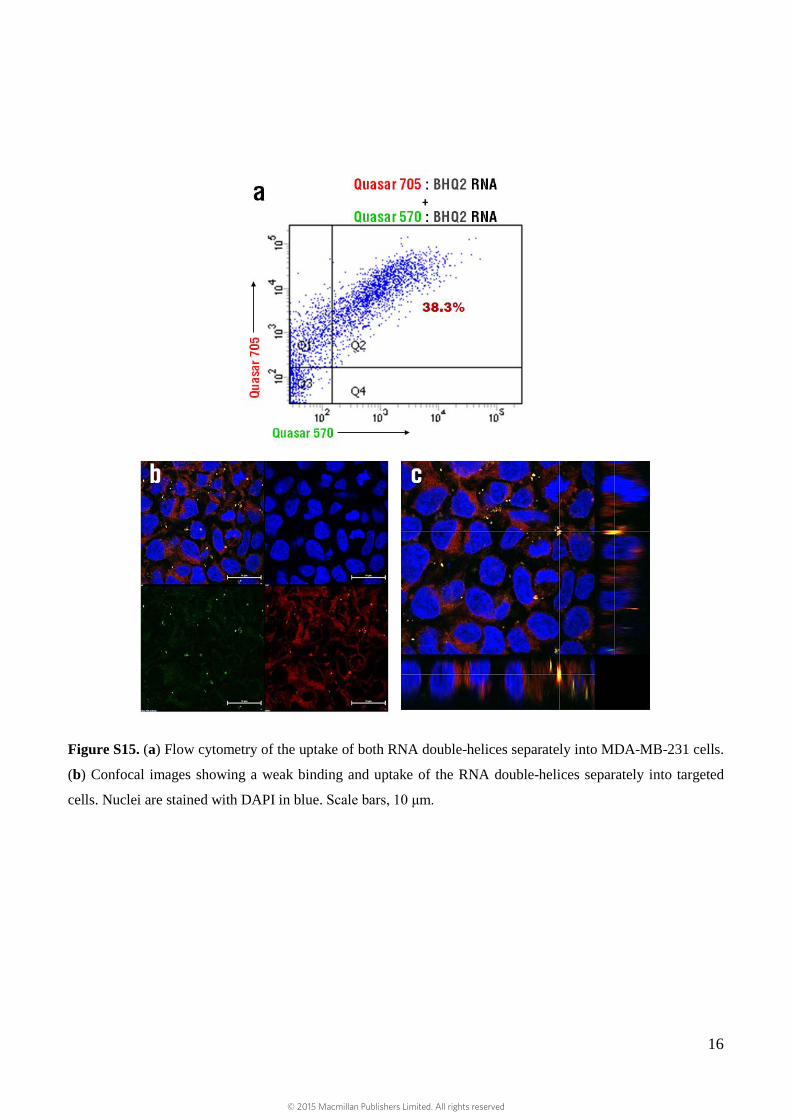
Figure S15. (a) Flow cytometry of the uptake of both RNA double-helices separately into MDA-MB-231 cells.
(b) Confocal images showing a weak binding and uptake of the RNA double-helices separately into targeted
cells. Nuclei are stained with DAPI in blue. Scale bars, 10 μm.
© 2015 Macmillan Publishers Limited. All rights reserved
17
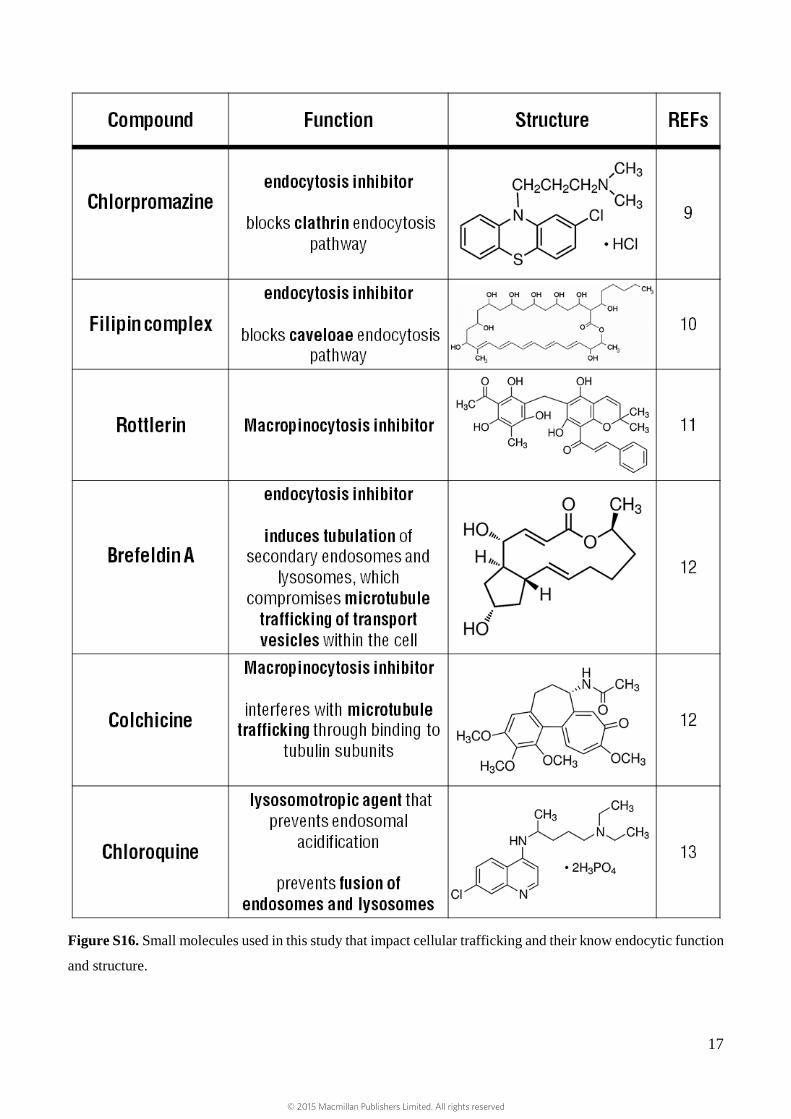
Figure S16. Small molecules used in this study that impact cellular trafficking and their know endocytic function
and structure.
© 2015 Macmillan Publishers Limited. All rights reserved
18
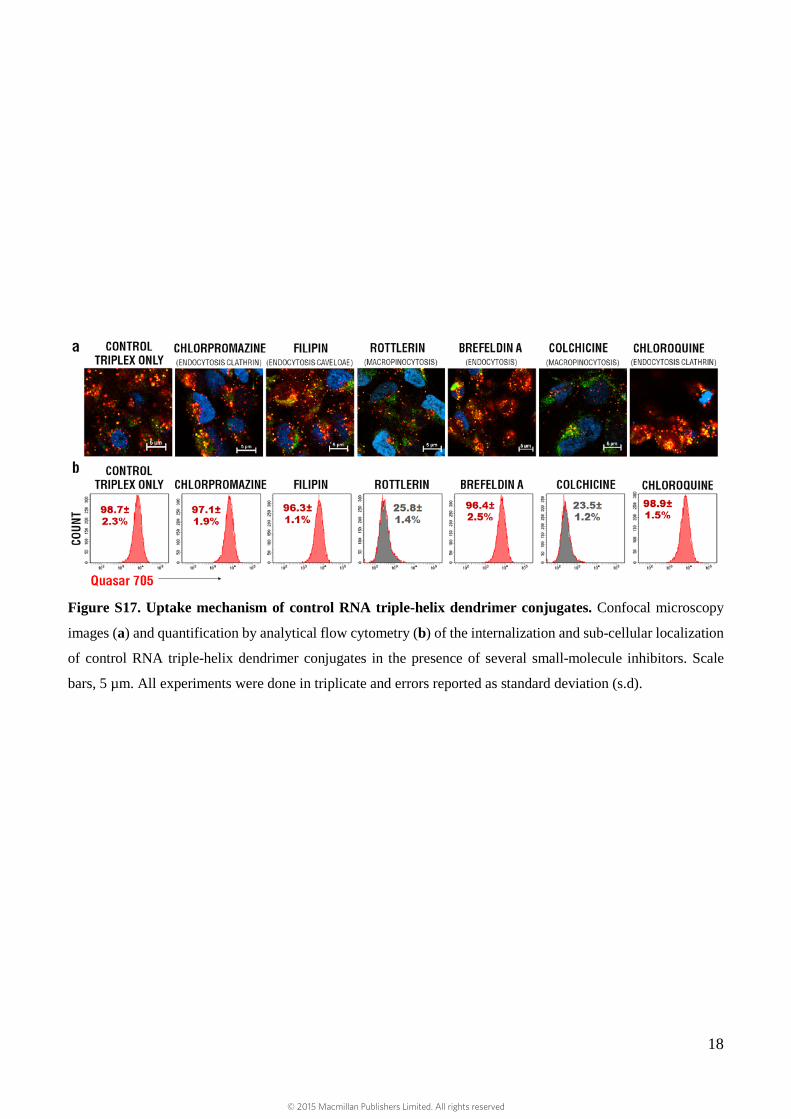
Figure S17. Uptake mechanism of control RNA triple-helix dendrimer conjugates. Confocal microscopy
images (a) and quantification by analytical flow cytometry (b) of the internalization and sub-cellular localization
of control RNA triple-helix dendrimer conjugates in the presence of several small-molecule inhibitors. Scale
bars, 5 µm. All experiments were done in triplicate and errors reported as standard deviation (s.d).
© 2015 Macmillan Publishers Limited. All rights reserved
19
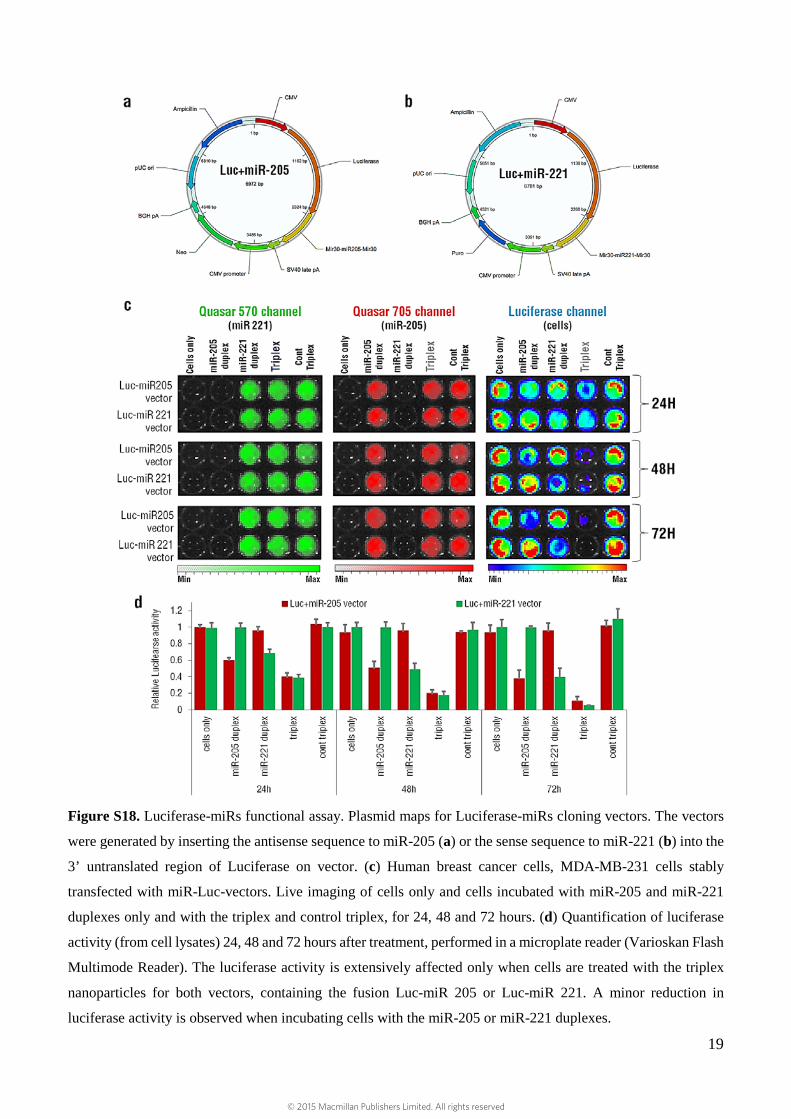
Figure S18. Luciferase-miRs functional assay. Plasmid maps for Luciferase-miRs cloning vectors. The vectors
were generated by inserting the antisense sequence to miR-205 (a) or the sense sequence to miR-221 (b) into the
3’ untranslated region of Luciferase on vector. (c) Human breast cancer cells, MDA-MB-231 cells stably
transfected with miR-Luc-vectors. Live imaging of cells only and cells incubated with miR-205 and miR-221
duplexes only and with the triplex and control triplex, for 24, 48 and 72 hours. (d) Quantification of luciferase
activity (from cell lysates) 24, 48 and 72 hours after treatment, performed in a microplate reader (Varioskan Flash
Multimode Reader). The luciferase activity is extensively affected only when cells are treated with the triplex
nanoparticles for both vectors, containing the fusion Luc-miR 205 or Luc-miR 221. A minor reduction in
luciferase activity is observed when incubating cells with the miR-205 or miR-221 duplexes.
© 2015 Macmillan Publishers Limited. All rights reserved
20
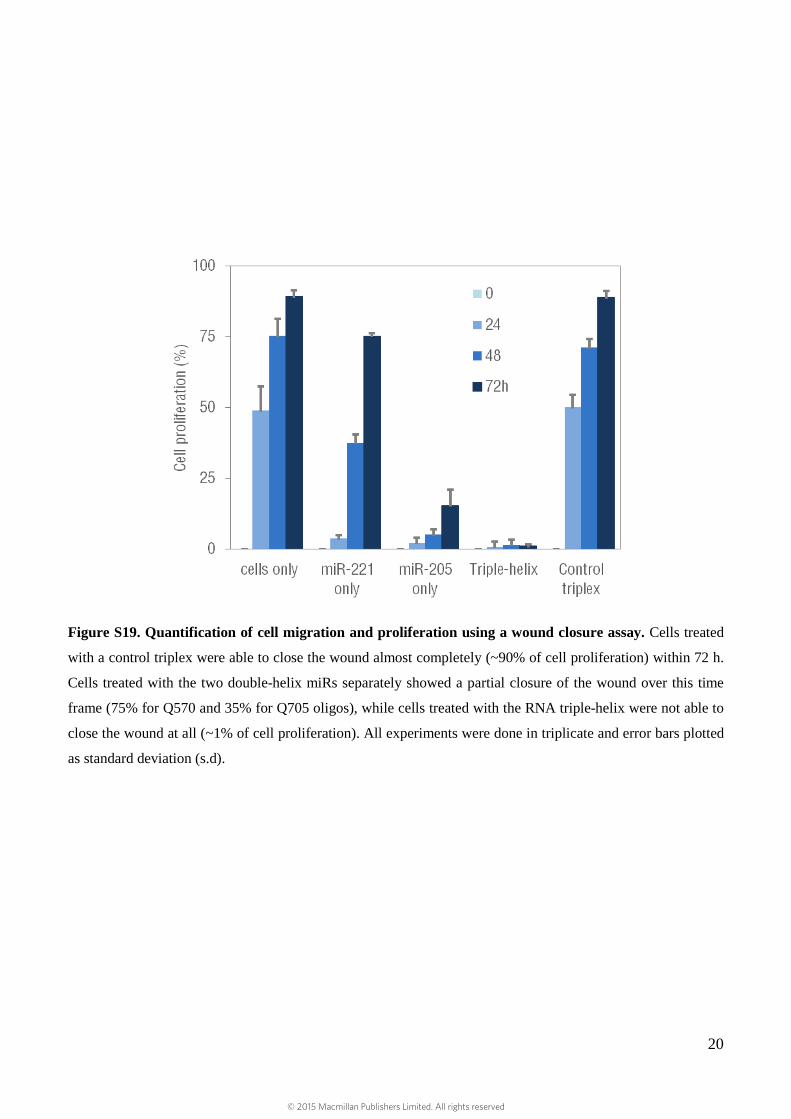
Figure S19. Quantification of cell migration and proliferation using a wound closure assay. Cells treated
with a control triplex were able to close the wound almost completely (~90% of cell proliferation) within 72 h.
Cells treated with the two double-helix miRs separately showed a partial closure of the wound over this time
frame (75% for Q570 and 35% for Q705 oligos), while cells treated with the RNA triple-helix were not able to
close the wound at all (~1% of cell proliferation). All experiments were done in triplicate and error bars plotted
as standard deviation (s.d).
© 2015 Macmillan Publishers Limited. All rights reserved
21
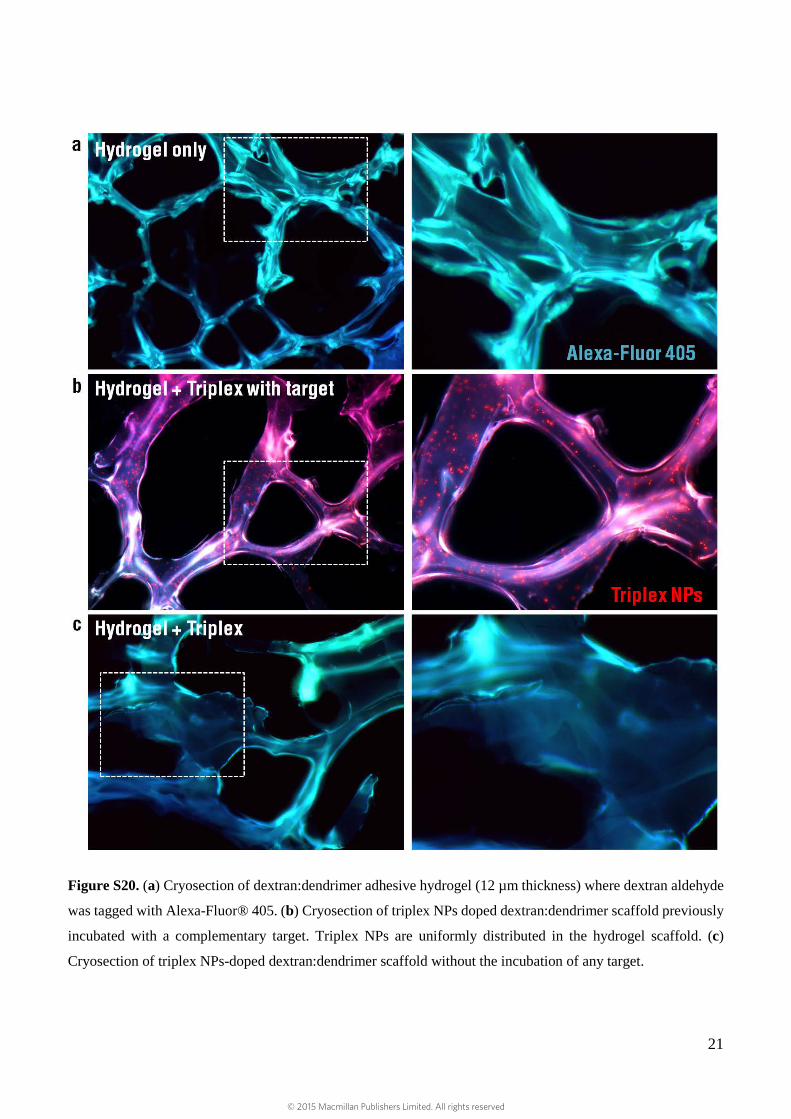
Figure S20. (a) Cryosection of dextran:dendrimer adhesive hydrogel (12 µm thickness) where dextran aldehyde
was tagged with Alexa-Fluor® 405. (b) Cryosection of triplex NPs doped dextran:dendrimer scaffold previously
incubated with a complementary target. Triplex NPs are uniformly distributed in the hydrogel scaffold. (c)
Cryosection of triplex NPs-doped dextran:dendrimer scaffold without the incubation of any target.
© 2015 Macmillan Publishers Limited. All rights reserved
22
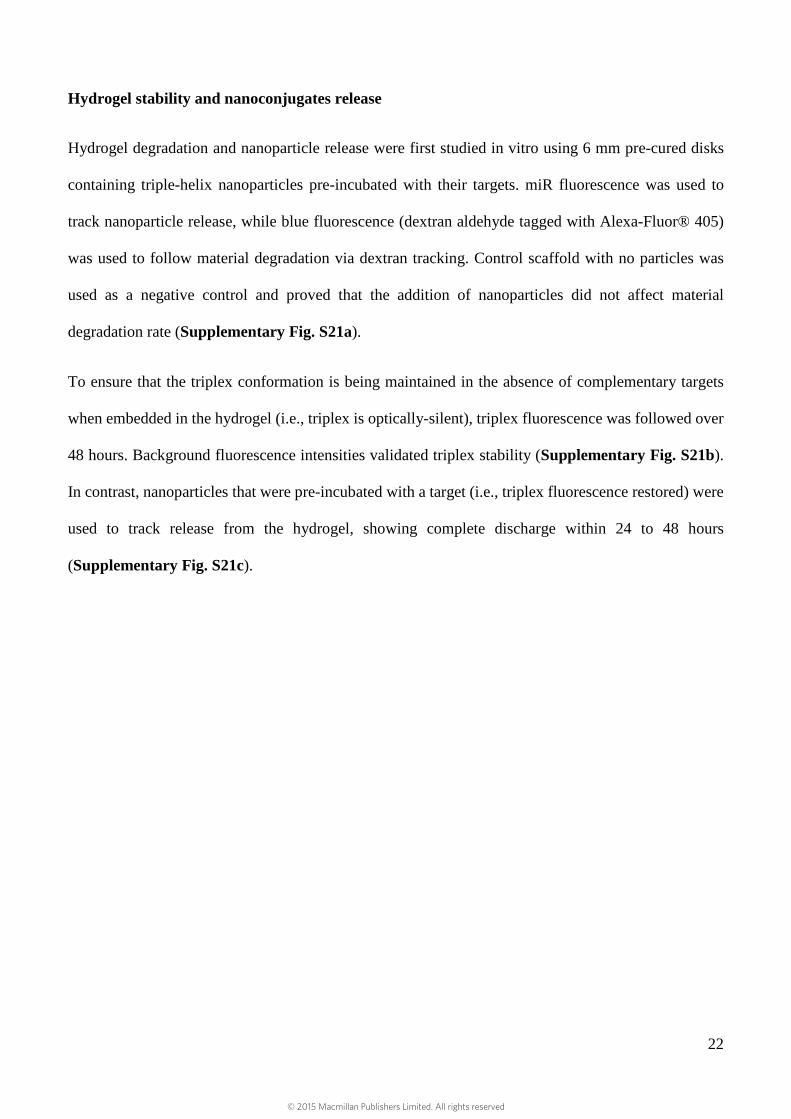
Hydrogel stability and nanoconjugates release
Hydrogel degradation and nanoparticle release were first studied in vitro using 6 mm pre-cured disks
containing triple-helix nanoparticles pre-incubated with their targets. miR fluorescence was used to
track nanoparticle release, while blue fluorescence (dextran aldehyde tagged with Alexa-Fluor® 405)
was used to follow material degradation via dextran tracking. Control scaffold with no particles was
used as a negative control and proved that the addition of nanoparticles did not affect material
degradation rate (Supplementary Fig. S21a).
To ensure that the triplex conformation is being maintained in the absence of complementary targets
when embedded in the hydrogel (i.e., triplex is optically-silent), triplex fluorescence was followed over
48 hours. Background fluorescence intensities validated triplex stability (Supplementary Fig. S21b).
In contrast, nanoparticles that were pre-incubated with a target (i.e., triplex fluorescence restored) were
used to track release from the hydrogel, showing complete discharge within 24 to 48 hours
(Supplementary Fig. S21c).
© 2015 Macmillan Publishers Limited. All rights reserved
23
Figure S21. (a) Hydrogel degradation profile with and without RNA triplex NPs embedded during 20 days (480
hours). (b) Stability assay for the RNA triple-helix without target in the presence of dextran-dendrimer
components of the hydrogel during 48 hours. Emissions at 570 nm and 705 nm were measured for the empty
hydrogels and for the hydrogels embedded with the RNA triple-helix. (c) Release profile of RNA triple-helix
nanoparticles from the dextran:dendrimer scaffold during 2 days (48 hours). An almost complete release in the
first 24-48 hours under physiological conditions in vitro was observed (pH 7.4 and 37 ºC). All experiments were
done in triplicate and error bars plotted as standard deviation (s.d).
© 2015 Macmillan Publishers Limited. All rights reserved
24
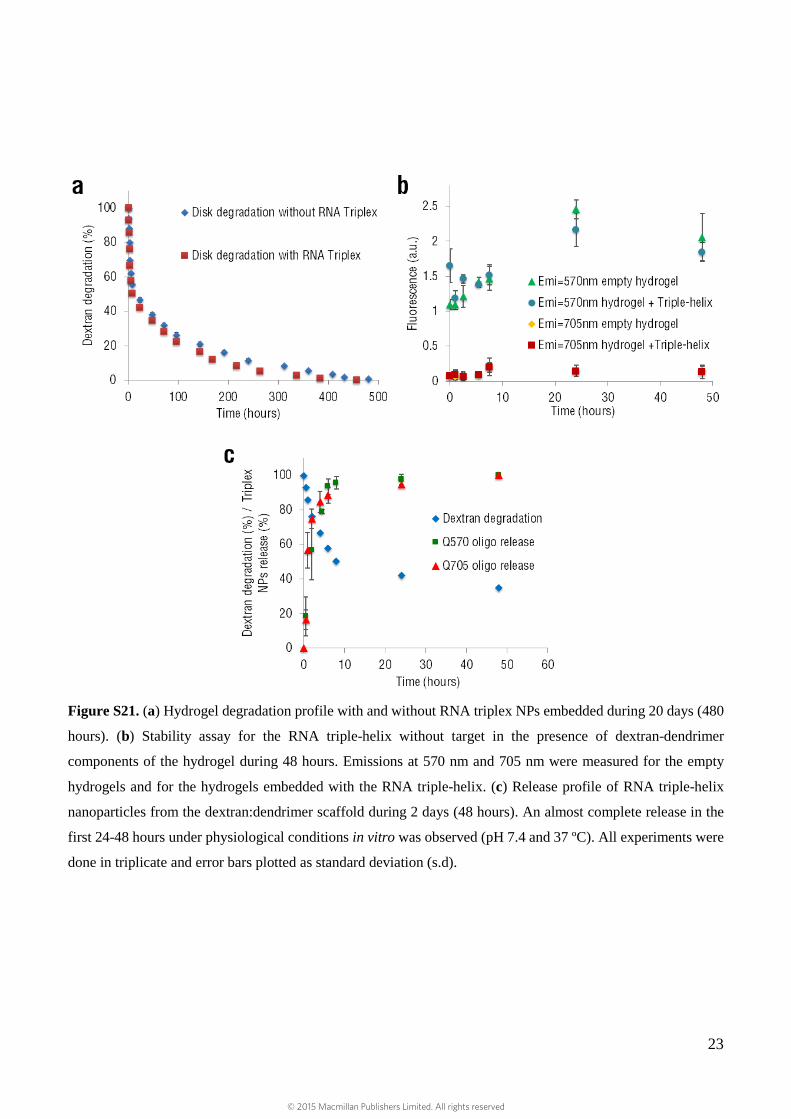
Figure S22. Cytotoxicity via the MTT assay and IC50 determination of breast cancer MDA-MB-231 cells
incubated for 48 hours with (a) paclitaxel (PTX), (b) doxorubicin (DOX) and (c) Avastin® (bevacizumab
monoclonal antibody). All experiments were done in triplicate and error bars plotted as standard deviation (s.d).
© 2015 Macmillan Publishers Limited. All rights reserved
25
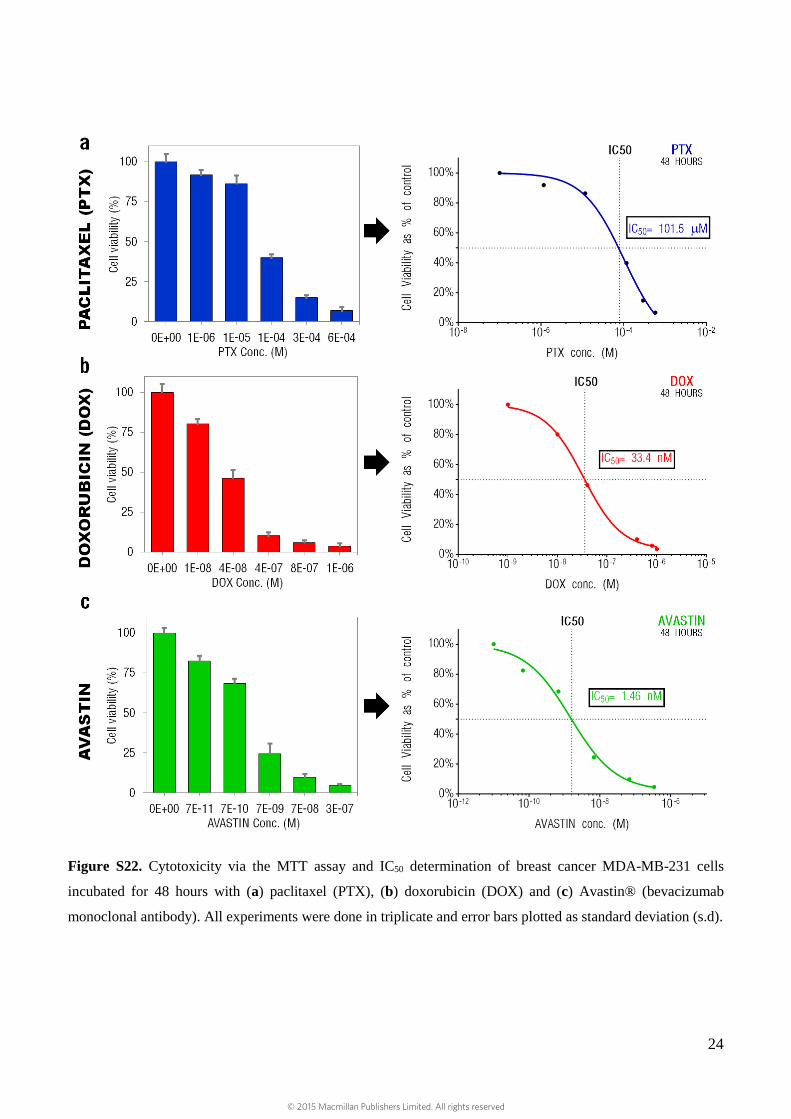
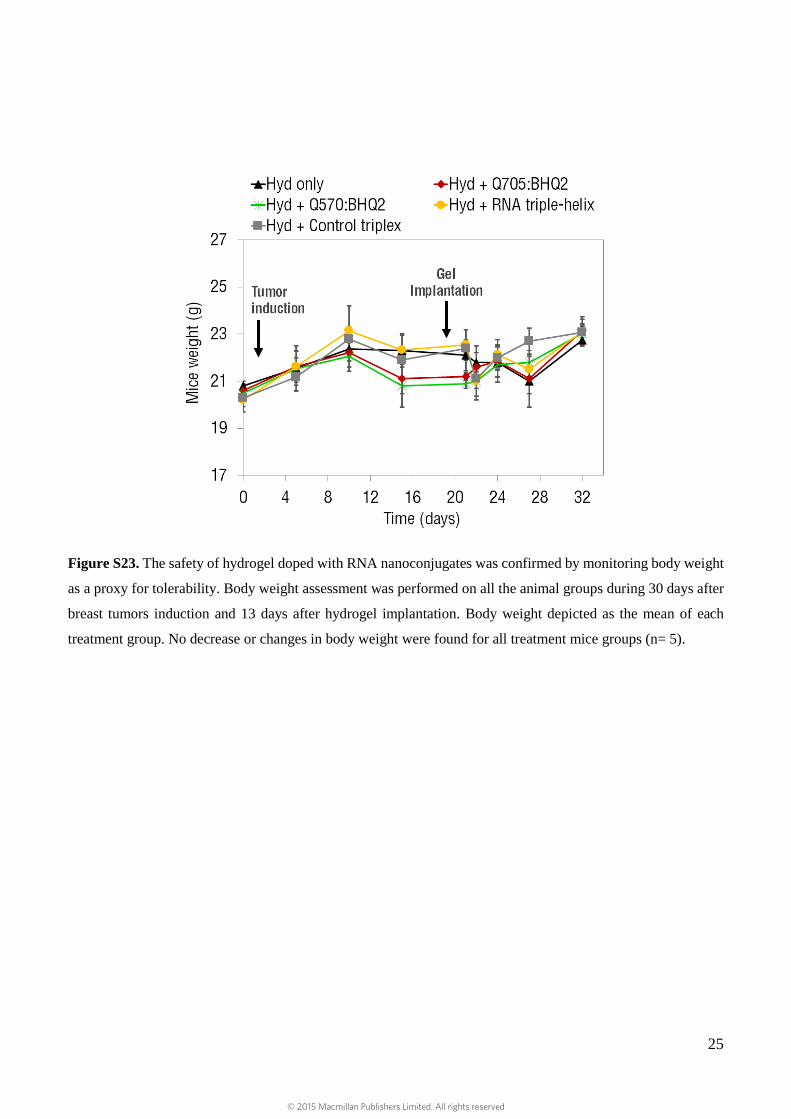
Figure S23. The safety of hydrogel doped with RNA nanoconjugates was confirmed by monitoring body weight
as a proxy for tolerability. Body weight assessment was performed on all the animal groups during 30 days after
breast tumors induction and 13 days after hydrogel implantation. Body weight depicted as the mean of each
treatment group. No decrease or changes in body weight were found for all treatment mice groups (n= 5).
© 2015 Macmillan Publishers Limited. All rights reserved
26
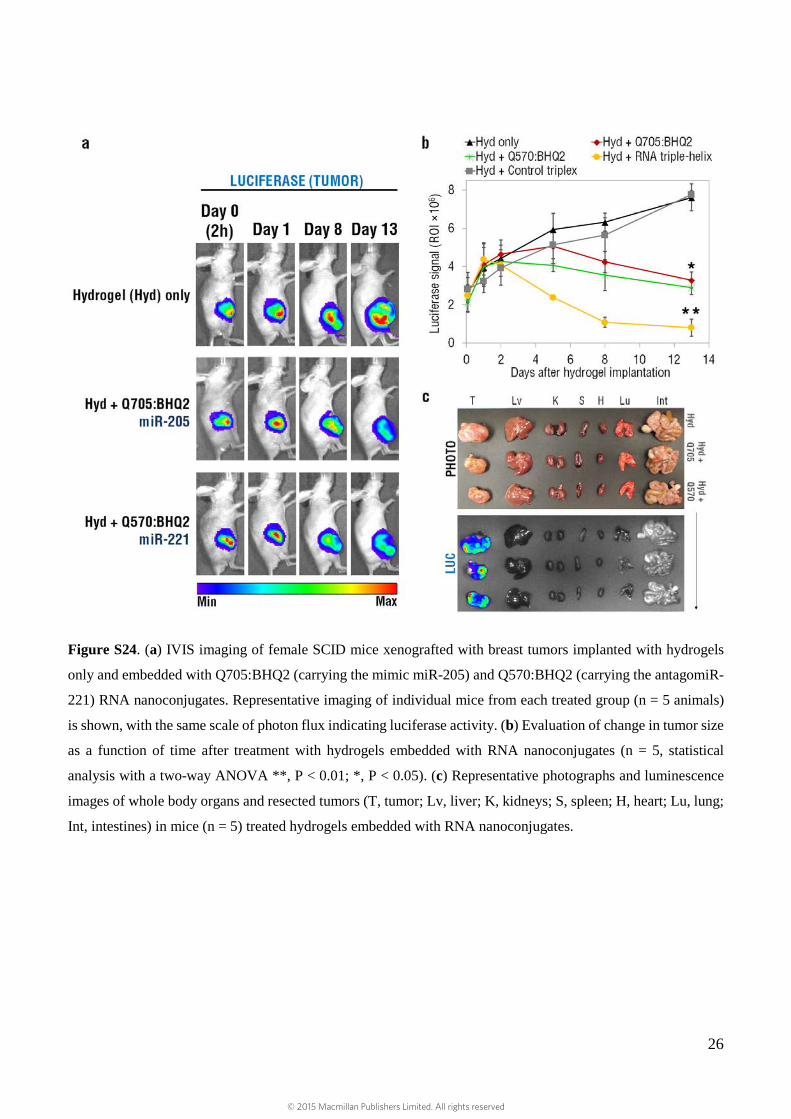
Figure S24. (a) IVIS imaging of female SCID mice xenografted with breast tumors implanted with hydrogels
only and embedded with Q705:BHQ2 (carrying the mimic miR-205) and Q570:BHQ2 (carrying the antagomiR-
221) RNA nanoconjugates. Representative imaging of individual mice from each treated group (n = 5 animals)
is shown, with the same scale of photon flux indicating luciferase activity. (b) Evaluation of change in tumor size
as a function of time after treatment with hydrogels embedded with RNA nanoconjugates (n = 5, statistical
analysis with a two-way ANOVA **, P < 0.01; *, P < 0.05). (c) Representative photographs and luminescence
images of whole body organs and resected tumors (T, tumor; Lv, liver; K, kidneys; S, spleen; H, heart; Lu, lung;
Int, intestines) in mice (n = 5) treated hydrogels embedded with RNA nanoconjugates.
© 2015 Macmillan Publishers Limited. All rights reserved
27
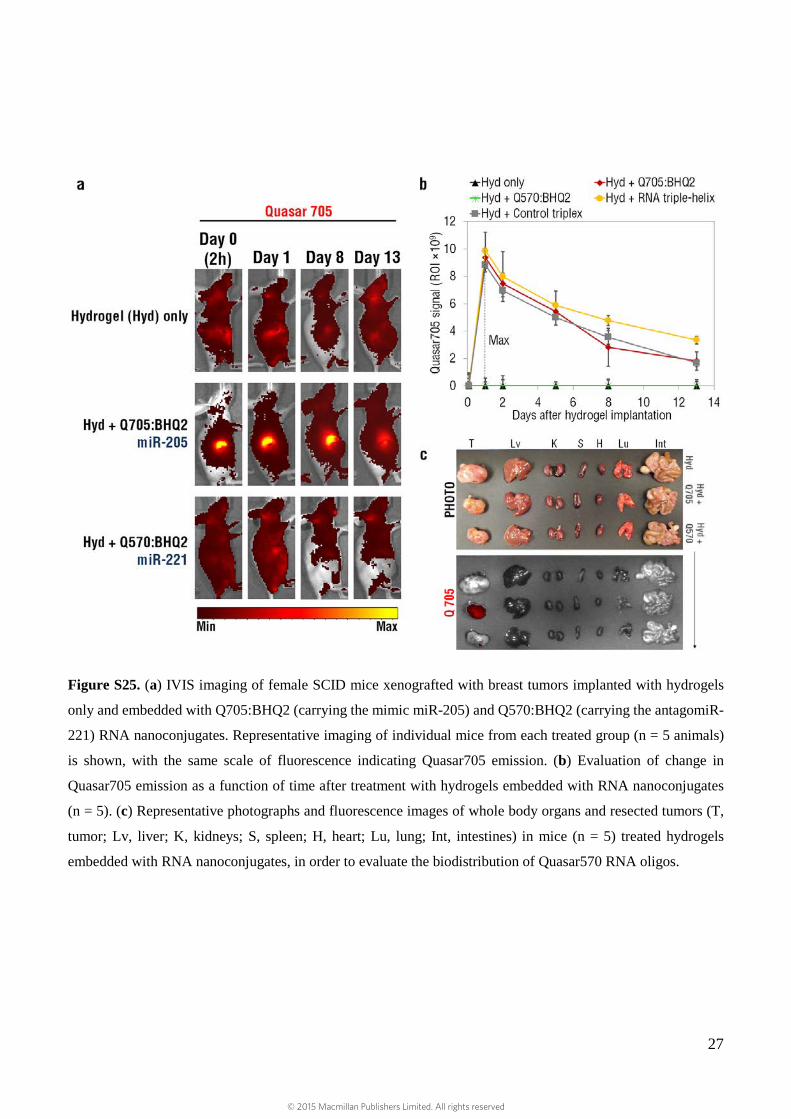
Figure S25. (a) IVIS imaging of female SCID mice xenografted with breast tumors implanted with hydrogels
only and embedded with Q705:BHQ2 (carrying the mimic miR-205) and Q570:BHQ2 (carrying the antagomiR-
221) RNA nanoconjugates. Representative imaging of individual mice from each treated group (n = 5 animals)
is shown, with the same scale of fluorescence indicating Quasar705 emission. (b) Evaluation of change in
Quasar705 emission as a function of time after treatment with hydrogels embedded with RNA nanoconjugates
(n = 5). (c) Representative photographs and fluorescence images of whole body organs and resected tumors (T,
tumor; Lv, liver; K, kidneys; S, spleen; H, heart; Lu, lung; Int, intestines) in mice (n = 5) treated hydrogels
embedded with RNA nanoconjugates, in order to evaluate the biodistribution of Quasar570 RNA oligos.
© 2015 Macmillan Publishers Limited. All rights reserved
28
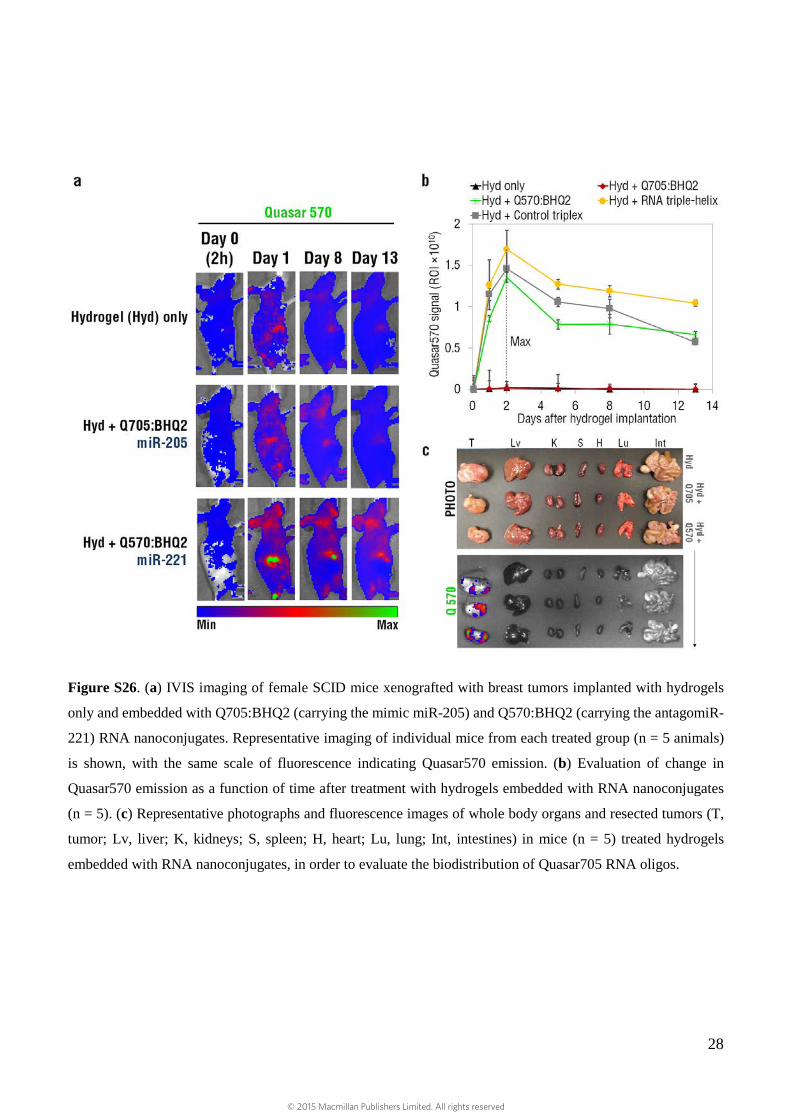
Figure S26. (a) IVIS imaging of female SCID mice xenografted with breast tumors implanted with hydrogels
only and embedded with Q705:BHQ2 (carrying the mimic miR-205) and Q570:BHQ2 (carrying the antagomiR-
221) RNA nanoconjugates. Representative imaging of individual mice from each treated group (n = 5 animals)
is shown, with the same scale of fluorescence indicating Quasar570 emission. (b) Evaluation of change in
Quasar570 emission as a function of time after treatment with hydrogels embedded with RNA nanoconjugates
(n = 5). (c) Representative photographs and fluorescence images of whole body organs and resected tumors (T,
tumor; Lv, liver; K, kidneys; S, spleen; H, heart; Lu, lung; Int, intestines) in mice (n = 5) treated hydrogels
embedded with RNA nanoconjugates, in order to evaluate the biodistribution of Quasar705 RNA oligos.
© 2015 Macmillan Publishers Limited. All rights reserved
29
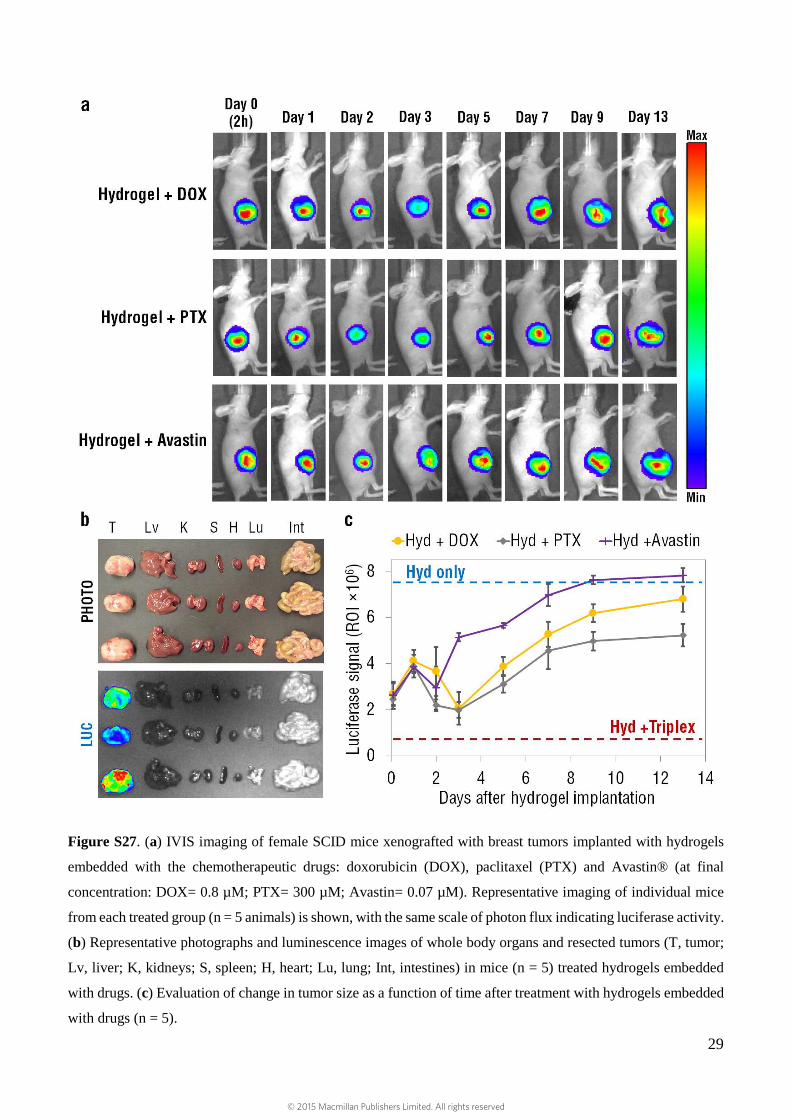
Figure S27. (a) IVIS imaging of female SCID mice xenografted with breast tumors implanted with hydrogels
embedded with the chemotherapeutic drugs: doxorubicin (DOX), paclitaxel (PTX) and Avastin® (at final
concentration: DOX= 0.8 µM; PTX= 300 µM; Avastin= 0.07 µM). Representative imaging of individual mice
from each treated group (n = 5 animals) is shown, with the same scale of photon flux indicating luciferase activity.
(b) Representative photographs and luminescence images of whole body organs and resected tumors (T, tumor;
Lv, liver; K, kidneys; S, spleen; H, heart; Lu, lung; Int, intestines) in mice (n = 5) treated hydrogels embedded
with drugs. (c) Evaluation of change in tumor size as a function of time after treatment with hydrogels embedded
with drugs (n = 5).
© 2015 Macmillan Publishers Limited. All rights reserved
30
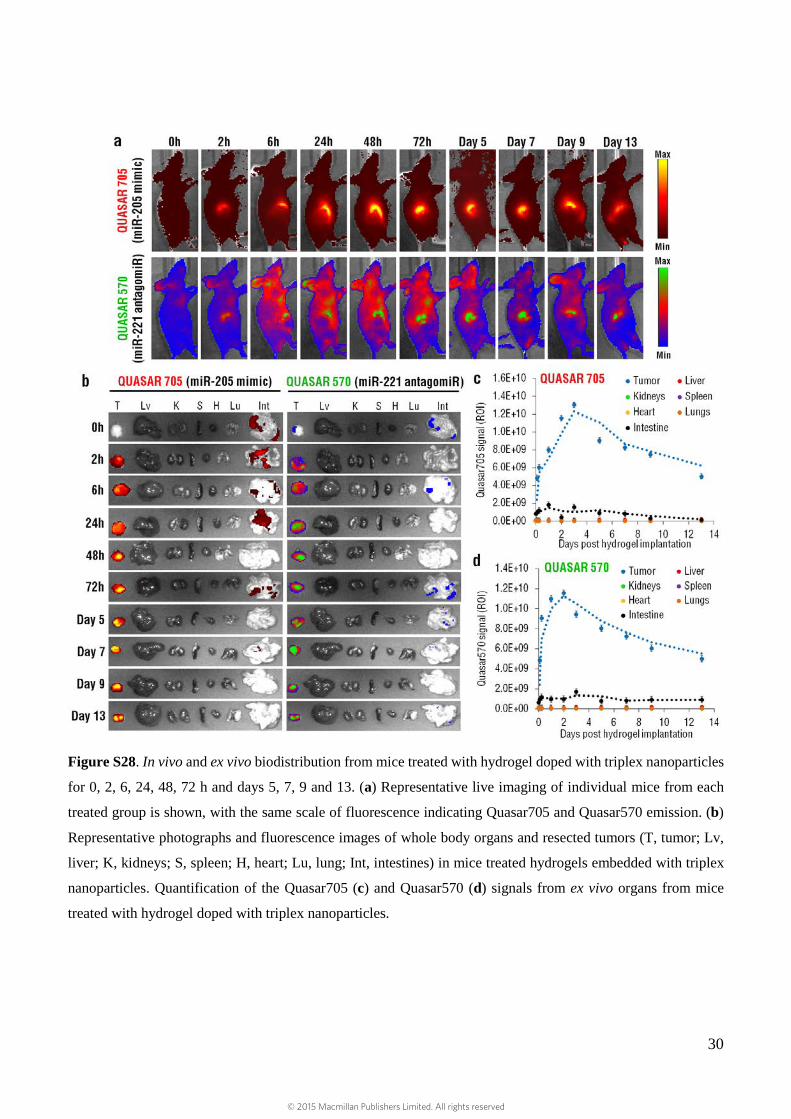
Figure S28. In vivo and ex vivo biodistribution from mice treated with hydrogel doped with triplex nanoparticles
for 0, 2, 6, 24, 48, 72 h and days 5, 7, 9 and 13. (a) Representative live imaging of individual mice from each
treated group is shown, with the same scale of fluorescence indicating Quasar705 and Quasar570 emission. (b)
Representative photographs and fluorescence images of whole body organs and resected tumors (T, tumor; Lv,
liver; K, kidneys; S, spleen; H, heart; Lu, lung; Int, intestines) in mice treated hydrogels embedded with triplex
nanoparticles. Quantification of the Quasar705 (c) and Quasar570 (d) signals from ex vivo organs from mice
treated with hydrogel doped with triplex nanoparticles.
© 2015 Macmillan Publishers Limited. All rights reserved
31
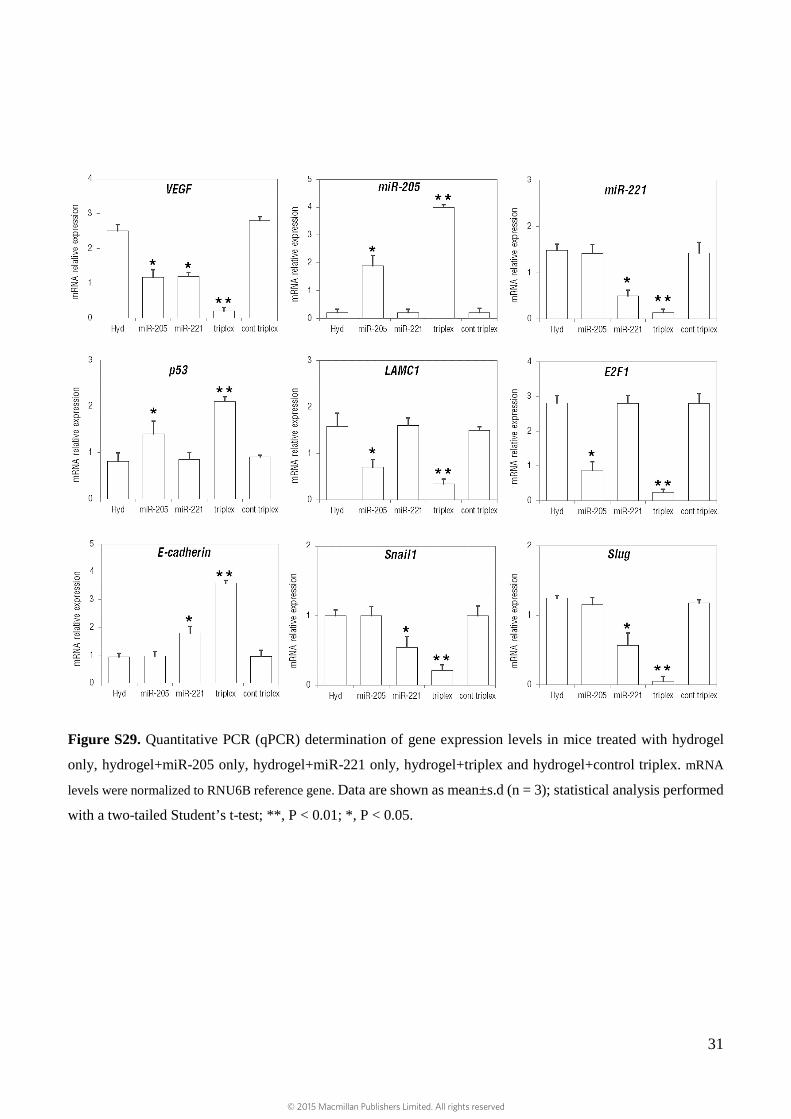
Figure S29. Quantitative PCR (qPCR) determination of gene expression levels in mice treated with hydrogel
only, hydrogel+miR-205 only, hydrogel+miR-221 only, hydrogel+triplex and hydrogel+control triplex. mRNA
levels were normalized to RNU6B reference gene. Data are shown as mean±s.d (n = 3); statistical analysis performed
with a two-tailed Student’s t-test; **, P < 0.01; *, P < 0.05.
© 2015 Macmillan Publishers Limited. All rights reserved

32
Additional references 1. Francois, J.C. et al. Sequence-Specific Recognition and Cleavage of Duplex DNA Via Triple-
Helix Formation by Oligonucleotides Covalently Linked to a Phenanthroline Copper Chelate. Proceedings of the National Academy of Sciences of the United States of America 86, 9702-9706 (1989).
2. Tung, C.H., Breslauer, K.J. & Stein, S. Polyamine-Linked Oligonucleotides for DNA Triple-
Helix Formation. Nucleic Acids Research 21, 5489-5494 (1993). 3. Chiou, C.C., Chen, S.W., Luo, J.D. & Chien, Y.T. Monitoring triplex DNA formation with
fluorescence resonance energy transfer between a fluorophore-labeled probe and intercalating dyes. Analytical Biochemistry 416, 1-7 (2011).
4. Wan, C.H., Cui, M., Song, F.R., Liu, Z.Q. & Liu, S.Y. Evaluation of Effects of Bivalent Cations
on the Formation of Purine-rich Triple-Helix DNA by ESI-FT-MS. J Am Soc Mass Spectr 20, 1281-1286 (2009).
5. Debin, A. et al. Stability of G,A triple helices. Nucleic Acids Research 27, 2699-2707 (1999). 6. Yang, B. & Sands, J.M. Overview and historical perspective. Sub-cellular biochemistry 73, 1-5
(2014). 7. Chan, P.P. & Glazer, P.M. Triplex DNA: Fundamentals, advances, and potential applications
for gene therapy. J Mol Med-Jmm 75, 267-282 (1997). 8. Jain, A., Wang, G. & Vasquez, K.M. DNA triple helices: Biological consequences and
therapeutic potential. Biochimie 90, 1117-1130 (2008). 9. Vercauteren, D. et al. The Use of Inhibitors to Study Endocytic Pathways of Gene Carriers:
Optimization and Pitfalls. Molecular Therapy 18, 561-569 (2010). 10. Schnitzer, J.E., Oh, P., Pinney, E. & Allard, J. Filipin-Sensitive Caveolae-Mediated Transport
in Endothelium - Reduced Transcytosis, Scavenger Endocytosis, and Capillary-Permeability of Select Macromolecules. J Cell Biol 127, 1217-1232 (1994).
11. Sarkar, K., Kruhlak, M.J., Erlandsen, S.L. & Shaw, S. Selective inhibition by rottlerin of
macropinocytosis in monocyte-derived dendritic cells. Immunology 116, 513-524 (2005). 12. Sadekar, S. & Ghandehari, H. Transepithelial transport and toxicity of PAMAM dendrimers:
Implications for oral drug delivery. Advanced Drug Delivery Reviews 64, 571-588 (2012). 13. Steinman, R.M., Mellman, I.S., Muller, W.A. & Cohn, Z.A. Endocytosis and the Recycling of
Plasma-Membrane. J Cell Biol 96, 1-27 (1983).
© 2015 Macmillan Publishers Limited. All rights reserved