Embed Size (px)
Citation preview

SELENIUM REMOVAL FROM
AGRICULTURAL DRAINAGE WATER: LAB SCALE STUDIES
Department of Water Resources
Sacramento, CA 94236
Agreement Number: 4600001985
Final Report
December 2004
Submitted to
Jose Faria, P.E.
Department of Water Resources
Fresno, CA
Submitted by
Shashi B. Lalvani, P.E.
Professor and Chair, Paper Science and Engineering
Miami University, Oxford, OH 45056

ABSTRACT
This report is an evaluation of the selenium removal from agricultural drainage water and synthetic solutions contaminated with high amounts of selenium. Batch and kinetic studies were conducted on the removal of selenium and the effectiveness of various remediation materials was determined. The agricultural drainage water samples were obtained from San Joaquin Valley and provided by Department of Water Resources, California.
Nanosized zerovalent NiFe and Fe particles rapidly reduced and immobilized selenate from aqueous solutions. Nearly 100% selenate removal was obtained in five hours under most conditions. The data show that, at identical solids loading, the use of NiFe particles as compared to Fe and Ni particles accomplished greater than 42% and 56% removal, respectively. Reduction of selenium using bimetallic nanosized NiFe particles resulted in nearly complete selenium removal from agricultural drainage water samples. The presence of sulfates in the aqueous solutions decreased the degree of removal. However, sufficient removal is possible using these particles and can be used to achieve the 10 ppb USEPA mandated levels. Immobilization of selenate with barium chloride also appears to be an effective method with the final cleanup of selenium with NiFe bimetallic particles.
The adsorption studies on both selenite and selenate removal showed that the commercially available sorbents such as γ alumina, α alumina and activated carbon showed some promising results for selenite removal. However, they were found to be completely ineffective for selenate removal, which is one of the predominant selenium species in the agricultural drainage water. The data also showed that γ alumina provided higher selenite removal percentages (99%) as compared to α alumina (94%), activated carbon (87%) and chitin (49%). The selenite removal was found to decrease with increasing initial Se (IV) concentration in the solution. Adsorption capacities of the adsorbents are reported in terms of their Langmuir adsorption isotherms. The adsorption capacity (on unit mass basis) of the adsorbents for selenite is in the order: chitin < activated carbon < α alumina < γ alumina. Generally, low pH of the solution resulted in favorable selenium removal.
Adsorption experiments at controlled pH conditions confirmed that surface charge density can have significant influence in equilibrium uptakes of these oxyanions. Modification of the carbon surface by copper cations significantly enhanced the equilibrium uptakes of both selenite and selenate. The surface modification of activated carbon resulted in up to 68% and 217% enhancement in uptakes from aqueous solutions containing 1 mg/L selenite and selenate, respectively. Similarly, the increase in selenite and selenate uptakes with the use of modified Southern Illinois University fly ash derived char carbon (SIUF_C) was evaluated to be 240 and 80%, respectively, while those employing modified Lake of Egypt fly ash derived char carbon (LOEF_C) showed an increase of 155 and 128%, respectively, over the as-extracted carbons. Sulfate and nitrate were observed to hinder the uptake selenite, while chloride did not affect selenite uptake.
This report was submitted by the Southern Illinois University, Carbondale (SIU) in fulfillment of Contract Agreement Number: 4600001985 under the sponsorship of the Department of Water Resources, California (DWR). This report covers the experimental work done from July 2001 through June 2004.
ii

TABLE OF CONTENTS
Title
Abstract ii
List of Tables vi
List of Figures viii
1 Introduction 1
2 Background 2
2.1 Selenium: A Brief Introduction 2
2.2 Pertinent Selenium Remediation Technologies 2
3 Methods 6
3.1 Analysis 6
3.2 Laboratory Scale Investigations 6
3.2.1 Syhthetic Selenium Solutions 6
3.2.2 Agricultural Drainage Water 6
3.2.3 Batch And Kinetic Experiments 7
3.3 Materials 7
3.3.1 Extraction of Fly Ash Char Carbon 7
3.3.2 Chemical Modification of Carbon 9
3.3.3 Preparation of Ferrihydrites 9
3.3.4 Synthesis of Nanosized Metallic Particles 9
3.4 Material Characterization 9
4 Project Description 11
4.1 Phase I: Adsorption of Selenium 11
4.2 Phase Ii: Reduction of Selenium 12
iii

4.3 Immobilization of Selenium Via Precipitation 12
5 Results 13
5.1 Phase 1: Task1 - Adsorption of Selenium 13
5.1.1 Adsorption Of Selenite 13
5.1.1.1 γ Alumina 13
5.1.1.2 α Alumina 16
5.1.1.3 Activated Carbon 17
5.1.1.4 Fullerenes 18
5.1.1.5 Fly Ash Derived Char Carbon 19
5.1.1.6 Chitin 20
5.1.1.7 Summary of Results 20
5.1.2 Adsorption of Selenate 20
5.1.2.1 Summary of Results 24
5.2 Phase I: Task 2 - Modification of Carbon 24
5.2.1 Adsorption of Selenite 25
5.2.2 Adsorption of Selenate 28
5.3 Phase I:Task 3 - Selenium Removal
In The Presence Of Anionic Impurites 30
5.3.1 Adsorption of Selenite 31
5.3.2 Adsorption of Selenate 33
5.4 Phase I: Task 4 - As-Received Agricultural
Drainage Water 35
5.4.1 Summary 36
iv

5.5 Phase I: Task 5 - Zeta Potential Measurements 36
6 Selenium Reduction Using Metallic Particles 38
6.1 Prelimary Results on Selenate Removal 38
6.1.1 Selenate Removal Using Iron Particles 39
6.1.2 Selenate Removal Using Nanosized NiFe Particles 41
6.1.3 Comparison of Selenate Removal 50
6.2 Effect of Anionic Cosolutes 51
6.3 Selenium Removal from As-received Agricultural Drainage Water 52
6.2.5 Summary of Results 54
7 Selenium Removal via Precipitation 55
7.1 Preliminary Studies on Sulfate Prepcipitation 55
7.2 Selenate Removal using Barium Chloride 56
7.3 Two-Step Immobilization 57
7.4 Summary of Results 58
8 Evaluation of Test Results 59
8.1 Mechanism of Selenium Adsorption 59
8.2 Reduction of Selenium 62
9 Conclusion 67
PUBLICATIONS 68
ACKNOWLEDGEMENTS 69
REFERENCES 70
v
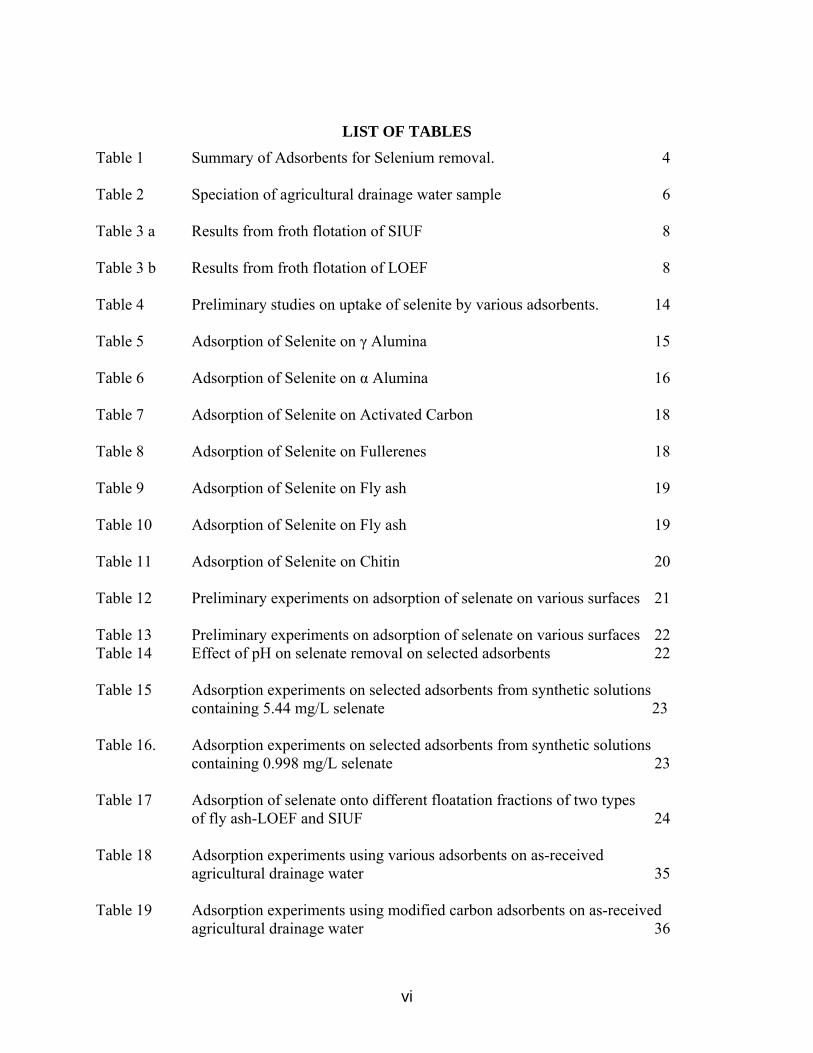
LIST OF TABLES Table 1 Summary of Adsorbents for Selenium removal. 4 Table 2 Speciation of agricultural drainage water sample 6 Table 3 a Results from froth flotation of SIUF 8 Table 3 b Results from froth flotation of LOEF 8 Table 4 Preliminary studies on uptake of selenite by various adsorbents. 14 Table 5 Adsorption of Selenite on γ Alumina 15 Table 6 Adsorption of Selenite on α Alumina 16 Table 7 Adsorption of Selenite on Activated Carbon 18 Table 8 Adsorption of Selenite on Fullerenes 18 Table 9 Adsorption of Selenite on Fly ash 19 Table 10 Adsorption of Selenite on Fly ash 19 Table 11 Adsorption of Selenite on Chitin 20 Table 12 Preliminary experiments on adsorption of selenate on various surfaces 21 Table 13 Preliminary experiments on adsorption of selenate on various surfaces 22 Table 14 Effect of pH on selenate removal on selected adsorbents 22 Table 15 Adsorption experiments on selected adsorbents from synthetic solutions
containing 5.44 mg/L selenate 23 Table 16. Adsorption experiments on selected adsorbents from synthetic solutions
containing 0.998 mg/L selenate 23 Table 17 Adsorption of selenate onto different floatation fractions of two types of fly ash-LOEF and SIUF 24 Table 18 Adsorption experiments using various adsorbents on as-received
agricultural drainage water 35 Table 19 Adsorption experiments using modified carbon adsorbents on as-received
agricultural drainage water 36
vi

Table 20 A Selenate removal studies using iron particles (5 hours) Uptake 39 Table 20 B Selenate removal studies using iron particles (5 hours), Final
Concentration. 40 Table 21 A Selenate removal studies using NiFe particles (5 hours) Uptake 42 Table 21 B Selenate removal studies using NiFe particles (5 hours), Final
Concentration. 42 Table 22 Final selenate concentrations after 5 hr. treatment with NiFe powders with different Ni concentrations from a 50 mg/L selenate solution at 25oC and a pH of 7.7. 45 Table 23 Rate constants of for selenate reduction on Fe and NiFe surfaces. 47 Table 24 Adsorption of Selenium (as received agricultural drainage water) using γ Alumina, activated carbon and NiFe. 53 Table 25 Adsorption experiments on selected adsorbents from synthetic solutions containing 0.998 mg/L selenate. 53 Table 26 Experiments on synthetic solutions after pretreating with barium chloride. 58 Table 27 Selenium concentrations after two stage process 58 Table 28 Adsorption potentials and Adsorption Capacities based on Langmuir
Isotherm 61 Table 29 a Adsorption potentials and Adsorption Capacities of fly ash derived char carbon and modified carbons based on Langmuir Isotherm (25o C) 61 Table 29 b Adsorption potentials and Adsorption Capacities of fly ash derived char
carbon and modified carbons based on Langmuir Isotherm (45oC) 61
vii
LIST OF FIGURES
Figure 1 Schematic for extraction of fly ash components 8 Figure 2 Adsorption Isotherms at different solution pH (Sorbent-γ Alumina) 15 Figure 3 Adsorption Isotherms for different pH values (Sorbent- α Alumina) 17 Figure 4 Uptake vs. Equilibrium concentration (Sorbent-Activated carbon) 17 Figure 5 Uptake vs. concentration under equilibrium conditions (25 deg C) for
modified carbons 25 Figure 6 Uptake vs. concentration under equilibrium conditions (45 deg C) for
modified carbons. 26 Figure 7 Effect of pH on selenite removal using modified carbons 26 Figure 8 a Effect of Loading on selenium uptake and removal by modified carbons 27 Figure 8 b Effect of Loading on selenium uptake and removal by as–produced carbons 27 Figure 9 Adsorption isotherms for selenate uptake by modified activated carbons
(Insert – Effect of temperature on the uptake of selenate) 28 Figure 10 Effect of pH on the removal of selenate by modified carbons. Initial
selenate concentration = 1 mg/L. 29 Figure 11 Effect of sorbent loading on selenate removal from aqueous solutions.
Initial selenate concentration = 1 mg/L 29 Figure 12 Effect of anionic impurities on selenate removal by SIUF_C. Loading of 10 g/L, Initial concentration = 1 mg/L. 30 Figure 13 Effect of anionic impurities on selenate removal by LOEF_C. Loading of 10 g/L, Initial concentration = 1 mg/L 31 Figure 14 Effect of chlorides on selenite removal by modified carbons. Initial
selenite concentration = 1 mg/L; Loading = 10 g/L 32 Figure 15 Effect of nitrates on selenite removal by modified carbons. Initial selenite concentration = 1 mg/L; Loading = 10 g/L 32 Figure 16 Effect of sulfates on selenite removal by modified carbons. Initial selenite concentration = 1 mg/L; Loading = 10 g/L 33
viii

Figure 17 Effect of chlorides on selenate removal by modified carbons. Initial selenate concentration = 1 mg/L; Loading = 10 g/L 34
Figure 18 Effect of nitrates on selenate removal by modified carbons. Initial selenate concentration = 1 mg/L; Loading = 10 g/L. 34 Figure 19 Effect of sulfates on selenate removal by modified carbons. Initial selenate concentration = 1 mg/L; Loading = 10 g/L. 35 Figure 20 Zeta Potential of various carbons vs pH. 36 Figure 21 Final concentration obtained in removal studies of metallic and bimetallic powders of transition metals. Experiments were conducted at 25 C for 30 minutes at a loading of 0.5 g/L. Synthetic selenate solutions
containing 51 mg/L was used. 39 Figure 22 Effect of iron loading on the selenate uptake. Experiments were conducted at 25 C for 5 hours. Synthetic solutions containing 51 mg/L was used 40 Figure 23. Effect of pH on the selenate uptake. Experiments were conducted at 25 C for 5 hours at a loading of 1 g/L of iron powder. Synthetic solutions containing 5.4 mg/L was used. 40 Figure 24 Effect of temperature on the selenate uptake. Experiments were conducted at 25 C and a pH of 7.7 for 5 hours at a loading of 1 g/L iron powder. Synthetic solutions containing 5.4 mg/L was used. 41 Figure 25 Effect of NiFe loading on the selenate uptake. Experiments were conducted at 25 C for 5 hours. Synthetic solutions were used. 43 Figure 26 Effect of pH on the selenate uptake. Experiments were conducted at 25 C for 5 hours at a loading of 1 g/L NiFe powder. Synthetic solutions
containing 5.4 mg/L was used. 43 Figure 27 Effect of temperature on the selenate uptake. Experiments were conducted
at 25 C for 5 hours at a loading of 1 g/L NiFe powder. Synthetic solutions were used. 44 Figure 28 Kinetics of removal of selenate from an synthetic solution containing 100 mg/L Se(VI) with Fe powder and NiFe powder at 25 C. 46 Figure 29 Experimental vs Model predicted kinetic data on selenate removal by 5 g/L NiFe powder from a synthetic solution containing 106 mg/L selenate. 46
ix

Figure 30. Kinetic data of Selenate, Se (VI) removal (Initial Se (V) concentration (low) = 1 mg/L) using NiFe particles under different loading conditions.
(a) Data on Final Se (VI) Concentration in solution vs. time for different solids loading (Legend in the figure indicate solids loading of NiFe). (b) Plot of pseudo-first order kinetics rate equation. 47 Figure 31 Kinetic data of Selenate, Se (VI) removal (Initial Se (V) concentration (high) = 500 mg/L) using NiFe particles under different loading conditions. (a) Data on Final Se (VI) Concentration in solution vs. time for different solids loading (Legend in the figure indicate solids
loading of NiFe). (b) Plot of zero order kinetics rate equation. 48 Figure 32 Effect of Initial concentration on selenate reduction. NiFe loading = 5 g/L.
Experiment conducted for 1 hours. Initial rate plotted for a zero order reaction. 49
Figure 33 Effect of temperature on selenate reduction. (a) Kinetic data on selenate reduction using NiFe particles at different
temperatures. (Initial Se (VI) concentration = 250 mg/L. Solids loading of 5 g/L NiFe). (b)Plot of zero order kinetic rate equations. 49 Figure 34 Effect of dissolved oxygen (DO) on selenate reduction. Solids loading = 5
g/L NiFe. (Legend in the figure indicates initial Se (VI) concentration). (a) Anerobic (DO = 0.5 mg/L) (b)Aerobic (DO = 6.5 mg/L). 50 Figure 35 Comparison of final selenium concentrations in synthetic solutions
with/without competing anions after removal using standard adsorbents and lab produced Fe powder and NiFe bimetallic powder. Experiments were conducted at 25 oC for 300 minutes at a loading of 1 g/L. Initial concentration of selenium was 5 mg/L. 51
Figure 36 Selenium removals from as–received agricultural waters using different
loadings of NiFe. 54 Figure 37 Selenate removal using barium chloride under varying sulfate
concentrations. 56 Figure 38 Selenate removals from agricultural waters using barium chloride. 57 Figure 39 Variation in the pseudo-first order observed rate constant with surface
concentration (surface area * solid loading) of NiFe for selenate reduction. Initial Se (VI) concentration = 1 mg/L. 64
x

Figure 40 Variation in the zero order observed rate constant with surface concentration (surface area x solid loading) of NiFe for selenate
reduction. Initial Se (VI) concentration = 500 mg/L. 65 Figure 41 Variation in the zero order observed rate constant with initial Se (VI)
concentration. NiFe loading = 5 g/L. 65 Figure 42 Variation of observed zero order rate constant with initial Se (VI)
concentration 66
xi

1 INTRODUCTION
The purpose of this study (Contract Agreement Number: 4600001985) was to evaluate several remediation techniques for selenium removal including; 1) Adsorption using commercially available adsorbents; 2) Reduction using metallic particles and 3) Immobilization via precipitation of selenium from contaminated agricultural drainage water. The Department of Water Resources (DWR), California has actively participated in sponsored investigations involving agricultural drainage water since 1960. The significant attention on element selenium, over the last decade, is attributed to its ambivalent character as a micronutrient and a carcinogen. Selenium though essential at low amounts, is toxic at high concentrations, with a relatively small difference between the two levels (USEPA, 1986). The United States Environmental Protection Agency has determined 0.01 mg/L to be the maximum allowable contaminant level in drinking water – surface and subsurface. The presence of selenium at concentrations as high as 1.3 mg/L in the agricultural drainage water in the San Joaquin Valley has prompted this investigation.
In June 2001, Dr. Shashi Lalvani commenced a project with the cooperative effort of DWR and Mechanical and Energy Processes Department, Southern Illinois University, Carbondale to provide practical solutions for the removal of selenium from agricultural drainage waters to acceptable levels before it could be discharged. The project began July 2001 and ended June 2004.
The primary objective of this investigation was to:
1. Evaluate effective remediation technologies for selenium removal from contaminated synthetic solutions prepared in the laboratory;
2. Test the most effective adsorbents on selenium contaminated agricultural drainage water from San Joaquin Valley provided by Department of Water Resources, California.
The investigation was conducted in three phases:
1. Phase I - Adsorption of selenium on commercially available adsorbents such as activated alumina, activated carbon, chitin, fly ash products and modified carbons;
2. Phase II - Reduction of selenium using nanomaterials consisting of Ni-Fe;
3. Phase III - Immobilization of selenium via precipitation using barium chloride.
Batch laboratory experiments were performed in small reactors where a fixed volume of selenium was contacted with the remediation materials. Data on selenium removal was obtained and the materials were identified based on their removal efficiencies. Although, the ultimate objective is to remove selenium from the agricultural drainage waters, it is necessary to conduct fundamental investigations into the removal process such that the process can be designed for maximum removal.
The first phase of the investigation involving adsorption of selenium started in June 2000 and continued until June 2001. The second phase of the investigation involving the reduction of selenium using bimetallic nanoparticles began in July 2001 and ended Feb 2003. The third phase of the investigation involved immobilization of selenium via barium chloride precipitation. Batch experiments were performed using barium chloride as a precipitation agent for the removal of sulfate as barium sulfate. These studies started March 2003 to June 2003.
1

2 BACKGROUND
2.1 Selenium: A Brief Introduction In natural waters, selenium exists in four different oxidation states (-II, 0, +IV, +VI). Among these, Se (IV), selenite and Se (VI), selenates are the most common species in ground water and surface water (Levander, 1985). Selenium can also exist as organic species in the form dimethyl selenide (-II), dimethyl diselenide (highly volatile), trimethylselenonium, and selenoamino acids. Although thermodynamics may predict that a particular form of selenium should be present in the environment, biological and reduction process may cause selenium to exist in various states. Many of the transformations of selenium from different oxidation states and between inorganic and organic forms are mediated by microbial processes. Wetland organisms can bioaccumulate selenium to a very high degree and the incorporation of live and dead organisms (especially plants and microbes) into wetland sediment forms a large reservoir of selenium in sediment organic matter (Presser, 1994). In agricultural soils and wetland sediments, the inorganic forms of selenite and selenate exist, primarily attached to clays and mineral oxides. Shallow groundwater of agricultural areas in the San Joaquin Valley, CA, has been extensively studied. Selenium, occurring naturally in alluvial soils of the arid western San Joaquin Valley, is leached by irrigation water and concentrated, with other salts, in the topsoil by evaporation. Selenium is mobilized when the soils are drained to remove all accumulated salts and is carried into the reservoir. Under oxidative conditions, selenium generally exists as selenate (SeO4
-2). Thermodynamic calculations also indicate that selenite (SeO3
-2), elemental selenium (Se (0)) and selenide (Se (-II)) could exist in reducing environments (Davis et al.., 1979).
The level of toxicity is dependent on the concentration of selenium in its sources, mainly fruits and seafood. For example, irrigation in the western part of the California’s San Joaquin Valley has produced high-salt drainage water containing selenium (Se) at levels that have ranged from 0.14 to 1.3 mg/L. Prolonged exposure to more moderate levels of selenium results in chronic dermatitis, selenosis and fatigue, among humans (Letey et al.., 1986).
2.2 Pertinent Selenium Remediation Technologies Considerable research on selenium remediation from ground and surface water has been reported in the past. The most prominent of these technologies include adsorption on activated alumina and iron hydroxides, precipitation and coagulation and reduction using iron corrosion products (Kapoor et al.., 1995). The mobility and toxicity of selenium in drinking water is greatly influenced by the interaction of the sorbents and reductant with the selenium anions and the stability of the complexes formed. The following paragraphs briefly discuss the various remediation techniques reported in literature.
Conventional water treatment technologies such as coagulation have been used unsuccessfully in the past. Coagulation involves the agglomeration of colloidal particles to form large particles which can be easily separated from solution by sedimentation or filtration. Conventional water treatment using ferric sulfate and alum coagulation have been conducted on selenium containing water in pilot scale studies. The conclusions of the study were: ferric sulfate and alum coagulation (at 25 mg/L) can achieve EPA < 50 µg/L when the Se (IV) concentration is only slightly above 50 µg/L and the pH of the water is 7 or less (Lykins et al.., 1994). The effluent
2

concentration from the pilot plant exceeded the EPA drinking water standards.
Ion exchange process involves the chemical reaction of ions in water and solid phase. The solid phase is usually a kind of polymeric resin that has a certain electric charge. The charge functional groups present in the resin attract that oppositely charged selenium compound present in water and hold them by electrostatic forces. Ion exchange is used widely for treating drinking waters, dilute metal bearing solutions, wastewaters, and groundwaters. However, its application for removing selenium has some successes and some failures. Ion exchange is not able to routinely produce effluents with < 50 µg/L total selenium (WSPA, 1995).
There are several patents and studies in the literature that propose potential biological processes for removing selenium. Bacterial reduction of selenium aqueous species to elemental selenium has been shown to be a potential candidate for treating mine waters (Brown et al.., 1980). The bacterium that appears to offer great promise is P. stutzeri which can reduce either Se (IV) or Se (VI). Ergas et al.. (Ergas et al.., 1990) demonstrated on a laboratory scale the successful utilization of anaerobic bacterial reactors for selenium removal from agricultural waters. The Se (VI) was reduced to elemental selenium. The result showed that Se (VI) was reduced through a two step sequence, i.e., Se (VI) was reduced to Se (IV) then to elemental selenium in the anaerobic reactors.
As it is easy to remove the adsorbent from aqueous media after treatment, adsorption technique is generally considered to be a promising method and has been studied for selenium removal as well. So far, various adsorbents for selenium removal have been developed which include activated alumina, activated carbon, chitin, and chitosan and iron oxyhydroxides. Among the adsorbents used, mineral oxides such as alumina and iron oxyhydroxides have shown promising results for selenium removal, however in the form of selenite. A summary of the various adsorption techniques used is reported in Table 1.
Adsorption of selenite, Se (IV), by alumina has been reported to be effective, with near complete removal (for concentrations up to 4 mg /L using 3.3 g/L Al2O3) at pH levels of 3-8. However, selenate, Se (VI), adsorption by alumina is poor (Trussel, 1980). Se (VI) adsorption drops off rapidly with increasing pH and is less than 50% at pH of 7. Trussel et al.. (1991) also observed that sulfate and bicarbonate had no effect on Se (IV) adsorption but greatly affected that of Se (VI). A number of studies concluded the following decreasing order of the preference to adsorption on alumina: hydroxide >phosphate >fluoride > As (V) > Se (IV) >> sulfate > Se (VI) > bicarbonate > chloride > nitrate > As (III).
Adsorption on novel polymeric materials with a high concentration of amine groups (chitin and chitosan) has also been investigated for their ability to remove selenium and arsenic oxyanions from aqueous solutions (Qian, 1999; Muzzarelli, 1977). However, it was efficient only in highly acidic regions.
Because of their large surface area and their high degree of surface reactivity, activated carbons are regarded as very good adsorbents for the removal of heavy metal ions from aqueous phases. However, activated carbon adsorption of selenium, either Se(IV) or Se(VI), is completely ineffective, e.g., Se(IV) or Se(VI) at concentrations from 30-100 µg/L showed < 4% removal using dosages of activated carbon up to 100 mg/L (Jeffers et al.., 1991).
3

Table 1 Summary of Adsorbents for Selenium Removal
Technology Agent References
Ferrihydrite Balistrieri and Chao, 1987, 1990
Benjamin and Bloom, 1981
Brown and Shrift, 1980
EPRI, 1980
Hayes et al., 1987
Hingston, 1981
Hingston et al., 1968
Howard, 1977
Manning and Burau, 1995
Merrill et al., 1986
Pengchu and Sparks, 1990
Stiksma et al., 1996
Western States Petroleum Association, 1995
Sparkman, et al., 1990
Isaacson et al., 1994
Parida et al., 1997
Activated Alumina Trussel et al., 1980
Yuan et al., 1983
Hornung et al., 1983
Batista and Young, 1994, 1997
Jegadeesan et al., 2003
Activated Carbon Jegadeesan et al., 2003
Ferric oxyhydroxide Jeffers et al., 1991
Corwin et al., 1994
Adsorption
Lanthanum oxide Adutwum, 1995
As reported in Table 1, most of the previous investigations involved adsorption of selenium on ferrihydrite surfaces. In fact, EPA selected the use of ferrihydrites as the Best Demonstrated Available Technology (BDAT) for selenium removal (in the form of selenite). However, the study concluded that insignificant selenate removal (<10%) is obtained when ferrihydrites are used. Su and Suarez (Su et al.., 2000) investigated the sorption of selenite and selenate on
4

amorphous iron oxide and goethite (α – FeOOH). They reported that, as compared to goethite, the amorphous iron oxide sorbed more selenite. The greatest sorption was found at a pH < 8.0 where Fe-OH2
+ predominates. The mechanisms of selenate and selenite surface complex formation were also investigated. Balistrieri and Chao (Balistrieri et al., 1990) found competitive adsorption on ferrihydrite surfaces due to the presence of other anions. They concluded the following decreasing order of adsorption > silicate = As (V) > bicarbonate /carbonate ≈ Se (IV) > oxalate > fluoride = Se (VI) > sulfate. Hayes (Hayes et al.., 1987) postulated that selenate adsorbs as an outer sphere hydrated complex and thus it can be easily replaced by other solution anions such as sulfate. This was confirmed by other researchers.
Various reductants can be used to produce elemental selenium or metal selenides. Reductants such as ferrous hydroxide, iron, zinc, aluminum have been proposed. Murphy (Murphy, 1988) patented a process for the Bureau of Reclamation (BOR) for treating selenium bearing waters. The process consisted of reducing selenium species to elemental selenium by using ferrous hydroxide as the reducing agent. The reduction is accomplished at a pH of 8.8-9.2 under reducing conditions. Magnetite and/or maghemetite formed causing loss of reductant and disturbing metal-contaminant interaction. Interferences in the process are nitrate, dissolved oxygen (DO), and bicarbonate. Also, large quantities of iron bearing sludge would have to be handled and treated for disposal.
Zerovalent iron has been reported to degrade many chlorinated hydrocarbon solvents effectively via reductive dehalogenation (Su et al., 2001; Johnson et al., 1996) and to immobilize redox sensitive inorganic contaminants such as selenate (Roberson, 1999), arsenate and arsenite (Roberts et al., 1996; Farrell et al., 2001), chromate (Powell et al., 1995; Pratt et al., 1997) among others. The removal mechanism appears to be reductive precipitation followed by sorption on the corroded iron surface. Zerovalent iron is an attractive alternative for removing selenium from water via reduction of selenium oxyanions to elemental selenium (Se0). In an X-ray absorption near-edge structure (XANES) study of the reaction of selenate with iron filings, the product profile showed the following fate of selenium: 74% elemental, 17% Se (IV) and 9% Se (VI). In the redox reaction selenate is the electron acceptor, while the Fe metal acts as an electron donor. Equations 1 and 2 (Roberson, 1999) illustrate possible reactions for the reduction and deposition of selenium on iron surfaces.
Fe0 + SeO42- + H2O → Fe2+ + SeO3
2- + 2OH- -84.69 kJ/mol (1)
3Fe0 + SeO42- + 4H2O → 3Fe2+ + Se0(s) + 8OH- -105.54 kJ/mol (2)
In order for these reactions to occur, selenate must first adsorb onto the surface and then be reduced by electrons that have transported from Fe (0), which is located beneath the native oxide overlayer, to the solid-liquid interface. Although the mechanism of the electron transport is unknown, this movement of electrons should occur since thermal electrons, such as those involved in chemical reactions, can travel much longer distances within a solid than photoelectrons can. When electrons are released from Fe (0), Fe (II) is produced at the Fe oxide-Fe metal interface. The Fe (II) produced in the absence of dissolved O2 must ultimately go into solution. When the Fe oxide layer becomes too thick, electron transport through the layer is inhibited such that the reduction of selenate at the surface can no longer occur. Thus, fewer adsorbates are deposited in the presence of atmospheric gases. For this reason, fine iron particles with large surface area to volume ratios are preferable.
5

3 METHODS
3.1 Analysis
The concentration of selenium in the treated samples was analyzed by the standard method, EPA 200.8, using the ICP-MS available at the DWR Bryte Laboratory, California. The treated selenium samples were adjusted to pH of less than 2 and stored, before analysis for total selenium concentration. The detection limit of the apparatus was 0.001 mg/L (ppm).
In some studies, especially involving synthetic selenate-containing solutions with no sulfate anion, analyses was performed using Dionex DX-500 Ion Chromatograph. Calibration curves for selenium were prepared using four to six standards. Straight lines were fitted with coefficients of determination (r 2) of no less than 0.99 for selenium. At least one blank is analyzed for each calibration curve. The highest calibration standard shall not exceed the linear range of the instrument. At least one non-blank calibration standard is used. Three analyses were performed on most of the samples. Most samples were diluted using distilled water. A diluted sample, a standard sample and a blank sample were analyzed with each set of selenium samples to minimize errors. Our data have shown that analyses obtained from the ion chromatograph and ICP-MS are in excellent agreement (r2 = 0.97).
For the discussion of selenium in this report, the selenium concentration is the total concentration of selenium in the treated samples. The concentration of selenite and selenate measured by the ion chromatograph is the concentration of selenite and selenate in the treated sample.
3.2 Laboratory Scale Investigations
3.2.1 Preparation of Synthetic Selenium Solutions
Synthetic stock solutions of selenite and selenate, Se (VI/IV), were prepared by dissolving a known quantity of sodium selenite and selenate salts in distilled water. Solutions of lower concentrations were freshly prepared before each batch experiment by the serial dilution of the stock solution. No anionic species were added unless otherwise noted. The concentration of the synthetic selenium samples was determined using ICP-MS, as described earlier. No other anions were added to the as-prepared synthetic solutions.
3.2.2 Agricultural Drainage Water The agricultural drainage water used in the investigation was provided by the Department of Water Resources, California from the San Joaquin Valley. The constituent concentration make up of the drainage water is provided in Table 2.
Table 2 Speciation of the agricultural drainage water samples
Cation Boron Calcium Magnesium Potassium SodiumConcentration (mg/L) 23 544 197 5.8 2570
Anion Chloride Nitrate Sulfate Selenium
Concentration (mg/L) 2520 382 4170 0.92
6

3.2.3 Batch and Kinetic Experiments
All experiments were conducted under constant agitation using a magnetic stirrer and at controlled temperature of 298 K. The treated solution was filtered using a 0.1 µm Whatman filter paper (Fisher Scientific, Chicago). The filtrate collected was mainly remaining selenium species in the solution. For the adsorption experiments, batch studies were performed by treating synthetic selenium solutions with a known amount of adsorbent loading. In a typical experiment, 25 ml of solution was treated with the selected adsorbents. The pH of the solution was noted before and after the experiment. The adsorption characteristics of the various adsorbents used were evaluated in terms of equilibrium concentrations, selenium uptake and the percent selenium removal from experiments conducted under different initial concentrations of selenite or selenate. Equilibrium condition was attained after 72 hours of operation. For the reduction studies, batch and kinetic studies were performed by treating synthetic selenium solutions with a known amount of the solids loading. The solution pH reported corresponds to the pH before the addition of solids to the flasks (pH = 7.5 ± 0.1). The residence time of the experiments was three hours unless specified otherwise. A small volume of the solution (less than 1 mL) was collected at desired intervals in Whatman Autovial syringeless filters (Fisher Scientific, Chicago) and then analyzed. To study the effect of pH, the pH of the solution was adjusted using 0.1 N HCl and 0.1 N NaOH. The pH of the solution was noted at the start and the end of the experiment. The temperature studies were performed under isothermal conditions at different temperatures. In certain experiments, anionic species such as sulfate, chloride and nitrate were added to the synthetic solution in order to recreate the solution speciation and concentration as that of the as-received agricultural drainage water. The anions were dissolved in the synthetic solution and allowed to rest for a period of 24 hours before treating them with the remediation materials. No precipitation of selenium was observed.
3.3 Materials γ alumina and α alumina were obtained from Fisher Scientific (Chicago, USA). Activated carbon (Darco S51) was provided by Norit Americas Inc (Atlanta, USA). The three commercial fullerenes, as produced fullerenes (AsF), toluene extracted fullerenes (TEF), toluene extracted heat treated fullerenes (HTTEF), were obtained from MER Corporation (Arizona, USA). Chitin was obtained from Fischer Scientific (Chicago, USA).
3.3.1 Extraction of Fly Ash Char Carbon The fly ash samples used in this investigation were obtained from two power plants, namely from Southern Illinois University’s Fluidized Bed Combustor (SIUF) and Lake of Egypt Pulverized Coal Combustor (LOEF). The power plant uses a fluidized bed combustor for coal combustion. The resulting fly ash (SIUF/LOEF) contains 15-20% unburnt carbon (char), by weight. Froth flotation technique in a Denver Cell was used to separate fly ash into its four
7
components and extract char. A schematic of this process is provided in Figure 1. The hydrophobic char was extracted as the floated product at each stage of floatation and used as the feed for the next stage. The floated product of the third and final stage is predominantly rich in carbon and was termed as Final Concentrate (SIUF_C/LOEF_C) in this study. The material remaining in the cell at the end of each stage was collected individually and termed as Stage 1 tails (SIUF_T1/LOEF_T1), Stage 2 Tails (SIUF_T2/LOEF_T2) and Stage 3 Tails (SIUF_T3/LOEF_T3). The ash and the carbon composition of each products are shown in Table 3 a and b.
Feed
Stage 1 Tails Stage 2 Tails Stage 3 Tails
Final Concentrate
Stage 1 Stage 2 Stage 3
Figure 1 Schematic for extraction of fly ash components.
Table 3 a Results from froth flotation of SIUF
Ash %
Carbon %
Yield %
Final concentrate (SIUF_C) 26.0 74.0 4.6 Stage 1 tail (SIUF_T1) 85.1 14.9 87.3 Stage 2 tail (SIUF_T2) 61.2 38.8 6.1 Stage 3 tail (SIUF_T3) 52.4 47.6 2.1 Feed (SIUF_F) 84.0 16.0 100
Table 3 b Results from froth flotation of LOEF.
Ash %
Carbon %
Yield %
Final concentrate (LOEF_C) 27.41 72.59 39.18 Stage 1 tail (LOEF_T1) 97.33 2.67 46.78 Stage 2 tail (LOEF_T2) 88.92 11.08 9.12 Stage 3 tail (LOEF_T3) 59.35 40.65 4.92 Feed (LOEF_F) 68.75 31.25 100
8
3.3.2 Chemical Modification of Carbon
The carbons, mainly commercial activated carbon and fly ash derived char carbon (SIUF and LOEF), were stirred in 0.5 M copper chloride solutions for five hours. The solids were then filtered and washed several times with distilled water. The resulting solids, namely copper modified activated carbon (CMAC), copper modified SIUF (CMSIU) and copper modified LOEF (CMLOE), were then vacuum-dried for 24 hours and stored in closed vials.
3.3.3 Preparation of Ferrihydrites Ferrihydrite was prepared by the addition of sodium hydroxide to ferric nitrate a pH of 7.0. The suspension was aged for three hours and dried. Two different samples of δ- FeOOH (Labeled A and B) were prepared based on the pore size and crystallinity. Ferrous hydroxide was precipitated in a near neutral medium by the addition of sodium hydroxide to ferrous sulfate. The precipitate was treated with hydrogen peroxide solution (15%) and the oxidation product was washed, dried over P2O5 at room temperature (Parida et al., 1997).
3.3.4 Synthesis of Nanosized Metallic Particles The metallic powders are formed by reaction with sodium borohydride according to the following reaction.
)(22)(0
422 24222 gs HHBOMBHOHM +++→++ +−−+
In the case of nickel, an additional hydride formation reaction takes place
HNiHNi −→+ 4224
The precipitation of bimetallic powders occurs according to the following reaction which involves simultaneous reduction of the metal ions in aqueous solution by sodium borohydride.
)(2242))(02()(0
1422)22(2
1 gHHBOsMsMBHOHMM +++−+→−++++
Transition metal powders were produced by reduction of 1 M salt solutions with sodium borohydride. Transition metal bimetallic powders were produced via the same method using solutions with metal ratios of 1:1. The precipitated solids were centrifuged to remove the water, followed by drying at 85oC under nitrogen atmosphere for 24 hours. The solids were stored in air tight vessels under nitrogen.
3.4 Material Characterization The relative composition of each metal in the bimetallic particle was quantified by energy dispersive x–ray spectroscopy. The nickel content in NiFe powder was 50 wt. %. The particle size distribution was obtained using a Laser Microtrac Particle Size Analyzer. The surface morphology and the particle size were determined using a Hitachi S-500 scanning electron microscope (SEM, Hitachi) and a Hitachi H-7100 transmission electron microscope (TEM,
9

Hitachi), respectively. The quantification of Ni and Fe concentrations in the leachates was conducted using a Buck Instruments VG210 Atomic Absorption spectrophotometer. Photomicrographs were obtained by a Hitachi Transmission electron microscope at a magnification of 100,000. Zeta potential tests were carried out on a Laser ZetaMeterTM from PenKem, Inc (Bedford Hills, NY) to obtain the change of zeta potential with pH. No inert electrolyte was used. ASTM C114 procedure was used to determine the ash content. The surface area of the carbon specimens and bimetallic powders were measured under nitrogen atmosphere using a Qauntachrome NOVA 2000 BET analyzer. The three point BET analysis was performed.
10

4 PROJECT DESCRIPTION
Based upon the preliminary research conducted at Southern Illinois University, Carbondale and a thorough review of the literature, the project was divided into three phases. Phase I involved the study of selenium removal via adsorption on to activated carbon, alumina and ferrihydrites among others. The data are reported in terms of the adsorption isotherms (metal uptake), removal capacities and an investigation of the surface charges of the adsorbents. Phase II involved the use of transition metal and bimetallic nanoparticles such as Fe and NiFe for the reduction of selenium from synthetic solutions and as-received agricultural drainage water. The data are reported in terms of the percent selenium removal and rates of reactions. The final Phase III involved further studies on the immobilization of selenium from agricultural water samples were conducted to eliminate the adverse effect of sulfates in the agricultural water on selenium removal using barium chloride. The optimum loading of barium chloride was determined based on the percent removal of selenium. The detailed project tasks are provided below according to the various phases of investigations. 4.1 Phase I: Adsorption of Selenium
• Task 1: A number of adsorbents (γ alumina and α alumina, activated carbon, fly ash derived char carbon, fullerenes, chitin and ferrihydrites) were contacted with synthetic selenium solutions in a batch reactor until equilibrium was reached. Adsorption isotherms (the amount of metal adsorbent per unit weight of adsorbent vs. equilibrium concentration plots) were prepared. The data was useful in identifying adsorbents which showed promise in selenium removal.
• Task 2: Chemical modification of the adsorbents was performed in order to enhance
selenium removal capacities. In this task, activated carbon and fly ash derived char carbon were modified with copper ions to increase the positive surface charge density of the resultant adsorbent particles. Further treatment of selenium solutions with the chemically modified adsorbents was performed to determine the effect of modification of selenium removal.
• Task 3: It has been noted that as-received agricultural drainage water contains large
amounts of anionic co-solutes such as sulfates, nitrates and chlorides that could inhibit selenium removal. Experiments were conducted to evaluate the effect of the presence of these anionic impurities on the adsorption of selenium using commercially and chemically modified carbons. Further experiments were performed on the as –received agricultural drainage water.
• Task 4: Upon identifying the effective adsorbents for selenium removal from synthetic
solutions, equilibrium studies were performed by treating the as-received agricultural drainage water sample. The data was reported in terms of the percent selenium removal.
11

• Task 5: Zeta Potential measurements were performed to measure the charge on the surface of the adsorbent particles suspended in water at a controlled pH. A plot of the charge density vs. pH was prepared. The data obtained was helpful in eliminating those adsorbents that have surface negative charges (since selenium species are oxyanions, adsorbents with surface positive charges are expected to perform better for selenium removal). In addition, the specific pH conditions for obtaining maximum selenium removal were also determined.
4.2 Phase II: Reduction of Selenium
• Task 1: Solids of Fe and NiFe were prepared in the laboratory as described above. Batch reactors were used to carry out kinetic studies. Experiments were carried out in which concentration of selenium was measured as a function of time. Appropriate kinetic equations that codify the data were obtained. The effect of temperature and presence of oxygen was determined and reported in terms of the rates of selenium reduction reactions.
• Task 2: Equilibrium Studies: The effect of pH and anionic co-solutes was determined via
equilibrium studies and the data reported in terms of the selenium removal from the parent solutions.
• Task 3: Further studies were performed to determine the effectiveness of the bimetallic
and metallic nanoparticles for selenium removal from as-received agricultural drainage water sample.
4.3 Phase III: Immobilization of Selenium via Precipitation
• Task 1: A combination of NiFe solids prepared in the laboratory and barium chloride was used in order to achieve maximum selenium immobilization from the as-received agricultural drainage water sample. It is known that the presence of sulfate in the drainage water inhibits selenium removal. The addition of barium chloride accomplishes the precipitation of high amounts of sulfates from solution in addition to selenium immobilization. The data obtained from these equilibrium studies were reported in terms of the selenium removal.
The results obtained from investigations conducted in Phase I, II and III and specific task orders are provided in the following chapters 5, 6 and 7, respectively.
12

5 ADSORPTION OF SELENIUM
Preliminary studies were conducted to identify several adsorbents as potential candidates for the effective removal of selenite. Experiments conducted under acidic conditions generally provided better removals. However, poor removals were obtained from synthetic selenate solutions and as – received agricultural samples. Alteration of surface charges present on the commercially available activated carbon and the unburnt carbon extracted from fly ash also showed potential for selenite removal. Based on the task order, a detailed summary of the results of the experiments is provided in the following paragraphs. 5.1 Phase I-Task 1: Adsorption of Selenium Preliminary studies on metal uptake were conducted for the following adsorbents, namely, three fullerene samples (AsF, TEF, HTTEF), fly ash and its components (SIUF_F, SIUF_C, SIUF_T1, SIUF_T2, SIUF_T3), activated carbon (Darco S51), activated alumina (α alumina, γ alumina), and chitin. 5.1.1 Adsorption of Selenite Experiments were conducted using a synthetic 50 mg/L selenite solution with an adsorbent loading of 10 g/L. The pH of the solutions was adjusted to 7.50 at the start of the experiments. It should be noted that the pH of the as-received agricultural drainage water was 7.77. The data (Table 4) show that SIUC_F (uptake of 4.96 mg/g) provided the best selenium removal of over 99% followed by γ alumina (uptake of 4.85 mg/g) and SIUC_T1 (uptake of 4.80 mg/g). The sample labeled SIUC_T2 exhibited selenium uptake of approximately 2.7 mg/g. The pH of the solutions became more basic when SIUC_F, SIUC_T1, SIUC_T2, and γ alumina were used as sorbents. SIU fly ash was obtained from combustion of coal in a fluidized bed combustor. These combustors utilize large amounts of limestone for the capture of SO2. As a result, a large amount of lime is found in this type of fly ash. The increase in pH in the experiments involving the fly ash samples is due to the formation and dissolution of calcium hydroxide. In addition to selenium removal by adsorption, it is also possible that precipitation of selenium could explain its significant removal by fly ash. The other adsorbents (AsF, TEF, HTTEF, SIUF_C, Darco S51, and chitin) provided less than 20 % removal corresponding to an uptake of less than 2 mg/g. Of the fullerene samples, TEHTF provided the best removal (10.60%) as compared to the AsF (2.20%) and TeF (1.40%). Based on the results obtained, extensive studies were conducted on both forms of alumina, and activated carbon (Darco S51).
13

Table 4 Preliminary studies on uptake of selenite by various adsorbents. (Loading =10g/L, Initial pH = 7.5, Initial concentration = 50 mg/L)
Adsorbent Final pH Final Conc.
(mg/L) Uptake (mg/g)
Removal (%)
AsF 6.88 49.30 0.07 1.40 TEF 6.03 48.90 0.11 2.20
TEHTF 7.25 44.70 0.53 10.60 SIUF_F 11.72 0.40 4.96 99.10 SIUF_C 8.95 44.20 0.58 11.70 SIUF_T1 11.43 2.00 4.87 97.47 SIUF_T2 10.22 23.30 2.67 54.17 SIUF_T3 9.24 32.00 1.82 36.51 Darco S51 7.56 41.20 0.88 17.60 α alumina 8.36 36.10 1.39 27.80 γ alumina 8.35 1.50 4.85 97.02
Chitin 6.98 45.10 0.49 9.90 5.1.1.1 γ Alumina Experiments were conducted at various pH values (2.8-9.3) using solutions of various selenite concentrations and at an adsorbent loading of 10 g/L. The data (Table 5) show that in the pH range of 4.75 to 7.5, almost 100% selenium removal from water samples containing 5 mg/L of selenium is possible. A significant amount of selenium removal (96% to 98%) is observed over a wide range of pH especially when the initial selenium concentration is less that 25 mg/L. Thus, the evidence indicates that γ alumina is a suitable adsorbent for selenite removal. It is therefore concluded that a pH range of 4.75 - 7.5 is optimal for selenite removal from synthetic solutions containing 50 mg/L or less of selenium. A sorbent loading higher than 10 g/L is warranted for solutions containing greater than 50 mg/L of selenite. Figure 2 shows the relationship between equilibrium concentration and uptake of selenite by γ alumina for various initial solution pH values.
14

Table 5 Adsorption of Selenite on γ Alumina (Loading 10 g/L)
Initial Conc. Final pH Final Conc. Metal Uptake Removal mg/L mg/L mg/g % Initial pH - 2.8 5.00 4.43 0.2 0.48 96.08 50.00 4.59 0.7 4.93 98.29 Initial pH – 4.75 5.00 6.07 ND* >0.50 ~100 50.00 6.44 0.2 4.98 99.63 Initial pH – 7.00 5.00 7.56 ND* >0.50 ~100 50.00 7.66 2.3 4.77 95.34 Initial pH – 7.5 5.00 7.40 ND* >0.50 ~100 25.00 8.17 0.4 2.46 98.29 50.00 8.35 1.5 4.85 97.02 75.00 8.29 7.0 6.80 90.63 100.00 8.57 23.9 7.61 76.10 Initial pH – 8.6 5.00 8.35 0.2 0.48 95.76 25.00 8.54 1.2 2.38 95.00 75.00 9.11 5.6 3.86 51.47 Initial pH – 9.3 5.00 9.20 0.8 0.42 84.30 25.00 9.21 6.4 1.86 74.20 50.00 9.28 22.6 2.74 54.80 75.00 9.25 36.8 3.82 50.93
ND*: not detectable
0.0
10.0
20.0
30.0
40.0
50.0
0.00 20.00 40.00 60.00 80.00Equlibirum Selenium Concentration, Ce (mg/L)
Sel
eniu
m U
ptak
e, Q
e (m
g/g) pH = 9.3 pH = 7.5
pH = 8.6 pH = 2.8pH = 4.75
Figure 2 Adsorption Isotherms at different solution pH (Sorbent-γ Alumina).
15
5.1.1.2 α alumina α Alumina provided a 27.8% removal corresponding to a selenium uptake of 1.39 mg/g in a preliminary study. Table 6 contains the data on adsorption studies conducted on α alumina. The adsorption capacities of α alumina are observed to be consistently less than that of γ alumina. The data show that the adsorption capacity of α alumina decreases with solution pH. Since selenite is an anion and high pH should render the sorbent more negatively charged, an increase in pH should result in lowered selenium removal. Another conclusion is that as compared to the γ form, α alumina possesses more negative charges on its surface. The only near complete selenium removal was observed from solutions containing 5 mg/L of selenium and whose initial pH was 2.8. The adsorption isotherms of α alumina (metal uptake vs. equilibrium concentration) are shown in Figure 3. Table 6 Adsorption of Selenite on α Alumina (Loading 10 g/L)
Initial Conc. mg/L
Final pH
Final Conc. mg/L
Metal uptake mg/g
Removal %
Initial pH – 2.8 5.00 3.35 ND 0.50 ~100 25.00 3.65 4.4 2.06 82.33 50.00 3.84 19.5 3.05 61.00 Initial pH – 4.0 5.00 4.55 0.3 0.47 94.20 25.00 4.92 6.7 1.83 73.04 50.00 5.20 23.4 2.66 53.20 75.00 4.65 47.9 2.71 36.13 Initial pH – 7.0 5.00 7.10 1.7 0.33 66.60 25.00 7.15 12.5 1.25 49.43 50.00 7.20 32.7 1.73 34.60 75.00 7.25 53.6 2.14 28.53 Initial pH – 7.5 5.00 8.05 2.5 0.25 49.89 25.00 8.11 16.4 0.86 34.40 50.00 8.36 36.1 1.39 27.80 75.00 8.38 61.1 1.39 18.53
16
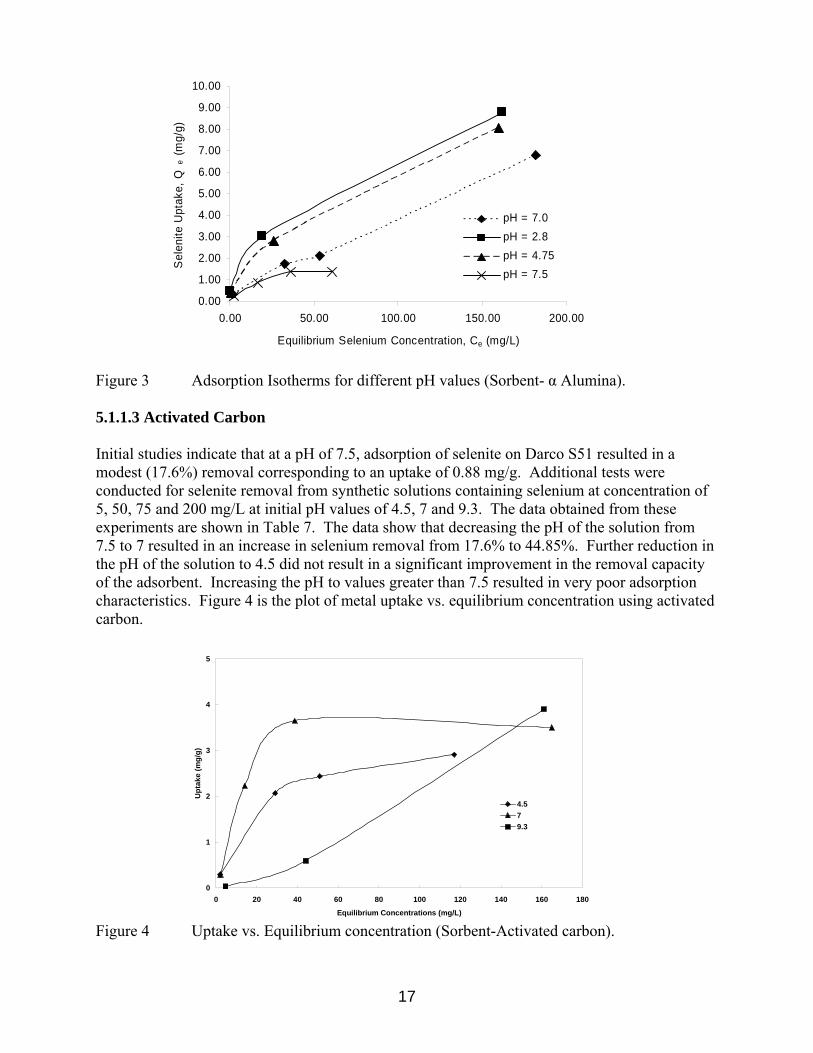
0.00
1.00
2.00
3.00
4.00
5.00
6.00
7.00
8.00
9.00
10.00
0.00 50.00 100.00 150.00 200.00
Equilibrium Selenium Concentration, Ce (mg/L)
Sel
enite
Upt
ake,
Qe
(mg/
g)
pH = 7.0pH = 2.8pH = 4.75pH = 7.5
Figure 3 Adsorption Isotherms for different pH values (Sorbent- α Alumina). 5.1.1.3 Activated Carbon Initial studies indicate that at a pH of 7.5, adsorption of selenite on Darco S51 resulted in a modest (17.6%) removal corresponding to an uptake of 0.88 mg/g. Additional tests were conducted for selenite removal from synthetic solutions containing selenium at concentration of 5, 50, 75 and 200 mg/L at initial pH values of 4.5, 7 and 9.3. The data obtained from these experiments are shown in Table 7. The data show that decreasing the pH of the solution from 7.5 to 7 resulted in an increase in selenium removal from 17.6% to 44.85%. Further reduction in the pH of the solution to 4.5 did not result in a significant improvement in the removal capacity of the adsorbent. Increasing the pH to values greater than 7.5 resulted in very poor adsorption characteristics. Figure 4 is the plot of metal uptake vs. equilibrium concentration using activated carbon.
0
1
2
3
4
5
0 20 40 60 80 100 120 140 160 180
Equilibrium Concentrations (mg/L)
Upt
ake
(mg/
g)
4.579.3
Figure 4 Uptake vs. Equilibrium concentration (Sorbent-Activated carbon).
17
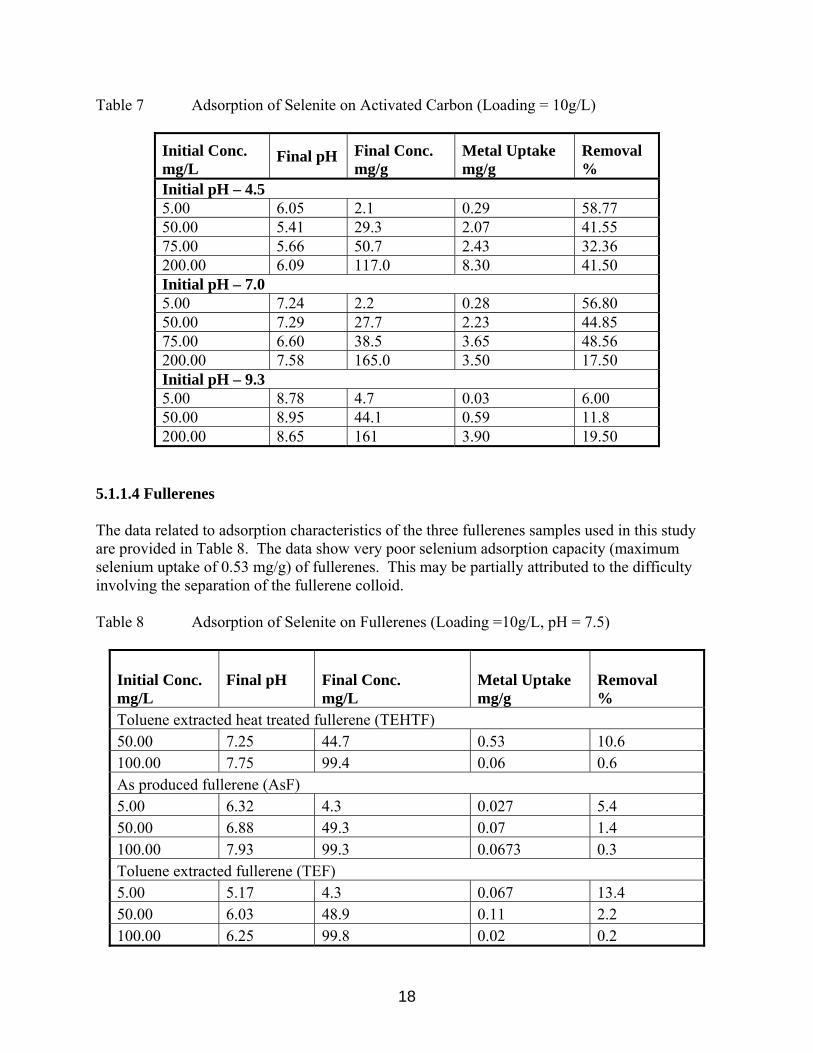
Table 7 Adsorption of Selenite on Activated Carbon (Loading = 10g/L)
Initial Conc. mg/L
Final pH Final Conc. mg/g
Metal Uptake mg/g
Removal %
Initial pH – 4.5 5.00 6.05 2.1 0.29 58.77 50.00 5.41 29.3 2.07 41.55 75.00 5.66 50.7 2.43 32.36 200.00 6.09 117.0 8.30 41.50 Initial pH – 7.0 5.00 7.24 2.2 0.28 56.80 50.00 7.29 27.7 2.23 44.85 75.00 6.60 38.5 3.65 48.56 200.00 7.58 165.0 3.50 17.50 Initial pH – 9.3 5.00 8.78 4.7 0.03 6.00 50.00 8.95 44.1 0.59 11.8 200.00 8.65 161 3.90 19.50
5.1.1.4 Fullerenes The data related to adsorption characteristics of the three fullerenes samples used in this study are provided in Table 8. The data show very poor selenium adsorption capacity (maximum selenium uptake of 0.53 mg/g) of fullerenes. This may be partially attributed to the difficulty involving the separation of the fullerene colloid. Table 8 Adsorption of Selenite on Fullerenes (Loading =10g/L, pH = 7.5)
Initial Conc. mg/L
Final pH
Final Conc. mg/L
Metal Uptake mg/g
Removal %
Toluene extracted heat treated fullerene (TEHTF) 50.00 7.25 44.7 0.53 10.6 100.00 7.75 99.4 0.06 0.6 As produced fullerene (AsF) 5.00 6.32 4.3 0.027 5.4 50.00 6.88 49.3 0.07 1.4 100.00 7.93 99.3 0.0673 0.3 Toluene extracted fullerene (TEF) 5.00 5.17 4.3 0.067 13.4 50.00 6.03 48.9 0.11 2.2 100.00 6.25 99.8 0.02 0.2
18
5.1.1.5 Fly Ash Derived Char Carbon The results of metal uptake and the removal of selenite using fly ash are provided in Table 9. The data show that a decrease in the carbon content of the fly ash adsorbents resulted in an improvement in the removal capacity. This improvement was also accompanied by a significant increase in the pH. The increase in the pH is attributed to the dissolution of calcium hydroxide formed from the lime present in the fly ash. Table 10 contains the data of adsorption experiments conducted on water samples containing 5 mg/L selenite at a pH of 7. A decrease in pH led to an improvement in the adsorption capacity for SIUF_C. No such enhancement in adsorption of selenium was observed for the three tailings samples (SIUF_T1, SIUF_T2, and SIUF_T3). The selenium removal mechanism for the tailings samples and the whole fly ash may involve both, adsorption as well as precipitation. The sample entitled SIUF_C, which contains over 85% carbon by weight, exhibited adsorption capacities similar to that of Darco S 51. Table 9 Adsorption of Selenite on Fly Ash (Loading = 10g/L, pH = 7.5)
Initial Conc. Final pH Final Conc. Metal uptake Removal mg/L mg/L mg/g %
Original Southern Illinois Fly ash (SIUF_F) 5.00 11.66 1.7 0.33 65.80 25.00 11.71 0.8 2.42 96.61 50.00 11.72 0.4 4.96 99.10 75.00 11.75 2.3 7.27 96.92 100.00 11.79 3.4 9.66 96.57 Final Conc. (SIUF_C) 5.00 8.29 3.1 0.19 40.32 50.00 8.95 44.2 0.58 11.70 Stage 3 tail (SIUF_T3) 5.00 9.12 0.6 0.43 87.36 50.00 9.24 31.7 1.83 36.51 Stage 2 tail (SIUF_T2) 5.00 10.06 0.5 0.45 89.85 50.00 10.22 22.9 2.70 54.17 Stage 1 tail (SIUF_T1) 5.00 11.15 0.4 0.46 92.79 50.00 11.43 1.3 4.87 97.47
Table 10 Adsorption of Selenite on Fly ash (Loading = 10g/L, pH = 7.0) Adsorbent Initial Conc.
mg/L Final pH
Final Conc. mg/L
Metal uptake mg/g
Removal %
SIUF_C 5.00 8.01 2.0 0.30 61.28 SIUF_T3 5.00 7.98 0.9 0.39 80.47 SIUF_T2 5.00 8.18 1.3 0.37 74.43 SIUF_T1 5.00 10.92 1.0 0.40 80.12
19

5.1.1.6 Chitin Chitin is a naturally occurring polymer that could be used from wastewater treatment. The equilibrium data on the adsorption of selenite on chitin is provided in Table 11. The data show that for solutions prepared at a pH of 7.5, up to 50% selenium removal can be achieved. However, the use of chitin for selenium removal is found to be generally ineffective at loadings of 10 g/L. Chitosan, a polymer derived by incorporating NH2 – group to chitin will also be examined for its ability to remove selenium from aqueous solutions. It has been reported in the literature that the modification of cellulose by amine groups enhance the selectively for selenate removal. Table 11 Adsorption of Selenite on Chitin (Loading 10g/L, pH = 7.5).
Initial Conc. Final pH Final Conc. Metal Uptake Removal mg/L mg/L mg/g % 5.00 6.65 2.3 0.27 54.23 25.00 6.84 18.9 0.61 24.20 50.00 6.98 45.1 0.50 9.90 100.00 7.16 95.9 0.41 4.11
5.1.1.7 Summary of Results The studies on the adsorption of selenite by different sorbents showed that commercially available activated alumina (γ alumina) is best suited for selenite adsorption. Activated carbons were ineffective in selenite removal, except in a narrow pH range of 2.3-5. The fly ash derived carbons showed low adsorption capacities. Other adsorbents such as fullerenes and chitin were completely ineffective in removing selenite from contaminated solutions. 5.1.2 Adsorption of Selenate Preliminary studies were conducted on the selenate adsorption from contaminated solutions using the commercially available adsorbents. Synthetic selenate solution of 0.998, 5.4 and 50 mg/L Se (VI) was prepared and treated with 4 g/L of adsorbents loading. Under equilibrium conditions (Table 12), activated carbon Darco S51, provided the highest removals (6.45 mg Se (VI)/ g of adsorbent). However, on decreasing the pH, the uptake by activated carbon, Darco-S51, deteriorated. In this set of experiments, activated carbon (Darco S51) showed the highest removals (61%). Negligible removals (<10%) were observed via the use of fly ash derived carbons.
20

Table 12 Preliminary experiments on adsorption of selenate on various surfaces (100 hr). Synthetic selenate solution was used.
Init. Se (VI) Conc.
Sorbent Loading
Init. pH
Final pH
Final Se Conc.
Removal uptake
mg/L g/L mg/L % mg/g Darco S-51 50.00 4 7.5 4.9 24.20 51.60 6.45 Darco S-51 50.00 4 7.1 36.4 27.20 3.40 Darco S-51 50.00 4 4.0 48.7 2.40 0.30 Darco HDB 50.00 4 7.5 8.3 31.70 36.60 4.58 Darco HDB 50.00 4 7.1 - 48.6 2.80 0.35 Darco S-51 5.44 5 7.5 2.12 61.01 0.66 Darco HDB 5.44 5 7.5 4.32 20.80 0.23 Darco S-51 0.998 4 7.1 0.717 28.30 0.07 Darco HDB 0.998 4 7.1 0.55 45.00 0.11 SIUF_C 50.00 4 7.5 8.7 45.30 9.40 1.18 LOEF_C 50.00 4 7.5 7.4 44.80 10.40 1.30
The data on selenate removal from synthetic solutions via the use of adsorbents is provided in Table 13. A maximum of nearly 52 % removal of selenate was achievable by the use of as-received adsorbents. Chitosan and γ alumina provided comparable selenate uptakes of nearly 4.6 mg/g. Chitosan (chitin with amine group) provides better adsorption than chitin presumably due to the presence of excess amine groups that render the surface more positive charges. α alumina showed removals of 3.1 mg/g. The other adsorbents (chitin, ferrihydrite, δ FeOOH-A and B) did not show any adsorption of selenate greater than 2 mg /g. The two types of fullerenes tested in this study were found to be completely ineffective in removing selenate. Based on these preliminary studies, additional experiments were conducted using alumina (γ and α phase), chitosan and toluene-extracted heat-treated fullerenes (TEHTF) using a solution containing 50 mg/L selenate at pH values of 4 and 7.1. The results from these experiments are provided in Table 14. It is observed that decreasing the pH slightly improved the removal capacity of γ alumina. Chitosan was found to be ineffective for selenate removal at these pH values, as was the fullerene sample, TEHTF. Experiments were also conducted at lower initial selenate concentrations (5.44 and 0.998 mg/L) using certain selected adsorbents including cellulose (precursor for chitin). Table 15 presents the data on the experiments conducted on aqueous solutions containing an initial selenate concentration of 5.44 mg/L. In this set of experiments, γ alumina showed the highest removals (61%). No further experiments were conducted with cellulose. The experiments on synthetic solutions containing an initial Se (VI) concentration of 0.998 mg/L are reported in Table 16. The final selenate concentration was reduced to 0.055 mg/L using 4 g/L of γ alumina (94% removal). This extent of selenate removal lends expectations to removals corresponding to final concentration of 10 ppb using γ alumina, albeit at higher loadings than used in this investigation. Experiments were repeated under identical conditions to confirm this finding.
21

Table 13 Preliminary experiments on adsorption of selenate on various surfaces (100 hr). Synthetic selenate solution was used.
Init. Se (VI) Conc.
Sorbent Loading
Init. pH
Final pH
Final Se Conc.
Removal uptake
mg/L g/L mg/L % mg/g γ alumina 50.00 4 7.5 7.6 31.40 37.20 4.65 α alumina 50.00 4 7.5 7.9 37.60 24.80 3.10 chitin 50.00 4 7.5 7.6 44.40 11.20 1.40 chitosan 50.00 4 7.5 7.9 31.50 37.00 4.63 Ferrihydrite 50.00 4 7.5 7.8 42.50 15.00 1.88 δ FeOOH-A 50.00 4 7.5 4.7 44.30 11.40 1.43 δ FeOOH-B 50.00 4 7.5 4.4 45.00 10.00 1.25 Ferric hydroxide 50.00 4 7.5 6.4 42.50 15.00 1.88 As produced fullerene 50.00 2 7.5 6.9 49.1 1.80 0.45
toulene extracted fullerene 50.00 2 7.5 7.2 48.5 3.00 0.75
Table 14 Effect of pH on selenate removal on selected adsorbents (100 hours). Synthetic
selenate solution was used.
Init. Se (VI) Conc.
Sorbent Loading
Init. pH
Final Se Conc.
Uptake Removal
mg/L g/L mg/L mg/g % γ alumina 50.00 4 7.1 40.3 2.43 19.40 γ alumina 50.00 4 4.0 34.9 3.78 30.20 α alumina 50.00 4 7.1 48.8 0.30 2.40 α alumina 50.00 4 4.0 44.5 1.38 11.00 Chitosan 50.00 4 7.1 50 0.00 0.00 Chitosan 50.00 4 4.0 46.3 0.93 7.40 TEHTF 50.00 4 7.1 50 0.00 0.00 TEHTF 50.00 4 4.0 49.2 0.20 1.60
22

Table 15 Adsorption experiments on selected adsorbents from synthetic solutions containing 5.44 mg/L selenate (100 hours).
Init. Se (VI) Conc.
Sorbent Loading
Init. pH
Final Se Conc.
Removal uptake
mg/L g/L mg/L % mg/g γ alumina 5.44 5 7.5 2.43 55.42 0.60 α alumina 5.44 5 7.5 4.46 18.14 0.20 Chitosan 5.44 5 7.5 3.96 27.30 0.30 Chitin 5.44 5 7.5 3.82 29.91 0.33 Cellulose 5.44 5 7.5 4.58 15.77 0.24 TEHTF 5.44 5 7.5 4.23 22.28 0.17
Table 16 Adsorption experiments on selected adsorbents from synthetic solutions
containing 0.998 mg/L selenate (100 hours).
Init. Se (VI) Conc.
Sorbent Loading
Init. pH
Final Se Conc.
Uptake Removal
mg/L g/L mg/L mg/g % TEHTF 0.998 4 7.1 0.743 0.06 25.70 α alumina 0.998 4 7.1 0.461 0.13 53.90 chitosan 0.998 4 7.1 0.37 0.16 63.00 γ alumina 0.998 4 7.1 0.055 0.24 94.50
Further tests were conducted to evaluate the use of fly ash derived char carbon in the selenate removal. Experiments from 1.38 mg/L selenate solutions via adsorption onto the various flotation fractions obtained from both types of fly ash are presented in Table 17. A maximum removal of 59.93% was achievable on the extracted carbon from FBC generated fly ash (SIUF_C). The final selenate concentration at the end of the experiment was found to be 0.553 mg/L. The flotation tailings fractions obtained from the FBC generated fly ash could remove 22-26% selenate from 1.38 mg/L selenate solution. Surprisingly the overall fly ash showed significantly lower removal than any of its components. Detailed experiments were performed on this fraction and compared with selenate removals obtained by employing carbon extracted from the PCC generated fly ash (LOEF_C). The use of PCC generated fly ash (LOEF) as a sorbent resulted in a selenium removal of 26.09%. The removal of the as-received LOEF fly ash was greater than that of its components which ranged from 10% to 22%. Several differences in the adsorption characteristics were observed for the two types of fly ash. It has already been mentioned the use of SIUF resulted in a removal that was less than any of its components and the use of LOEF was greater than any of its components. Among the tailings fractions, the use of SIUF_T3 resulted in the highest removal while that of LOEF_T3 resulted in the lowest selenate removal. The T3 fraction contains the lowest ash percent amongst the tailings fraction. The adsorption characteristics of these fractions are significantly dependent on the ash percent and the characteristics of the inorganic fraction. The two types of fly ash are significantly different
23
in their physiochemical characteristics due to the differences in the conditions under which they were generated (Table 13). Table 17 Adsorption of selenate onto different floatation fractions of two types of fly ash –
LOEF and SIUF
Init. Se (VI) Conc.
Sorbent Loading
Init. pH
Final Se Conc.
Removal uptake
mg/L g/L mg/L % mg/g SIUF 1.38 10 7.5 1.3 5.80 0.008 SIUF_T1 1.38 10 7.5 1.07 22.46 0.031 SIUF_T2 1.38 10 7.5 1.05 23.91 0.033 SIUF_T3 1.38 10 7.5 1.02 26.09 0.036 SIUF_C 1.38 10 7.5 0.553 59.93 0.0827 LOEF 1.38 10 7.5 1.02 26.09 0.036 LOEF_T1 1.38 10 7.5 1.1 20.29 0.028 LOEF_T2 1.38 10 7.5 1.08 21.74 0.03 LOEF_T3 1.38 10 7.5 1.23 10.87 0.015 LOEF_C 1.38 10 7.5 1.07 22.46 0.031
5.1.2.1 Summary of Results Thus it can be concluded that selenate is more difficult to remove from aqueous solutions than selenite. The redox conditions (based on pH and concentration of selenium) in the as-received agricultural water samples results in the existence of selenium in the higher oxidation state – selenate. The low selenium removals employing adsorbent can be attributed to the inherent difficulty to remove selenate via adsorption, in conjunction with the amount of competing anions present for the sorbent sites. 5.2 Phase I: Task 2 – Modification of Carbons In order to enhance the adsorption capacities of activated carbons and fly ash derived activated carbons, chemical modification was performed on the carbons by treating them with copper salt solution. The purpose of this treatment was to increase the positive charges on the surface and thereby enhance attraction of the negatively charged selenium oxyanions to the surface. The method of chemical modification has been described earlier in this report. The adsorbents upon chemical modification are CMAC (chemically modified commercial activated carbon (Darco S-51), CMSIU (chemically modified SIUF_C char carbon) and CMLOE (chemically modified LOEF_C char carbon). Adsorption studies were conducted to evaluate the effect of modification and the results are described in the following paragraphs.
24
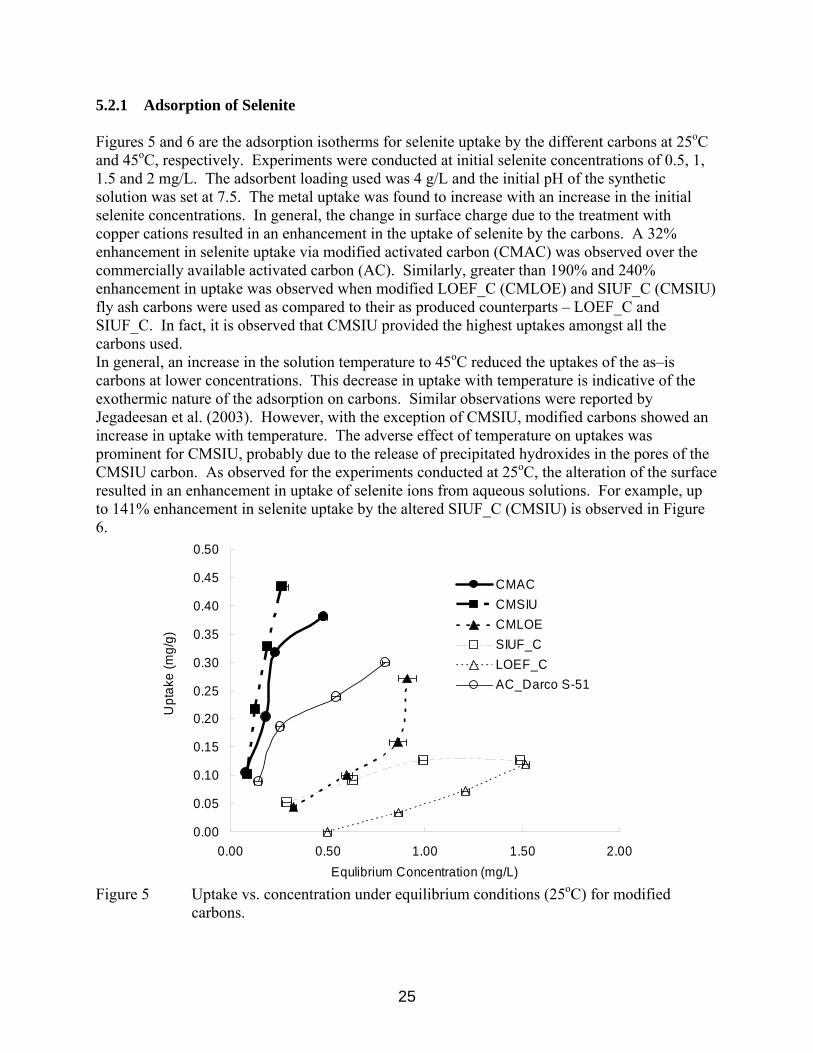
5.2.1 Adsorption of Selenite Figures 5 and 6 are the adsorption isotherms for selenite uptake by the different carbons at 25oC and 45oC, respectively. Experiments were conducted at initial selenite concentrations of 0.5, 1, 1.5 and 2 mg/L. The adsorbent loading used was 4 g/L and the initial pH of the synthetic solution was set at 7.5. The metal uptake was found to increase with an increase in the initial selenite concentrations. In general, the change in surface charge due to the treatment with copper cations resulted in an enhancement in the uptake of selenite by the carbons. A 32% enhancement in selenite uptake via modified activated carbon (CMAC) was observed over the commercially available activated carbon (AC). Similarly, greater than 190% and 240% enhancement in uptake was observed when modified LOEF_C (CMLOE) and SIUF_C (CMSIU) fly ash carbons were used as compared to their as produced counterparts – LOEF_C and SIUF_C. In fact, it is observed that CMSIU provided the highest uptakes amongst all the carbons used. In general, an increase in the solution temperature to 45oC reduced the uptakes of the as–is carbons at lower concentrations. This decrease in uptake with temperature is indicative of the exothermic nature of the adsorption on carbons. Similar observations were reported by Jegadeesan et al. (2003). However, with the exception of CMSIU, modified carbons showed an increase in uptake with temperature. The adverse effect of temperature on uptakes was prominent for CMSIU, probably due to the release of precipitated hydroxides in the pores of the CMSIU carbon. As observed for the experiments conducted at 25oC, the alteration of the surface resulted in an enhancement in uptake of selenite ions from aqueous solutions. For example, up to 141% enhancement in selenite uptake by the altered SIUF_C (CMSIU) is observed in Figure 6.
0.00
0.05
0.10
0.15
0.20
0.25
0.30
0.35
0.40
0.45
0.50
0.00 0.50 1.00 1.50 2.00Equlibrium Concentration (mg/L)
Upt
ake
(mg/
g)
CMACCMSIUCMLOESIUF_CLOEF_CAC_Darco S-51
Figure 5 Uptake vs. concentration under equilibrium conditions (25oC) for modified
carbons.
25

0.00
0.05
0.10
0.15
0.20
0.25
0.30
0.35
0.40
0.45
0.50
0.00 0.50 1.00 1.50 2.00Equlibrium Concentration (mg/L)
Upt
ake
(mg/
g)
CMACCMSIUCMLOESIUF_CLOEF_C
Figure 6 Uptake vs. concentration under equilibrium conditions (45oC) for modified
carbons.
0.00
0.05
0.10
0.15
0.20
0.25
0.30
0.0 2.0 4.0 6.0 8.0 10.0
pH
Upt
ake
(mg/
g)
CMACCMSIUCMLOESIUF_CLOEF_C
Figure 7 Effect of pH on selenite removal using modified carbons.
26

0.00
0.10
0.20
0.30
0.40
0.50
0.60
0.70
0.0 2.0 4.0 6.0 8.0 10.0 12.0Loading (g/L)
Equ
ilibr
ium
Upt
ake
(mg/
g)
0
10
20
30
40
50
60
70
80
90
100
Rem
oval
(%)
CMACCMSIUCMLOE
Figure 8 (a) Effect of Loading on selenium uptake and removal by modified carbons.
0.00
0.02
0.04
0.06
0.08
0.10
0.12
0.14
0.16
0.0 2.0 4.0 6.0 8.0 10.0 12.0Loading (g/L)
Equ
ilibr
ium
Upt
ake
(mg/
g)
0.010.020.030.040.050.060.070.080.090.0100.0
Rem
oval
(%)
SIUF_CLOEF_C
Figure 8 (b) Effect of loading on selenium uptake and removal by as–produced carbons As expected, lowering the solution pH enhanced the selenite uptake (Figure 7). However, it is observed that lowering the pH to very acidic values (< 4) resulted in a decrease in the uptake by modified activated carbon and CMSIU. It is possible than the anion associated with the proton could inhibit (competitive adsorption) selenium uptake. The effect of loading on selenite uptake and removal by the modified carbons is shown in Figure
27

8 a. As expected, the uptakes are observed to decrease with an increase in the sorbent loading. When compared with the data Table 10, it is seen that significantly higher uptakes (more than 4 times) are observed when modified carbons are employed as compared to untreated carbons using the same loading. The removals are however, observed to increase. Greater than 95% removal is observed at a sorbent loading of 10 g/L for both CMSIU and CMAC. The selenite removal achieved via adsorption onto CMLOE was approximately 71% at a loading of 10 g/L. 5.2.2 Adsorption of Selenate Experiments were also conducted with the modified carbons to remove selenate from aqueous solutions. Negligible removals were achieved using modified LOEF_C. The following discussion involves the removal of selenate employing the modified activated carbon (CMAC) and modified SIUF_C (CMSIU). Figure 9 contains the adsorption isotherm data for CMAC. Unlike the adsorption of selenite, the modified activated carbon clearly shows higher uptakes than CMSIU. The insert contains the data on the influence of temperature on selenate uptake by the two forms of modified carbons. An increase in temperature from 25oC to 60oC results in a slight increase in the uptake on CMAC when 1 mg/L (ppm) selenate solution was used. However, on increasing the initial selenate concentration to 2 mg/L (ppm), a similar increase in temperature resulted in a decrease in the uptake. On the other hand, the uptakes by CMSIU from a 1mg/L solution of selenate improved by 139% when the temperature was increase by 40oC. A similar increase in temperature resulted in a 96% increase in uptake of selenite by CMSIU from a 2 mg/L solution. It can be concluded that the uptake of selenium by modified activated carbon is exothermic while that by CMSIU is endothermic.
0.000
0.050
0.100
0.150
0.200
0.250
0.300
0.350
0.000 0.500 1.000 1.500 2.000Equlibrium Concentration (mg/L)
Upt
ake
(mg/
g)
CMACCMSIU
0.000
0.050
0.100
0.150
0.200
0.250
0 10 20 30 40 50 60 70Temperature
Upt
ake
(mg/
g)
CMAC (Se = 1ppm)CMAC (Se = 2 ppm)CMSIU (Se = 1 ppm)CMSIU (Se = 2ppm)
Figure 9 Adsorption isotherms for selenate uptake by modified activated carbons (Insert –
Effect of temperature on the uptake of selenate)
28
0
10
20
30
40
50
60
70
0 2 4 6 8 10 12pH
Rem
oval
(%)
CMACCMSIU
Figure 10 Effect of pH on the removal of selenate by modified carbons. Initial selenate
concentration = 1 mg/L.
0.000
0.050
0.100
0.150
0.200
0.250
0.300
0 2 4 6 8 10 12Loading (g/L)
Upt
ake
(mg/
g)
0
10
20
30
40
50
60
70
80
Rem
oval
(%)
CMAC -uptakeCMSIU- uptakeCMAC - removalCMSIU -removal
Figure 11 Effect of sorbent loading on selenate removal from aqueous solutions. Initial
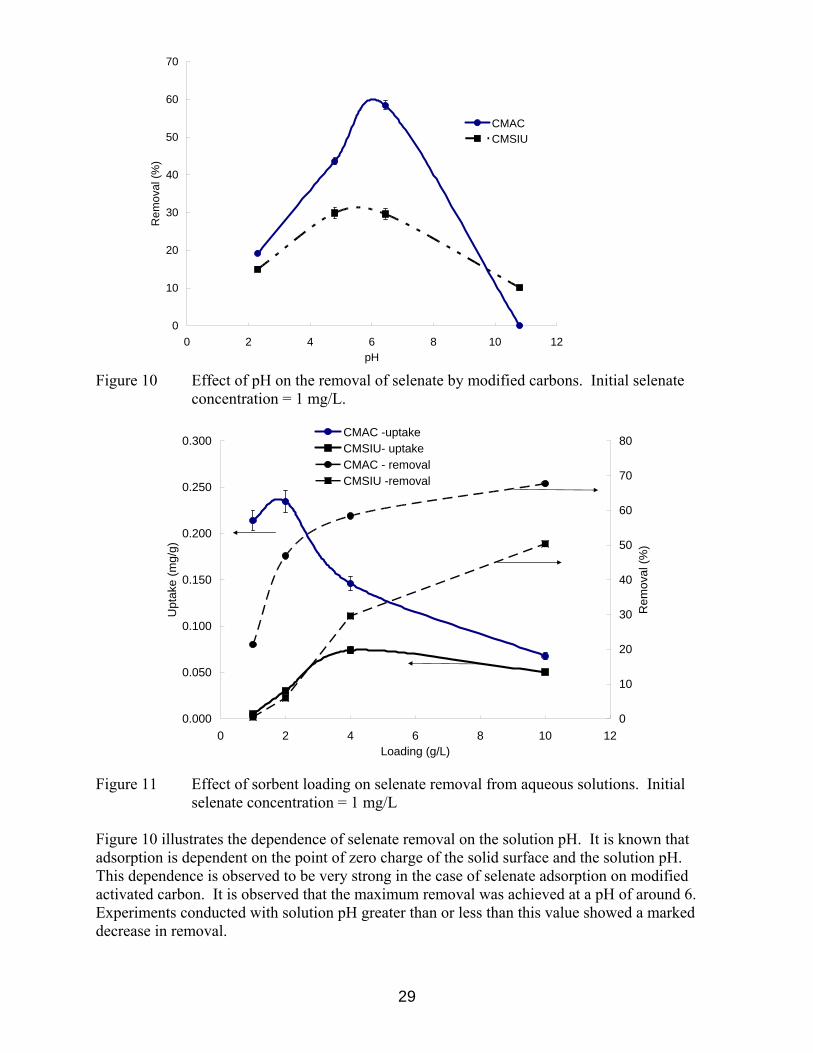
selenate concentration = 1 mg/L Figure 10 illustrates the dependence of selenate removal on the solution pH. It is known that adsorption is dependent on the point of zero charge of the solid surface and the solution pH. This dependence is observed to be very strong in the case of selenate adsorption on modified activated carbon. It is observed that the maximum removal was achieved at a pH of around 6. Experiments conducted with solution pH greater than or less than this value showed a marked decrease in removal.
29
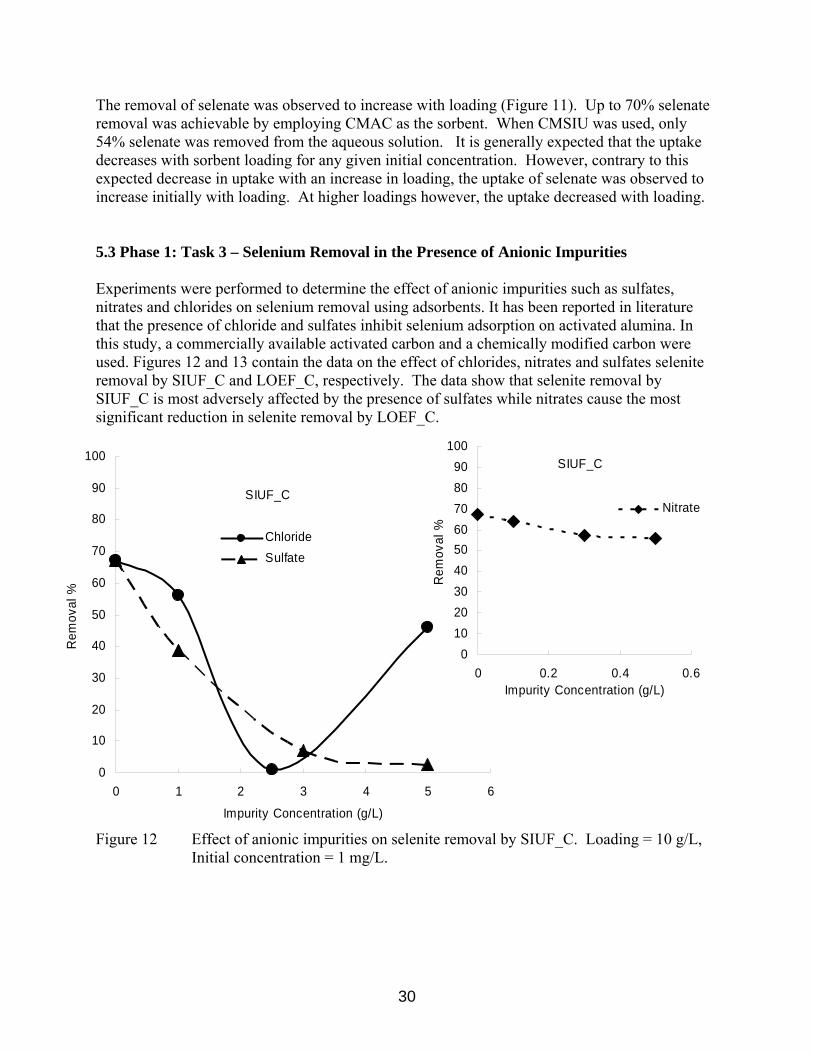
The removal of selenate was observed to increase with loading (Figure 11). Up to 70% selenate removal was achievable by employing CMAC as the sorbent. When CMSIU was used, only 54% selenate was removed from the aqueous solution. It is generally expected that the uptake decreases with sorbent loading for any given initial concentration. However, contrary to this expected decrease in uptake with an increase in loading, the uptake of selenate was observed to increase initially with loading. At higher loadings however, the uptake decreased with loading. 5.3 Phase 1: Task 3 – Selenium Removal in the Presence of Anionic Impurities Experiments were performed to determine the effect of anionic impurities such as sulfates, nitrates and chlorides on selenium removal using adsorbents. It has been reported in literature that the presence of chloride and sulfates inhibit selenium adsorption on activated alumina. In this study, a commercially available activated carbon and a chemically modified carbon were used. Figures 12 and 13 contain the data on the effect of chlorides, nitrates and sulfates selenite removal by SIUF_C and LOEF_C, respectively. The data show that selenite removal by SIUF_C is most adversely affected by the presence of sulfates while nitrates cause the most significant reduction in selenite removal by LOEF_C.
0102030405060708090
100
0 0.2 0.4 0.6Impurity Concentration (g/L)
Rem
oval
%
Nitrate
SIUF_C 0
10
20
30
40
50
60
70
80
90
100
0 1 2 3 4 5 6
Impurity Concentration (g/L)
Rem
oval
%
Chloride Sulfate
SIUF_C
Figure 12 Effect of anionic impurities on selenite removal by SIUF_C. Loading = 10 g/L, Initial concentration = 1 mg/L.
30

0
5
10
15
20
25
30
0 1 2 3 4 5 6Im purity Concentration (m g/L)
Rem
oval
%
Chloride
Sulfate
LOEF_C
0
5
10
15
20
25
30
0 0.2 0.4 0.6Impurity Concentration (mg/L)
Rem
oval
%
Nitrate
LOEF C
Figure 13 Effect of anionic impurities on selenite removal by LOEF_C. Loading = 10 g/L,
Initial concentration = 1 mg/L 5.3.1 Adsorption of Selenite Figures 14 -16 contain the data on the comparison of selenite removal by the three forms of modified carbons from aqueous solution containing various concentrations of anionic impurities, namely chlorides, nitrates and sulfates. It is observed that the modified carbons after extraction from fly ash obtained from the Lake of Egypt power plant (CMLOE) was most sensitive to the anionic impurities showing significant decrease selenite removal. The uptake by the modified carbons extracted from the SIU FBC power plant fly ash (CMSIU) was least affected by their presence. It was observed that very small amounts of nitrates significantly reduced the removal of selenite from the aqueous solutions. For example, when the nitrate concentration was increased from 0.1 to 0.3 g/L, the selenite removal by CMLOE was reduced from 62% to 12%, a 64.5% decrease. As compared to an identical concentration of sulfate, the presence of nitrate resulted in a 64% decrease in selenite removal. The presence of both sulfate and nitrate resulted in a very significant decrease in selenite, when CMSIU was used as the adsorbent.
31

0
10
20
30
40
50
60
70
80
90
100
0 1 2 3 4 5 6Chloride Impurity Concentration (g/L)
Sel
enite
Rem
oval
%
CMACCMSIUCMLOESIUF_CLOEF_C
Figure 14 Effect of chlorides on selenite removal by modified carbons. Initial selenite
concentration = 1 mg/L; Loading = 10 g/L
0
10
20
30
40
50
60
70
80
90
100
0 0.1 0.2 0.3 0.4 0.5 0.6Nitrate Impurity Concentration (g/L)
Sel
enite
Rem
oval
%
CMACCMSIUCMLOESIUF_CLOEF_C
Figure 15 Effect of nitrates on selenite removal by modified carbons. Initial selenite
concentration = 1 mg/L; Loading = 10 g/L
32

0
10
20
30
40
50
60
70
80
90
100
0 1 2 3 4 5 6Sulfate Impurity Concentration (g/L)
Sel
enite
Rem
oval
%
CMACCMSIUCMLOESIUF_CLOEF_C
Figure 16 Effect of sulfates on selenite removal by modified carbons. Initial selenite
concentration = 1 mg/L; Loading = 10 g/L 5.3.2 Adsorption of Selenate Figures 17 -19 provide the data on selenate removal by the three forms of modified carbons from aqueous solution containing various concentrations of anionic impurities, namely chlorides, nitrates and sulfates. The removal of selenate by both the adsorbents was strongly affected by the presence of anionic impurities. Of the three species, sulfates adversely affected the removal of selenate the most, followed by nitrates and chlorides, respectively. For example, when MAC was used, no removal was observed in the presence of 5 g/L of sulfate. The decrease in removal due to the presence of nitrate and chloride was calculated to be 77.9% and 70.5%, respectively.
33

0.00
10.00
20.00
30.00
40.00
50.00
0.00 1.00 2.00 3.00 4.00 5.00 6.00Chloride Impurity Concentration (g/L)
Sel
enat
e R
emov
al (%
) CMACCMSIUCMLOE
Figure 17 Effect of chlorides on selenate removal by modified carbons. Initial selenate concentration = 1 mg/L; Loading = 10 g/L
0
10
20
30
40
50
0.00 1.00 2.00 3.00 4.00 5.00 6.00Nitrate Impurity concentration (g/L)
Sel
enat
e R
emov
al (%
) CMAC
CMSIU
CMLOE
Figure 18 Effect of nitrates on selenate removal by modified carbons. Initial selenate
concentration = 1 mg/L; Loading = 10 g/L.
34

0.00
2.00
4.00
6.00
8.00
10.00
0.00 1.00 2.00 3.00 4.00 5.00 6.00Sulfate Impurity Concentration (g/L)
Sel
enat
e R
emov
al (%
) CMACCMSIUCMLOE
Figure 19 Effect of sulfates on selenate removal by modified carbons. Initial selenate
concentration = 1 mg/L; Loading = 10 g/L. 5.4 Phase I: Task 4-As-Received Agricultural Drainage Water All the above experiments were performed on synthetic solutions contaminated with selenium and other anionic impurities. Further experiments on the as –received agricultural water samples were performed to confirm the findings. Adsorption studies were conducted using both commercially available adsorbents and chemically modified carbons. Tables 18 and 19 contain the data on the final selenium concentration in the treated samples. It can be seen that no significant selenium removal was observed. The measured values were within the margin of experimental and measurement errors thus leading us to conclude that no significant removal can be expected by these adsorbents. Table 18 Adsorption experiments using various adsorbents on as-received agricultural
drainage water. (100 hours)
Loading Final Concentration 4 g/L mg/L
α alumina 0.946 γ alumina 0.943 As produced fullerene 1.060 Toulene extracted fullerene 1.080 Darco S-51 0.951 Darco HDB 0.921 Ferrihydrite 0.902 δ FeOOH-A 0.915 SIUF_C 0.947 LOEF_C 0.926 Ferric hydroxide 0.889 δ FeOOH-B 0.910
35

Table 19 Adsorption experiments using modified carbon adsorbents on as-received
agricultural drainage water. (100 hours)
Loading 4 g/L
Final Concentration mg/L
CMAC 1.04 CMLOE 1.15 CMSIU 1.06
5.4.1 Summary Thus it can be seen from the data that the presence of high amounts of anionic impurities affect selenium removal. The extent of inhibition of adsorption varied among adsorbents and the type of impurity. Since as-received agricultural water samples have high amounts of anionic impurities (Table 2), the use of adsorption technique is ineffective for selenium removal. 5.5 Phase I: Task 5 – Zeta Potential Measurements The performance of the adsorbents is directly proportional to the amount of positive surface charges present at a certain pH. As selenium species are negatively charged anions, it is expected that adsorbents surface displaying positive charges would provide better attraction of selenium ions and thereby increase removal. Zeta Meter measurements were performed to evaluate the potential of each adsorbent and confirm the mechanism of selenium removal via adsorption.
-80.00
-60.00
-40.00
-20.00
0.00
20.00
40.00
0.0 2.0 4.0 6.0 8.0 10.0 12.0 14.0
pH
Zeta
pot
entia
l (m
V)
LOEF_C
SIUF_C
CMAC
CMSIU
CMLOE
AC_Darco S-51
Figure 20 Zeta Potential of various carbons vs pH.
36
Modification of the carbon surface resulted in significant changes in the surface charge density (Figure 20). The data from the zeta potential curves show that, for activated carbon (AC), the pzc increased from 3.9 to 9.8 upon surface modification due to chemical treatment. It was also observed that the surface showed positive zeta potential over a wide pH range. The zeta potential measurements on other adsorbents such as α alumina, γ alumina and chitin showed that the isoelectric point of these adsorbents was at pH values of 9.2, 9.5 and 4, respectively. Thus it can be observed that selenite removal via adsorption on to alumina was due to the presence of positive charges on the surface for a wide pH range.
37
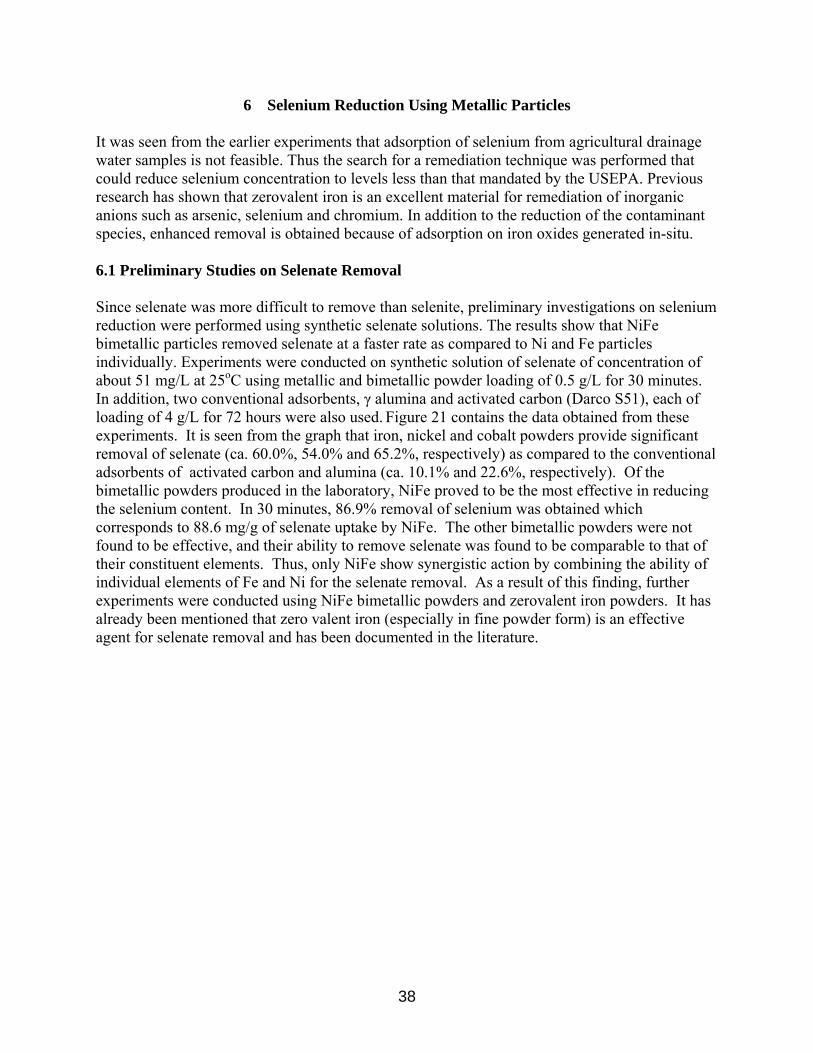
6 Selenium Reduction Using Metallic Particles It was seen from the earlier experiments that adsorption of selenium from agricultural drainage water samples is not feasible. Thus the search for a remediation technique was performed that could reduce selenium concentration to levels less than that mandated by the USEPA. Previous research has shown that zerovalent iron is an excellent material for remediation of inorganic anions such as arsenic, selenium and chromium. In addition to the reduction of the contaminant species, enhanced removal is obtained because of adsorption on iron oxides generated in-situ. 6.1 Preliminary Studies on Selenate Removal Since selenate was more difficult to remove than selenite, preliminary investigations on selenium reduction were performed using synthetic selenate solutions. The results show that NiFe bimetallic particles removed selenate at a faster rate as compared to Ni and Fe particles individually. Experiments were conducted on synthetic solution of selenate of concentration of about 51 mg/L at 25oC using metallic and bimetallic powder loading of 0.5 g/L for 30 minutes. In addition, two conventional adsorbents, γ alumina and activated carbon (Darco S51), each of loading of 4 g/L for 72 hours were also used. Figure 21 contains the data obtained from these experiments. It is seen from the graph that iron, nickel and cobalt powders provide significant removal of selenate (ca. 60.0%, 54.0% and 65.2%, respectively) as compared to the conventional adsorbents of activated carbon and alumina (ca. 10.1% and 22.6%, respectively). Of the bimetallic powders produced in the laboratory, NiFe proved to be the most effective in reducing the selenium content. In 30 minutes, 86.9% removal of selenium was obtained which corresponds to 88.6 mg/g of selenate uptake by NiFe. The other bimetallic powders were not found to be effective, and their ability to remove selenate was found to be comparable to that of their constituent elements. Thus, only NiFe show synergistic action by combining the ability of individual elements of Fe and Ni for the selenate removal. As a result of this finding, further experiments were conducted using NiFe bimetallic powders and zerovalent iron powders. It has already been mentioned that zero valent iron (especially in fine powder form) is an effective agent for selenate removal and has been documented in the literature.
38

0
10
20
30
40
50
60
Fe NiCo Cu
NiFeNiC
oCoFe
CuFeCoCu
NiCu
Alumina
Activa
ted C
arbon
Removal Agent
Fina
l Con
cent
atio
n (p
pm)
Figure 21 Final concentration obtained in removal studies of metallic and bimetallic powders of
transition metals. Experiments were conducted at 25 oC for 30 minutes at a loading of 0.5 g/L. Synthetic selenate solutions containing 51 mg/L was used.
6.1.1 Selenate Removal using Iron Particles Experiments on selenate removal from synthetic solutions by iron powders were conducted at several initial concentrations of selenate and iron loadings. The residence time in these experiments was five hours. The results are provided in Table 20 A and B. The data in Table 20 A show that at a loading of 1 g/L, the selenate uptake by iron is greater than 65 mg/g. The data in Table 20 B show that non-detect levels are obtained at an initial concentration of 5 mg/L of selenate using loadings greater than 2 g/L. Using a synthetic solution of 51 mg/L initial selenate concentration, an increase in the particle loading from 0.1 g/L to 5 g/L resulted in an exponential decay in selenate uptake (Figure 22). It is seen from the data in Figure 23 that nearly no selenate removal is observed from a 5.4 mg/L selenate solution by iron powder of loading 1 g/L at a pH of 11. A total of 77.4 % removal (final Se concentration =1.21mg/L) was observed in an experiment conducted at a pH of 7.7 for five hours. A total of 90% removal was observed on further reducing the pH to 3.5. Table 20 Selenate removal studies using iron particles (5 hours). Synthetic solutions were
used. A Uptake (mg/g)
Initial Concentration (mg/L) 1 g/L 2 g/L 5 g/L 5 3.78 2.49 1.00 51 39.94 23.25 9.69 100 65.88 45.69 18.71
39

B Final Concentration (mg/L)
Initial Concentration (mg/L) 1 g/L 2 g/L 5 g/L 5 1.217 ND ND 51 11.062 4.496 2.540 100 34.122 8.62 6.46
ND-Non Detect
157.72
23.259.69
39.94
71.78
0
20
40
60
80
100
120
140
160
180
0 1 2 3 4 5 6
Loading (g/L)
Upt
ake
(mg/
g)
Figure 22 Effect of iron loading on the selenate uptake. Experiments were conducted at 25oC for
five hours. Synthetic solutions containing 51 mg/L was used.
Figure 23 Effect of pH on the selenate uptake. Experiments were conducted at 25oC for five
hours at a loading of 1 g/L of iron powder. Synthetic solutions containing 5.4 mg/L was used.
4.978
0.491
1.217
0
0.5
1
1.5
2
2.5
3
3.5
4
4.5
5
0 2 4 6 8 10 12pH
Con
cent
ratio
n (p
pm)
40

Figure 24 contains the data on the final selenate concentration after treatment of a 5.4 mg/L solution with 1 g/L of iron at temperatures ranging 25-65oC. The initial pH of the solutions was 7.7 and experiments were conducted for the duration of five hours. It is seen that the selenium removal increased from 77.4 % at 25oC to 94.6% at 65oC. This corresponds to a change in the final concentration of selenate in the synthetic solution from 1.21 mg/L (25oC) to 0.29 mg/L (65oC).
0.290
1.217
0.952
0
0.2
0.4
0.6
0.8
1
1.2
1.4
1.6
1.8
2
0 10 20 30 40 50 60 70
Temperature (C)
Con
cent
ratio
n (p
pm)
Figure 24 Effect of temperature on the selenate uptake. Experiments were conducted at 25oC
and a pH of 7.7 for five hours at a loading of 1 g/L iron powder. Synthetic solutions containing 5.4 mg/L was used.
6.1.2 Selenate Removal using Nanosized NiFe Particles Table 21 A and B contains the data of selenium uptake vs. the initial selenate concentration of (5-1000 mg/L) for loadings of 1, 2 and 5 g/L of NiFe powder. The data show that for a given initial Se (VI) concentration, the percent removal increases with the loading of the powder. The amount of selenate removed (per unit mass of powder) increases with the amount of initial impurity (Se (VI)) in the solution. Very high removal capacities (50 mg/g) are observed for a solution containing initial Se (VI) concentration of 50 mg/L. This is a 25% improvement over the removal capacity of iron powder (40 mg/g) under similar conditions. It is interesting to note that complete removal of the contaminant was observed when the initial Se content used was 1 mg/L even at a very small loading of the NiFe powder (1 g/L).
41

Table 21 Selenate removal studies using NiFe particles (five hours). Synthetic solutions
were used. A Uptake (mg/g)
Initial Concentration (mg/L) 1 g/L 2 g/L 5 g/L 1.06 1.04
5 4.73 2.49 1.00 10 9.64 4.88 2.00 53 50.10 25.73 10.60 103 83.40 49.25 20.60 123 97.60 55.80 24.60 565 96.40 36.80 1130 102.90
B Final Concentration (mg/L)
Initial Concentration (mg/L) 1 g/L 2 g/L 5 g/L 1.06 ND
5 0.270 ND ND 10 0.360 0.238 ND 53 2.900 1.550 ND 103 19.600 4.500 ND 123 25.4 11.400 ND 565 372.200 381 1130 924.2
Figure 25 is a plot of the selenium uptake vs. the NiFe loading using synthetic solutions of initial Se (VI) concentrations of approximately 50 mg/L and 123 mg/L. The experiments were conducted for five hours. It is seen that at a loading of 0.1 g/L, the uptake by Fe powder (Figure 22) was 155 mg/g while that by NiFe powder was 225 mg/g. By increasing the initial Se (VI) concentration to 123 mg/L, the uptake by NiFe increased to 303 mg/g. This indicates that the uptake is proportional to selenate concentration. In addition, it is also seen that the uptake drops sharply with increasing loading. On increasing the loading more than 1 g/L (uptake 45 – 55 mg/g), the uptake did not change significantly.
42

0
50
100
150
200
250
300
350
0 1 2 3 4 5 6Loading (g/L)
Upt
ake
(mg/
g)
0
10
20
30
40
50
60
70
80
90
100
Rem
oval
(%)uptake (53 ppm)
uptake (123 ppm)removal % (53 ppm)removal % (123 ppm)
Figure 25 Effect of NiFe loading on the selenate uptake. Experiments were conducted at
25oC for five hours. Synthetic solutions were used. Figure 26 shows the effect of solution pH on the uptake of Se (VI) by 1 g/L NiFe powders from a synthetic solution of 5.4 mg/L selenate. The experiments were conducted for five hours. It is observed that the minimum final concentration of selenate (0.297 mg/L) is obtained at a pH of 7.7. This corresponds to a 94.5% removal of selenate. Almost no removal is observed at a pH of 11, while 88% removal is obtained at a pH of 3.5 (final concentration = 0.63 mg/L)
0
0.5
1
1.5
2
2.5
3
3.5
4
4.5
5
0 2 4 6 8 10 12pH
Fina
l Con
cent
ratio
n (p
pm)
NiFe
() -- % removal
(11%)
(94%)(88%)
Figure 26 Effect of pH on the selenate uptake. Experiments were conducted at 25oC for five
hours at a loading of 1 g/L NiFe powder. Synthetic solutions containing 5.4 mg/L was used.
43
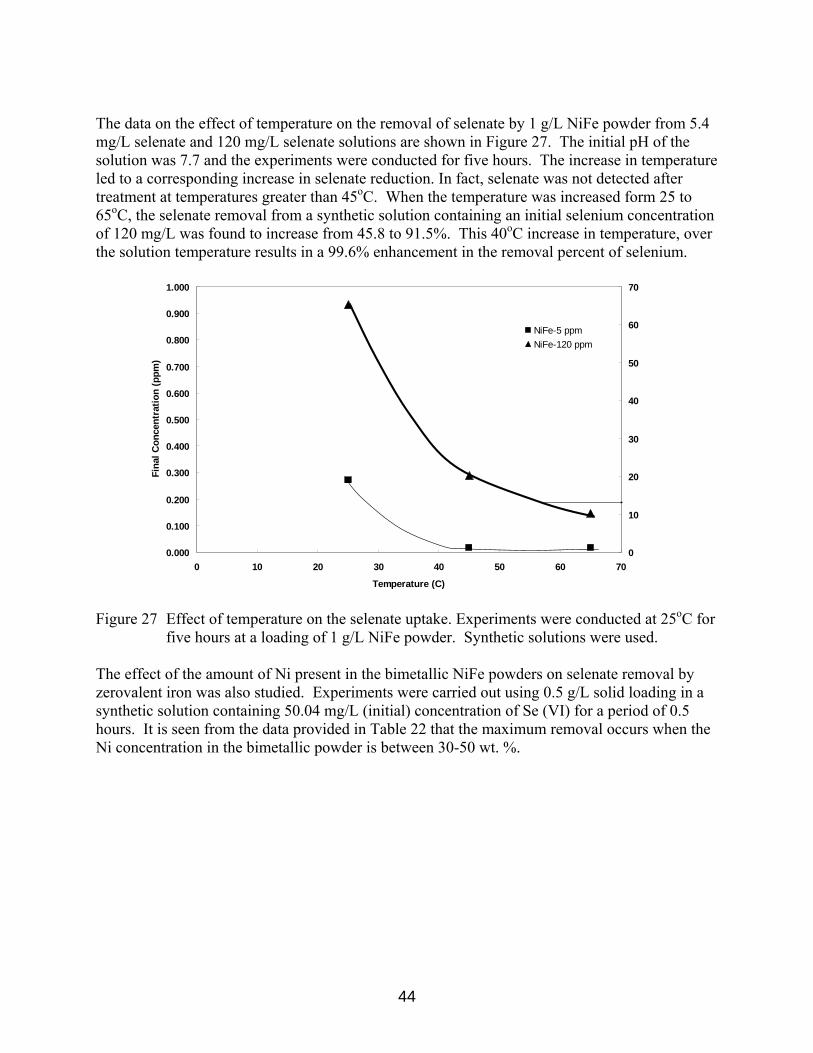
The data on the effect of temperature on the removal of selenate by 1 g/L NiFe powder from 5.4 mg/L selenate and 120 mg/L selenate solutions are shown in Figure 27. The initial pH of the solution was 7.7 and the experiments were conducted for five hours. The increase in temperature led to a corresponding increase in selenate reduction. In fact, selenate was not detected after treatment at temperatures greater than 45oC. When the temperature was increased form 25 to 65oC, the selenate removal from a synthetic solution containing an initial selenium concentration of 120 mg/L was found to increase from 45.8 to 91.5%. This 40oC increase in temperature, over the solution temperature results in a 99.6% enhancement in the removal percent of selenium.
0.000
0.100
0.200
0.300
0.400
0.500
0.600
0.700
0.800
0.900
1.000
0 10 20 30 40 50 60 70
Temperature (C)
Fina
l Con
cent
ratio
n (p
pm)
0
10
20
30
40
50
60
70
NiFe-5 ppmNiFe-120 ppm
Figure 27 Effect of temperature on the selenate uptake. Experiments were conducted at 25oC for
five hours at a loading of 1 g/L NiFe powder. Synthetic solutions were used. The effect of the amount of Ni present in the bimetallic NiFe powders on selenate removal by zerovalent iron was also studied. Experiments were carried out using 0.5 g/L solid loading in a synthetic solution containing 50.04 mg/L (initial) concentration of Se (VI) for a period of 0.5 hours. It is seen from the data provided in Table 22 that the maximum removal occurs when the Ni concentration in the bimetallic powder is between 30-50 wt. %.
44

Table 22 Final selenate concentrations after five-hour treatment with NiFe powders with
different Ni concentrations from a 50 mg/L selenate solution at 25oC and a pH of 7.7. (0.5 g/L NiFe)
% Ni by wt. Final Concentration (mg/L)
0 23.43 10 18.5 30 6.49 50 6.68 70 17.15 90 18.50 100 20.40
In order to determine the mechanism of reduction in selenium concentration, experimental data were fitted to various kinetic models so as to estimate the rate constants and provide an insight on to the mechanisms underlying selenium removal. Figure 28 contains the kinetic data on selenate removals from 100 mg/L (initial concentration) selenate solution using two different loadings (5 g/L and 0.67 g/L) over a period of two hours. Selenium removal kinetics using iron powders (5 g/L) are also included. In all cases, the selenium concentration is observed to drop rapidly with time for the first two minutes of operation; the decrease is rather rapid when NiFe (5g/L) powder is employed. The rate of selenate removal by iron powders, however, slowed down and reaches a value of nearly 8 mg/L at the end of 30 minutes. No significant reduction in the selenium is obtained at longer residence times. It has been reported in the past that the reduced form of selenium on iron is often re-oxidized if the reductant remains in the synthetic solution over long periods of time. The experiment with 5 g/L of NiFe was conducted for 24 hours. The data are presented in Figure 28 and shows no increase in the Se concentration at longer residence times. A first order reaction model (with respect to selenate concentration) was used to fit the data obtained in these studies. The experimental and model predicted data are presented in Figure 29. As seen from the data in Table 23, the rate constant of selenium reduction per unit mass of reductant is enhanced by three-four times when NiFe bimetallic powder is used as compared to the Fe powder.
45

0.00
20.00
40.00
60.00
80.00
100.00
120.00
140.00
0 1000 2000 3000 4000 5000 6000 7000 8000
Time (sec)
Con
cent
ratio
n (p
pm)
NiFe 5 g/LLab Fe 5 g/LNiFe 0.67 g/L
Figure 28 Kinetics of removal of selenate from a synthetic solution containing 100 mg/L Se (VI)
with Fe powder and NiFe powder at 25oC.
0
20
40
60
80
100
120
0 500 1000 1500 2000
Time (sec)
Con
cent
ratio
n (p
pm)
ExperimentalCalculated
5000 10000 15000 20000
Figure 29 Experimental vs Model predicted kinetic data on selenate removal by 5 g/L NiFe
powder from a synthetic solution containing 106 mg/L selenate.
46

Table 23 Rate Constants for Selenate Reduction on Fe and NiFe Surfaces
Agent Loading (g/L)
K (sec-1gm-1)
Fe 5 0.59 X 10⁻³
NiFe 0.67 2.12 X 10 -3
NiFe 5 1.68 X 10⁻³
In addition to the above tests on selenate reduction using NiFe, the influence of initial selenate concentration, temperature and dissolved oxygen on the kinetics of selenate removal was investigated. To investigate the effect of initial concentration and loading of NiFe, two similar experiments, one with low initial selenate concentration (1 mg/L) and one with high selenate concentration (500 mg/L) were performed at various loadings. Figure 30 is a plot of the selenate concentration versus time. The data show that concentration decreases sharply with time (about two minutes) and then reaches an asymptotic value after about 10 minutes depending upon the amount of loading. A very significant decrease in the selenate concentration was observed in two minutes using 5g/L of NiFe nanoparticles. A plot of log of concentration verses time results in a straight line, thus indicating the mechanism of selenium removal can be approximated by a first order rate equation.
0.00
0.20
0.40
0.60
0.80
1.00
0.0 2.0 4.0 6.0 8.0 10.0
Time in min
Fina
l Se
(VI)
Con
cent
ratio
n (m
g/L)
5 g/L2 g/L1g/l0.5 g/L0.25 g/L
-3
-2.5
-2
-1.5
-1
-0.5
00.0 2.0 4.0 6.0
Time in min
ln C
/C0
5 g/L2 g/L1g/L0.5g/L0.25 g/L
(a) (b) Figure 30 Kinetic data of Selenate, Se (VI) removal (Initial Se (V) concentration (low) = 1
mg/L) using NiFe particles under different loading conditions. (a) Data on Final Se (VI) Concentration in solution vs. time for different solids
loading (Legend in the figure indicate solids loading of NiFe). (b) Plot of pseudo-first order kinetics rate equation fitted to the kinetic data.
47
For studies at high concentrations, the data show that selenium concentration is reduced from an initial value of 500 to about 250 mg/L in 30 minutes using 5 g/L of NiFe (Figure 31). This is a very significant amount of selenium removal on the absolute basis. A plot (Figure 31) of selenate concentration versus time results in a straight line suggesting that the removal kinetics can be described by a zero-order rate equation.
300.00
400.00
500.00
0.0 10.0 20.0 30.0 40.0Time in min
Fina
l Se
(VI)
Con
cent
ratio
n (m
g/L)
5 g/L2 g/L1 g/L0.5 g/L
-160.00
-120.00
-80.00
-40.00
0.000.0 5.0 10.0
Time in min
C-C
0 (m
g/L)
5 g/L 2 g/L
1 g/L 0.5 g/L
(a) (b) Figure 31 Kinetic data of Selenate, Se (VI) removal (Initial Se (V) concentration (high) =
500 mg/L) using NiFe particles under different loading conditions. (a) Data on Final Se (VI) Concentration in solution vs. time for different solids
loading (Legend in the figure indicate solids loading of NiFe). (b) Plot of zero order kinetics rate equation fitted to the kinetic data.
Experiments employing selenate concentrations ranging from 10 to 250 mg/L using nanoparticles of NiFe were conducted. The data (Figure 32) show that solutions containing low concentrations can be readily (less than 60 minutes) purified. The rate constants were calculated assuming that the rate of reaction can be described by a zero order rate mechanism.
48

0.00
0.20
0.40
0.60
0.80
1.00
0 20 40 60 80
Time in min
C/C
0
10ppm25 ppm50 ppm250 ppm
0.00
0.20
0.40
0.60
0.80
1.00
0 2 4 6
Time in min
C/C
0
10ppm25 ppm50 ppm250 ppm
Figure 32 Effect of Initial concentration on selenate reduction. NiFe loading = 5 g/L.
Experiment conducted for one hour. Initial rate plotted for a zero order reaction. In order to better quantify the influence of temperature on selenate removal, relatively high concentrations (250 mg/L) of selenium containing solutions were treated with 5 g/ L of NiFe at 25, 48 and 65°C. The data (Figure 33) show that increasing the temperature results in significant enhancement of selenium removal rates. The decrease in selenium concentration with time is nearly linear for short contact time.
0.00
0.20
0.40
0.60
0.80
1.00
0 5 10 00 150 200
Time in min
C/C
0
25 deg C
48 deg C
65 deg C
0.00
0.20
0.40
0.60
0.80
1.00
0 0.5 1 1.5 2 2.5
Time in min
C/C
0
25 deg C48 deg C65 deg C
(a) (b) Figure 33 Effect of temperature on selenate reduction.
(a) Kinetic data on selenate reduction using NiFe particles at different temperatures. (Initial Se (VI) concentration = 250 mg/L. Solids loading = 5 g/L NiFe).
(b) Plot of zero order kinetic rate equations fitted to data.
49

Selenate concentration as a function of the dissolved oxygen concentration (anaerobic and aerobic conditions) for different initial concentrations of selenate was studied (Figure 34 a-b). The data shows that selenium removal is greater under aerobic conditions. The data show that enhanced amounts of dissolved oxygen promotes selenate removal. It is hypothesized that the use of bimetallic NiFe particles involves reduction of selenate (to selenite) on nickel sites followed by adsorption of selenite on iron hydroxide. Since, the rate of iron hydroxide is enhanced in the presence of dissolved oxygen, higher selenium removal is to be expected under aerobic conditions. (a) (b) Figure 34 Effect of dissolved oxygen (DO) on selenate reduction. Solids loading = 5 g/L
NiFe. (Legend in the figure indicates initial Se (VI) concentration). (a) Anerobic (DO = 0.5 mg/L) (b) Aerobic (DO = 6.5 mg/L). 6.1.3 Comparison of Selenate Removal Reduction of selenium by the use of Fe powder and bimetallic NiFe powder was compared with common adsorbents – namely γ alumina, α alumina, activated carbon (Darco S51), iron impregnated activated carbon (Darco HDB), as-produced fullerenes (ApF), Toluene-extracted and heat-treated fullerenes (TEHTF), chitin, chitosan, and cellulose. These adsorbents have been used previously for selenium removal. The data from the experiments conducted for removal of selenium from a 5.4 mg/L synthetic solution at 25oC and a loading of 1 g/L are provided in Figure 35. Experiments employing adsorbents were conducted for 72 hours while that involving the use of the metallic Fe and bimetallic NiFe were run for a much shorter duration of five hours. The most promising are γ alumina and Darco S51. The following is the decreasing order of the effectiveness of the standard adsorbents: Darco S51 (ca. 61.01% removal) > γ alumina (ca 55.41% removal) > chitin (ca. 29.90% removal) > chitosan (ca. 27.30% removal) >ApF (ca. 25.50% removal) > TETHF (ca. 22.30% removal) > Darco HDB (ca. 18.14% removal) > Cellulose (ca. 15.77% removal).
0.000
200
400
600
800
000
0 20 40 6Tim e in m in
C/C
0
0 80
0.00
0.20
0.40
0.60
0.80
1.00
0 10 20 30 4
Time in min
C/C
0
25 mg/L 10 mg/L
50 mg/L 250 mg/L
0
10 m g/L
25 m g/L
50 m g/L250 m g/L
1.
0.
0.
0.
0.
50

In comparison, Fe powder significantly lowered the selenate concentration from 5.44 mg/L to 0.49 mg/L (~ 90% removal). The selenium removal capacity of NiFe bimetallic powder was observed to be nearly 100% with the final selenium concentration of 0.015 mg/L.
2.130
4.050
3.500 3.570
0.496
4.39
4.91 4.82
4.26
4.534.79 4.71
4.84
0.33
4.2
0.782
3.420
2.87
3.313.41
0.015
3.860
1.30
4.59
0.06
4.23
3.88
4.47
3.933.953.98
3.05
4
0
1
2
3
4
5
6
γ-Alumina α-Alumina Chitosan Chitin Darco S51 DarcoHDB
ApF TEHTF Cellulose Lab Fe NiFe
Removal Agent
Fina
l Con
cent
atio
n (p
pm)
Selenate onlyChloride 10g/LNitrate 2.5g/L
Figure 35 Comparison of final selenate concentrations in synthetic solutions with/without
competing anions after removal using standard adsorbents and lab produced Fe powder and NiFe bimetallic powder. Experiments were conducted at 25oC for 300 minutes at a loading of 1 g/L. Initial concentration of selenate was 5 mg/L.
6.2 Effect of Anionic Cosolutes Figure 35 also shows the effect of addition of 10 g/L chloride and 2.5 g/L nitrate anions on the selenium removal effectiveness of various adsorbents and Fe and NiFe produced in the laboratory. The solution was ca. 5.04 mg/L. It is seen in the figure that the presence of 10 g/L chloride resulted in a much lower selenate removal as compared to the solution that contained no anions when the adsorbents were used. The reduction of selenium removal due to the presence of chloride was more pronounced in the case of adsorbents that showed reasonable removal of selenate – namely γ alumina and activated carbon (Darco S51). The selenium removal by γ alumina in the absence of anions was found to be 52.0%, which reduced to 12.9% due to the addition of chloride ions. A similar decrease in the selenate removal by activated carbon (Darco S51) was observed (57.9% vs. 15.5%). The presence of chloride ions adversely affected the removal capacity of NiFe and Fe particles since the data show that as compared to 99 and 91.1% removals, the presence of chlorides resulted in 74% and 70% Se (VI) removals, respectively. However, the capacity of Fe and NiFe powders to remove selenate was less adversely affected as
51

compared to the adsorbents used in this study. For example, as compared to a 75.19% decrease in the selenate removal capacity of Darco S51 activated carbon due to the presence of chlorides, the decrease in the selenate removal capacity of NiFe was calculated to be only 25.25%. The primary mechanism by which chloride ions could inhibit the reduction of selenate by the metallic and bimetallic particles is via pitting type reactions. As a result, the electrons produced by iron oxidation are not available for the selenate reduction. When the impurity used was a nitrate anion (2.5 g/L), the selenate removal by the adsorbents and the reductants was also adversely affected. However, the decrease in selenium removal due to the presence of nitrate anions was less significant than what was observed for solutions to which chloride was added. The influence of the presence of sulfate on selenate removal was also investigated. It was observed that the presence of 2.5 g/L sulfate impurities greatly reduced the selenate removal by NiFe powder from nearly 100% to 71.5% (final Se concentration = 1.44 mg/L). As compared to the oxyanions of selenium, the chlorides, nitrates and sulfates are simpler anions, they compete effectively for adsorption at the active sites and subsequently they could undergo further reduction by the zerovalent metal. The competition for reactive sites by anions reduces the effectiveness of the bimetallic NiFe particles to immobilize selenate. 6.3 Selenium Removal From As–received Agricultural Drainage Water A preliminary set of experiments was conducted on the as–received agricultural samples using γ alumina, activated carbon and bimetallic NiFe. The data in Table 24 shows that no significant removal was observed using commercial adsorbents. The measured values are within the margin of experimental and measurement errors thus leading us to conclude that no significant removal can be expected by these adsorbents. Bimetallic NiFe showed marginal selenium removal of 20% for a loading of 4 g/L. Similar experiments using synthetic solutions containing an initial concentration of 0.998 mg/L of Se (VI) without the presence of any competing anions was treated with the solids. Near complete removal was observed with the use of NiFe and γ alumina (Table 25). The steep reduction in selenium removal from agricultural water samples is attributed to the presence of relatively high concentration of sulfate. The mechanism of sulfate and selenate adsorption is the formation of outer–sphere complexes with the surface. Preferential adsorption of sulfate by replacing the weak selenate complex results in decreased removal.
52

Table 24 Adsorption of selenium (as received agricultural drainage water) using γ alumina, activated carbon and NiFe.
Adsorbent Loading g/L
Final Se Concentration mg/L
γ alumina 2 0.91 γ alumina 3 0.90 γ alumina 4 0.94 Activated carbon 4 0.95 NiFe 2 0.88 NiFe 3 0.75 NiFe 4 0.72
Table 25 Selenium removal from synthetic solutions containing 0.998 mg/L selenate.
Adsorbent Loading g/L
Final Se Concentration mg/L
Activated Carbon 4 0.461 NiFe 4 ND γ alumina 4 0.055
Further studies on selenium removal from the as-received agricultural water samples received from California were performed by increasing the loading of NiFe. The amount of selenate removal versus particle loading is shown in Figure 36. The data show that selenium removal increases with loading and nearly 100% selenate removal is achievable at particle loadings between 10-20 g/l of NiFe nanoparticles.
53

0.00
20.00
40.00
60.00
80.00
100.00
0 5 10 15 20 25 30 35
Loading (g/L)
Se
(VI)
rem
oval
%
Figure 36 Selenium removals from as – received agricultural waters using different loadings of NiFe.
6.4 Summary of Results As can be seen from the results obtained in the phase II of the investigation, NiFe was capable of removing selenium to less than 0.01 mg/L in both synthetic contaminated solutions and also in as-received agricultural drainage water. However, the presence of other anionic impurities retards the reduction process. Nevertheless, high amounts of solids can be used to obtain near 100% removal.
54
7 Selenium Removal via Precipitation In the previous findings, the effectiveness of commercial adsorbents such as modified activated carbons, γ and α alumina has been demonstrated. Bimetallic NiFe also has shown promising results in selenate removal. However, it was found that the interference due to competing anions adversely affected selenium removal. In order to overcome this problem (present in agricultural samples), higher amount of solids loading must be used for effective selenate removal, as it provides a much greater number of active sites for reduction and adsorption. However, this method is highly cost expensive as it involves a larger volume of solids and larger treatment reactors. A conventional approach to reduce the effect of sulfate interaction is the in–situ precipitation of the sulfate from solution using barium chloride. If the precipitation is quantitative, such a process dissolves 1 meq of chloride (Cl-) into the solution for each meq of sulfate (SO4
-) removed. This approach is expected to be highly effective as overwhelming majority of sulfate in solution precipitates out. In addition, disposed barium sulfate is not considered a hazardous waste. The following narrative applies to research related to the substitution of sulfates in solution by precipitating with barium chloride. Subsequent selenate removal from agricultural and synthetic solutions containing selenate using NiFe was also determined. A thorough investigation of the material in terms of a) its selenium removal capacity from pure synthetic solution with or without anionic impurities and; b) its effectiveness in removing selenium from the agricultural drainage waters provided by the Department of Water Resources in the San Joaquin Valley is presented. 7.1 Preliminary Studies on Sulfate Precipitation Since selenate and sulfate have very similar chemical properties, it is difficult to separate selenate from sulfate. Selective ion removal can be accomplished by pretreating the agricultural drainage water, either by ion exchange or precipitation. Preliminary tests on the SO4
2- precipitation were performed by adding varying amounts of barium chloride to synthetic solutions containing an initial selenate concentration of 0.91 ca. mg L-1. Since it is known that sulfate can be precipitated out by adding stoichiometric amounts of barium chloride to the solution, experiments were conducted by selecting the barium to sulfate molar ratio at 0.46 and varying the amounts of sulfate impurity (2, 3 and 4 g L-1) in the selenate solution. Precipitation of sulfate was visually observed. Interestingly, analysis of the treated sample showed a reduction in the selenate concentration (albeit low) when treated with BaCl2 alone. It was observed that as the amount of sulfate present in the solution was increased (the barium chloride added to the solution also increased) from 2 g L-1 to 4 g L-1, a 287% increase in selenate removal (from 0.77 – 2.98%) was observed. The enhancement in selenate removal with barium chloride addition indicates that selenate is immobilized onto the barium sulfate during the precipitation process. This was confirmed by dissolving the precipitated solids in hydrochloric acid and measuring the selenate concentration in the resulting solution and conducting a mass balance. In order to identify whether the barium sulfate adsorbed the selenate onto its surface, eight adsorption experiments were conducted (five with varying barium sulfate loadings from 1 – 20 g L-1, using 4 g L-1 sulfate and 2.5 g L-1 chloride impurities, one with 4 g L-1 sulfate impurity alone, one with 2.5 g L-1 chloride impurity alone, and one with no impurities in synthetic 1 mg L-1 selenate containing solutions). However, results from these studies showed that selenate did not adsorb onto barium sulfate. Thus it was concluded that selenate was immobilized onto the barium
55

sulfate during the precipitation process. Further experiments were conducted for different barium to sulfate ratios to identify the conditions under which maximum contaminant removal of selenate and sulfate can be achieved. 7.2 Selenate Removal Using Barium Chloride The data in terms of the final selenate concentrations in the treated (BaCl2 only) agricultural drainage waters vs. the molar ratio of Ba2+: SO4
2- are presented in Figure 37. When BaCl2 was added to a 1 mg L-1 selenate solution, complete sulfate removal was concluded based on the mass precipitated. The data in Figure 1 also show that with increasing Ba2+ to SO4
2-molar ratio, the final selenate concentration in the treated samples decreased. Increasing the Ba2+ to SO4
2- ratio from 1.38 to 1.73 greatly improved the selenate removal from 22% to nearly 100%. The final selenate concentrations was reduced to seven parts per billion (ppb) at the end of 24 hours when a solids loading of 15 g L-1 was used. The high selenate removal indicates that the excess of Ba2+ ions participated in the precipitation of selenate anions, SeO4
2-, probably forming barium selenate. Additional experiments using synthetic solutions containing 10 mg/L Se (VI) also gave similar results (insert in Figure 38). The sulfate concentration was varied from 1 to 4 g L-1. As seen in the insert in Figure 38, the final selenate concentration in the treated solution was approximately 10 parts per billion (ppb). One of the important findings is that addition of BaCl2 not only sequesters substantial amount of sulfate ions in the solution but it also contributes to selenium removal, both processes occurring as a result of the precipitation reaction.
0
0.2
0.4
0.6
0.8
1
0.46 1.38 1.73 2.31 3.46 6.92
Molar ratio of Ba2+:SO42-
Fina
l Se
(VI)
conc
entr
atio
n (m
g L
-1)
0
0.005
0.01
0.015
0.02
0.025
6.923.462.311.73
Molar ratio Ba2+: SO42-
Fina
l Se
(VI)
Con
cent
ratio
n (m
g/L)
Figure 37 Selenate removal using barium chloride under varying sulfate concentrations.
56

Figure 38 shows the data on the final Se (VI) concentration and percent Se (VI) removed vs. barium chloride loading for experiments conducted with the as-received agricultural water samples by BaCl2 addition alone. It is seen that, the selenate removal increases with barium chloride loading, with near complete removal at loadings greater than 15 g L-1. This value of BaCl2 loading corresponds to a Ba2+: SO4
2- ratio of 1.73. However, due to the excess of sludge formation, a two-step removal process was also studied.
0
0.2
0.4
0.6
0.8
1
0 5 10 15 20 25 30 35
BaCl2 Loading (g L-1)
Fina
l Se
(VI)
Con
c. (m
g L-1
)
0
20
40
60
80
100
% S
e (V
I) re
mov
al
Figure 38 Selenate removals from agricultural waters using barium chloride. 7.3 Two-Step Immobilization In the first step, the agricultural water sample was treated with BaCl2 and in the subsequent step, the filtrate was treated with three removal agents, namely, activated carbon, γ alumina and NiFe nanoparticles. The effectiveness of a two-stage process was investigated on synthetic solutions containing an initial Se (VI) concentration of 1.04 mg L-1. 10 g L-1 of BaCl2 (corresponding to Ba2+: SO4
2- ratio of 1.15) was employed to ensure complete removal of sulfate anions. It can be seen from Figure 38 that the selenate concentration is expected to reduce to 0.47 mg L-1 at a loading of 10 g L-1. In the second treatment stage, 10 g L-1 of removal agent was used. Previous studies have shown negligible selenate removal by activated carbon and γ alumina in the presence of sulfate even at very high loadings (~20 g L-1). The data in Table 26 shows that the selenate removal increased upon precipitating sulfate from the original synthetic solutions. Up to 23.4% of selenate was removed from the filtrate (obtained after the precipitation reaction) by activated carbon, thereby reducing the final concentration by nearly 56%. γ alumina provided an additional 47% selenium removal from the filtrate, thereby resulting in an overall 72% decrease in the selenate concentration. It can also be seen that the NiFe nanoparticles are best suited for the 2-stage process, resulting in almost complete reduction of selenate from the solution, as the
57
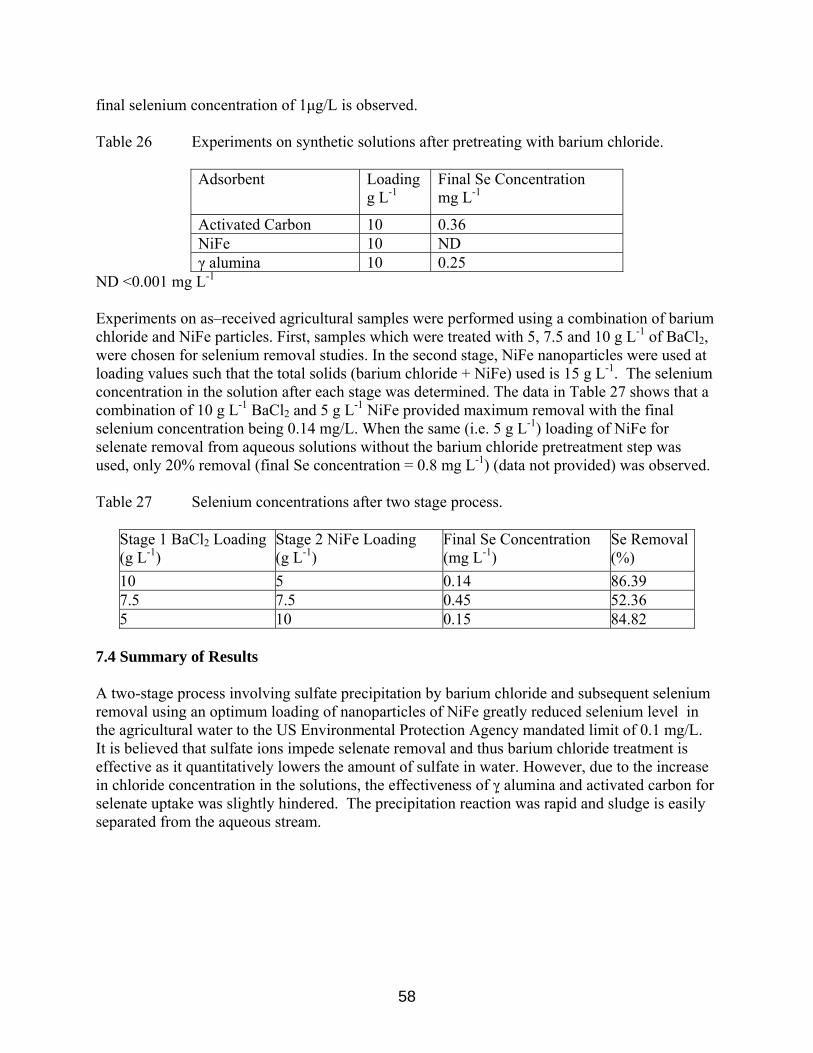
final selenium concentration of 1µg/L is observed. Table 26 Experiments on synthetic solutions after pretreating with barium chloride.
Adsorbent Loading g L-1
Final Se Concentration mg L-1
Activated Carbon 10 0.36 NiFe 10 ND γ alumina 10 0.25
ND <0.001 mg L-1
Experiments on as–received agricultural samples were performed using a combination of barium chloride and NiFe particles. First, samples which were treated with 5, 7.5 and 10 g L-1 of BaCl2, were chosen for selenium removal studies. In the second stage, NiFe nanoparticles were used at loading values such that the total solids (barium chloride + NiFe) used is 15 g L-1. The selenium concentration in the solution after each stage was determined. The data in Table 27 shows that a combination of 10 g L-1 BaCl2 and 5 g L-1 NiFe provided maximum removal with the final selenium concentration being 0.14 mg/L. When the same (i.e. 5 g L-1) loading of NiFe for selenate removal from aqueous solutions without the barium chloride pretreatment step was used, only 20% removal (final Se concentration = 0.8 mg L-1) (data not provided) was observed. Table 27 Selenium concentrations after two stage process.
Stage 1 BaCl2 Loading (g L-1)
Stage 2 NiFe Loading (g L-1)
Final Se Concentration (mg L-1)
Se Removal(%)
10 5 0.14 86.39 7.5 7.5 0.45 52.36 5 10 0.15 84.82
7.4 Summary of Results A two-stage process involving sulfate precipitation by barium chloride and subsequent selenium removal using an optimum loading of nanoparticles of NiFe greatly reduced selenium level in the agricultural water to the US Environmental Protection Agency mandated limit of 0.1 mg/L. It is believed that sulfate ions impede selenate removal and thus barium chloride treatment is effective as it quantitatively lowers the amount of sulfate in water. However, due to the increase in chloride concentration in the solutions, the effectiveness of γ alumina and activated carbon for selenate uptake was slightly hindered. The precipitation reaction was rapid and sludge is easily separated from the aqueous stream.
58

8 EVALUATION OF TEST RESULTS The objective of this research was to evaluate various technologies for the complete removal of selenium from contaminated solutions. The effectiveness of a particular technique was tested on the as-received agricultural drainage water samples and the findings were used to confirm the various mechanisms of removal. In general, selenium reduction using metallic particles was found to be a most effective remediation technique. 8.1 Mechanism of Selenium Adsorption The mechanism of anion adsorption is largely dependent on the charges present on the surface of the adsorbents. In the case of activated carbon, the surface charges are positive at pH less than pHpzc (pHpzc = 3.9). This results in attraction of selenite oxyanions to the surface of the activated carbon. The surface attachment by the oxyanion is probably a result of either a weak outer sphere complex or physical adsorption via charge neutralization. As the pH is increased, on more negative charges accumulate at the adsorbent surface (due to OH- adsorption) as shown by data in Figure 20, resulting in repulsion of negatively charged anions. As a result, negligible adsorption is observed at very high solution pH (pH > 9). This can be confirmed by the data in Table 7 and Figure 4. Similar data were obtained with the use of fly ash derived char carbons. Selenite adsorption on alumina occurs via an inner sphere surface co-ordination process. Inner-sphere complexes are formed as a result of an exchange of an aqueous ligand with a surface hydroxyl group. The surface chemistry of an oxide such as α and γ alumina in contact with an aqueous solution is determined to a large extent by the deprotonation and hydroxyl association reaction as given below.
OHSeOSSeOHOHS 2323 +−=++− −−+
OHHSeOSSeOHOHS 23
232 +−=++− −−+
Where S-OH is the surface hydroxyl group and S-SeO3
- and S-HSeO3- are the adsorbed selenite
species. However, the following reaction occurs due to an increase in the hydroxyl ion concentration.
OHOSOHOHS 2+−=+− −−
It can be seen that increasing pH results in more negative charges on the surface, which causes a decrease in adsorption due to increase in electrostatic repulsion. The observed adsorption data in Figures 2 and 3 and in Tables 5 and 6 were found to be in accordance with the mechanism. The higher uptake value for α alumina as compared to γ alumina was due to a smaller surface area of the adsorbent. The surface chemistry of carbons is determined to a large extent by the number and the nature of the surface functional group complexes. The carbon – oxygen surface compounds are by far the most important in influencing surface behavior, hydrophilicity and electrical properties of carbons. The surface charge and zeta potential of the carbon particles in aqueous suspensions is also conditioned by the nature of the surface functional groups in a given environment. Activated carbon surfaces are usually carry negative charges except in solutions with very low pH. To enhance anion adsorption, the pH of the slurry needs to be reduced. Alternatively, if the surface is modified such that the pH at which the IEP (isoelectric point) is observed is shifted to higher pH values, pH of the slurry would then be less than the IEP and thus would enhance the
59

adsorption of anions. It was hypothesized that high valence cations could be used to modify the surface characteristics of the carbon. The surface carries more positive in neutral pH conditions due to the presence of the high valence cations on the surface. Thus it can be summarized from the zeta potential data that:
a) Modification of carbons with metal salts should improve adsorption capacities; b) Most commercially available adsorbents possess positive surface charges only in the
acidic region, making them ineffective for selenium removal beyond a pH of 4-5; c) Adsorption of selenium ions on the surface due to electrostatic attraction is the primary
mechanism for its removal. The free amino group in chitin is largely responsible for the adsorption at low pH of the solution as illustrated in the reaction below
323 COCHNHRHNHCOCHR −−=+− ++
The amino group is protophillic and becomes NH3
+ in acid media. Chitin with positive charges can adsorb anions by charge neutralization. The action between chitin and selenite is physical adsorption and not complexing reaction. At very low pH (pH < 3), the protonated amine group on chitin is water-soluble and hence surface does not contain positive charges to effectively remove the selenium oxy-anion, resulting in very low selenite removal (Table 11). Increasing pH of the solution decreases the solubility of the protonated amine. However, at very high pH (pH < 7.5), the surfaces possess net negative charges (OH- group on chitin chain becomes –O-) resulting in a decrease in selenite adsorption. Langmuir adsorption isotherm was used to analyze the adsorption data for γ alumina , α alumina and Darco S 51. The equation used is given by:
babCQ ee
111+=
where, Qe is the uptake in mg/g, Ce is the equilibrium concentration, a is the adsorption potential in L/mg, and b is the adsorption capacity in mg/g. Table 28 contains the data on adsorption potentials and adsorption capacities of the studies presented in the previous paragraphs. It is observed from the data that the adsorption potential, a, and adsorption capacities, b, of the adsorbents for the uptake of selenite are the highest for γ alumina and minimum for Darco S51 for experiments conducted under similar pH. The data that the adsorption capacity and adsorption potential decrease with pH for both alumina samples. The change in the adsorption capacities with pH is more significant in the case of α alumina. Similar conclusion regarding adsorption capacities could not be made for Darco S51.
60

Table 28 Adsorption potentials and adsorption capacities based on langmuir isotherm.
Adsorbent pH Adsorption potential a (L/mg)
Adsorption Capacity b (mg/g)
γ alumina 7.5 0.405 12.82 γ alumina 8.6 0.283 8.57 γ alumina 9.3 0.158 3.81 α alumina 2.8 4.079 2.54 α alumina 4.0 0.899 2.28 α alumina 7.0 0.133 1.84 alumina 7.5 0.066 1.77 Darco S51 4.75 0.030 5.04 Darco S51 7.0 0.024 5.82
Table 29 Adsorption potentials and adsorption capacities of fly ash derived char carbon and
modified carbons based on langmuir isotherm. a) Temperature = 25°C.
Adsorbent AdsorptionPotential a (l g-1)
Adsorption Capacity b (mg/g)
R2
CMAC 1.25 1.16 0.97 CMSIU 0.17 10.22 0.99 CMLOE - - - LOEF 0.98 0.24 0.98 SIUF 21.34 2.06 0.99
b) Temperature = 45°C.
Adsorbent AdsorptionPotential a (l g-1)
Adsorption Capacity b (mg/g)
R2
CMAC - - - CMSIU 1.58 0.66 0.99 CMLOE 0.29 1.12 0.91 LOEF -3.60 0.43 0.92 SIUF 0.0046 27.25 0.99
61

In general, selenium uptake was found to increase with the initial selenite concentrations. As the adsorption capacity (or the concentration of the sorption sites) of the carbons was limited, the total amount of selenite ions was limited. As a result, the selenite removal percentage was lower for high initial concentration of Se (IV). In addition, higher surface coverage increases the activation energy of adsorption, thereby making it more difficult for the species to bond with the surface. The data (Table 29 (a)) showed that modifying SIUF carbons with copper cations greatly increased the adsorption capacity from 2.06 to 10.22 mg/g. It is also noted that there is a significant decrease in the adsorption potential, which would indicate a spontaneous adsorption process. This explained the significant increase in selenite uptake as seen earlier, in the case of CMSIU. However, high selenite uptake in spite of the decrease in the adsorption capacities of CMAC (4.16 to 1.16 mg/g), and the increase in adsorption potential (0.03 to 1.25 l/g) supported the hypothesis that complex formation between cupric and selenite ions has a significant influence in the removal of selenite from aqueous solutions. The decrease in adsorption capacity with temperature suggests that the relative increase in desorption rate is faster than the adsorption rate imply weak physical interaction between the selenium oxyanion and the adsorbent surface. It can thus be concluded that the driving forces for the adsorption of selenite on the modified and as–produced carbons are, (i) the electrostatic attraction between the selenite anions and the positively charged surface (an indication of the change in zeta potential), (ii) the formation of the complex between the copper ions and selenite species. Chemical adsorption due to the ash content in fly ash generated carbons could also enhance selenite removal. It was concluded that the poor adsorption characteristics of this widely used adsorbent could be attributed to the negative charge containing anion (selenite) of selenium. The data obtained from the adsorption studies conducted on both types of alumina and activated carbon also indicate that the adsorption of selenium oxyanions (selenite in these cases) is dependent on the surface charge of the adsorbent. Activated carbon surfaces are usually negatively charged except in solutions with very low pH. It is thus hypothesized that high valence cations could be used to change the zeta potential characteristics of the carbon. 8.2 Reduction of Selenium Bimetallic NiFe was best suited for the complete removal of both selenate and selenite from aqueous solutions. The advantages of this process are the use of low cost materials with high efficiencies even at low loadings. The presence of sulfates in the aqueous solutions decreased the selenium removal. However, sufficient removal is possible using these particles and can be used to achieve the 10 ppb USEPA mandated levels. Based on the kinetic data, it was determined that the selenate removal by the metallic powders occurs by chemical reduction of selenate to selenite followed by further reduction to selenium or selenide. The selenide thus formed escapes as hydrogen selenide or deposits on the metal as metal selenide. The metal is oxidized during to the reaction.
−+ +→ eMM 220
−− +→+ OHHeOH 2222 *2
OHSeOHSeO 223
*24 2 +→+ −−
−−+− ++→++ OHSeOMOHSeOM 22
32
224
0
62
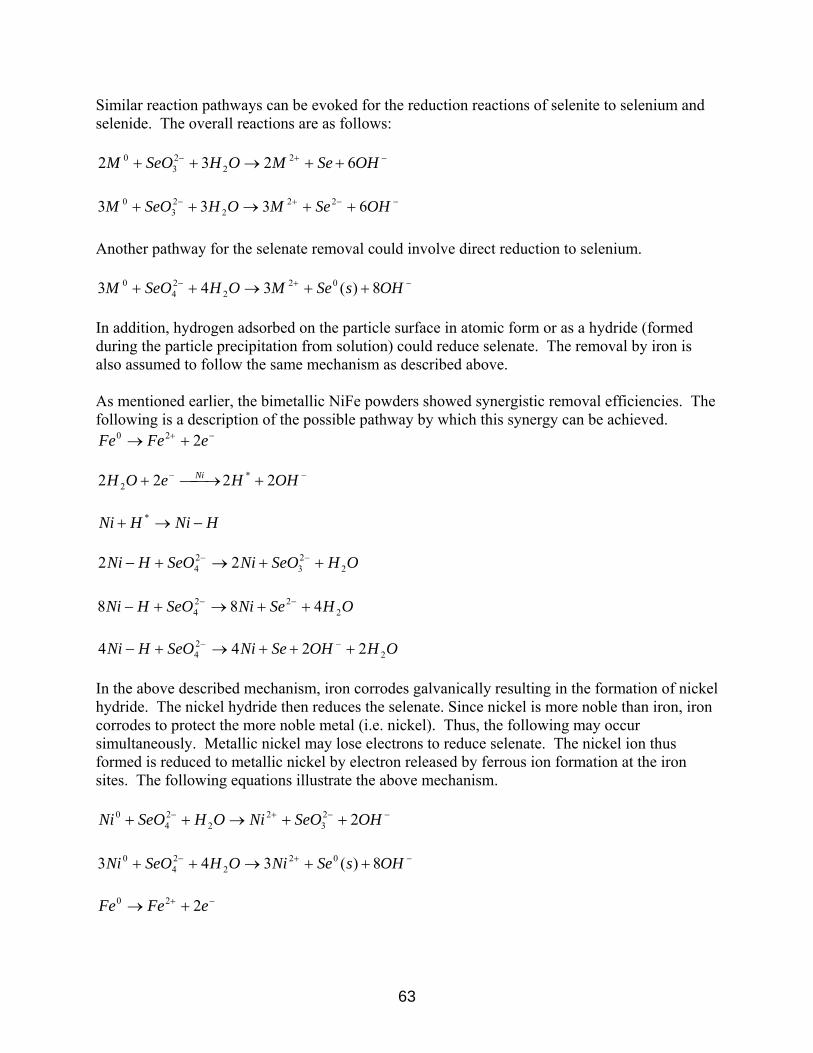
Similar reaction pathways can be evoked for the reduction reactions of selenite to selenium and selenide. The overall reactions are as follows:
−+− ++→++ OHSeMOHSeOM 6232 22
23
0
−−+− ++→++ OHSeMOHSeOM 6333 22
223
0
Another pathway for the selenate removal could involve direct reduction to selenium.
−+− ++→++ OHsSeMOHSeOM 8)(343 022
24
0
In addition, hydrogen adsorbed on the particle surface in atomic form or as a hydride (formed during the particle precipitation from solution) could reduce selenate. The removal by iron is also assumed to follow the same mechanism as described above. As mentioned earlier, the bimetallic NiFe powders showed synergistic removal efficiencies. The following is a description of the possible pathway by which this synergy can be achieved.
−+ +→ eFeFe 220
−− +⎯→⎯+ OHHeOH Ni 2222 *
2
HNiHNi −→+ *
OHSeONiSeOHNi 2
23
24 22 ++→+− −−
OHSeNiSeOHNi 222
4 488 ++→+− −−
OHOHSeNiSeOHNi 2
24 2244 +++→+− −−
In the above described mechanism, iron corrodes galvanically resulting in the formation of nickel hydride. The nickel hydride then reduces the selenate. Since nickel is more noble than iron, iron corrodes to protect the more noble metal (i.e. nickel). Thus, the following may occur simultaneously. Metallic nickel may lose electrons to reduce selenate. The nickel ion thus formed is reduced to metallic nickel by electron released by ferrous ion formation at the iron sites. The following equations illustrate the above mechanism.
−−+− ++→++ OHSeONiOHSeONi 223
22
24
0
−+− ++→++ OHsSeNiOHSeONi 8)(343 02
224
0
−+ +→ eFeFe 220
63

)(02 2 sNieNi →+ −+
In addition, iron may reduce selenate individually as described earlier. The ferrous ions formed will form iron hydroxide and iron oxyhydroxide at the particle surface resulting in further selenate removal via adsorption. The rate of removal of selenium using NiFe particles can be described by the following rate equation:
32
1
kCkCk
dtdC
+−
=
The above equation, which is a shifting order expression best describes the rate of selenate removal. At low concentrations, k2C can be neglected in comparison to k3, hence the above equation can be approximated by:
3
1
kCk
dtdC −
=
At high concentrations, k2C >> k3 and thus k3 can be assumed to be insignificant; therefore can e appr ated by: b oxim
2
1
kk
dtdC −
=
Figure 39 Variation in the pseudo-first order observed rate constant with surface
concentration (surface area * solid loading) of NiFe for selenate reduction. Initial Se (VI) concentration = 1 mg/L.
Kobs = 0.0053 *surface concentrationSurface Normalized rate constant = 0.0053
R2 = 0.900
0.2
0.4
0.6
0.8
1
1.2
1.4
1.6
0 50 100 150 200 250
Surface area concentration (sq.m/L)
Obs
erve
d ra
te c
onst
ant k
64
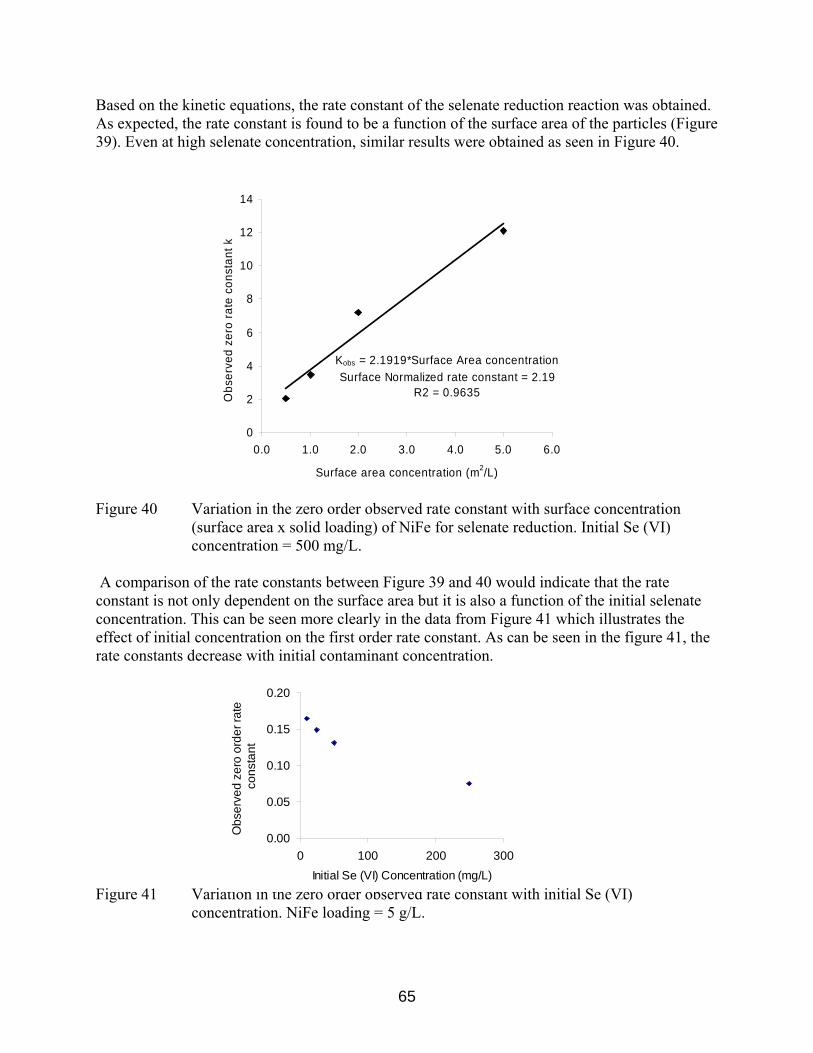
Based on the kinetic equations, the rate constant of the selenate reduction reaction was obtained. As expected, the rate constant is found to be a function of the surface area of the particles (Figure 39). Even at high selenate concentration, similar results were obtained as seen in Figure 40.
Kobs = 2.1919*Surface Area concentrationSurface Normalized rate constant = 2.19
R2 = 0.9635
0
2
4
6
8
10
12
14
0.0 1.0 2.0 3.0 4.0 5.0 6.0
Surface area concentration (m2/L)
Obs
erve
d ze
ro ra
te c
onst
ant k
Figure 40 Variation in the zero order observed rate constant with surface concentration
(surface area x solid loading) of NiFe for selenate reduction. Initial Se (VI) concentration = 500 mg/L.
A comparison of the rate constants between Figure 39 and 40 would indicate that the rate constant is not only dependent on the surface area but it is also a function of the initial selenate concentration. This can be seen more clearly in the data from Figure 41 which illustrates the effect of initial concentration on the first order rate constant. As can be seen in the figure 41, the rate constants decrease with initial contaminant concentration. Figure 41 Variation in the zero order observed rate constant with initial Se (VI)
concentration. NiFe loading = 5 g/L.
0.00
0.05
0.10
0.15
0.20
0 100 200 300Initial Se (VI) Concentration (mg/L)
Obs
erve
d ze
ro o
rder
rate
co
nsta
nt
65

The effect of oxygen concentration in the solution was also investigated on the selenate reduction. The oxygen presence in the environment is expected to increase the rate of iron corrosion and thereby enhance selenate reduction kinetics. It is hypothesized that the use of bimetallic NiFe particles involves reduction of selenate (to selenite) on nickel sites followed by absorption of selenite on iron hydroxide. Since, the rate of iron hydroxide is enhanced in the presence of dissolved oxygen, higher selenium removal is to be expected under aerobic conditions.
0.00
0.20
0.40
0.60
0 10 20 30 40 50 6
Initial Se (VI) Concentration (mg/L)
Obs
erve
d fir
st o
rder
rate
con
stan
tAerobic
Anaerobic
0
Figure 42 Variation of observed zero order rate constant with initial Se (VI) concentration. It can be seen from the figure above that under aerobic conditions, the observed rate constant obtained from the kinetic data in figure 34 is higher than in aerobic conditions, thus confirming the hypothesis. All the above results are of consequence in the development of an efficient system that could achieve complete and fast selenium removal from agricultural drainage water.
66

9 CONCLUSIONS Based on the results presented, several conclusions can be made:
1. Commercially available adsorbents were effective in removing selenite from synthetic solutions. However, they were not effective in removing selenate from similar solutions. Since the agricultural drainage water contains selenium mainly in the form of selenate, these adsorbents are not well suited materials for selenium removal from San Joaquin Valley agricultural drainage water.
2. The adsorption of selenite by adsorbents is dependent on the type of adsorbent, the
concentration of Se (IV), the adsorbent loading, the solution pH and the solution temperature. The data show that it is clear that under identical conditions the adsorption capacity (per unit mass basis) of the adsorbents in increasing order chitin < α alumina < activated carbon < γ alumina.
3. The poor adsorption of selenite on fullerenes may be partially due to the difficulty involving
the separation of the fullerene colloid.
4. The surface charge modification of the carbons using copper cations significantly changed the surface charge density of the carbons resulting in increased equilibrium uptakes of selenite. Further, complexation of the metal cation on the modified carbon surface and the selenite species is assumed to enhance selenite removal.
5. The chemical modification of carbons did not enhance selenate removal greatly. High
amount of solid loading is required to remove selenium to the mandated EPA levels.
6. Selenate was more difficult to remove from aqueous solutions than selenite. The redox conditions (based on pH and selenium concentration) in the as-received agricultural water results in the existence of selenium in the higher oxidation state – selenate. The low selenium removals employing adsorbent can be attributed to the inherent difficulty to remove selenate via adsorption, and competing anions present for the sorbent sites.
7. The presence of high amounts of anionic impurities such as chloride, nitrates and sulfates
inhibit selenium removal and thus need to be removed from the system before treating them with the adsorbents.
8. Nanosized zerovalent NiFe and iron particles rapidly reduced and immobilized selenate from
aqueous solutions. Nearly 100% selenate removal was obtained in five hours under most conditions. The data show that, at identical solids loading, the use of NiFe particles as compared to Fe and Ni particles accomplished greater than 42% and 56% removal, respectively.
9. It was observed in the data that aerobic conditions and high temperatures facilitate faster
removal of selenium using NiFe.
67

10. The rate of selenium reduction reaction was found to follow first order or zero order kinetics,
depending on the initial contaminant concentration, and was also dependent on the surface area of the solids.
11. The use of nanosized NiFe powders resulted in nearly complete selenium removal from the
agricultural drainage water samples obtained from the California’s San Joaquin valley.
12. A two-step approach to simultaneously reduce sulfate and selenate contaminants in drinking water was investigated. The amount of waste solids produced was significantly low and the extent of selenium removal was higher than that when commercial adsorbents (alumina and activated carbon) were used to remove selenate. The two-stage process of sulfate precipitation by barium chloride and subsequent selenium removal using an optimum loading of nanoparticles of NiFe greatly helped to reduce selenium level in agricultural waters to the US Environmental Protection Agency mandated limit of 0.01mg/L, presumably by reducing the sulfate interference. The precipitation reaction was rapid and sludge can be easily separated from the aqueous stream.
13. Although the results presented here are encouraging, a number of practical issues need to be
addressed before the proposed process can be implemented on a full-scale system. The first is the cost effectiveness of disposal vs. the feasibility of regeneration of BaCl2. Secondly, the efficiency of selenate removal using adsorbents or bimetallic particles is dependent on the dissolved selenium concentration. As the precipitation process is highly efficient, very low Se (VI) concentration is found in the first stage of operation (treatment with BaCl2 only). This could reduce the efficiency of the second-stage operation involving adsorption/reduction of selenium by adsorbent solids.
10 PUBLICATIONS
The following peer-reviewed publications and conference presentations have resulted from the work performed under the grant provided by the Department of Water Resources, California:
1. Mondal, K., Jegadeesan, G. and Lalvani, S. B., “Removal of Selenate by Fe and NiFe Nanosized Particles,” Industrial and Engineering Chemistry Research, 43, 4922-4934, 2004.
2. Jegadeesan, G., Mondal, K., and Lalvani, S. B., “Comparative Study of Selenite Adsorption on Carbon Based Adsorbents and Activated Alumina,” Environmental Technology, 24 (8) 1049-1059, 2003.
3. S. B. Lalvani, G. Jegadeesan, K. Mondal, “Enhancing Arsenate Remediation using Nanosized Modified Zerovalent Iron Particles,” AIChE, Austin, TX, Nov. 2004.
4. K. Mondal and S. B. Lalvani, “Removal of Anions of Toxic Metals by Fe and NiFe Nanoparticles,” AIChE, San Francisco, Nov. 2003.
5. G. Jegadeesan, K. Mondal and S. B. Lalvani, “Adsorption of Selenite and Selenate by Modified Low Cost Carbons,” San Francisco, AIChE, Nov. 2003.
68

11 ACKNOWLEDGEMENTS
This work was funded by a grant from the Department of Water Resources, California. Researchguideance was provided by Mr. Jose Faria. Experimental work was performed by Gautham Jegadeesan. Dr. Kanchan Mondal offered ideas pertinent to the work conducted. Selenium content determination was made by the Bryte Labs, Sacramento, CA.
69

REFERENCES Adutwum, K., Adsorption mechanism of oxyanions of Se on to lanthanum oxide and alumina, M.S. Thesis, University Reno, Reno, NV. 1995. Afonso, M., V. Geraldes, M. Rosa, and M. DePinho, “Nanofiltration removal of chlorinated organic compounds from alkaline bleaching effluent in a pulp and paper plant”, Water Research, 1992. 26:1639-1643. Balistrieri, L.S. and T.T. Chao, “Adsorption of Se by Amorphous Iron oxyhydroxides and Manganese dioxide”, Geochim. Cosmochim. Acta. 1990. 54:739-51. Balistrieri, L.S. and T.T. Chao., “Se Adsorption by goethite”, Soil Science Soc. Am. J. 1987. 51(5). Batista, J.R. and J.C. Young, “The influence of aqueous silica on the adsorption of Se by activated alumina”, AAWA Water Research, 1994167-81. Batista, J.R. and J.C. Young, “Removal of Se from gold heap leachate by activated alumina adsorption”, EPD 97, ed. B. Mishra, TMS, Warrendale, PA, 1997 29-36. Benjamin, M.M. and N.K. Bloom, “Interactions of strongly binding cations and anions on amorphous iron oxyhydroxide”, Adsorption from Aqueous Solutions, ed. P.H. Tewari, N.Y., N.Y.: Plenum Press. 1981. Benjamin, M.M., K.F. Hayes, and J.O. Leckie, “Removal of toxic metals from power-generation waste streams by adsorption and coprecipitation”, J. Water Pollution Control Federation. 1982. 54(11):1472-81. Biniak, S., Pakula, M.; Szymanski, G.S.; Swiatkowski, A., Effect of activated carbon surface oxygen- and/or nitrogen-containing groups on adsorption of copper(II) ions from aqueous solution, Langmuir, 1999. 15, 6117-6122. Boegel, J. and D. Clifford, “Se oxidation and removal by ion exchange, EPA/600/2-86/031”, USEPA, Washington, DC. 1986. Brown, T.A., A. Shrift, “Assimilation of Selenate and Selenite by Salmonella Typhimurium”, Canadian J. Microbiology, 1980. 26, (5), 671-75. Cantrell, R. W., D. I. Kaplan, T. W., Wietsma, J. Haz. Mat., 1995. 42, 201-212. Corapcioglu M. O. and Huang C. P., “The adsorption of heavy metals onto hydrous activated carbon”, Water Res. 1987. 21(9), 1031-1044.
70

Corwin, R., A. Isaacson, and T. Jeffers, “Oxyanion removal from waste waters using immobilized ferric oxyhydroxide/peat moss”, 16th Annual Assoc. Abandoned Mine Land Programs Conf., Park City, UT. 1994. Davis, J.A. and J.O. Leckie, “Speciation of adsorbed ions at the oxide/water interface”, in Chemical Modeling in Aqueous Systems--speciation, Sorption, Solubility and Kinetics, ed. E.A. Jenne, American Chemical Society Symposium Series 93. 1979. Elrashidi, M. A.; Adriano, D. C.; Workman, S. M.; Lindsay, W. Soil Sci. 1987, 144, 141. Elson CM; Davies DH and Hayas ER, "Removal of arsenic from contaminated drinking water by Chitin/Chitosan mixture”, Water Res., 1980. 14, 1301-1311. EPRI. “Adsorption/coprecipitation of trace elements from water with iron oxyhydroxide”, Electric Power Research Institute, EPRI CF-1513, Project 910-1, Palo Alto, CA. 1980. EPRI. “Trace element removal by coprecipitation with amorphous iron oxyhydroxide: engineering evaluation”, Electric Power Research Institute, EPRI CS-4087, Palo Alto, CA. 1985 Ergas, S., R. Lawver, W. Pfeiffer, E. Schroederl. Report to U.S. Bureau of Reclamation, Contract 9-FC-20-07720, July, 1990. Faria, J., Chief Investigation Officer, Department of Water Resources, San Joaquin, CA, personal communications. Farrell, J.; Wang, J.; O’Day, P.; Conklin, M. Environ. Sci. Technol. 2001, 35, 2026. Fu, P., H. Ruiz, K. Thompson, C. Spangenberg, “Selecting membranes for removing nom and dpm precursors”. JAWWA, 1994. 86, 55-72. Fu, R.; Zeng, H.; Lu, Y. Carbon 1993, 31, 1089. Gillham, R. W., S. F. O`Hannesin, Ground Water, 1994. 32, 958-967. Gleason, K., J. Yu, A. Bunge, J. Wright, “Removal of Se from contaminated waters using emulsion liquid membranes”, Chemical Separations with Liquid Membranes. ACS, 1996. 342-360. Hayes, K., A. Roes, G. Brown, K. Hodgson, J. Leckie, G. Parks, “In Situ x-ray absorption study of surface complexes: Se oxyanions on alpha FeOOH”, Science. 1987. 238:783-86. Hingston, F.J. A.M. Posner, and J.P. Quirk, “Adsorption of Selenite by Goethite”, Adsorption from Aqueous Solution. N.Y., N.Y.: American Chemical Society, Advanced Chemistry Series, 1968. 79:82-90.
71

Hingston, F.J., “A Review of Anion Adsorption”, Adsorption of Inorganics at Solid-Liquid Interfaces, eds. M.A. Anderson and A.J. Rubin, Ann Arbor, MI., Ann Arbor Sci. Publ. 1981 Hornung, S.M. J. Yuan, and M. Ghosh, “Se Removal in fixed bed activated alumina adsorbers”, in Create a New Excellence, AWWA Annual Conference, 1983. 299-318. Howard, J.H., “Geochemistry of Se: formation of ferroselite and Se behavior in the vicinity of oxidizing sulfide and uranium deposits”, Geochim. Cosmochim. Acta, 1977. 41:1665-78. Isaacson, A.E., R.R. Corwin, and T.H. Jeffers, “As removal using immobilized ferric oxyhydroxides”, Impurity Control Disposal Hydrometall. Processes, Annual Hydrometallurgy Meeting, CIM, Vancouver, BC. 1994. 47-55. Isaacson, A.E., R.R. Corwin, and T.H. Jeffers, “As removal using immobilized ferric oxyhydroxides”, Impurity Control Disposal Hydrometall. Processes, Annual Hydrometallurgy Meeting, CIM, Vancouver, BC. 1994. 47-55. Je´roˆme D, Alain W, Jacques B., Chemical Mechanisms Responsible for the Immobilization of Selenite Species from an Aqueous Medium in the Presence of Copper(I) Oxide Particles, Langmuir, 2002. 18, 8472-8480. Jeffers, T., C. Ferguson, and P. Bennett, “Biosorption of metal contaminants using immobilized biomass-a laboratory study”, U.S. Bureau Mines, RI-9340, Washington, D.C. 1991 Jegadeesan, G, K. Mondal, S. B. Lalvani, “Comparison of Adsorption of Selenite by Carbon-based Adsorbents and Alumina”, Environ. Sci. Tech., 2003. 24 (8) 1049 – 1059. Johnson, J. S., Jr.; Westmoreland, C. G.; Sweeton, F. H.; Kraus, K. A.; Hagmann, E. W.; Eatherly, W. P.; Child, H. R. J. Chromatogr. 1986. 354, 231. Johnson, T. J., M. M. Scherer, P. G. Tratnyek, Environ. Sci. Tech., 1996. 30, 2634-2640. Johnson, T. L., W. Fish, Y. A. Gorby, P. G. Tratnyek, J. Contam. Hyrol., 1998. 29, 379. Kapoor, A., T. Tanjore, and T. Viraraghavan, “Removal of Se from water and wastewater”, Environmental Science and Technology. 1995. 49(2):137-47. Kharaka, Y, W. Evans, G. Ambats, and J. Thordsen, “Major Potential precipitation problems from the deep injection of ground water brine from Paradox Valley, CO”, in USGS Toxic Substances Meeting, USGS Water Resources IR 94- 4051. Washington, D.C. 1988. 234-41. Kharaka, Y., “Removal of Se from contaminated agricultural drainage water by nanofilitration membranes”, Applied Geochemistry, 1996. 11,797-802. Lackovic, J. A., N. P. Nikolaidis, G. M. Dobbs, Environ. Eng. Sci., 1999. 17, 29-39.
72

Letey, J.; Roberts, C.; Penberth, M.; Vasek, C., “An agricultural dilemma: Drainage water and toxics disposal in the San Joaquin Valley”, University of California Agricultural Experiment Station: Riverside, CA. 1986. Levander, O. A., Fed. Proc. 1985. 44, 2579. Lien, R., “Chemical and biological cyanide destruction and Se removal from precious metals tailings pond water”, EPD Congress ‘90, ed. D.R. Gaskell, TMS, Warrendale, PA, 1990. 323-39. Lin, C.-J, Chang, J.-E, Effect of fly ash characteristics on the removal of Cu(II) from aqueous solution, Chemosphere, 2001. 44, n 5, 1185-1192. Lykins, B. and R. Clark, U.S. drinking water regulations: treatment technologies and cost. J.Environmental Engineering, American Society Chemical Engineering. 1994. 120(4):783-802. Maneval, J., “Se removal from drinking water by ion exchange”, EPA/600/2-85/074. USEPA, Washington, DC. 1985. Manning, B.A. and R.G. Burau., “Se immobilization in evaporation pond sediments by in situ precipitation of ferric oxyhydroxide”, Environmental Science and Technology. 1995. 29(10):2639-46. Matheson, L. J., P. G. Tratnyek, Environ Sci. Tech., 1994. 28, 2045. McGrew, K., J. Murphy, and D. Williams, “Se reduction via conventional water treatment”, Randol Gold Forum 96, Denver, CO, 1996. 129-41. Merrill, D.T., M. Manzione, D. Parker, J. Petersen, W. Crow, and A. Hobbs, “Field evaluation of as and Se removal by iron coprecipitation”, J. Water Pollution Control Federation, 58(1) and Env. Progress, 1986. 6(2):82-9. Mondal, K., Jegadeesan, G. and Lalvani, S. B., “Removal of Selenate by Fe and NiFe Nanosized Particles,” Industrial and Engineering Chemistry Research, 2004. 43, 4922-4934. Moore, S. B., Selenium in agricultural drainage: Essential nutrient or toxic threat?”, Journal of Irrigation and Drainage Engineering, 1989. 115 (1), 21-28. Murphy, A., “Removal of selenate from water by chemical reduction”, Industrial Engineering Chemical Research. 1988. 27(1):187-191. Murphy, A., “Water treatment process for Se removal”, J. Water Pollution Control Federation. 1989. 61(3):361-62. Muzzarelli, R, A.A, Chitin, Pergamon Press, Jeuniaux, C., (ed), Oxford, (1977).
73

Oblosnky, L. J., M. P. Ryan, H. S. Isaacs, Corrosion Sci. 2000. 42, 229-241. Parida, K.M., B. Gorai, N. Das, S. Rao, “Studies on ferric oxide hydroxides iii. Adsorption of selenite on different forms of iron oxyhydroxides”, J. Colloid Interface Science. 1997. 185(2):355-62. Pengchu, A. and D.L. Sparks. Kinetics of selenate and selenite adsorption/desorption at the goethite/water interface. Environmental Science and Technology. 1990. 24(12):1848-56. Pontius, F., “An update of the federal drinking water Regs”, J. AWWA. 1995. 7(2):48-58. Powell, R. M., R. W. Puls, S. K. Hightower, D. A. Sabatini, Environ. Sci. Tech., 1995. 29, 1913-1922. Pratt, A. R., D. W. Blowes, C. J. Ptacek, Environ. Sci. Tech., 1997. 31, 2492-2498. Presser, T. S.; Sylvester, M. A.; Low, W. H., Env. Mang., 1994. 18, 423. Puls, R. W., C. J. Paul, R. M. Powell, Appl. Geochem., 1999. 14, 989-1000. Qian, S, G. Huang, J., Jiashen, H., Fei, W., Yuting, “Studies of adsorption behaviour of crosslinked chitosan for Cr (VI), Se (VI)”, J.App. Poly. Sci, 1999. 77, 3216-3219. Qian, S, G. Huang, J., Jiashen, H., Fei, W., Yuting, J.App. Poly. Sci, 1999. 77, 3216-3219. Ramana, A. and A. Sengupta, “Removing Se(IV) and As (V) Oxyanions with tailored chelating polymers”. J. Environmental Engineering. ASCE. 1992. 118(5):755-75. Roberson, M. J., “Removal of Selenate from Irrigation Drainage Water Using Zero-Valent Iron”, Ph.D. Dissertation, University of California, Riverside, CA, 1999. Roberts, A. L.; Totten, L. A.; Arnold, W. A.; Burris, D. R.; Campbell, T. J. Environ. Sci. Technol. 1996, 30, 2654-2659. Roine, A., HSC Chemistry Software, ver 3.0, Copyright © Outokumpu Research Oy, Pori, Finland. Rosengrant, L, and L. Fargo, “Final Best Demonstrated Available Technology (BDAT) background document for K031, K084, K101, K102, characteristic as wastes (D004), characteristic Se wastes (D010), and P and U wastes containing As and Se listing Constituents”, EPA/530/SW-90/059A, USEPA, 1990. 124. Rossin, Joseph A, Morrison, Robert W., “Spectroscopic analysis and performance of an experimental copper/zinc impregnated, activated carbon”, Carbon, 1991. 29 (7), 887-892.
74
Sparkman, L. “Adsorption of oxyanions by spent western oil shale: selenite“. Environmental Geol. Water Science. 1990.15(2):93-9. Stiksma, J., K. Berezowsky, M. Collins, I. Masters, “Iron addition for impurity control at Sherritts nickel refinery”, Iron Control and Disposal, eds. J.E. Dutrizac, G.B. Harris, CIM, Montreal, Quebec, Can., 1996. 287-98. Su, C., and R. W. Puls, Env. Sci. Tech., 2001. 35, 1487–1492. Su, C., and R. W. Puls, Env. Sci. Tech., 1999. 33, 163-166. Su, C., R. W. Puls, “Arsenate and Arsenite removal by Zerovalent Iron: Effects of phosphate, Silicate, Carbonate, Borate, Chromate, Molybdate and Nitrate, relative to chloride”, Environ. Sci. Tech., 2001. 35, 4562-4568. Su, C., Suarez, D.L, “Selenate and Selenite sorption on iron oxides: An infrared and electrophoretic study”, Soil. Sci. Soc. Am. J, 2000. 64, 101-111. Trussell, R. A., A. Trussell, P. Kraft, “Selenium Removal with Activated Alumina”, AWWA Research Foundation Water Quality Research News, 1991. 19, 4-5. Trussell, R.A., A. Trussell, and P. Kraft, “Se removal from groundwater using activated alumina”, EPA-600/12-80-153, USEPA, Washington, DC. 1980. U.S. Environmental Protection Agency. Final Draft for the Drinking Water Criteria Document for Selenium. Criteria and Standards Division. Office of Drinking Water, Washington, D.C. 1986. Virnig, M. J., K.E. Weerts, “CyanoMet R-A Process for the Extraction and Concentration of Cyanide Species from Alkaline Liquors”, Randol Gold Forum `93, (Denver, CO, Randol Gold Int.), 1993. 333-36. WSPA, “Selenium Removal Technology Study - Final Report”, Western States Petroleum Association, Concord, CA. July 1995. Yuan, J. R. “Adsorption of Arsenic and Selenium on Activated Alumina”, ASCE, Environmental Engineering. Division Specialty Conference, Eds: A. Medine, M. Anderson, Boulder, CO, Am. Soc. Chemical Engr., July 6-8, 1983. 433-41.
75