Embed Size (px)
Citation preview
Selective enrichment of key bacterial groups within the human colon in
response to changes in diet
Alan WalkerWellcome Trust Sanger Institute

Diet and the human gut microbiota
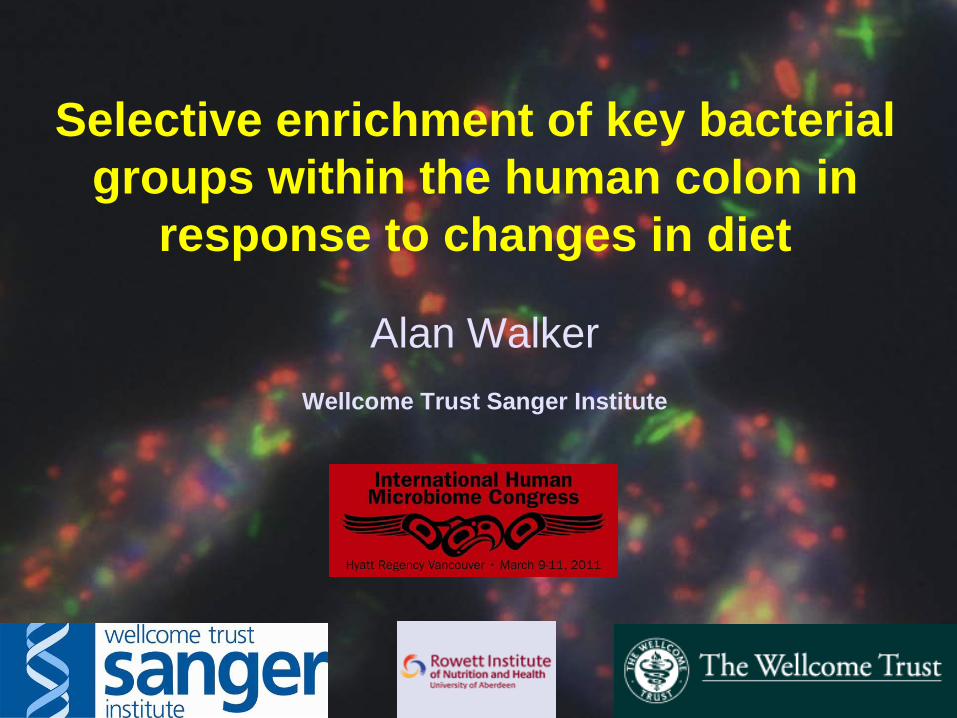
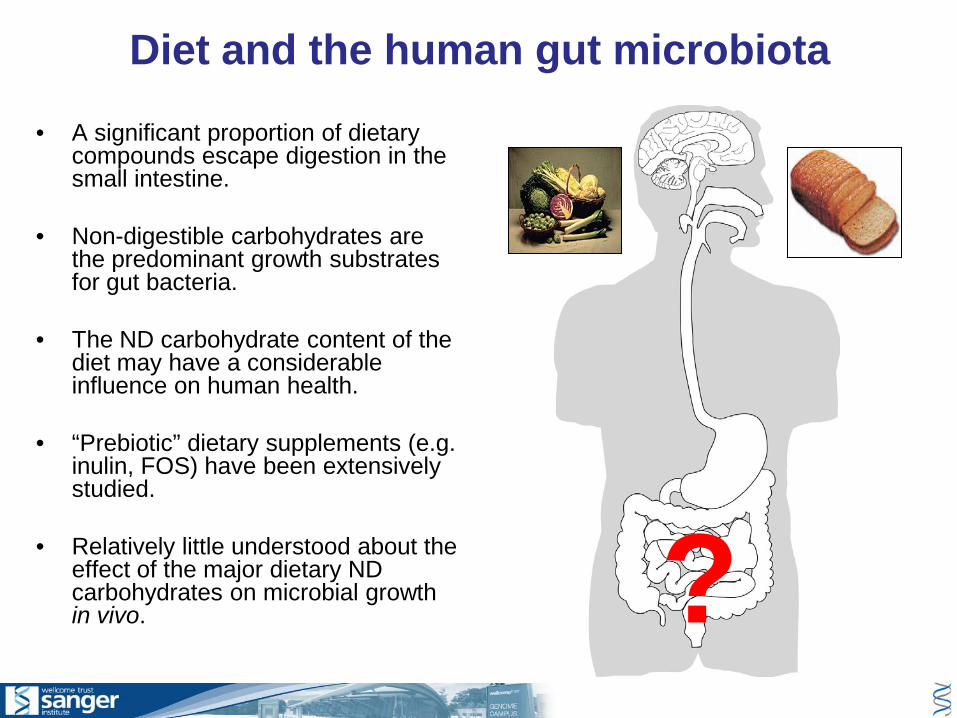
• A significant proportion of dietary compounds escape digestion in the small intestine.
• Non-digestible carbohydrates are the predominant growth substrates for gut bacteria.
Principal substrates available for utilization by intestinal microbes
[from Cummings & Macfarlane (1991)]
Resistant starch
Non-starch polysaccharides
Unabsorbed sugars
Oligosaccharides
Dietary protein
Enzymes / secretions / mucus
5040302010Amount [gram per day]
Of dietary & intestinal origin: range
Digestibilities for plant cell wall polysaccharides – 7 subjects (Slavin et al J. Nut 1981)
Pure cellulose (Solka Flok) minimal Cellulose (in normal diets) 69.7% (+/-10.7)Hemicellulose 71.7% (+/- 5.4)
[Harry Flint - Rowett Institute of Nutrition and Health]

oligo-, mono-saccharides
lactate
butyrate
complex polysaccharides
propionate
acetate
polysaccharide degraders
succinate
formateH2 + CO2
saccharolytic bacteria
CH4
ethanol
H2S
SO42-
acetogens
methanogens
H2 + CO2
sulfate reducers
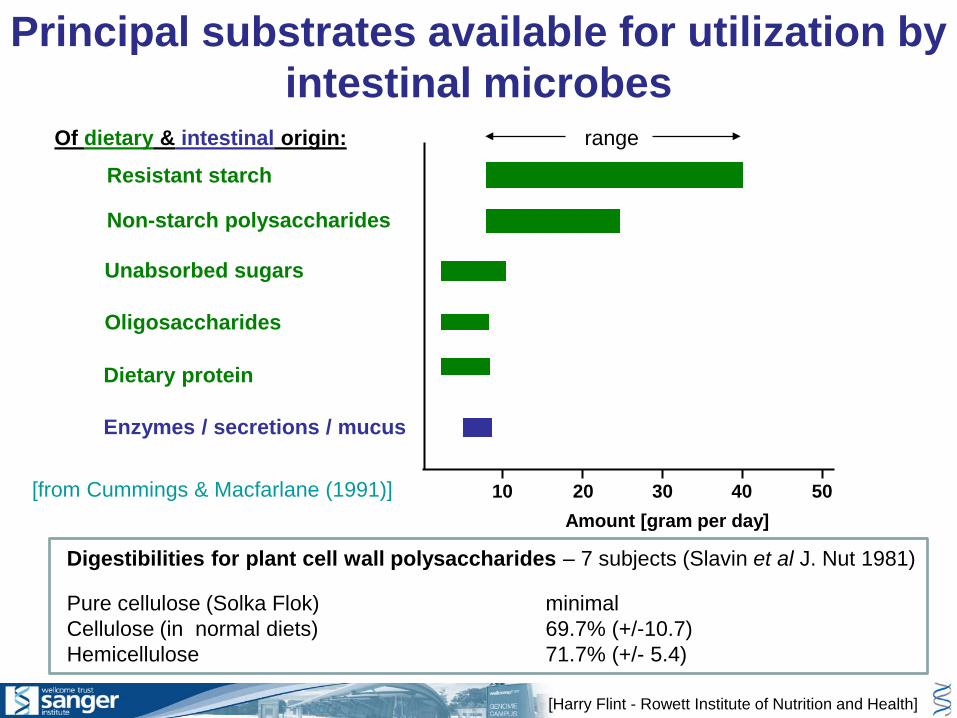
Microbial metabolism of dietary compounds
[Harry Flint - Rowett Institute of Nutrition and Health]
Proximal Colon Transverse Colon Distal ColonActive fermentation Depletion of substrates Reduced carbohydrate fermentation
High bacterial growth rates Reduction in bacterial activity Increase in protein fermentationTotal SCFA around 127mM Total SCFA around 117mM Total SCFA around 90mM
pH 5.5-5.9 pH around 6.2 pH 6.5-6.9
Microbial metabolism of dietary compounds
Figure adapted from Leser & Mølbak (2009) and Cummings & Macfarlane (1991)
Regional differences along the length of the GI tract drive the development ofdistinct microbial communities with differing fermentative activities.
Diet and the human gut microbiota
• A significant proportion of dietary compounds escape digestion in the small intestine.
• Non-digestible carbohydrates are the predominant growth substrates for gut bacteria.
• The ND carbohydrate content of the diet may have a considerable influence on human health.
• “Prebiotic” dietary supplements (e.g. inulin, FOS) have been extensively studied.
• Relatively little understood about the effect of the major dietary ND carbohydrates on microbial growth in vivo. ?
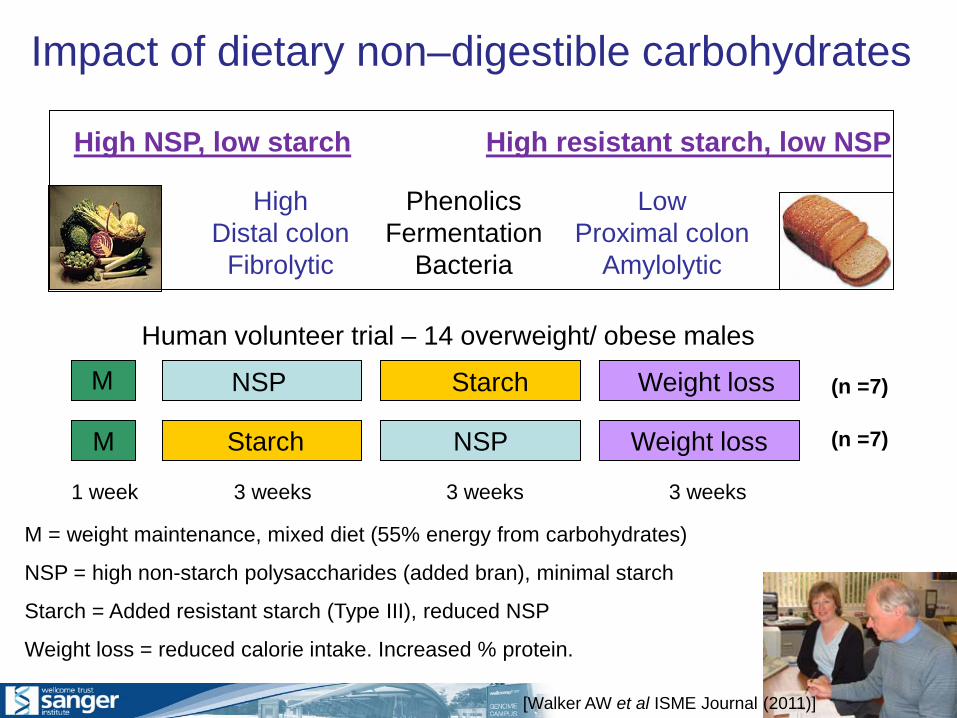
Impact of dietary non–digestible carbohydrates
StarchM
NSP
NSP
Starch
3 weeks 3 weeks1 week 3 weeks
Weight loss
Weight loss
(n =7)
(n =7)
Human volunteer trial – 14 overweight/ obese males
M = weight maintenance, mixed diet (55% energy from carbohydrates)
NSP = high non-starch polysaccharides (added bran), minimal starch
Starch = Added resistant starch (Type III), reduced NSP
Weight loss = reduced calorie intake. Increased % protein.
[Walker AW et al ISME Journal (2011)]
M
High NSP, low starch High resistant starch, low NSP
PhenolicsFermentation
Bacteria
HighDistal colon
Fibrolytic
LowProximal colon
Amylolytic
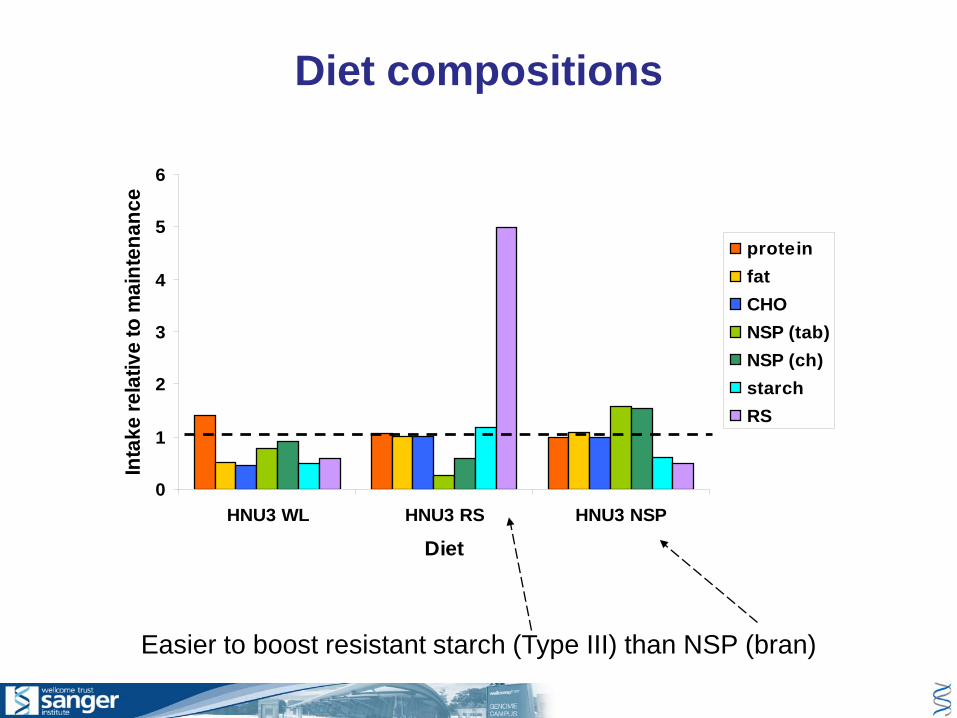
Easier to boost resistant starch (Type III) than NSP (bran)
0
1
2
3
4
5
6
HNU3 WL HNU3 RS HNU3 NSP
Diet
Inta
ke re
lativ
e to
mai
nten
ance
proteinfatCHONSP (tab)NSP (ch)starchRS
Diet compositions
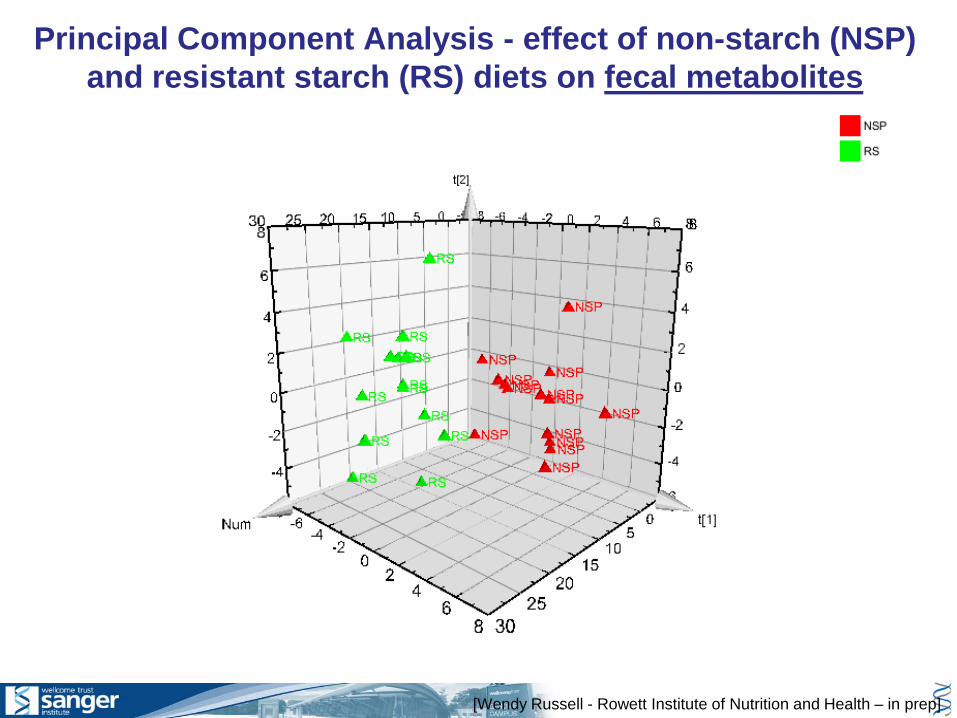
[Wendy Russell - Rowett Institute of Nutrition and Health – in prep]
Principal Component Analysis - effect of non-starch (NSP) and resistant starch (RS) diets on fecal metabolites
Volunteer 24
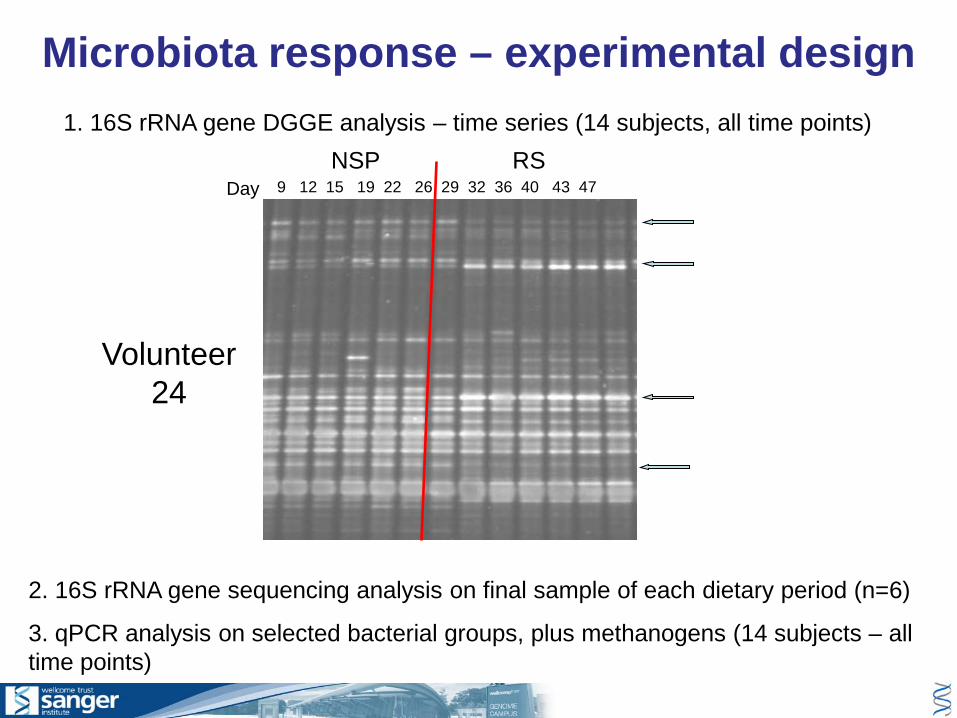
1. 16S rRNA gene DGGE analysis – time series (14 subjects, all time points)
2. 16S rRNA gene sequencing analysis on final sample of each dietary period (n=6)
3. qPCR analysis on selected bacterial groups, plus methanogens (14 subjects – all time points)
Microbiota response – experimental design
RSNSP9 12 15 19 22 26 29 32 36 40 43 47Day
-0.4 -0.3 -0.2 -0.1 0.0 0.1 0.2 0.3
-0.2
-0.1
0.0
0.1
0.2
0.3
Axis 1, 22%
Axi
s 2,
15%
D16M
D16MbD16NSPa
D16NSP
D16RS
D16WL
D19M
D19NSP
D19RS
D19WL
D20M
D20NSP
D20RS
D20WL
D22M
D22NSP
D22RS
D22WL
D23M
D23NSP
D23RS
D23WL
D24MD24NSP
D24RS
D24WL
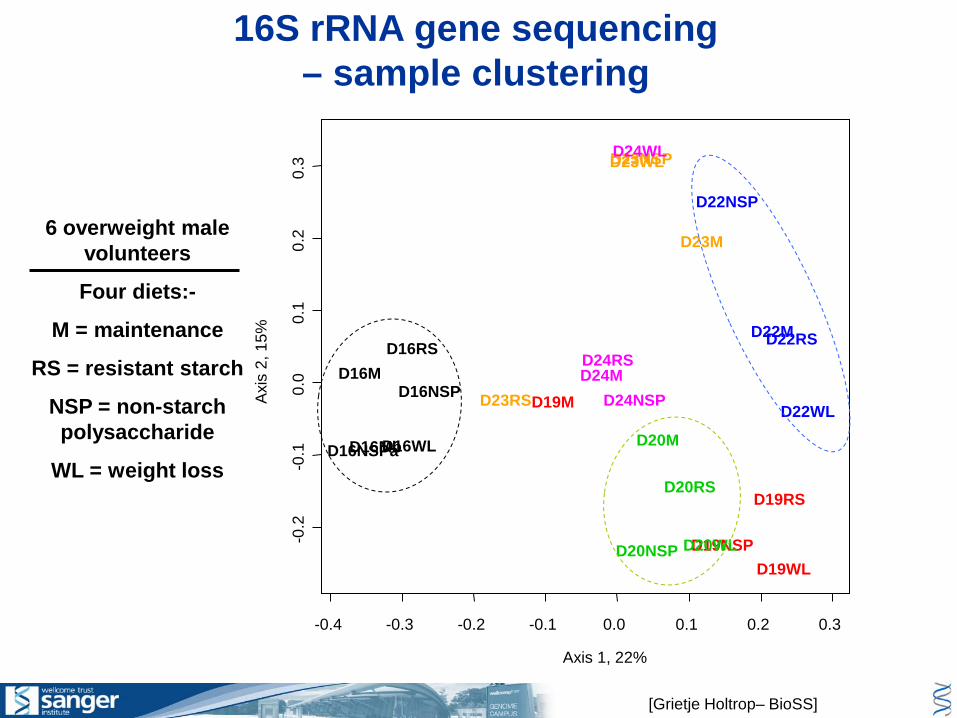
6 overweight male volunteers
Four diets:-
M = maintenance
RS = resistant starch
NSP = non-starch polysaccharide
WL = weight loss
[Grietje Holtrop– BioSS]
16S rRNA gene sequencing – sample clustering
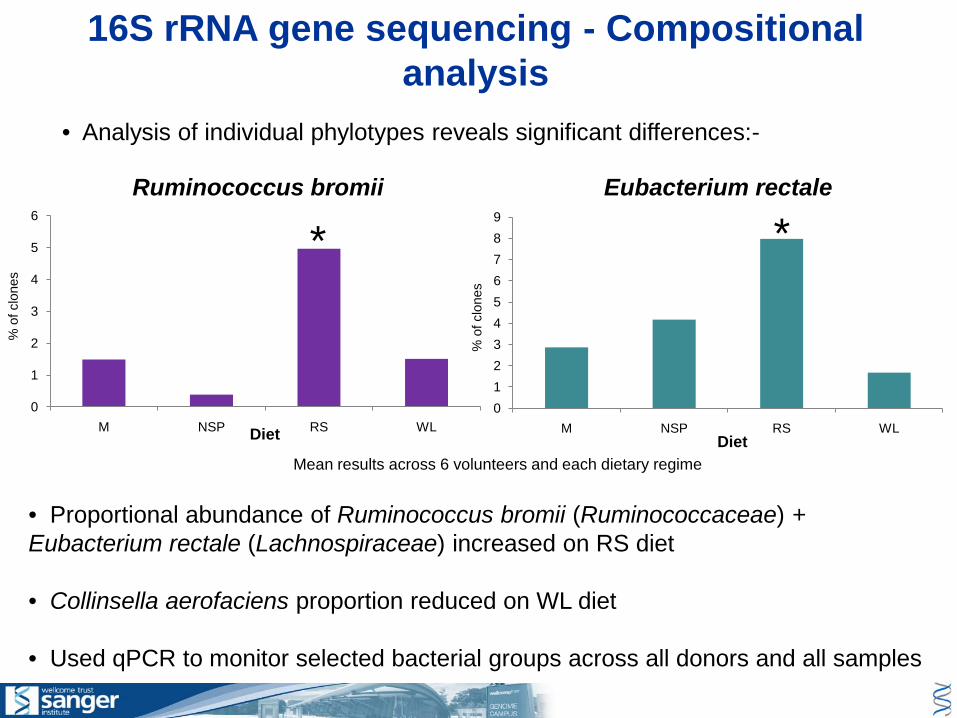
• Analysis of individual phylotypes reveals significant differences:-
• Proportional abundance of Ruminococcus bromii (Ruminococcaceae) + Eubacterium rectale (Lachnospiraceae) increased on RS diet
• Collinsella aerofaciens proportion reduced on WL diet
• Used qPCR to monitor selected bacterial groups across all donors and all samples
16S rRNA gene sequencing - Compositional analysis
% o
f clo
nes
0
1
2
3
4
5
6
M NSP RS WL
Ruminococcus bromii
*
% o
f clo
nes
Diet0123456789
M NSP RS WL
Eubacterium rectale
*
DietMean results across 6 volunteers and each dietary regime
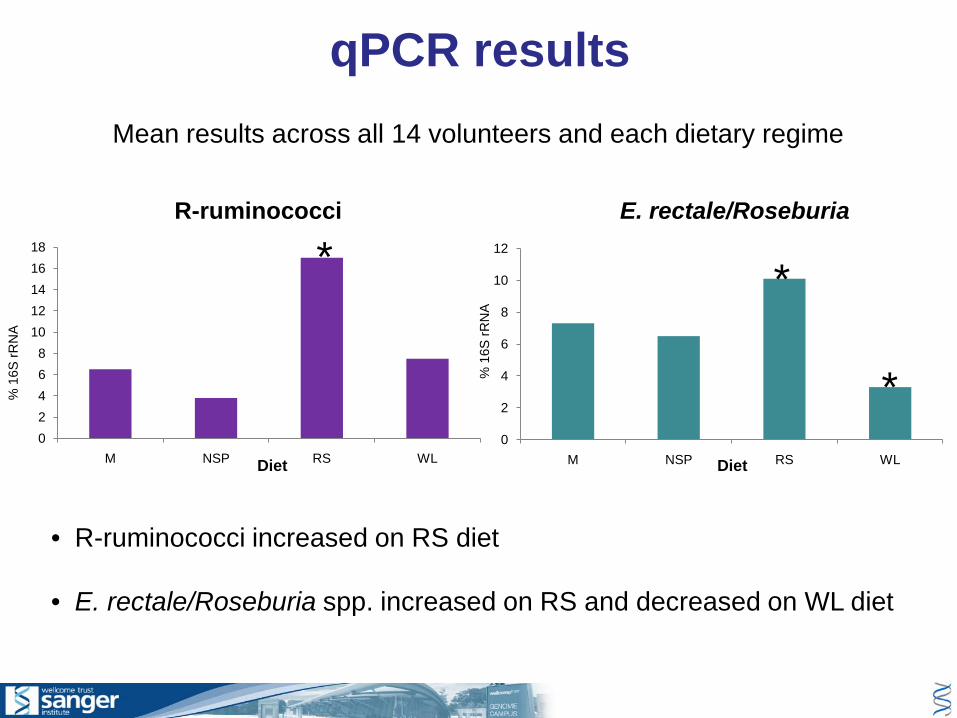
qPCR results
02468
1012141618
M NSP RS WL
R-ruminococci
*
0
2
4
6
8
10
12
M NSP RS WL
E. rectale/Roseburia
% 1
6S rR
NA
% 1
6S rR
NA
*
*
• R-ruminococci increased on RS diet
• E. rectale/Roseburia spp. increased on RS and decreased on WL diet
Mean results across all 14 volunteers and each dietary regime
Diet Diet
M NSP
WL
RS
0
10
20
30
40
50
0 10 20 30 40 50 60 70
M NSP RS WL
% o
f uni
vers
al 1
6S rR
NA
gene
cop
ies
11121718192324
Volunteer
0
10
20
30
40
50
60
70
80
0 10 20 30 40 50 60 70
M RS NSP WL14151620222526
Volunteer
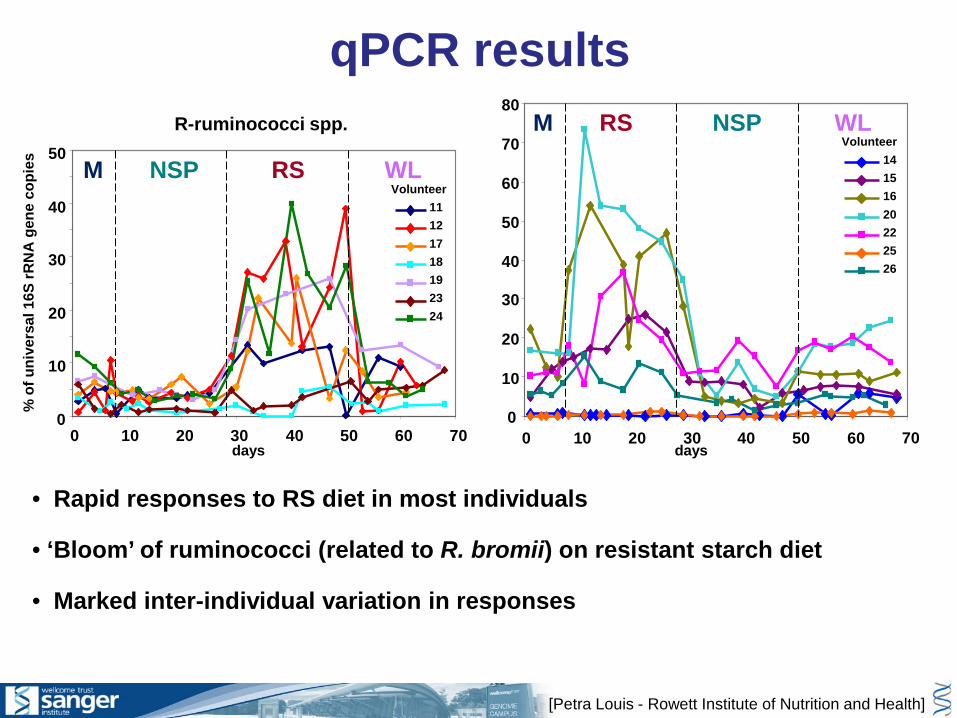
• Rapid responses to RS diet in most individuals
• ‘Bloom’ of ruminococci (related to R. bromii) on resistant starch diet
• Marked inter-individual variation in responses
[Petra Louis - Rowett Institute of Nutrition and Health]
R-ruminococci spp.
qPCR results
days days
R-ruminococci spp.
M NSP
WL
RS
0
10
20
30
40
50
0 10 20 30 40 50 60 70
M NSP RS WL
% o
f uni
vers
al 1
6S rR
NA
gene
cop
ies
11121718192324
Volunteer
days
M NSP RS WL
0
5
10
15
0 10 20 30 40 50 60 70
% o
f uni
vers
al
16S
rRN
A ge
ne c
opie
s
M NSP RS WL
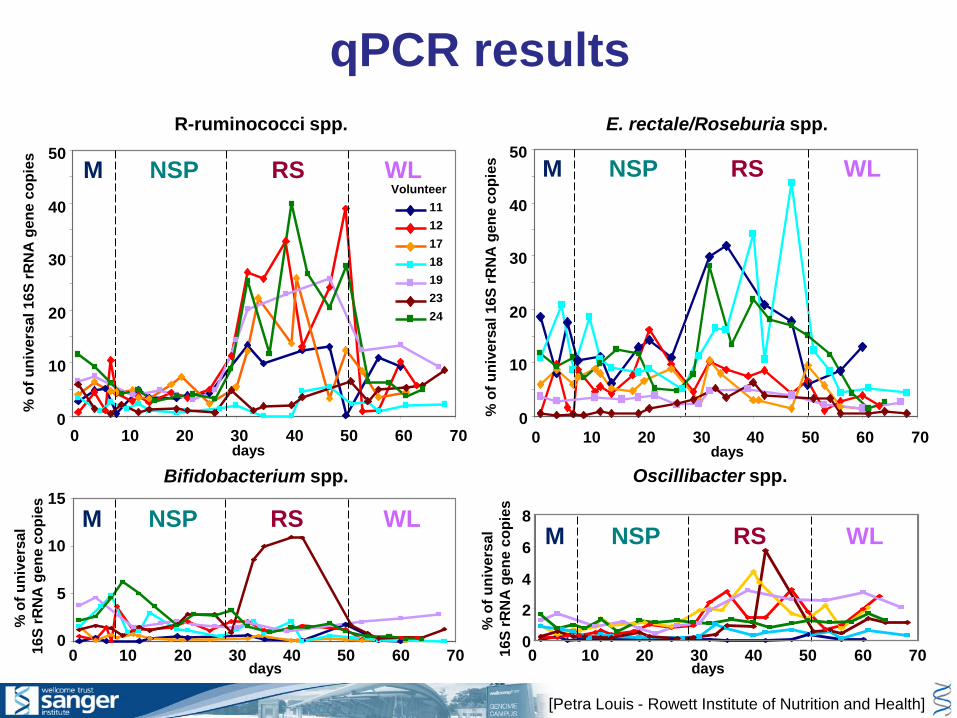
Bifidobacterium spp. Oscillibacter spp.
0
2
4
6
8
0 10 20 30 40 50 60 70
% o
f uni
vers
al
16S
rRN
A ge
ne c
opie
s
M NSP RS WL
days days
[Petra Louis - Rowett Institute of Nutrition and Health]
qPCR results
NSP RS
WLM
0
10
20
30
40
50
0 10 20 30 40 50 60 70
% o
f uni
vers
al 1
6S rR
NA
gene
cop
ies M NSP RS WL
E. rectale/Roseburia spp.
daysdays
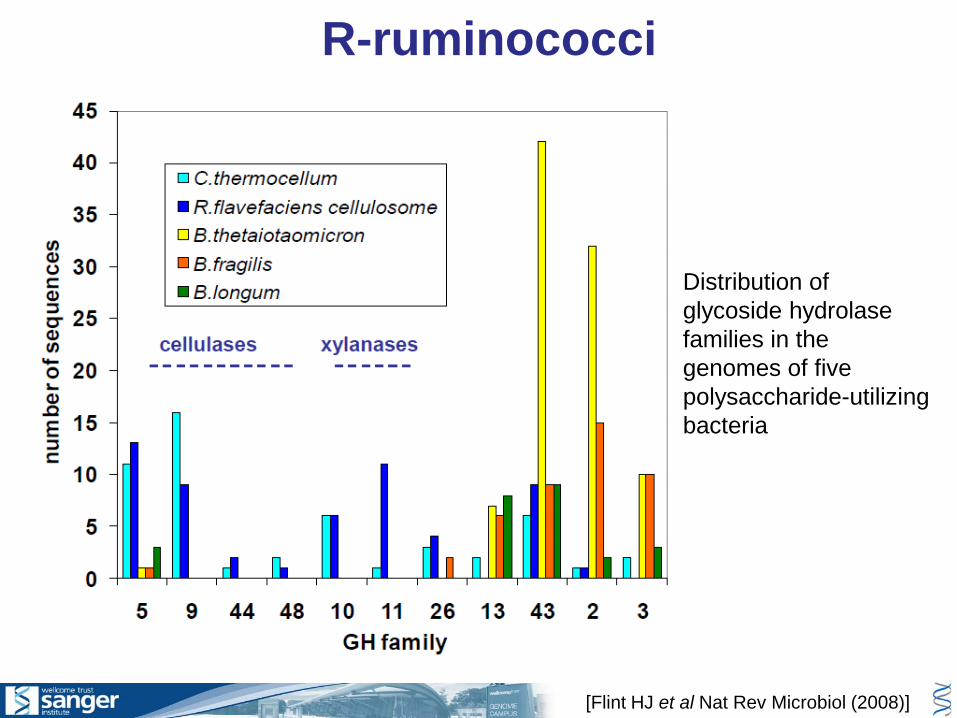
R-ruminococci
Distribution of glycoside hydrolase families in the genomes of five polysaccharide-utilizing bacteria
[Flint HJ et al Nat Rev Microbiol (2008)]
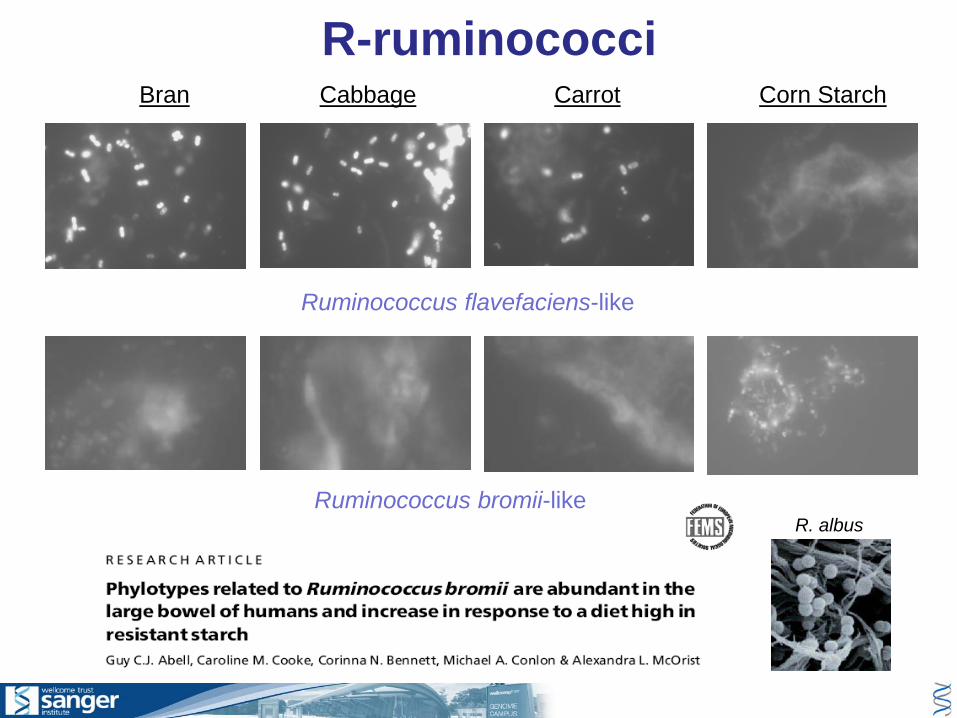
R-ruminococci
Ruminococcus bromii-like
Ruminococcus flavefaciens-like
Bran Cabbage Carrot Corn Starch
R. albus
0
10
20
30
40
% 1
6S rR
NA
gene
seq
uenc
es
Liquid
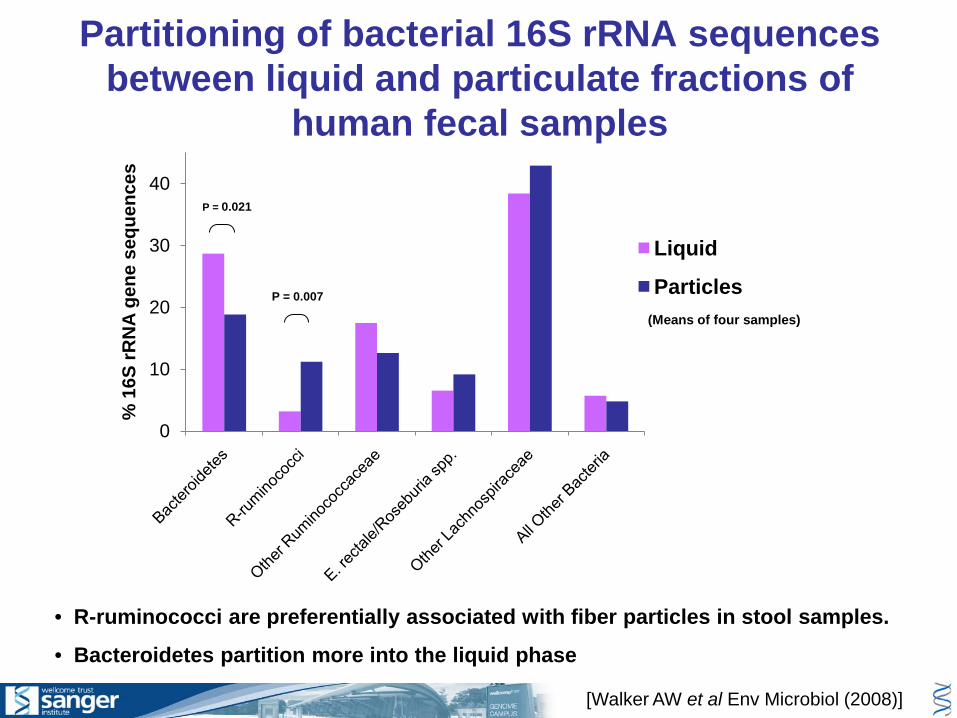
ParticlesP = 0.007
• R-ruminococci are preferentially associated with fiber particles in stool samples.
• Bacteroidetes partition more into the liquid phase
(Means of four samples)
[Walker AW et al Env Microbiol (2008)]
Partitioning of bacterial 16S rRNA sequences between liquid and particulate fractions of
human fecal samples
P = 0.021
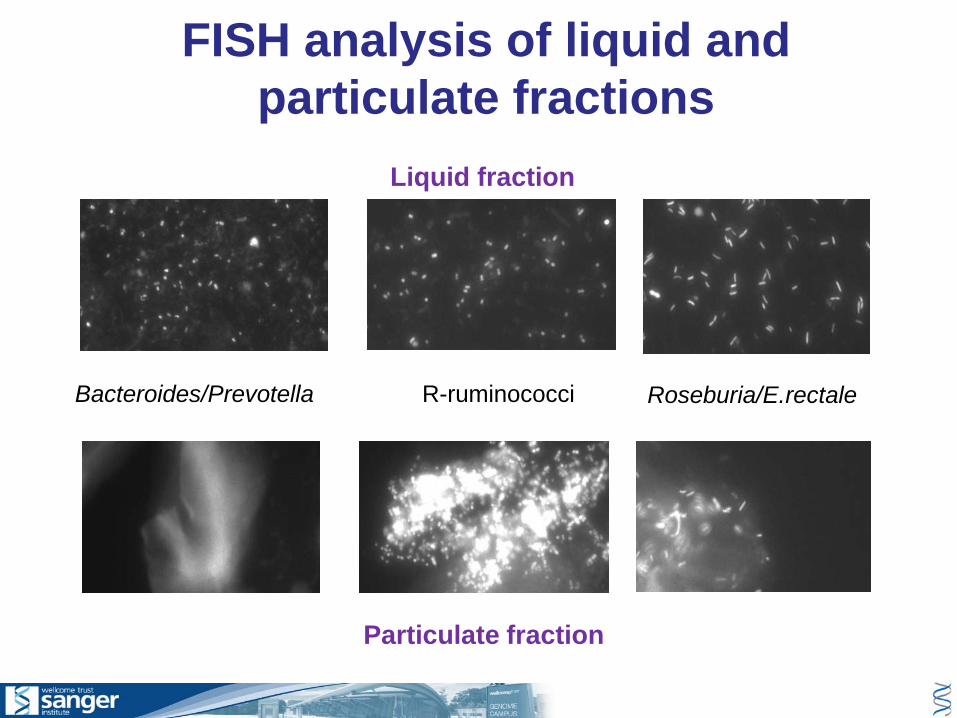
FISH analysis of liquid and particulate fractions
R-ruminococci Roseburia/E.rectaleBacteroides/Prevotella
Liquid fraction
Particulate fraction
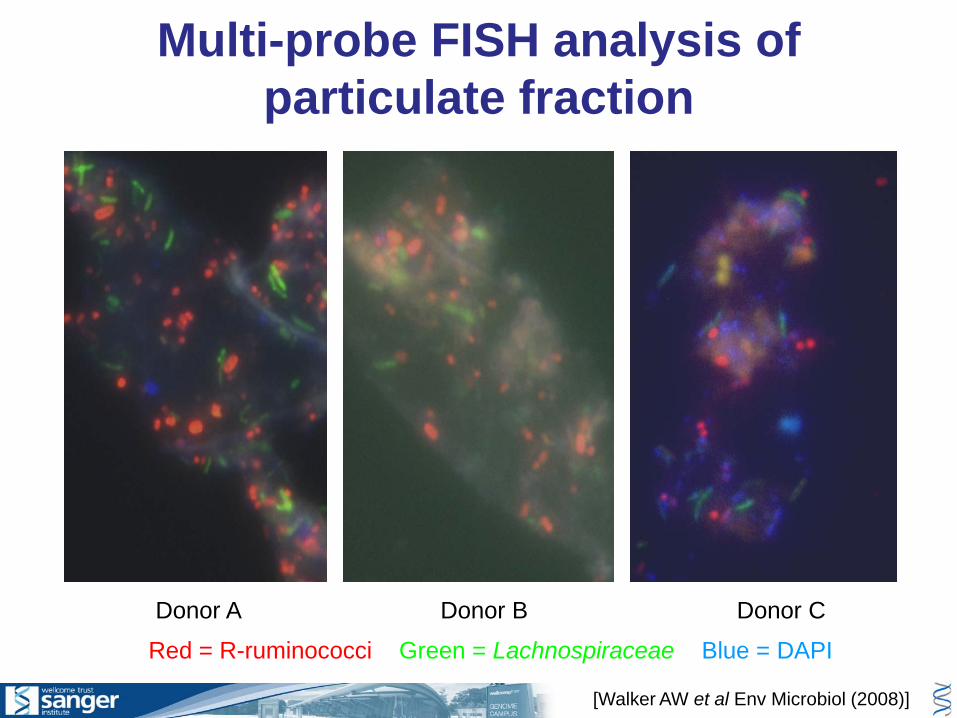
Multi-probe FISH analysis of particulate fraction
Red = R-ruminococci Green = Lachnospiraceae Blue = DAPI
Donor CDonor BDonor A
[Walker AW et al Env Microbiol (2008)]
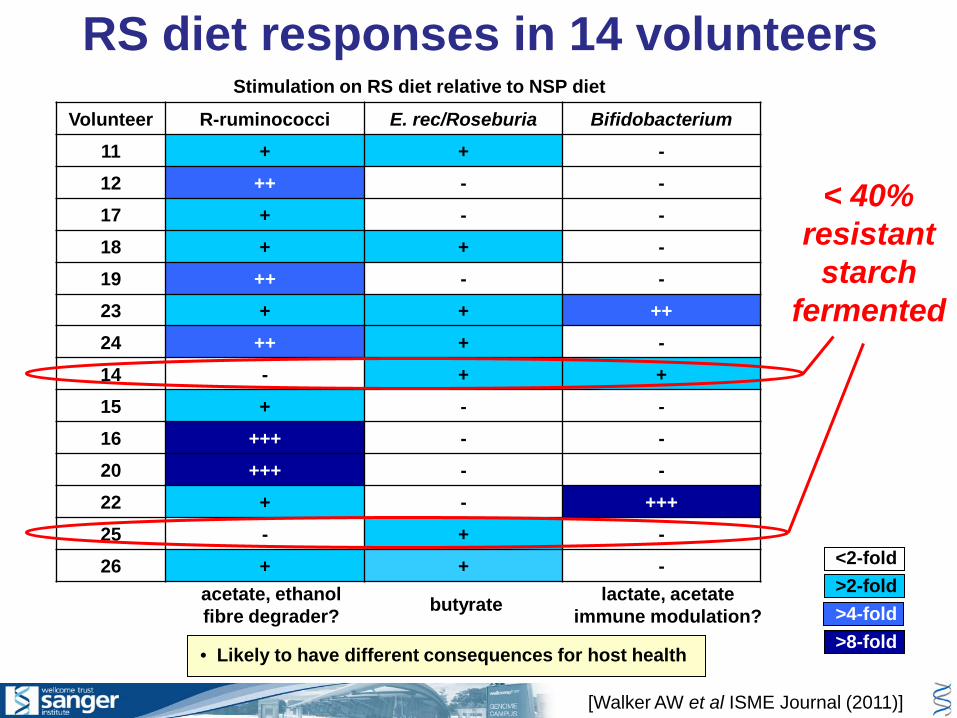
Volunteer R-ruminococci E. rec/Roseburia Bifidobacterium11 + + -12 ++ - -17 + - -18 + + -19 ++ - -23 + + ++24 ++ + -14 - + +15 + - -16 +++ - -20 +++ - -22 + - +++25 - + -26 + + -
acetate, ethanol fibre degrader? butyrate lactate, acetate
immune modulation?
• Likely to have different consequences for host health
Stimulation on RS diet relative to NSP diet
<2-fold>2-fold>4-fold>8-fold
RS diet responses in 14 volunteers
< 40% resistant
starch fermented
[Walker AW et al ISME Journal (2011)]
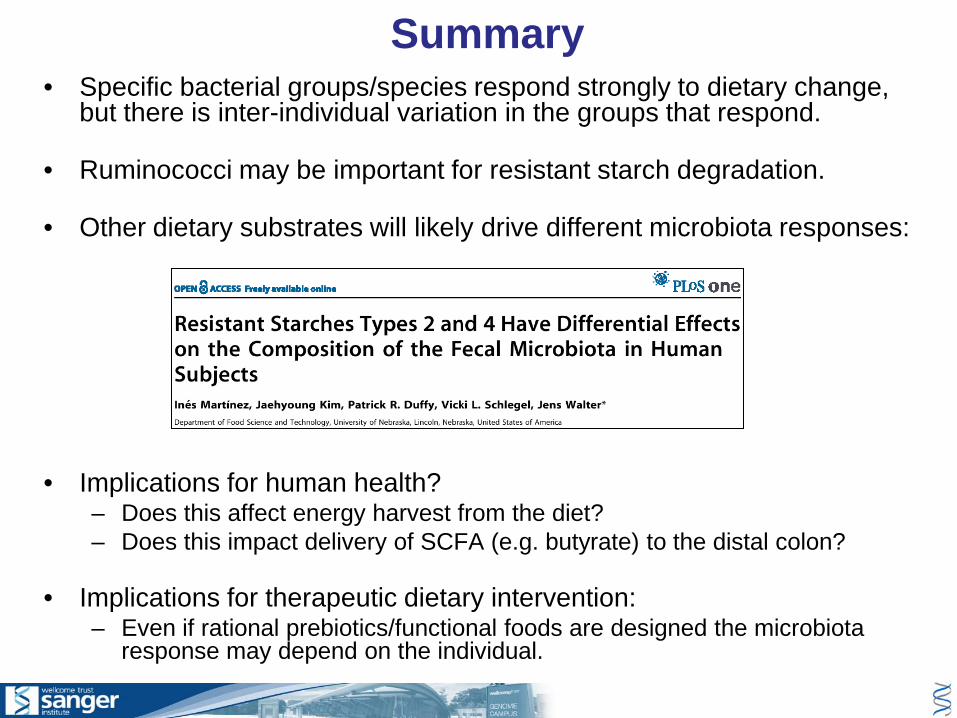
Summary• Specific bacterial groups/species respond strongly to dietary change,
but there is inter-individual variation in the groups that respond.
• Ruminococci may be important for resistant starch degradation.
• Other dietary substrates will likely drive different microbiota responses:
• Implications for human health?– Does this affect energy harvest from the diet?– Does this impact delivery of SCFA (e.g. butyrate) to the distal colon?
• Implications for therapeutic dietary intervention:– Even if rational prebiotics/functional foods are designed the microbiota
response may depend on the individual.

Collaborators
U. Groningen, The Netherlands
Gjalt WellingHermie Harmsen
U. Dundee, UKGeorge MacfarlaneSandra Macfarlane
Sanger Institute
Pathogen Genomics Group Julian Parkhill
Paul ScottMark Stares
Sequencing TeamsCarol Churcher
David HarrisNicola Lennard
Doug Ormond Tracey Chillingworth
Sharon MouleRobert Squares
AcknowledgementsRowett Institute
Microbial Ecology Group Harry Flint
Sylvia DuncanPetra Louis
Jennifer InceLucy Webster
Xiaolei Ze Aurore BergeratFreda McIntosh
David Brown (Analytical Chem)Wendy Russell (Mol Nutr)Alex Johnstone (OMH)Gerald Lobley (OMH)
Sylvia Hay (HNU)Grietje Holtrop (BioSS)
SG-RERAD
Funding provided by:

![Selective Isolation and Characterization of Cellulolytic ... · JIRCAS]ournalNo.5: 79-89 (1997) Selective Isolation and Characterization of Cellulolytic Bacteria by Cellulose Enrichment](https://img.pdfslide.us/doc/110x75/5c0a681409d3f2501a8b8ffd/selective-isolation-and-characterization-of-cellulolytic-jircasournalno5.jpg)