Embed Size (px)
Citation preview
S
Ma
b
a
ARRAA
KIMC
1
rivnMltmsp[hcct“tath
w
0d
Chemical Engineering and Processing 48 (2009) 356–363
Contents lists available at ScienceDirect
Chemical Engineering and Processing:Process Intensification
journa l homepage: www.e lsev ier .com/ locate /cep
election of systems for catalyst recovery by micellar enhanced ultrafiltration
ichael Schwarzea,∗, Anke Rosta, Thomas Weigelb, Reinhard Schomackera
TU Berlin, Straße des 17 Juni 124, 10623 Berlin, GermanyGKSS, Kantstraße. 55, 14513 Teltow, Germany
r t i c l e i n f o
rticle history:eceived 5 December 2007eceived in revised form 22 April 2008ccepted 23 April 2008
a b s t r a c t
The most discussed problem of homogeneous catalysis, the recovery of expensive catalyst, may be solvedwith the application of a technology, already well established in other fields: micellar enhanced ultrafil-tration (MEUF). Catalyst embedded in surfactant micelles is easy to recover from the reaction medium
vailable online 4 May 2008
eywords:onic and non-ionic surfactants
embranesatalyst recovery
by an ultrafiltration process. In this contribution the selection of surfactants and membranes suitablefor performing homogeneously catalyzed reactions in combination with a catalyst recovery by MEUF isdescribed. For a group of representative anionic, cationic and non-ionic surfactants that are compati-ble with a homogeneous rhodium-based hydrogenation catalyst, membranes were selected that allowhigh catalyst recovery. For ionic surfactant micelles best performance is achieved with polyethersul-fone membranes, while non-ionic systems are separated most efficiently using regenerated cellulose
bpct
mmmfitesoabmautot
membranes.
. Introduction
The most recent motivation for the use of surfactant basedeaction media relates to the “Green Chemistry” discussion. Its generally recommended to use water instead of organic sol-ents that could be harmful to the environment. Since water ison-toxic and non-flammable, it is regarded as the ideal solvent.ethods for water purification after industrial use are well estab-
ished and available in industrial scale [1]. The main problem withhe application of water in organic synthesis is the insolubility of
any reagents and catalysts in this medium. In specific cases thishortcoming can be overcome by modification of the reaction com-onents (substrates and/or catalysts) with hydrophilic auxiliaries2–4]. Other noteworthy strategies that enable certain reactions ofydrophobic reagents in water are the application of hydrophilico-solvents [2,5,6], the use of phase transfer catalysis and the appli-ation of ultrasonic or microwave irradiation. Often it is sufficiento employ a suitable surfactant or a micelle producing agent tosolubilize” the reactants and to enable the reaction [7]. In case ofhe application of expensive homogeneous catalysts in such medianother problem accompanied with homogeneous organic solu-
ions as reaction medium may be addressed, the recovery of theomogeneous catalyst.In general a catalyst with hydrophobic or amphiphilic ligandsill be embedded into the micelles due to its partition coefficient
∗ Corresponding author. Tel.: +49 30 314 24097; fax: +49 30 314 21595.E-mail address: [email protected] (M. Schwarze).
wsbTeobp
255-2701/$ – see front matter © 2008 Elsevier B.V. All rights reserved.oi:10.1016/j.cep.2008.04.014
© 2008 Elsevier B.V. All rights reserved.
etween hydrophilic and hydrophobic media. In an ultrafiltrationrocess the micelles are rejected by the membrane and the activeatalyst is transferred into the next reaction mixture with the reten-ate and reused without any loss of activity [8].
In order to avoid loss of catalyst in the filtration step theembrane must be adjusted to the properties of the surfactanticelles. It will be necessary to reach a high retention of theicelles to make the combination of catalytic reaction and ultra-
ltration process possible and economically viable. The tools forhis approach to catalyst recovery are available, since micellarnhanced ultrafiltration “MEUF” is an established method for theeparation of small molecules like heavy metal ions or hazardousrganic compound from aqueous media [9,10]. Its feasibility forcombination with a catalytic process has been shown earlier,
ut without any optimization in the selection of the ultrafiltrationembrane. In this work sodium dodecylsulfate (SDS), Triton X-100
nd cethyltrimethylammoniumbromide (CTAB) were ultrafiltratedsing different membranes supplied by Nadir and Sartorious. Addi-ional information for the used surfactants is given in Table 1. Mostf the membranes are commercially available. The best combina-ions concerning the retention of the micelles and permeate fluxere searched for. In many studies of ultrafiltration of surfactant
olutions strong reduction of flux compared to pure water and aroad range of retention for the surfactant micelles are observed.
his strong variation in performance can depend on four phenom-na [11,12]: (i) presence of a diffuse polarization layer, (ii) formationf a dense solute layer with low permeability directly at the mem-rane surface, (iii) formation of a compressible filter cake and (iv)ore diameter reduction due to solute adsorption at the pore walls.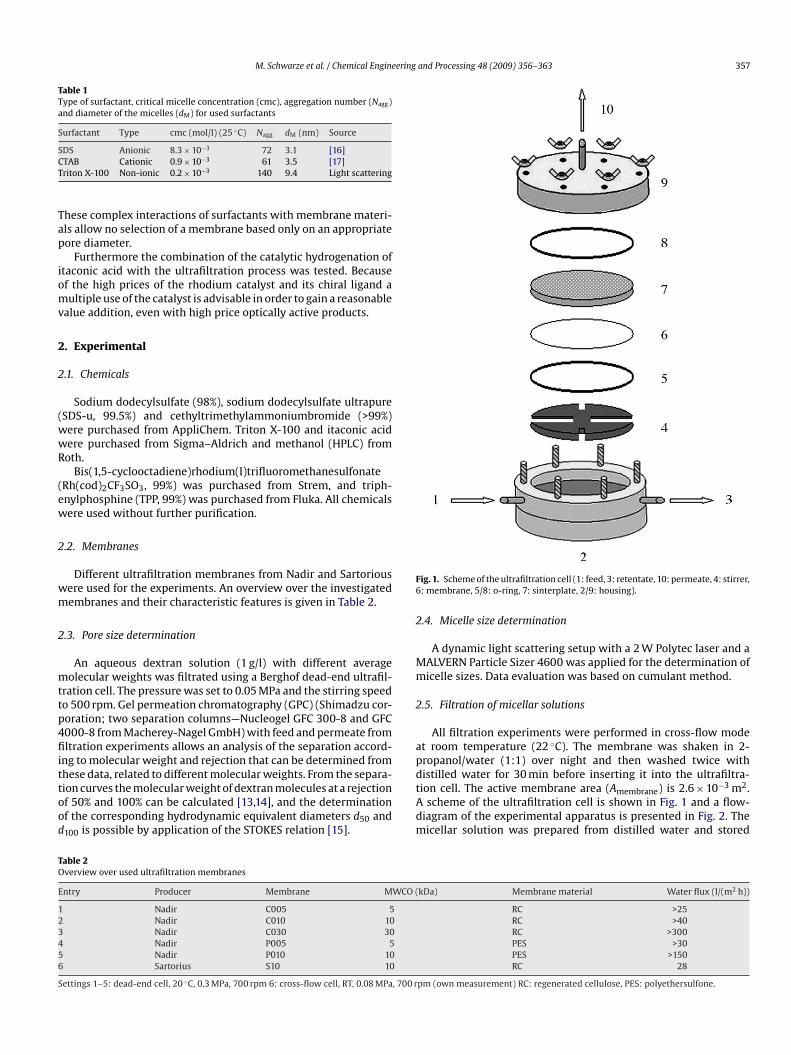
M. Schwarze et al. / Chemical Engineering and Processing 48 (2009) 356–363 357
Table 1Type of surfactant, critical micelle concentration (cmc), aggregation number (Nagg)and diameter of the micelles (dM) for used surfactants
Surfactant Type cmc (mol/l) (25 ◦C) Nagg dM (nm) Source
SCT
Tap
iomv
2
2
(wwR
(ew
2
wm
2
mttp4fiittood
F6
2
Mm
2
a
TO
E
123456
S
DS Anionic 8.3 × 10⁻³ 72 3.1 [16]TAB Cationic 0.9 × 10⁻³ 61 3.5 [17]riton X-100 Non-ionic 0.2 × 10⁻³ 140 9.4 Light scattering
hese complex interactions of surfactants with membrane materi-ls allow no selection of a membrane based only on an appropriateore diameter.
Furthermore the combination of the catalytic hydrogenation oftaconic acid with the ultrafiltration process was tested. Becausef the high prices of the rhodium catalyst and its chiral ligand aultiple use of the catalyst is advisable in order to gain a reasonable
alue addition, even with high price optically active products.
. Experimental
.1. Chemicals
Sodium dodecylsulfate (98%), sodium dodecylsulfate ultrapureSDS-u, 99.5%) and cethyltrimethylammoniumbromide (>99%)ere purchased from AppliChem. Triton X-100 and itaconic acidere purchased from Sigma–Aldrich and methanol (HPLC) fromoth.
Bis(1,5-cyclooctadiene)rhodium(I)trifluoromethanesulfonateRh(cod)2CF3SO3, 99%) was purchased from Strem, and triph-nylphosphine (TPP, 99%) was purchased from Fluka. All chemicalsere used without further purification.
.2. Membranes
Different ultrafiltration membranes from Nadir and Sartoriousere used for the experiments. An overview over the investigatedembranes and their characteristic features is given in Table 2.
.3. Pore size determination
An aqueous dextran solution (1 g/l) with different averageolecular weights was filtrated using a Berghof dead-end ultrafil-
ration cell. The pressure was set to 0.05 MPa and the stirring speedo 500 rpm. Gel permeation chromatography (GPC) (Shimadzu cor-oration; two separation columns—Nucleogel GFC 300-8 and GFC000-8 from Macherey-Nagel GmbH) with feed and permeate fromltration experiments allows an analysis of the separation accord-
ng to molecular weight and rejection that can be determined fromhese data, related to different molecular weights. From the separa-ion curves the molecular weight of dextran molecules at a rejectionf 50% and 100% can be calculated [13,14], and the determinationf the corresponding hydrodynamic equivalent diameters d50 and100 is possible by application of the STOKES relation [15].
pdtAdm
able 2verview over used ultrafiltration membranes
ntry Producer Membrane MWCO (
Nadir C005 5Nadir C010 10Nadir C030 30Nadir P005 5Nadir P010 10Sartorius S10 10
ettings 1–5: dead-end cell, 20 ◦C, 0.3 MPa, 700 rpm 6: cross-flow cell, RT, 0.08 MPa, 700 r
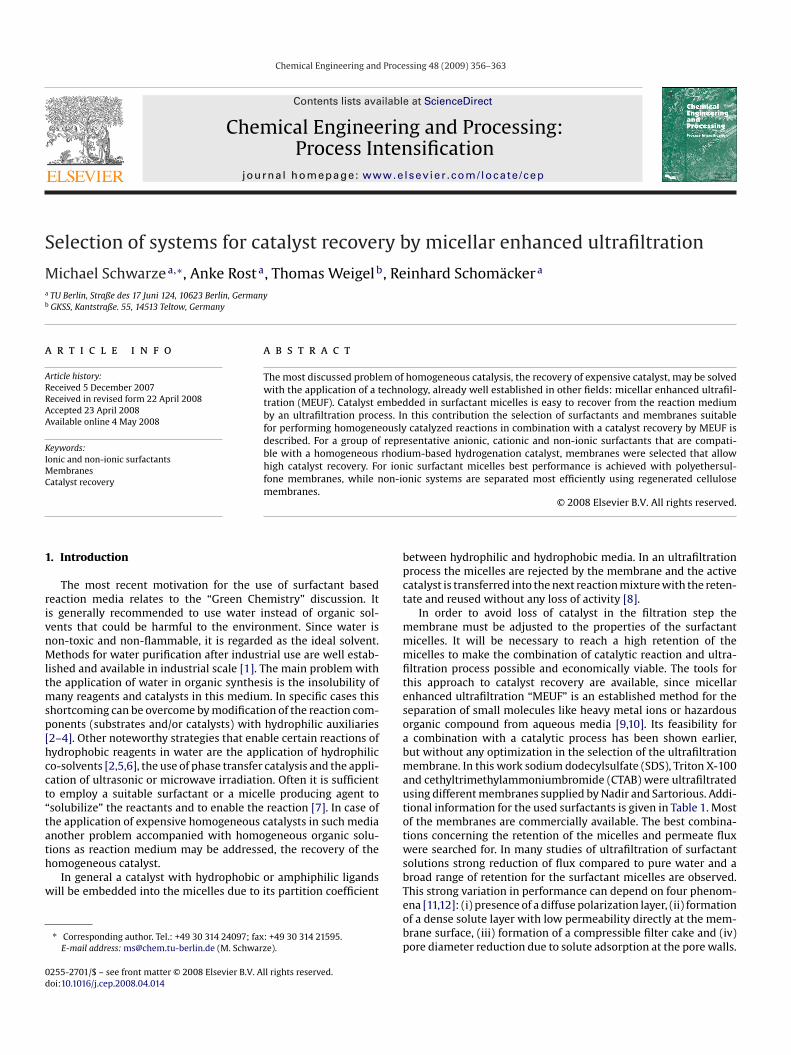
ig. 1. Scheme of the ultrafiltration cell (1: feed, 3: retentate, 10: permeate, 4: stirrer,: membrane, 5/8: o-ring, 7: sinterplate, 2/9: housing).
.4. Micelle size determination
A dynamic light scattering setup with a 2 W Polytec laser and aALVERN Particle Sizer 4600 was applied for the determination oficelle sizes. Data evaluation was based on cumulant method.
.5. Filtration of micellar solutions
All filtration experiments were performed in cross-flow modet room temperature (22 ◦C). The membrane was shaken in 2-ropanol/water (1:1) over night and then washed twice with
istilled water for 30 min before inserting it into the ultrafiltra-ion cell. The active membrane area (Amembrane) is 2.6 × 10⁻³ m2.scheme of the ultrafiltration cell is shown in Fig. 1 and a flow-iagram of the experimental apparatus is presented in Fig. 2. Theicellar solution was prepared from distilled water and stored
kDa) Membrane material Water flux (l/(m2 h))
RC >25RC >40RC >300PES >30PES >150RC 28
pm (own measurement) RC: regenerated cellulose, PES: polyethersulfone.
358 M. Schwarze et al. / Chemical Engineering and Processing 48 (2009) 356–363
F4p
iIusbbt4bttcmwtcX2mt
R
R
J
lpiTtr
2
rsthi4((t
Ffr
fiwtlttusthflpBtmstoupccfntccepttTT(
ig. 2. Flow-diagram for ultrafiltration experiments (1: reservoir, 2: pump, 3: stirrer,: ultrafiltration cell, 6: pressure regulation valve, 5: manometer, 8: retentate, 7:ermeate).
n a reservoir (1, numbers apply to Fig. 2). With a gear pump (2,SMATEC) the micellar solution (feed) was transported into theltrafiltration cell (4). The stirrer speed in the ultrafiltration cell waset to 700 rpm by a magnetic stirrer (3, IKA). Then the transmem-rane pressure drop (�p) displayed at the manometer (5) was sety a pressure regulation valve (6) and the permeate (7) and reten-ate (8) stream were recirculated to the reservoir for a duration of5 min. In this time steady state conditions at the membrane shoulde reached according to the chosen parameters. Then a sample ofhe feed with the concentration c0 was taken and a fraction of reten-ate with the concentration cR and permeate with the concentrationP were collected. The time (t) was measured for the collectedass (mP) of permeate. The concentration of the ionic surfactantsas determined by electric conductivity measurements. Calibra-
ions are performed at 25 ◦C (CTAB) and 30 ◦C (SDS) to convert theonductivity into the concentration. The concentration of Triton-100 was measured after calibration by UV–vis-spectroscopy at75 nm. For all experiments the retention of surfactant (RS) andicelles (RM) and also the permeate flux (JP) were calculated using
he following equations:
S (%) =(
1 − cP
cR
)× 100 (1)
M (%) =(
1 − cP − cmccR
)× 100 (2)
P
(kg
m2h
)= mP
Amembranet(3)
In ultrafiltration experiments with rhodium catalysts solubi-ized in the micellar solutions the following feed solution wasrepared: 20 mg Rh(cod)2CF3SO3 and 22.4 mg TPP were dissolved
n 10 ml methanol and added to 2 g Triton X-100 in 190 ml water.he concentration of rhodium was measured by atomic absorp-ion spectroscopy (AAS) at 343 nm. A calibration was done with ahodium standard solution in the range of 1–10 ppm.
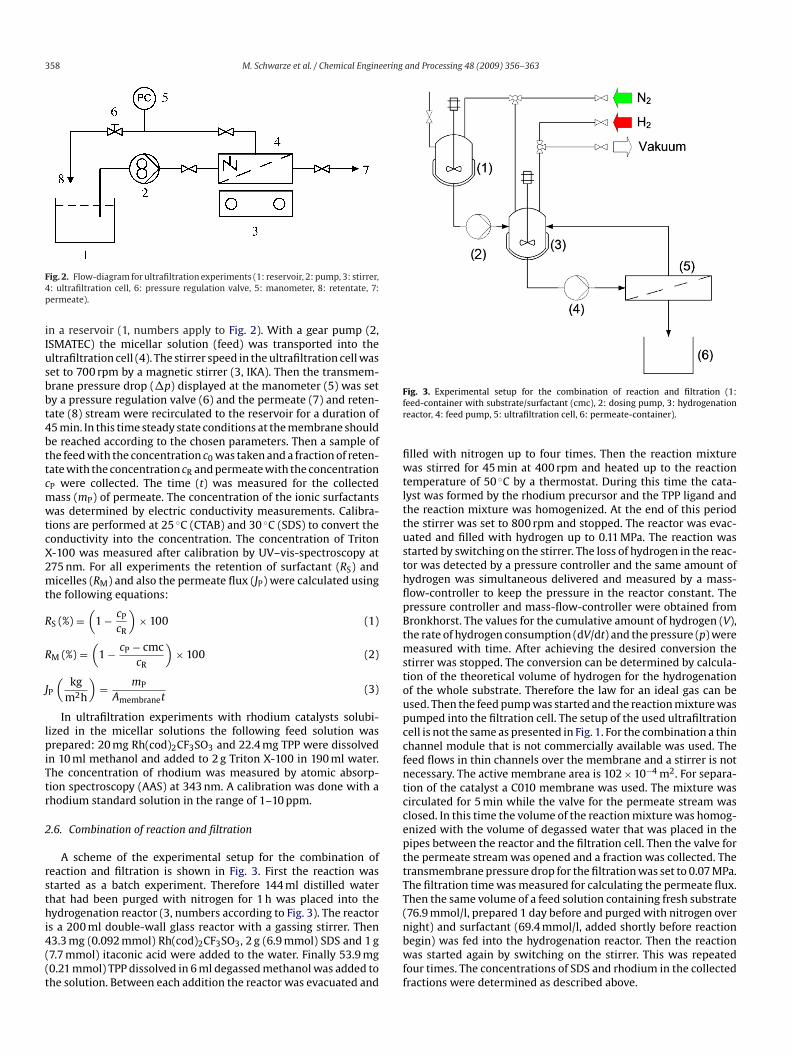
.6. Combination of reaction and filtration
A scheme of the experimental setup for the combination ofeaction and filtration is shown in Fig. 3. First the reaction wastarted as a batch experiment. Therefore 144 ml distilled waterhat had been purged with nitrogen for 1 h was placed into theydrogenation reactor (3, numbers according to Fig. 3). The reactor
s a 200 ml double-wall glass reactor with a gassing stirrer. Then3.3 mg (0.092 mmol) Rh(cod)2CF3SO3, 2 g (6.9 mmol) SDS and 1 g7.7 mmol) itaconic acid were added to the water. Finally 53.9 mg0.21 mmol) TPP dissolved in 6 ml degassed methanol was added tohe solution. Between each addition the reactor was evacuated and
nbwff
ig. 3. Experimental setup for the combination of reaction and filtration (1:eed-container with substrate/surfactant (cmc), 2: dosing pump, 3: hydrogenationeactor, 4: feed pump, 5: ultrafiltration cell, 6: permeate-container).
lled with nitrogen up to four times. Then the reaction mixtureas stirred for 45 min at 400 rpm and heated up to the reaction
emperature of 50 ◦C by a thermostat. During this time the cata-yst was formed by the rhodium precursor and the TPP ligand andhe reaction mixture was homogenized. At the end of this periodhe stirrer was set to 800 rpm and stopped. The reactor was evac-ated and filled with hydrogen up to 0.11 MPa. The reaction wastarted by switching on the stirrer. The loss of hydrogen in the reac-or was detected by a pressure controller and the same amount ofydrogen was simultaneous delivered and measured by a mass-ow-controller to keep the pressure in the reactor constant. Theressure controller and mass-flow-controller were obtained fromronkhorst. The values for the cumulative amount of hydrogen (V),he rate of hydrogen consumption (dV/dt) and the pressure (p) were
easured with time. After achieving the desired conversion thetirrer was stopped. The conversion can be determined by calcula-ion of the theoretical volume of hydrogen for the hydrogenationf the whole substrate. Therefore the law for an ideal gas can besed. Then the feed pump was started and the reaction mixture wasumped into the filtration cell. The setup of the used ultrafiltrationell is not the same as presented in Fig. 1. For the combination a thinhannel module that is not commercially available was used. Theeed flows in thin channels over the membrane and a stirrer is notecessary. The active membrane area is 102 × 10−4 m2. For separa-ion of the catalyst a C010 membrane was used. The mixture wasirculated for 5 min while the valve for the permeate stream waslosed. In this time the volume of the reaction mixture was homog-nized with the volume of degassed water that was placed in theipes between the reactor and the filtration cell. Then the valve forhe permeate stream was opened and a fraction was collected. Theransmembrane pressure drop for the filtration was set to 0.07 MPa.he filtration time was measured for calculating the permeate flux.hen the same volume of a feed solution containing fresh substrate76.9 mmol/l, prepared 1 day before and purged with nitrogen over
ight) and surfactant (69.4 mmol/l, added shortly before reactionegin) was fed into the hydrogenation reactor. Then the reactionas started again by switching on the stirrer. This was repeatedour times. The concentrations of SDS and rhodium in the collectedractions were determined as described above.
M. Schwarze et al. / Chemical Engineering
Table 3Mean pore diameter of used ultrafiltration membranes
Entry Membrane d50 (nm)
1 C005 2.92 C010 3.53 C030 6.3456
3
3
smfuaTtddsptbbbmmietdh
3
fit
ttdioiotm
3
3
iccwsolutions in the range of 0–3 g/l were filtrated using the follow-ing membranes: P005, P010, C005 and C010. The results for thepermeate flux and surfactant retention are shown in Fig. 5.
It is expected that higher surfactant concentrations (>cmc) leadto lower fluxes because of an additional resistance, e.g. by a growing
P005 3.0P010 4.2S10 2.3
. Results and discussion
.1. Membrane characterisation
The selection of membrane for the ultrafiltration of surfactantolutions cannot simply be based on a discussion of pore andicelle size. The adsorption of surfactants at the solid liquid inter-
ace [18,19] will have a major impact on the performance of theltrafiltration process, since the formation of an adsorbate layer willlter the polarity of the surface and the size of the membrane pores.hermal and mechanistic stability of micelles and membranes haveo be considered by choosing appropriate operation conditions andetailed structural information about the membrane is needed toiscuss separation results. Most of the information like range ofuitable temperature, pH or membrane material is given by theroducer in a data sheet. For a separation process it is importanto know the average diameter of the pores and the pore size distri-ution. For ultrafiltration membranes the average pore size shoulde between 1 nm and 100 nm. The pore sizes of the studied mem-ranes were not given by the manufacturer and were thereforeeasured with dextran solutions that were analyzed by gel per-eation chromatography. The mean pore diameters (d50) are given
n Table 3. For all membranes the mean pore diameter is in thexpected range of ultrafiltration membranes. The pore size dis-ribution is shown in Fig. 4. For a sharp separation the pore sizeistribution should be narrow. In this case only the C030 membraneas a very large pore size distribution.
.2. Micelle size
The most simple model for the retention of micelles at ultra-ltration membranes is a size-exclusion model. This means thathe diameter of the micelles has to be larger than the diameter of
Fig. 4. Pore size distribution of the used ultrafiltration membranes.Fs
and Processing 48 (2009) 356–363 359
he membrane pores. To determine the micelle diameter we usedhe dynamic light scattering method. In case of Triton X-100 theiameter could be measured but for SDS and CTAB the available
nstrument was not suitable. Therefore we used literature data forur discussion. The compilation of the micelle diameter is givenn Table 1. All values for the micelle diameters are in the samerder as the pore sizes of the membranes. This means the ultrafiltra-ion of the discussed surfactants should be possible by choosing a
embrane with suitable pore size, especially pore size distribution.
.3. Filtration of micellar solutions
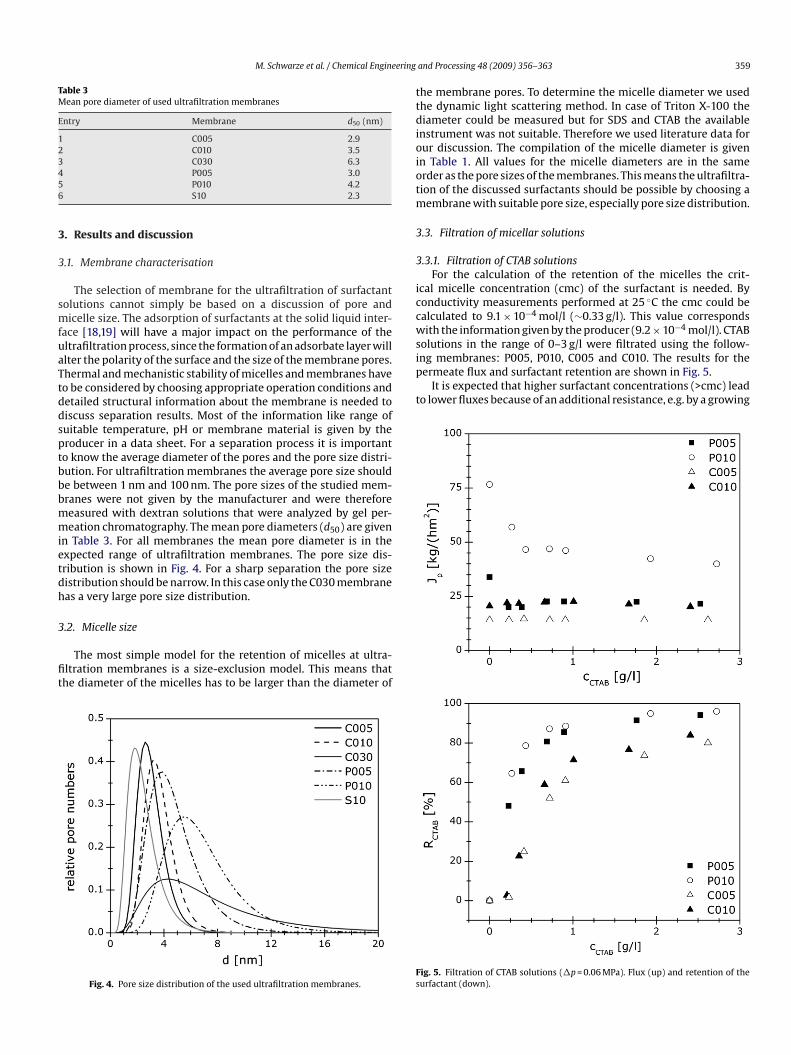
.3.1. Filtration of CTAB solutionsFor the calculation of the retention of the micelles the crit-
cal micelle concentration (cmc) of the surfactant is needed. Byonductivity measurements performed at 25 ◦C the cmc could bealculated to 9.1 × 10⁻⁴ mol/l (∼0.33 g/l). This value correspondsith the information given by the producer (9.2 × 10⁻⁴ mol/l). CTAB
ig. 5. Filtration of CTAB solutions (�p = 0.06 MPa). Flux (up) and retention of theurfactant (down).
3 ering and Processing 48 (2009) 356–363
gislommflatvnsoimt1imocoI5mfrc9deobsatTw
3
oflcdrftuti0siarmiiga5mb
Ft
3
fiStrctatcriativc
60 M. Schwarze et al. / Chemical Engine
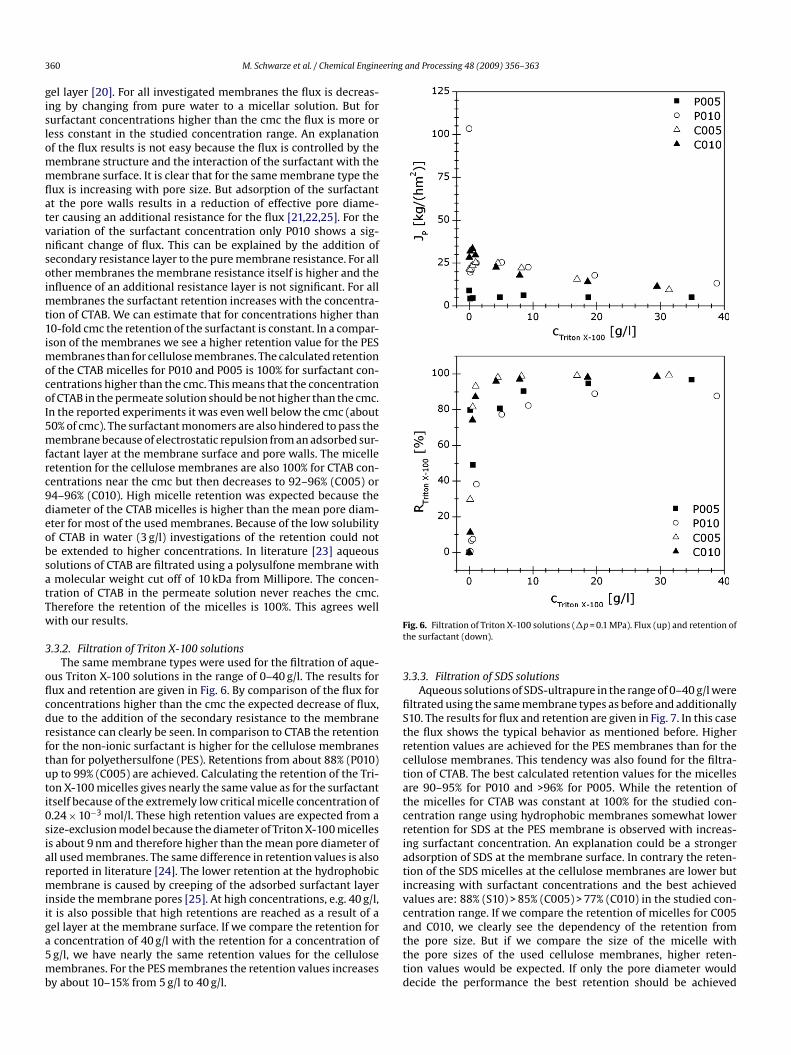
el layer [20]. For all investigated membranes the flux is decreas-ng by changing from pure water to a micellar solution. But forurfactant concentrations higher than the cmc the flux is more oress constant in the studied concentration range. An explanationf the flux results is not easy because the flux is controlled by theembrane structure and the interaction of the surfactant with theembrane surface. It is clear that for the same membrane type the
ux is increasing with pore size. But adsorption of the surfactantt the pore walls results in a reduction of effective pore diame-er causing an additional resistance for the flux [21,22,25]. For theariation of the surfactant concentration only P010 shows a sig-ificant change of flux. This can be explained by the addition ofecondary resistance layer to the pure membrane resistance. For allther membranes the membrane resistance itself is higher and thenfluence of an additional resistance layer is not significant. For all
embranes the surfactant retention increases with the concentra-ion of CTAB. We can estimate that for concentrations higher than0-fold cmc the retention of the surfactant is constant. In a compar-son of the membranes we see a higher retention value for the PES
embranes than for cellulose membranes. The calculated retentionf the CTAB micelles for P010 and P005 is 100% for surfactant con-entrations higher than the cmc. This means that the concentrationf CTAB in the permeate solution should be not higher than the cmc.n the reported experiments it was even well below the cmc (about0% of cmc). The surfactant monomers are also hindered to pass theembrane because of electrostatic repulsion from an adsorbed sur-
actant layer at the membrane surface and pore walls. The micelleetention for the cellulose membranes are also 100% for CTAB con-entrations near the cmc but then decreases to 92–96% (C005) or4–96% (C010). High micelle retention was expected because theiameter of the CTAB micelles is higher than the mean pore diam-ter for most of the used membranes. Because of the low solubilityf CTAB in water (3 g/l) investigations of the retention could note extended to higher concentrations. In literature [23] aqueousolutions of CTAB are filtrated using a polysulfone membrane withmolecular weight cut off of 10 kDa from Millipore. The concen-
ration of CTAB in the permeate solution never reaches the cmc.herefore the retention of the micelles is 100%. This agrees wellith our results.
.3.2. Filtration of Triton X-100 solutionsThe same membrane types were used for the filtration of aque-
us Triton X-100 solutions in the range of 0–40 g/l. The results forux and retention are given in Fig. 6. By comparison of the flux foroncentrations higher than the cmc the expected decrease of flux,ue to the addition of the secondary resistance to the membraneesistance can clearly be seen. In comparison to CTAB the retentionor the non-ionic surfactant is higher for the cellulose membraneshan for polyethersulfone (PES). Retentions from about 88% (P010)p to 99% (C005) are achieved. Calculating the retention of the Tri-on X-100 micelles gives nearly the same value as for the surfactanttself because of the extremely low critical micelle concentration of.24 × 10−3 mol/l. These high retention values are expected from aize-exclusion model because the diameter of Triton X-100 micelless about 9 nm and therefore higher than the mean pore diameter ofll used membranes. The same difference in retention values is alsoeported in literature [24]. The lower retention at the hydrophobicembrane is caused by creeping of the adsorbed surfactant layer
nside the membrane pores [25]. At high concentrations, e.g. 40 g/l,t is also possible that high retentions are reached as a result of a
el layer at the membrane surface. If we compare the retention forconcentration of 40 g/l with the retention for a concentration ofg/l, we have nearly the same retention values for the celluloseembranes. For the PES membranes the retention values increasesy about 10–15% from 5 g/l to 40 g/l.
atttd
ig. 6. Filtration of Triton X-100 solutions (�p = 0.1 MPa). Flux (up) and retention ofhe surfactant (down).
.3.3. Filtration of SDS solutionsAqueous solutions of SDS-ultrapure in the range of 0–40 g/l were
ltrated using the same membrane types as before and additionally10. The results for flux and retention are given in Fig. 7. In this casehe flux shows the typical behavior as mentioned before. Higheretention values are achieved for the PES membranes than for theellulose membranes. This tendency was also found for the filtra-ion of CTAB. The best calculated retention values for the micellesre 90–95% for P010 and >96% for P005. While the retention ofhe micelles for CTAB was constant at 100% for the studied con-entration range using hydrophobic membranes somewhat loweretention for SDS at the PES membrane is observed with increas-ng surfactant concentration. An explanation could be a strongerdsorption of SDS at the membrane surface. In contrary the reten-ion of the SDS micelles at the cellulose membranes are lower butncreasing with surfactant concentrations and the best achievedalues are: 88% (S10) > 85% (C005) > 77% (C010) in the studied con-entration range. If we compare the retention of micelles for C005nd C010, we clearly see the dependency of the retention from
he pore size. But if we compare the size of the micelle withhe pore sizes of the used cellulose membranes, higher reten-ion values would be expected. If only the pore diameter wouldecide the performance the best retention should be achieved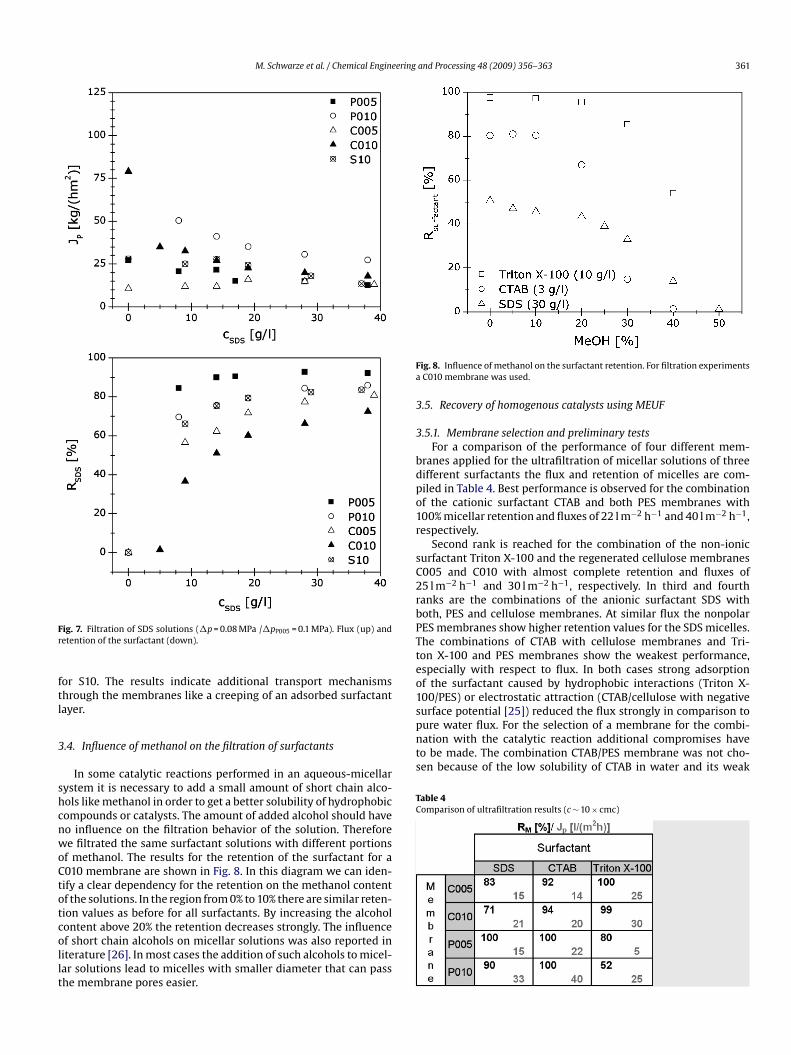
M. Schwarze et al. / Chemical Engineering and Processing 48 (2009) 356–363 361
Fr
ftl
3
shcnwoCtotcollt
Fa
3
3
bdpo1r
sC2rbPTteo1surface potential [25]) reduced the flux strongly in comparison topure water flux. For the selection of a membrane for the combi-nation with the catalytic reaction additional compromises haveto be made. The combination CTAB/PES membrane was not cho-sen because of the low solubility of CTAB in water and its weak
Table 4Comparison of ultrafiltration results (c ∼ 10 × cmc)
ig. 7. Filtration of SDS solutions (�p = 0.08 MPa /�pP005 = 0.1 MPa). Flux (up) andetention of the surfactant (down).
or S10. The results indicate additional transport mechanismshrough the membranes like a creeping of an adsorbed surfactantayer.
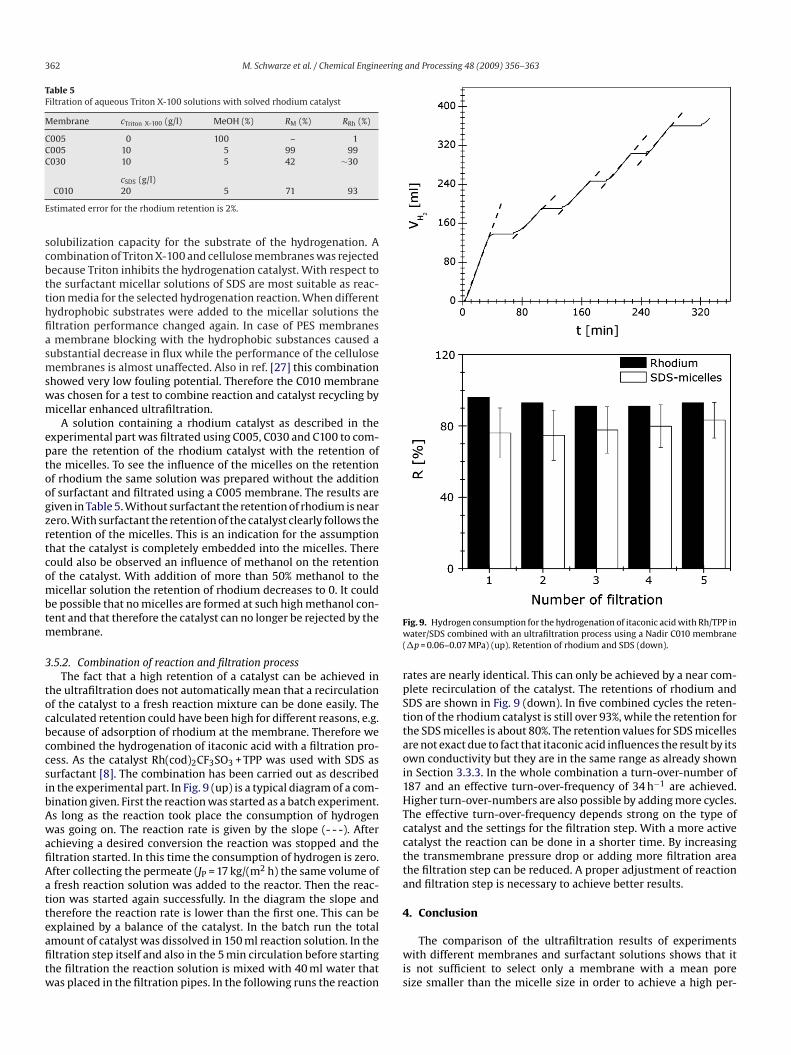
.4. Influence of methanol on the filtration of surfactants
In some catalytic reactions performed in an aqueous-micellarystem it is necessary to add a small amount of short chain alco-ols like methanol in order to get a better solubility of hydrophobicompounds or catalysts. The amount of added alcohol should haveo influence on the filtration behavior of the solution. Thereforee filtrated the same surfactant solutions with different portions
f methanol. The results for the retention of the surfactant for a010 membrane are shown in Fig. 8. In this diagram we can iden-ify a clear dependency for the retention on the methanol contentf the solutions. In the region from 0% to 10% there are similar reten-
ion values as before for all surfactants. By increasing the alcoholontent above 20% the retention decreases strongly. The influencef short chain alcohols on micellar solutions was also reported initerature [26]. In most cases the addition of such alcohols to micel-ar solutions lead to micelles with smaller diameter that can passhe membrane pores easier.ig. 8. Influence of methanol on the surfactant retention. For filtration experimentsC010 membrane was used.
.5. Recovery of homogenous catalysts using MEUF
.5.1. Membrane selection and preliminary testsFor a comparison of the performance of four different mem-
ranes applied for the ultrafiltration of micellar solutions of threeifferent surfactants the flux and retention of micelles are com-iled in Table 4. Best performance is observed for the combinationf the cationic surfactant CTAB and both PES membranes with00% micellar retention and fluxes of 22 l m−2 h−1 and 40 l m−2 h−1,espectively.
Second rank is reached for the combination of the non-ionicurfactant Triton X-100 and the regenerated cellulose membranes005 and C010 with almost complete retention and fluxes of5 l m−2 h−1 and 30 l m−2 h−1, respectively. In third and fourthanks are the combinations of the anionic surfactant SDS withoth, PES and cellulose membranes. At similar flux the nonpolarES membranes show higher retention values for the SDS micelles.he combinations of CTAB with cellulose membranes and Tri-on X-100 and PES membranes show the weakest performance,specially with respect to flux. In both cases strong adsorptionf the surfactant caused by hydrophobic interactions (Triton X-00/PES) or electrostatic attraction (CTAB/cellulose with negative
362 M. Schwarze et al. / Chemical Engineering and Processing 48 (2009) 356–363
Table 5Filtration of aqueous Triton X-100 solutions with solved rhodium catalyst
Membrane cTriton X-100 (g/l) MeOH (%) RM (%) RRh (%)
C005 0 100 – 1C005 10 5 99 99C030 10 5 42 ∼30
E
scbtthfiasmswm
eptoogzrtcombtm
3
tocbccsibAwafiAatteafitw
Fw(
rpSttaoi1HTcctta
4
cSDS (g/l)C010 20 5 71 93
stimated error for the rhodium retention is 2%.
olubilization capacity for the substrate of the hydrogenation. Aombination of Triton X-100 and cellulose membranes was rejectedecause Triton inhibits the hydrogenation catalyst. With respect tohe surfactant micellar solutions of SDS are most suitable as reac-ion media for the selected hydrogenation reaction. When differentydrophobic substrates were added to the micellar solutions theltration performance changed again. In case of PES membranesmembrane blocking with the hydrophobic substances caused a
ubstantial decrease in flux while the performance of the celluloseembranes is almost unaffected. Also in ref. [27] this combination
howed very low fouling potential. Therefore the C010 membraneas chosen for a test to combine reaction and catalyst recycling byicellar enhanced ultrafiltration.A solution containing a rhodium catalyst as described in the
xperimental part was filtrated using C005, C030 and C100 to com-are the retention of the rhodium catalyst with the retention ofhe micelles. To see the influence of the micelles on the retentionf rhodium the same solution was prepared without the additionf surfactant and filtrated using a C005 membrane. The results areiven in Table 5. Without surfactant the retention of rhodium is nearero. With surfactant the retention of the catalyst clearly follows theetention of the micelles. This is an indication for the assumptionhat the catalyst is completely embedded into the micelles. Thereould also be observed an influence of methanol on the retentionf the catalyst. With addition of more than 50% methanol to theicellar solution the retention of rhodium decreases to 0. It could
e possible that no micelles are formed at such high methanol con-ent and that therefore the catalyst can no longer be rejected by the
embrane.
.5.2. Combination of reaction and filtration processThe fact that a high retention of a catalyst can be achieved in
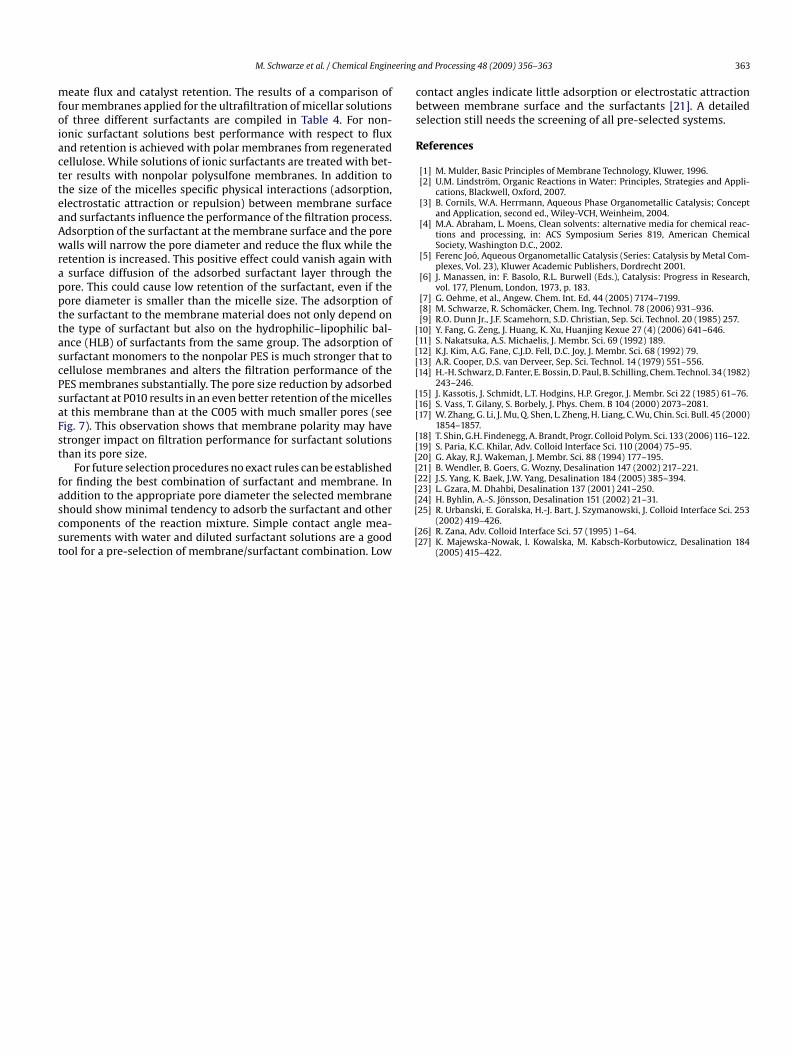
he ultrafiltration does not automatically mean that a recirculationf the catalyst to a fresh reaction mixture can be done easily. Thealculated retention could have been high for different reasons, e.g.ecause of adsorption of rhodium at the membrane. Therefore weombined the hydrogenation of itaconic acid with a filtration pro-ess. As the catalyst Rh(cod)2CF3SO3 + TPP was used with SDS asurfactant [8]. The combination has been carried out as describedn the experimental part. In Fig. 9 (up) is a typical diagram of a com-ination given. First the reaction was started as a batch experiment.s long as the reaction took place the consumption of hydrogenas going on. The reaction rate is given by the slope (- - -). After
chieving a desired conversion the reaction was stopped and theltration started. In this time the consumption of hydrogen is zero.fter collecting the permeate (JP = 17 kg/(m2 h) the same volume offresh reaction solution was added to the reactor. Then the reac-
ion was started again successfully. In the diagram the slope andherefore the reaction rate is lower than the first one. This can be
xplained by a balance of the catalyst. In the batch run the totalmount of catalyst was dissolved in 150 ml reaction solution. In theltration step itself and also in the 5 min circulation before startinghe filtration the reaction solution is mixed with 40 ml water thatas placed in the filtration pipes. In the following runs the reactionwis
ig. 9. Hydrogen consumption for the hydrogenation of itaconic acid with Rh/TPP inater/SDS combined with an ultrafiltration process using a Nadir C010 membrane
�p = 0.06–0.07 MPa) (up). Retention of rhodium and SDS (down).
ates are nearly identical. This can only be achieved by a near com-lete recirculation of the catalyst. The retentions of rhodium andDS are shown in Fig. 9 (down). In five combined cycles the reten-ion of the rhodium catalyst is still over 93%, while the retention forhe SDS micelles is about 80%. The retention values for SDS micellesre not exact due to fact that itaconic acid influences the result by itswn conductivity but they are in the same range as already shownn Section 3.3.3. In the whole combination a turn-over-number of87 and an effective turn-over-frequency of 34 h−1 are achieved.igher turn-over-numbers are also possible by adding more cycles.he effective turn-over-frequency depends strong on the type ofatalyst and the settings for the filtration step. With a more activeatalyst the reaction can be done in a shorter time. By increasinghe transmembrane pressure drop or adding more filtration areahe filtration step can be reduced. A proper adjustment of reactionnd filtration step is necessary to achieve better results.
. Conclusion
The comparison of the ultrafiltration results of experimentsith different membranes and surfactant solutions shows that it
s not sufficient to select only a membrane with a mean poreize smaller than the micelle size in order to achieve a high per-
ering
mfoiactteaAwrappttascPsaFst
fascst
cbs
R
[[[[[
[[[
[[[[[[
M. Schwarze et al. / Chemical Engine
eate flux and catalyst retention. The results of a comparison ofour membranes applied for the ultrafiltration of micellar solutionsf three different surfactants are compiled in Table 4. For non-onic surfactant solutions best performance with respect to fluxnd retention is achieved with polar membranes from regeneratedellulose. While solutions of ionic surfactants are treated with bet-er results with nonpolar polysulfone membranes. In addition tohe size of the micelles specific physical interactions (adsorption,lectrostatic attraction or repulsion) between membrane surfacend surfactants influence the performance of the filtration process.dsorption of the surfactant at the membrane surface and the porealls will narrow the pore diameter and reduce the flux while the
etention is increased. This positive effect could vanish again withsurface diffusion of the adsorbed surfactant layer through the
ore. This could cause low retention of the surfactant, even if theore diameter is smaller than the micelle size. The adsorption ofhe surfactant to the membrane material does not only depend onhe type of surfactant but also on the hydrophilic–lipophilic bal-nce (HLB) of surfactants from the same group. The adsorption ofurfactant monomers to the nonpolar PES is much stronger that toellulose membranes and alters the filtration performance of theES membranes substantially. The pore size reduction by adsorbedurfactant at P010 results in an even better retention of the micellest this membrane than at the C005 with much smaller pores (seeig. 7). This observation shows that membrane polarity may havetronger impact on filtration performance for surfactant solutionshan its pore size.
For future selection procedures no exact rules can be establishedor finding the best combination of surfactant and membrane. In
ddition to the appropriate pore diameter the selected membranehould show minimal tendency to adsorb the surfactant and otheromponents of the reaction mixture. Simple contact angle mea-urements with water and diluted surfactant solutions are a goodool for a pre-selection of membrane/surfactant combination. Low[[
[[
and Processing 48 (2009) 356–363 363
ontact angles indicate little adsorption or electrostatic attractionetween membrane surface and the surfactants [21]. A detailedelection still needs the screening of all pre-selected systems.
eferences
[1] M. Mulder, Basic Principles of Membrane Technology, Kluwer, 1996.[2] U.M. Lindstrom, Organic Reactions in Water: Principles, Strategies and Appli-
cations, Blackwell, Oxford, 2007.[3] B. Cornils, W.A. Herrmann, Aqueous Phase Organometallic Catalysis; Concept
and Application, second ed., Wiley-VCH, Weinheim, 2004.[4] M.A. Abraham, L. Moens, Clean solvents: alternative media for chemical reac-
tions and processing, in: ACS Symposium Series 819, American ChemicalSociety, Washington D.C., 2002.
[5] Ferenc Joo, Aqueous Organometallic Catalysis (Series: Catalysis by Metal Com-plexes, Vol. 23), Kluwer Academic Publishers, Dordrecht 2001.
[6] J. Manassen, in: F. Basolo, R.L. Burwell (Eds.), Catalysis: Progress in Research,vol. 177, Plenum, London, 1973, p. 183.
[7] G. Oehme, et al., Angew. Chem. Int. Ed. 44 (2005) 7174–7199.[8] M. Schwarze, R. Schomacker, Chem. Ing. Technol. 78 (2006) 931–936.[9] R.O. Dunn Jr., J.F. Scamehorn, S.D. Christian, Sep. Sci. Technol. 20 (1985) 257.10] Y. Fang, G. Zeng, J. Huang, K. Xu, Huanjing Kexue 27 (4) (2006) 641–646.11] S. Nakatsuka, A.S. Michaelis, J. Membr. Sci. 69 (1992) 189.12] K.J. Kim, A.G. Fane, C.J.D. Fell, D.C. Joy, J. Membr. Sci. 68 (1992) 79.13] A.R. Cooper, D.S. van Derveer, Sep. Sci. Technol. 14 (1979) 551–556.14] H.-H. Schwarz, D. Fanter, E. Bossin, D. Paul, B. Schilling, Chem. Technol. 34 (1982)
243–246.15] J. Kassotis, J. Schmidt, L.T. Hodgins, H.P. Gregor, J. Membr. Sci 22 (1985) 61–76.16] S. Vass, T. Gilany, S. Borbely, J. Phys. Chem. B 104 (2000) 2073–2081.17] W. Zhang, G. Li, J. Mu, Q. Shen, L. Zheng, H. Liang, C. Wu, Chin. Sci. Bull. 45 (2000)
1854–1857.18] T. Shin, G.H. Findenegg, A. Brandt, Progr. Colloid Polym. Sci. 133 (2006) 116–122.19] S. Paria, K.C. Khilar, Adv. Colloid Interface Sci. 110 (2004) 75–95.20] G. Akay, R.J. Wakeman, J. Membr. Sci. 88 (1994) 177–195.21] B. Wendler, B. Goers, G. Wozny, Desalination 147 (2002) 217–221.22] J.S. Yang, K. Baek, J.W. Yang, Desalination 184 (2005) 385–394.23] L. Gzara, M. Dhahbi, Desalination 137 (2001) 241–250.
24] H. Byhlin, A.-S. Jonsson, Desalination 151 (2002) 21–31.25] R. Urbanski, E. Goralska, H.-J. Bart, J. Szymanowski, J. Colloid Interface Sci. 253(2002) 419–426.26] R. Zana, Adv. Colloid Interface Sci. 57 (1995) 1–64.27] K. Majewska-Nowak, I. Kowalska, M. Kabsch-Korbutowicz, Desalination 184
(2005) 415–422.