Embed Size (px)
Citation preview

SELECTION OF GEOGRAPHIC INFORMATION SYSTEM (GIs)
SOFTWARE FOR THE MAPPING OF LIVING PLANT COLLECTIONS
BY
Shelley Elizabeth Dawson
A thesis submitted to the Faculty of the University of Delaware in partial fulfillment of the requirements for the degree of Master of Science in Public Horticulture
Spring 2005
Copyright 2005 Shelley E. Dawson All Rights Reserved
ACKNOWLEDGMENTS
Many thanks to my committee members: Ms. Ann Cook, Dr. Tracy
DeLiberty, Dr. John Frett and Dr. James Swasey for giving so generously of their time
and advice. A very special thank you to Ms. Gerry Zuka for her patience, humor and
various skills and talents that assist Longwood Fellows down the track.
My gratitude and thanks to Mr. Fred Roberts, the Director of Longwood
Gardens, The Longwood Foundation Incorporated and the Longwood Graduate
Program in Public Horticulture for the graduate fellowship that helped make the
preparation and publication of this thesis research possible. The process has watered
my growth both personally and professionally as a Longwood Graduate Fellow.
Finally, I would like to thank the selection committee that saw a sparkle in my eye and
decided that I was worth their investment. Thank you for this opportunity.
This is dedicated my parents, family, friends, and to John, who believed in
me and pulled me through to the other side.
iii
TABLE OF CONTENTS
LIST OF TABLES ......................................................................................................... vi
LIST OF FIGURES ...................................................................................................... vi1
ABSTRACT ................................................................................................................ viii
.. ...
Chapter
1 INTRODUCTION .............................................................................................. 9
2 HISTORY OF GIs AND GARDEN MAPPING ............................................. 13
2.1 History of GIs ............................................................................................. 13
2.3 Garden Mapping ......................................................................................... 23
2.2 Mapping Features in a GIS ......................................................................... 16
2.4 Current Popular Database Software ........................................................... 25
2.5 Current Popular Mapping Software ............................................................ 28
2.6 Associated Costs ......................................................................................... 32
3 SURVEY I ........................................................................................................ 34
3.1 Methods ...................................................................................................... 34
3.2 Results ........................................................................................................ 35
3.3 Conclusions ................................................................................................ 48
iv
. . . 1 I . . 1 ' . . ,q,.,
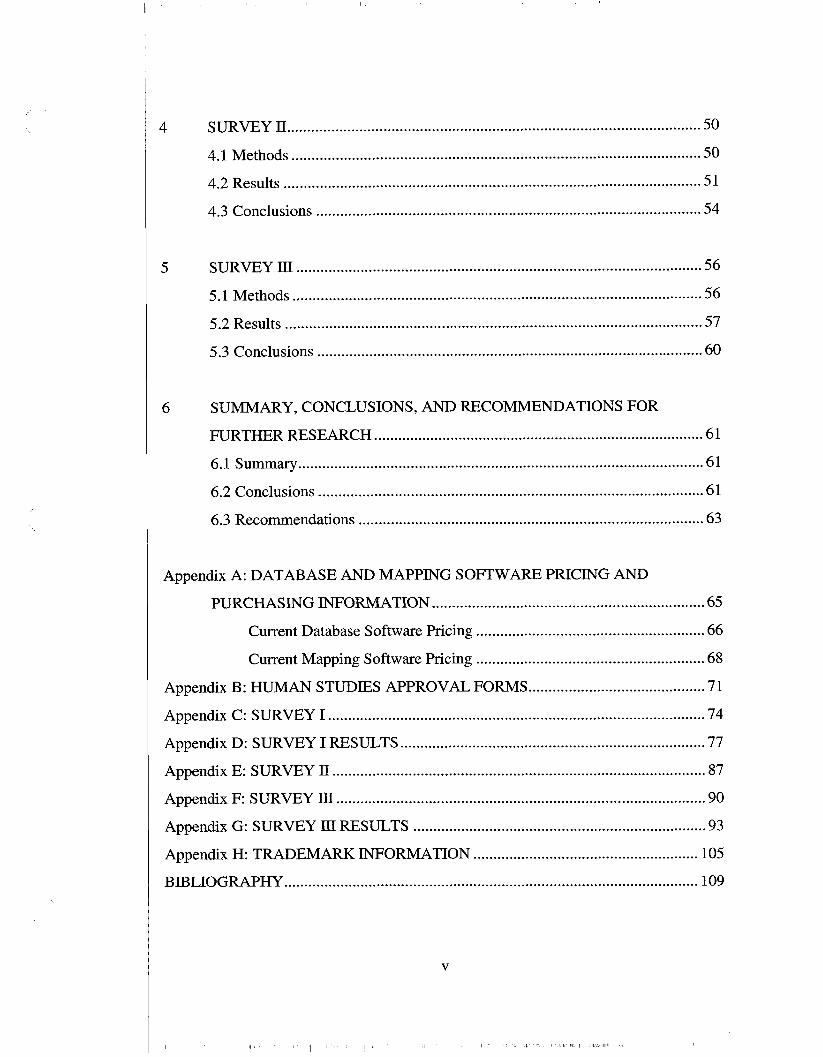
4 SURVEY II ....................................................................................................... 50
4.1 Methods ...................................................................................................... 50 4.2 Results ........................................................................................................ 51
4.3 Conclusions ................................................................................................ 54
5 SURVEY III ..................................................................................................... 56
5.1 Methods ...................................................................................................... 56
5.2 Results ........................................................................................................ 57
5.3 Conclusions ................................................................................................ 60
6 SUMMARY. CONCLUSIONS. AND RECOMMENDATIONS FOR
FURTHER RESEARCH .................................................................................. 61
6.1 Summary ..................................................................................................... 61
6.2 Conclusions ................................................................................................ 61
6.3 Recommendations ...................................................................................... 63
Appendix A: DATABASE AND MAPPING SOFTWARE PRICING AND
PURCHASING INFORMATION .................................................................... 65
Current Database Software Pricing ......................................................... 66
Current Mapping Software Pricing ......................................................... 68
Appendix B: HUMAN STUDIES APPROVAL FORMS ............................................ 71
Appendix C: SURVEY I .............................................................................................. 74
Appendix D: SURVEY I RESULTS ............................................................................ 77
Appendix E: SURVEY II ............................................................................................. 87
Appendix F: SURVEY III ............................................................................................ 90
Appendix G: SURVEY III RESULTS ......................................................................... 93
Appendix H: TRADEMARK INFORMATION ........................................................ 105
BIBLIOGRAPHY ....................................................................................................... 109
V
. . . . 11 . . I I . . . ”/ .. iUli . . . . . . . . . .

LIST OF TABLES
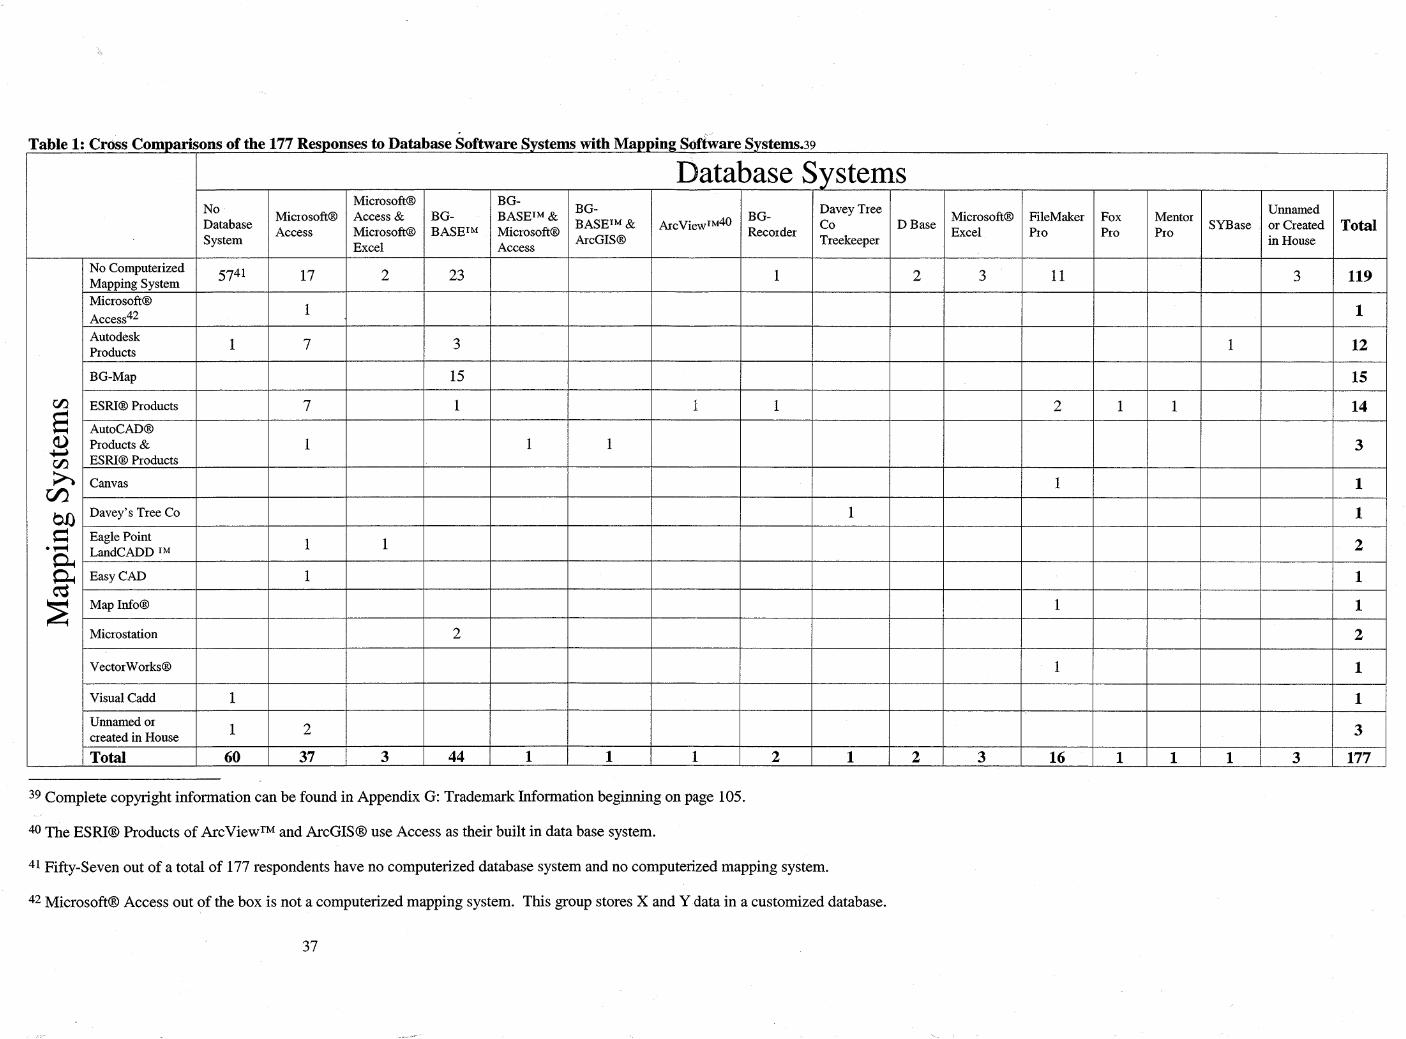
Table 1: Cross Comparisons of the 177 Responses to Database Software Systems with
Mapping Software Systems. ................................................................. 37
Table 2: Top Three Software Packages Scored According to their Capabilities of
Performing Twenty Tasks that the Users found Important in their
Computerized Mapping Software ......................................................... 59
vi
LIST OF FIGURES
Figure 1: Summary of the 177 Survey I Respondents about Database and Mapping
Systems Combinations. ....................................................................... .43
Figure 2: Survey I Response as to the Ease of Learning the Software of the 41
Institutions with an AutoCADO, BG-Map or ESRIB Software System
.............................................................................................................. 44
vii

ABSTRACT
Botanical gardens, as stewards of living plant collections, are given the
duty of managing the data concerning their collection. These data are both historical
and geographical. Since the 1950s, people have been working to manage their
geographic data using a system of computer modeling. This system has evolved into
what is now commonly known as a Geographic Information System (GIs). This study
looks at the database and mapping software system combinations currently in use at
botanical institutions. A compiled list of forty-nine named institutions shows the
reader what combinations are in current use.
This study is written for institutions that already have a computerized
database in place, and are seeking information on choosing a computerized mapping
system. A discussion of the history of Computer Aided Drafting (CAD), Geographic
Information System (GIS) and computer mapping in general, educates and prepares the
reader to become familiar with particular software packages. A literature and history
review provides the reader with resources for more information on database systems if
they do not currently have one implemented in their institution.
Plant mapping professionals rank a series of 20 questions on the
importance of computerized mapping software to the institutional needs. The three
most commonly utilized mapping software packages were then evaluated on a point-
by-point basis to determine which software options most completely fulfills the garden
users' stated desires. One software choice was found to be the most flexible for the
garden users' stated desires.
viii

Chapter 1
INTRODUCTION
Although we tend not to think about it much, it’s a plain fact that everything human beings do takes place at a particular location on the earth: every activity, thing, trend, issue or phenomenon has a geographic component to it. In the routine activities listed above, the question of “where” is a crucial part of the larger issue.. . .
Cartography, the art and science of making maps or charts, is among the
most ancient and universal of sciences. Throughout recorded history, people have
made maps and charts of the physical and cultural features of the world around them,
whether on the vast geographic scale of the stars and the seas or the smaller scale of
streets and houses within a small village. No matter the scale or the kind of feature,
this question will eventually arise: “Where is it?” Since the 1950s, people have used
computer modeling to address that question and to assist in drawing maps to show the
answer. Combining the fields of cartography, computer science and the broad field of
geography led to what is now commonly known as Geographic Information Systems
(GIs). Through the development of GIS software in the 1950s and 1960s, to the large
scale commercial availability in the 1980s, in 2000 there were believed to be about
one-million regular users of GIs, with about five-million casual users worldwide.*
1 David Davis, 2003, p. 1.
2 Longley et al, 2001, pp 12- 13.
9

For decades, botanical garden employees have drawn maps and worked to
keep track of the location of plants. Accurate mapping enables the garden employees
to answer promptly and accurately when someone asks, “Where is it?” and this in turn
makes the visitor’s experience more enjoyable and the researcher’s work more
efficient. Before GIs became available, gardens used paper, linen or MylarB3 maps to
keep track of the locations of their plants. However, a map displaying or illustrating a
botanical garden must change frequently as the gardeners create new displays and
replace dead plants. Historically, when plants died or were removed, many garden
cartographers updated their maps merely by erasing those plants from the map, leaving
no record of the plants’ spatial location. Even if a voluminous archive of historical
maps was held in a botanic garden, no efficient system existed to answer where a
particular plant had been or which plants had occupied a specific space in the past.
The question arises, “Is there a way to do this with computerized mapping software?”
GIs offers a two-part solution to these problems. First, a database keeps
track of information about individual plants, including their present and past locations.
Second, a mapping program presents that information to the user in a geographic
perspective that answers spatial questions effectively. Many GIS software systems
that allow these functions are on the market today.
This study is written for institutions that already have a computerized
database in place, and are seeking information on choosing a computerized mapping
system. The goals of this research are (1) to survey the software systems currently
available for mapping a living plant collection, (2) to compare the three most
3 Mylar@ is copyrighted by E. I. du Pont Nemours and Company. All rights reserved in the USA and/or other countries.
10
‘ I
commonly used software system options based on their features and (3) to find the
most flexible software option available for mapping living plant collections. These
findings may assist botanical garden managers who wish to add a computerized
mapping system to their existing computerized database system.
This study consists of three surveys to address these goals. Survey I, sent
to member institutions of the American Association of Botanic Gardens and Arboreta
(AABGA), sought to discover what, if any, computerized mapping systems member
institutions currently use. Survey I also asked institutions what features they employed
most often and what tools they utilized the least. This was followed by Survey II which
asked the institutions that had responded to Survey I to rank specific software features
based on their importance to their institutional needs. Survey III asked three leading
mapping software companies to describe how their products fulfilled the functions that
the respondents to Survey II had ranked. This enables a comparison of the three
software packages from a botanical garden perspective.
This study begins with a discussion of the history of Computer Aided
Drafting (CAD), Geographic Information System (GIs) and computer mapping in
general, in order to familarize the reader with particular software packages. A
literature and history review provided the reader with resources for more detailed
information on database systems if they do not currently have one implemented in
their institution.
This thesis proceeds as follows: Chapter 2 provides an overview of the
history of GIs and garden mapping procedures. Chapters 3 ,4 and 5 describe Surveys
11

I, II and IJI respectively, and discuss the findings of each survey. Chapter 6
summarizes the results of this thesis and makes recommendations for future areas of
research.
12

Chapter 2
HISTORY OF GIs AND GARDEN MAPPING
An investigation of garden mapping was conducted to confirm the need
for this research, and by reviewing the literature. The scarcity of resources pertaining
to mapping in garden settings confirmed the need for such a study. While a good deal
of research exists on GIs and mapping in general circumstances, little information
focused on the selection process for uses at botanical gardens. Moreover, the
development of GIS is presented first to place mapping into a historical context and to
provide an overview of GIs.
2.1 History of GIs
Before the 1950s, most drawings produced in the world were graphite on
paper. In the 1950s, the US Air Force created the Semi Automatic Ground
Environment (SAGE) which displayed computer-processed radar data in a graphic
system.4 This was one of the beginning points of Computer Assisted Design (CAD).
CAD, in its most basic sense, is a two-dimensional drawing software package.
CAD commonly refers to Computer Assisted Design or Computer Aided
Drafting, while CADD commonly refers to Computer Aided Drafting and Design.
Computer aided drafting systems usually allow for displaying, drawing and editing
Schoenherr, 2003.
13

multiple layers. CAD drawings can be two-dimensional digital representations of
manually drafted drawings or three-dimensional models.5
The next generations of drawing packages were the forerunners of today’s
more simplistic GIs. These systems were initially referred to as Graphic Information
Systems. That system stored, analyzed and displayed multiple geographic information
layers as well as tabular data in a digital environment. In simplest terms, “a GIs can
be thought of as a spatial database.”6
The first GIS system is commonly believed to be the Canada Geographic
Information System, or CGIS. It was designed in the mid 1960s as a computerized
mapping system for land inventory. In 1964 the Harvard Laboratory for Computer
Graphics and Spatial Analysis was established. In 1966, SYMAP, the first raster GIs,
was created by Harvard researchers. In the late 1960s there was another era of
development as the government readied for the 1970 census. This included the Dual
Independent Map Encoding-Geographic Database Files (DWDE-GBF) developed by
the US Bureau of Census. In the very late 1960s and 1970s, the early development
evolved into large GIS corporations. This included the formation of ESRIB Inc. and
Intergraph Corporation, both in 1969. In the 1980s with the drop in price of
computers, the era of commercially available GIS software exploded. This included
the software Arcinfo in 1981 and MapInfo in 1986. In the year 1994, President
Clinton signed Executive Order 12906 which leads to the creation of US National
Spatial Data Infrastructure (NSDI) and the Federal Geographic Data Committee
(FGDC). The year 1999 marked the first worldwide GIS day on November 16. By the
5 Montgomery and Schuch, 1993, pp 5-6.
Lang, 1998, p 4.
14

year 2000, there were believed to be one-million regular users of GIs, and about five-
million casual users of GIs worldwide?
While both CAD and modern GIS may contain layers of information
defined as points, lines and polygons, they are distinctly different. In traditional CAD
the layers are merely graphical. In a modern GIs, the layers relate to a special
database that contains spatial information. A user can query the GIS for information
from multiple layers simultaneously. It is this analytical power in GIS that separates it
from traditional CAD.
For an overview of GIs applications used to manage natural resources, the
book, Managing Natural Resources with GIs by Laura Lang, is recommended.
Published by ESRIO Press in 1998, it focuses on sites using ESRIB products, but it
also provides information of the variety of applications available. It offers a number of
examples of how GIS is being used including settings in agriculture, clean water,
coastal protection, and disaster planning and recovery. It also contains an Appendix
with information on where to obtain GIs data for natural resources.
One large sector of the GIS industry is the utilities sector containing water,
electric, gas and telephone lines. Utility companies fund much of the research and
development of computerized mapping systems because accurate mapping of the
locations of underground wires, gas lines and water mains permits more efficient
construction, maintenance and daily operations. To the computer, a wooden telephone
pole is simply a tree in a new form and use. When accessed in the database, both the
telephone pole and the tree have an age, a date it was planted or put in that spot, a
height, and a species or material data. With the utility companies providing
7 Longley et al, 2001, pp 10-13.
15

inspiration, encouragement, and financial sponsorship, upgrades to the utility database
and mapping systems flow freely.
2.2 Mapping Features in a GIS
Both CAD and GIS maps show features using points, lines or polygons
that represent real-world features or as grid cells defining areas. The two methods of
representing geographic data in the digital computers are referred to as raster or vector
views of reality. In a raster representation, geographic space is divided into an array of
cells that are usually square, but can also be rectangular. All geographic variation is
then represented by assigning properties to these cells. In a vector representation, all
lines are captured as points connected by straight lines. Lines are captured in the same
way with the term polyline used to describe a curved line represented by a series of
straight segments between points. To capture an area object in vector form, one only
needs to outline the shape of the area.8
For a garden, a mapped polygon may represent garden grounds, planting
beds, perennial gardens, a cluster of multi-trunked trees, and the outline of a shrub
hedge, building footprints or parking lots. A line may define a stream, an underground
water main, the stripes on a parking lot or an overhead power line. Individual points
mapped in the garden represent a tree, a shrub, or a singular herbaceous plant. Other
objects mapped as points may include such items as a telephone pole, a fire hydrant, or
the location of an in-ground mapping marker.
To create a geographic database, whether using CAD or GIs-based, there
are three, not mutually exclusive, ways to create a digital geographical database. The
8 Longley et al, 2001, pp72-73.
16

first is to digitize existing analogue data using a digitizing tablet. The second is to
carry out a digital survey by means of a total station system. The third is to obtain data
in a digital form from a data supplier. In all cases the data must be geometrically
registered to a defined coordinate system to allow different data layers to overlay
together.9
One way to gather data in paper format is by converting current mapped
information into digital information. This is accomplished in several ways, by
digitizing, scanning and/or hand entry to create digital mapped data.
Digitizing a map involves manually tracing a paper map fastened on a
digitizing tablet with a cursor or digitizing puck. The x, y location is recorded as the
user traces features of interest to create points of data, strings of points (or lines) of
data and/or closed lines (or polygons) of data. The digitizing process creates vector
data that represent geographic features as points, lines and polygons.1°
Scanning involves taking a paper map and making an image of the
document which is used in the computer system. A scanned map for example, may
contain the outlines of a garden. The scanned image is a raster (grid) layer of data in
the software system with each subsequent scanned map as a separate layer. Scanned
maps are special tiles covering a layer area. In some cases, numerous adjacent scanned
maps will make up a garden where each scanned map represents a spatial tile covering
the subsection of the larger area. These layers are pieced or “sewn” together to make a
continuous layer covering the entire garden using GIs technique referred to as merge
Burrough and McDonnell, 1998, p 75.
lo Montgomery and Schuch, 1993.
17
or mosaic. This process creates one single raster layer of the entire garden represented
as a grid pattern, with each cell holding one attribute value.
The process of transforming an image from an image coordinate system to
a map coordinate system is called image rectification or ortho-rectification. To do this
control points on an image are linked to ground control points whose coordinates are
known. The more points on an image that is referenced, and the more spaced out they
are, especially towards the edges, increase the accuracy of the rectification. This
results in a map being georeferenced. Georeferenced historical scanned layers can then
tell the garden user the location of specific classical plants or objects.
To survey, according to dictionary.com, is “To determine the boundaries,
area, or elevations of (land or structures on the earth’s surface) by means of measuring
angles and distances, using the techniques of geometry and trigonometry.”ll This
means to measure it. A varying array of equipment is available for purchase to assist
an institution in surveying. Companies also exist that will survey your property for
you, for a price.
With basic surveying, two people are needed. One to operate the total
station, and one to hole the reflective prism (pole) at the point being measured. With
some remote controlled systems, a single person can control both the station and the
prism. The total station unit automatically records the data of point, line, distance,
height, etc. Since all survey points are obtained from survey measurements their
locations are always relative to other points. Measurement errors need to be
apportioned between multiple points ina survey. For this reason, it is helpful to store
As viewed on www.dictionary.com, February 1 1, 2005.
18
both the measurements and the point information inside a GIs database until the
survey is complete.12
For an institution that wants to survey its own property, a book that
discusses surveying in a thorough manner is Elementary Surveying: an Introduction to
Geomtics by Paul R. Wolf and Charles D. Ghilanni, which is currently in its tenth
edition. This textbook describes the equipment, calculations, mapping surveys and
even astronomical observations. Wolf‘s text is good for people who are looking into
surveying their grounds, and for those needing to convert paper maps into digital
layers, requiring additional surveying for updates.
While a garden might be as small as a few square feet where measuring
with a tape measure will suffice, land holdings can cover hundreds of square miles and
still need a way of measuring. The use of the Global Positioning System (GPS) is a
great advantage here. The Global Positioning System is a constellation of twenty-four
active satellites (there are usually spares deployed as well) orbiting the earth at a height
of 12,600 miles. By reading the radio signals from as few as three of these satellites
simultaneously, a receiver on earth can pinpoint its exact location.l3 The more
satellites a receiver can “see” at any one time, the more accurate the location reading.
Several sources of error, however, may reduce the accuracy of a reading. An out-of-
the-box accuracy for GPS receivers can range from 10 to 15 meters for an average
device. By utilizing GPS equipment, cartographers can map where equipment is in
relation to the earth, and each other, over large distances. With the use of differential
GPS (DGPS), the level of error can often be reduced to one to three meters with high
12 Longley, 2001, pp.210-211.
13 Steede-Terry, 2000, p. 3.
19

end GPS units. DGPS uses two receivers, the user moving about the survey area has
one receiver, and a stationary receiver at a known and accurately surveyed point,
known as a base station. The further the roving GPS unit is from the stationary
receiver, the less accurate the resulting positions. Most GPS users who live in coastal
areas of the United States use the U.S. Coast Guard beacons as their method of
differential correction which is freely available, while GPS users who live inland may
have to acquire differential correction from a third party. Universities, government
agencies and private companies who are already operating base stations frequently
post data on the Internet. There are also companies who sell real-time correction as a
service to GPS users.
Geographic Positioning System (GPS) is based on the principle of the
length of time it takes a signal to travel from a satellite to a receiver on the ground.
The GPS satellites constantly transmit a coded radio signal that indicates their exact
position in space and time. The receiver measures how long it takes a the signal to
travel from the satellites. By measuring the distance from three or more satellites, the
location of the receiver can be determined by triangulation. With signals received
from four satellites, the elevation of the receiver can also be determir1ed.1~
GPS may not be the best choice for mapping small areas where inches or
centimeters of accuracy between items is important. In small spaces, a simple tape
measure may still be more accurate, unless using a high end GPS with an accuracy of
within centimeters with a base receiver. GPS also can have difficulty in the shadows
of buildings. This is where a building is blocking out the signals from satellites in one
(or more) direction(s). Moreover, the signals may bounce off a nearby building
14 Longley, 2001, p. 21 1.
20

causing the receiver to hear several signals, increasing error. Similar errors occur in
narrow ravines or areas between mountains where limited sky is clearly visible. Tree
canopies also interfere with the signal, causing lower levels of accuracy.
To obtain a short introduction to GPS, start with the book Integrating GIs
and the Global Positioning System by Karen Steede-Terry. As a condensed book, it is
a fast and easy way to learn the basics of GPS. After the introductory chapter, the
following chapters discuss varying real-world uses of GPS such as tracking elephants
in Africa which keeps the reading interesting and fast.
Digital data sets from data suppliers range from small geographic scale to
continent wide and available for nothing, downloadable from the internet, to expensive
personalized datasets. When combining datasets, attention must be paid to data
compatibility. When data are combined, there may be differences in coordinate
system, map projection, scale, base level and attributes for each individual dataset.
For example, a geologic survey dataset could classify soils differently than a survey for
agricultural resources. The part of the data that explains the way the survey was
conducted and the information collected is called the metadata. Metadata can assist
the user in understanding the dataset and processing the data in a GIs. Particularly
where data crosses administrative, political and geographical boundaries, data
compatibility and consistency must be checked.15
A garden cartographer may convert historical paper maps into computer-
based digital information by digitizing and/or scanning the maps for archival,
manipulation, and planning purposes. Inputting data into a GIs allows it to be
spatially referenced, enabling the various data layers to overlay together. This enables
Burrough and McDonnell, 1998, p 8 1.
21

a GIs user to easily add features using a Geographic Positioning System (GPS) and
permits all data layers to geographically align with one another. Following that, the
user may then rotate or stretch the digital map as necessary to match known positions
with specific GPS points. The act of assigning a location to an atom of information is
to georeference a record. Without locations, data are said to be non-spatial or aspatial
data.16 Although georeferencing has many different names (e.g. image rectification,
vector name, address matching) the process is essentially to convert the layers’ x, y
spatial coordinates to a user-selected geographic coordinate system and projection.
One book that goes through the steps of data selection and data conversion
is GZS Data Conversion: Strategies, Techniques and Management by Pat Hohl, editor.
This book begins with a discussion of data definitions, types, sources and processing
before moving on to converse on project management. The project management
chapters discuss the topics of hardware considerations, various software systems
available, as well as staffing and budgeting considerations. The data conversion
chapters explain the differences of how to obtain data from airborne sensing, aerial
photos, Global Position Systems (GPS) scanning and keyboard data entry to get data
into the GIs. Data transfer and data quality are also addressed.
The ESRZ Map Book by ESRIB Press shows a variety of maps created
using GIs. While all these examples have been created using ESRIB products, it
gives any prospective user a view of what is possible. This is published annually by
ESFUB Press.
16 Longley et d, 2001, p80.
I
22

2.3 Garden Mapping
Historically, gardens used paper, linen or Mylar@ maps to keep track of
the locations of their plants. Institutions with larger land holdings or that have mapped
their land areas in greater detail often created a grid system on their property. This
system creates a series of spatial quadrants, often called spatial tiles, of an uniform
size. Each mapped quadrant becomes one page in a larger book of mapped quadrants,
often called a map book.
The problem with mapping in this fashion arises when a plant dies or is
moved. This system erases it from the map, leaving behind no record of its original
spatial location. Caretakers of gardens with an historical background often state a
desire to return a garden to its configuration at a particular date in the past. The
question arises then, “Is there a way to do this with computerized mapping software?”
Consequently, the designers of computerized mapping software sought a means to
keeping maps up to date while preserving historical data.
Computerized mapping may also assist in other areas of garden
management. A computerized mapping system that allows multiple users to edit data
may assist in staff time management by allowing landscape designers and area
gardeners to keep datasets and maps up to date. The system may be used for resource
management because plants and areas are easier to find using computerized query
tools. It can assist in staff time management, because the landscape designers and area
gardeners can be networked to make changes on the maps. This allows the plant
curator more time to do non-mapping tasks.
Garden cartographers also have a desire to make current maps non-static
in time. Having a computerized mapping system allows the cartographer to make new
maps as features change within the garden. Also, the digital environment allows more
23

printing choices than paper maps. Previously, garden maps were copied by machine,
or the person would only take one page of a map at a time out into the garden.
Computer mapping systems allow the user to print at different scales and views. Also,
the garden employee does not have to worry about dropping the only map copy in the
mud since the data are stored in the computer. With the data stored electronically and
new printing capabilities, a new map can be printed at will.
The Canadian Journal of Botany in 1964 published James H. Soper’s
article on “Mapping the Distribution of Plants by Machine.” This study acknowledges
the fact that prolonged production of maps by hand and study of these maps can
produce eye-strain and visual fatigue. While the level of data available from one of
these early “dot maps” is vastly different from the levels of data retrieval available
from a current GIS system, this article showcases the early desire of cartographers and
botanists to move map-making to a computerized format.
In 1988, David Murbach published a Directory of Computer Use in Plant
Record Keeping. This study included a survey of 144 botanical institutions taken in
1984 of which forty-two (29%) were using computers to assist them with their plant
records.17 Seventy-two institutions planned on computerizing by 1994. One-hundred
three of the 144 respondents said they would like a listing of hardware and software
available at other botanical gardens. Today, botanical institutions still desire a list of
mapping software used at other botanical gardens.
This research focuses on the mapping needs of institutions that currently
have a collections policy and computerized plant records database systems. For
gardens that are researching the creation of a database system, the Curatorial Practices
l7 Murbach, 1998, p7.
24

for Botanical Gardens by Timothy C. Hohn and A Guide to the Computerization of
Plant Records by the American Association of Botanic Gardens and Arboreta
(AABGA) Computer Information Services Committee are excellent resource guides.
Curatorial Practices for Botanical Gardens has recently been updated and reprinted
by the Edmonds Community College. Showcasing curatorial practices in use, A
Guide to the Computerization of Plant Records explains how to create and use a
database system. While these guides are very basic, many may find it necessary to
reference the Appendix to fully understand the terminology used.
The American Association of Botanic Gardens and Arboreta has compiled
a binder titled Plant Records Policies for organizations working on defining their plant
records policies. This is a notebook available on loan from the organization. The
notebook can be viewed at the AABGA offices, or they will mail it to a member of
AABGA for their viewing. Inside the document are the plant record polices from the
Scott Arboretum (1989), Longwood Gardens (1991), Bernheim Foundation (1992),
Chicago Botanic Garden (1994) and the Morton Arboretum (undated).
2.4 Current Popular Database Software
In the 1960s, the Plant Sciences Data Center (PSCS) of the American
Horticultural Society undertook work to computerize many separate database
collections onto one mainframe computer. The Royal Botanic Gardens Kew
computerized its database collections in 1969. In the early 1970s, the Royal Botanic
Gardens Edinburgh and the Matthaei Botanical Gardens of the University of Michigan
computerized their living plant collections data. These institutions were the
forerunners of modern computerized plant database systems.18
18 Walter and O'Neal. 2001.
25
1
The purpose of this research is to compare computerized mapping
programs for organizations that already have database programs. Some of the most
frequently used database software systems are mentioned in the following paragraphs.
While the researcher is not attempting to compare or recommend any particular
database system, the discussion below will provide the reader with an overview of
each database software including what it is and who makes it. Information on costs
and purchasing is available in Appendix A: Database and Mapping Software Pricing
and Purchasing Information starting on page 65.
BG-BASE T M l 9 is a database application - a series of databases tables,
windows reports and programs designed to manage collection information. It runs on
the database management system of OpenInsight. BG-BASETM was created in 1985 at
the request of the director of Arnold Arboretum of Harvard University. Originally it
had twelve database tables to handle the information. It has evolved into a database
application with literally dozens of tables that all cross-reference with each other to
give the user complete information on plant collections. This database application is
made specifically for botanic gardens collections. Currently there are modules for
living collections, preserved collections, conservation, education, propagations,
DELTA (Descriptors) and HTML output?O
Microsoft @ Access21 is a database management program. Training is
available on-line for free and at many continuing education locations. Microsoft@
l9 BG-BASETM is trademarked by BG-BASE, Inc. in the USA and/or other countries.
2o As viewed on www.rbge.org.uk/bg-base.
21 Microsoft@, MicrosoftB Access, Microsoft@ Excel and FoxProB are either registered trademarks or trademarks of Microsoft Corporation in the USA and/or other countries.
26

Access comes packaged with some versions of MicrosoftB Office. There is a discount
for academic licensing.22
Linda Plato interned at the Elizabeth C. Miller Botanical Garden in Seattle
Washington in 1999. During her time as an intern, she developed an accession
database for the garden in Microsoft@ Access. This database is available free of
charge to other botanical gardens. For more information, please contact Linda Plato or
the Elizabeth C. Miller Botanical Garden.23
MicrosoftB Excel is a spreadsheet. Training is available on-line for free
and is also available at many continuing education locations. Microsoft@ bundles
Excel in the MicrosoftB Office packages that come with new personal computers.
There are discounts available for academic licenses and volume licenses.24
FileMaker25 is a database management system. Training is available on-
line as well as at many educational facilities. There are discounts available for volume
purchases .26
There is an application called CGI Virtual CollectionsTM27 which includes
modules for acquisitions, collections, loans, and catalogues. It is designed to work as
management software for archives, libraries and museums. This is an additional
22 As viewed on www.microsoft.com on March 1,2005.
23 As viewed on www.lindaplato.com and www.millergarden.org on March 1,2005.
24 As viewed on www.microsoft.com on March 1,2005.
25 FileMakerm is copyrighted by FileMaker, Inc. in the USA andor other countries.
26 As viewed on www.filemaker.com on March 1,2005.
27 Virtual CollectionsTM is trademarked by Gestion de Collections InformatisCes, Inc. in Canada and other countries.
27

I ’
module and is designed to run on FileMakerTM (purchase of FileMakerTM is
required) .28
2.5 Current Popular Mapping Software
The purpose of this research is to compare computerized mapping
programs for organizations that already have database programs. Some of the most
frequently used mapping software systems are mentioned in the following paragraphs
with basic information. Information on costs and purchasing is available in Appendix
A: Database and Mapping Software Pricing and Purchasing Information starting on
page 65.
Autodesk, Inc29 manufactures the current product most commonly
associated with the term “AutoCAD”. The initial demonstration of AutoCADB
Version 1.0 occurred in November 1982 at a COMDEX trade show.30 As of 2005,
AutoCADB is on its nineteenth release, AutoCADB 2005. The Autodesk company
began in 1982 by a group of programmers who were currently working for different
companies and looking to start their own venture. AutoCADB is now sold worldwide
supported worldwide .
AutoCADB is primarily a drawing and drafting tool. It is used by
architects, civil engineers and landscape designers. AutoCADB classes are commonly
taught in horticulture and engineering college courses. AutoCADB was not created to
28 As viewed on www.gci.ca on March 1,2005.
29 Autodesk, AutoCADB, Autodesk Map 8, and Autodesk MapGuideB are either registered trademarks or trademarks of Autodesk, Inc., in the USA and/or other countries.
30 Walker, 1994.
28

be a GIS system. Educational institutions and government agencies can qualify for a
reduced rate.3l
A very specialized software system called BG-Map,32 is a product
developed specifically for mapping botanical gardens. Designed by Mark Glicksman
of Glicksman Associates, Inc., this product is based in AutoCADB and works with
BG-BASETM as its database system. In the late 1980's, Mr. Glicksman was a
consultant to the Morris Arboretum of the University of Pennsylvania in Philadelphia,
and he used AutoCADB for his engineering work while the Morris Arboretum was in
the process of acquiring BG-BASETM for its database management program. An idea
developed to link these two programs for the benefit of plant management. The initial
installment at Morris Arboretum occurred in November 1991, with continual
developments since then. New features have been added each year, mostly speared by
user suggestions. BG-Map is designed to work with pre-existing plant records in BG-
BASETM and plant maps in AutoCADB. BG-Map is not a drafting or design tool, but
a tool to link plant records in BG-BASETM with AutoCADO maps. BG-Map adds
features like plant lists, the ability to find plants in an area or by name, and printing
features.33
31 As viewed on www.autodesk.com on March 1,2005.
32 BG-Map, GreVidTM, Garden Notepad and Visitors QUICKFinder are either registered trademarks or trademarks of Glicksman Associates, Inc., in the USA and/or other countries.
33 Mark Glicksman, personal communication, 2004.
29
,
Environmental Systems Research Institute, now commonly known as
ESRIB34, began in 1969 by Jack and Laura Dangermond as a private consulting group
that specialized in land-use analysis projects. Jack Dangermond trained as a landscape
architect at Harvard University, is the president of ESRIB. He has a strong belief in
geography and the importance in applying its concepts to improving the lives of
everyone. The business began with an initial investment of $1 100, and is still
privately owned by Jack and Laura Dangermond who have no intention of going
public or having a change in ownership. The early mission of ESRIB in the 1970's
focused on the principles of organizing and analyzing geographic information. During
the 1980's, ESRIB devoted its resources to developing and applying a core set of
application tools that could be applied in a computer environment. The basic tools
included analysis, edit and mapping tools. In 1982, ESRIB launched its first
commercial GIs software called ARC/INFO. Today ESRIB employs more than 2800
employees with users in over 200 countries.35
ESRI's most simple GIS package available is ArcViewTM. ArcViewTM
provides mapping, data use, analysis, editing and geoprocessing capabilities.
ArcEditorTM is the GIs system for editing and managing GIS data. ArcEditorTM
includes all of the functionality of ArcViewTM in addition to comprehensive GIs
editing tools. ArcEditorTM supports single user editing as well as a collaborative
process between multiple editors. ArcInfoB is a full function GIs that extends the
34 ESRIB, ArcInfoB, ArcGISB, ArcIMS@, ArcPadB, ArcViewTM, ArcPublisherTM, ArcReaderTM, Spatial AnalystTM, 3D AnalystTM and ArcEditorTM are either registered trademarks or trademarks of Environmental Systems Research Institute, Inc. (ESRI), in the United States, the European Community, or certain other jurisdictions.
35 Longley, p. 170.
30

capabilities of ArcViewTM and ArcEklitorTM. Additional extensions are also available
for purchase. These extensions includes ArcPublisherTM, Spatial Analysis, ArcScanTM,
Trimble GPS Extension, and ArcPublisherTM. ArcPublisherTM is the software to
publish maps that can be downloaded and read over the internet via ArcReaderTM, a
free software. Spatial Analysis gives the user advanced raster GIS spatial analysis
I
capabilities. ArcScanTM gives the user raster to vector conversion. Trimble GPS
Extension, enables users who collect their data with TrimbleTech equipment.
ArcPadB allows the user to transfer data to a mobile or handheld device. Training is
an additional cost for each additional GIS application. Additional training can also be
found on-line, at local institutions of higher learning, and with user groups.
Free software, hardware and training bundles are available through ESRI@
funded grants. There is also information on the ESRIB websites about non-ESRIB
funded grants for assistance in obtaining geographic information systems acquisitions.
Special rates for educational and not-for-profit institutions are available. A discount of
is common for educational users and museums. Non-profits are provided on a case by
case basis.36
A GIs product that began with mapping utilities and migrated to mapping
botanical gardens is the product MClangeTM37, developed by the Hilltop Consulting
group of Boston, Massachusetts. MelangeTM started because of the perceived need for
a true GIs product within several markets. Early research targeted the municipal and
botanical garden markets, chosen because existing customers had custom solutions
36 As found on www.esri.com as of March 1,2005.
37 MClangeTM is a trademark of Hilltop Consulting Group, Boston, Massachusetts, all rights reserved in the USA and/or other countries
31
1 I 1

written by Hilltop Consulting. MBlangeTM is a tool that utilizes ESRIB software.
With ESRIB products powering its GIs engine, MBlangeTM can either enhance an
existing GIs program or act as the basis for a new GIs. The basic guiding principle of
the MdangeTM developers is the GIs should fully integrate all of the other systems
within a garden, not merely associated with other systems through importlexport
functionality. Because end users have many different responsibilities,
importinglexporting data files become a burden maintaining and using a mapping
system. M61angeTM currently focuses on utilities and other general GIs applications
with a package available for garden installments.38
2.6 Associated Costs
There are many costs associated with implementing computerized
mapping for an institution. Some of the other costs to consider include:
Personnel hours Outside consulting Computer hardware - CPUs, keyboards, printers, etc. Database Mapping system software Mapping (data conversion from old maps) Mapping equipment (survey equipment, GPS, orthophotography) Long term map upkeep
Any facility that considers implementing a computerized mapping
program should include these in calculations. A facility should also take into
consideration that purchasing and maintaining a mapping system is more than a one
38 Michael Doyle, personal communication, 2004.
32

time investment. New staff training, staff renewal training, software and hardware
upgrades and the mapping of new areas, plants and items also will add to the costs.
' , , I r ,
33
, , i,:" 'I l " 1

Chapter 3
SURVEY I
This chapter presents the methods, results and conclusions of the
compilation of research data from Survey I. To address the goals of this thesis, Survey
I, sent to member institutions of the American Association of Botanic Gardens and
Arboreta (AABGA), sought to discover what, if any, computerized mapping systems
member institutions currently use. Survey I also asked institutions what features they
employed most often and what tools they utilized the least. Additional insight from
gardens without mapping systems was gained through survey comments and through
personal communication with garden staff at such institutions.
3.1 Methods
An initial survey was created to determine which botanical gardens
currently have mapping software coupled with a database system. Survey I was
created and forwarded to the Office of Vice Provost for Research (OVPR) for
approval. The approval letter can be found in Appendix B on page 7 1. A copy of
Survey I appears in the Appendix C, on page 74.
Survey I contained four questions to determine whether the responding
botanical garden has a computerized plant database and a computerized mapping
system, and if so, what software the institution utilizes. Following these questions, the
researcher asked five questions about the best features, the worst features, the most
common and least common features, and what additional features the users desired.
34
Lastly, the researcher asked whether the respondent found the software easy to learn
and use on a daily basis.
The User Survey (Survey I) was mailed to 459 institutions that were listed
as American Association of Botanical Gardens and Arboreta (AABGA) Member
Institutions as of March 2002. These gardens provided a representative sample of
public gardens in the United States. These gardens were in variety of physical sizes,
staff sizes and geographic locations. Additionally, some institutions participated in the
survey after reading about the research through PlantNet, a United Kingdom (UK)
plant group. Survey I allowed the respondents to reply by mail, fax or via the Internet
through the website, www.studentresearcher.com.
3.2 Results
One hundred seventy-seven (1 77) individual institutions responded to
Survey I out of 459 for a response rate of thirty-eight percent (38%). The
organizations were asked if they currently use a database system, and if so, what
system they use. Another question was if the respondents currently use a mapping
system, and if it is a computerized system, what software is used. The responses are
tabulated in Table 1: Cross Comparisons of the 177 Responses to Database Software
Systems with Mapping Software Systems available on page 37. On pages 38 through
41, a reference list of institutions report on computerized mapping software. This list
displays the names of institutions sorted first by the database system used, and then by
the computerized mapping system. The list excluded any institutions that use a paper
mapping system or do not have a mapping system. Institutions were given the option
of not having their names publicly released. The institutions that preferred to not have
their name published are included in the totals on Table 1, but are not listed by name
35

36

Named Institutions Using Computerized Mapping Software
I, Microsoft@ Access Database System A Microsoft@ Access as a Mapping System
0 Mountain Top Arboretum
B. AutoCAD@/ Autodesk Products Mapping Systems Cedar Valley Arboretum and Botanic Garden
0 Ganna Walska Lotusland 0 Georgia Southern Botanical Garden 0
The Dow Gardens 0
0 Unnamed site (1 site)
Red Butte Garden and Arboretum
The Friends of Vander Veer Gardens
C. ESRIB Products Mapping Systems 0
0 Forestry Commission, UK (Arcview)
0
Bernheim Arboretum and Research Forest (Arcview)
Missouri Botanical Garden (Arcview, ArcPad, ArcIMS) Santa Barbara Botanic Garden (Arcview) University of Tennessee Arboretum (Archfo) Winterthur Museum, Garden & Library (ArcMap) Unnamed site (Arcview) (1 site)
D. AutoCADB/ Autodesk & ESRI@ Products Mapping Systems 0 Unnamed site (ArcInfo) (1 site)
E. Eagle Point LANDCADDTM Mapping Systems Illinois Central College
F. Easy Cadd Mapping Systems 0 Amy B. H. Greenwell Ethnobotanical Garden
G. In-house created Mapping System 0 Unnamed site (2 sites)
38
11. Microsoft@ Access & Microsoft@ Excel Database Systems A. Eagle Point LANDCADDTM Mapping Systems
State University of New York - Cobleskill College
111. BG-BASETM Database System A. AutoCADB/ Autodesk Products Mapping Systems
W.J. Beal Botanical Garden 0 Unnamed site (1 site)
Lady Bird Johnson Wildflower Center
B. BG-Map Mapping Systems Cornel1 Plantations Denver Botanic Gardens Descanso Gardens Dubuque Arboretum & Botanical Gardens Mendocino Coast Botanical Gardens Morris Arboretum at the University of Pennsylvania Mount Auburn Cemetery Mt. Cuba Center Queens Botanical Garden Rancho Santa Ana Botanic Garden Rio Grande Botanic Garden Scott Arboretum of Swarthmore College The Holden Arboretum The North Carolina Arboretum University of Delaware Botanic Gardens
C. ESRIB Products Mapping Systems Mounts Botanical Garden (ArcMap, ArcPad)
D. Microstation Mapping Systems Olbrich Gardens US Botanic Garden
39

IV. BG-BASETM and Microsoft@ Access Database System
Unnamed site (ArcGIS) (1 site) A. AutoCADW Autodesk Products & ESRIB Products Mapping Systems
0
V. BG-BASETM and ESRI Product ArcGIS as a Database System A. AutoCADB/ Autodesk Products & ESRIB Products Mapping Systems
0 University of Massachusetts, Amherst (ArcGIS)
VI. ESRI Product ArcView as a Database System43 A ESRIB Products Mapping Systems
David C. Shaw Arboretum at Holmdel Park (Arcview)
VII. BG Recorder A. ESRIB Products Mapping Systems
0 McKee Botanical Garden (Arcview, ArcGIS)
VIII. Davey Tree Co.’s Treekeeper Database System & Mapping System
0 Hillwood Museum & Gardens
IX. FileMakerB Pro Database System A. Canvas Mapping Systems
0 Cincinnati Zoo & Botanical Garden
B. ESRIB Products Mapping Systems 0
0
Oklahoma Botanical Garden & Arboretum (Arcview) Wellesley College Botanic Garden (Arcview)
C. Map Info0 Mapping Systems 0 JC Raulston Arboretum
D. Vector Works Mapping System 0 Filoli, an Historical Estate
43 ArcView uses MicrosoftB Access as its database system.
40
/I I *I 1 1 ) I

X. FoxPro Database System A. ESRIB Products Mapping Systems
0 The Dawes Arboretum (Arcview, ArcGIS)
XI. MentorPro Database System A. ESRIB Products Mapping Systems
0 The Morton Arboretum (ArcMap)
XII. Sybase Database System A. AutoCADB/ Autodesk Products Mapping Systems
0 University of California Botanical Garden at Berkeley
41
I
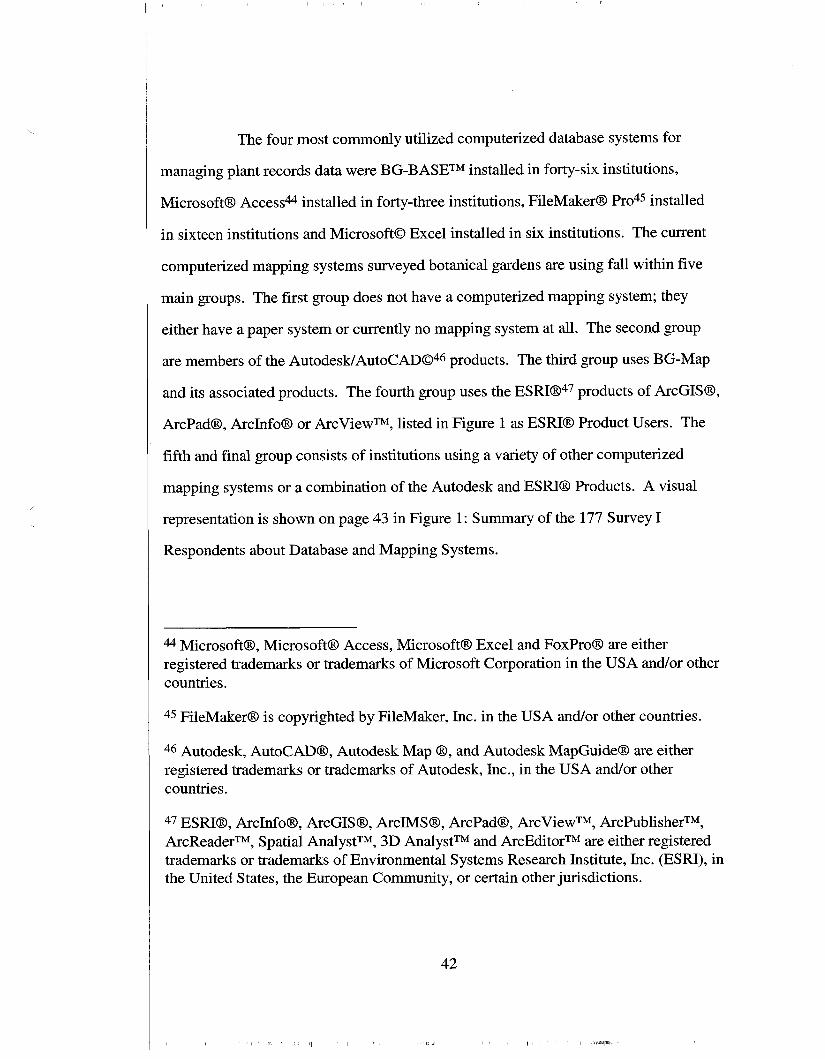
The four most commonly utilized computerized database systems for
managing plant records data were BG-BASETM installed in forty-six institutions,
MicrosoftB Access4 installed in forty-three institutions, FileMakerB Pro45 installed
in sixteen institutions and Microsoft0 Excel installed in six institutions. The current
computerized mapping systems surveyed botanical gardens are using fall within five
main groups. The first group does not have a computerized mapping system; they
either have a paper system or currently no mapping system at all. The second group
are members of the AutodesWAutoCAD046 products. The third group uses BG-Map
and its associated products. The fourth group uses the ESRIB.47 products of ArcGISB,
Arcpad@, ArcInfo@ or ArcViewTM, listed in Figure 1 as ESRIB Product Users. The
fifth and final group consists of institutions using a variety of other computerized
mapping systems or a combination of the Autodesk and ESRIB Products. A visual
representation is shown on page 43 in Figure 1: Summary of the 177 Survey I
Respondents about Database and Mapping Systems.
4 4 MicrosoftB, MicrosoftB Access, MicrosoftB Excel and FoxProB are either registered trademarks or trademarks of Microsoft Corporation in the USA and/or other countries.
45 FileMakerB is copyrighted by FileMaker, Inc. in the USA and/or other countries.
46 Autodesk, AutoCAD@, Autodesk Map 0, and Autodesk MapGuideB are either registered trademarks or trademarks of Autodesk, Inc., in the USA and/or other countries.
47 ESRIB, ArcInfoB, ArcGISB, ArcIMSB, ArcPadB, ArcViewTM, ArcPublisherTM, ArcReaderTM, Spatial AnalystTM, 3D AnalystTM and ArcEditorTM are either registered trademarks or trademarks of Environmental Systems Research Institute, Inc. (ESRI), in the United States, the European Community, or certain other jurisdictions.
42

60
50
fn c 0
3 40 fn C
0
@ 30 Q
3 z
.- c
.-
.I- - r
L
E
20
10
0 No Data Base Microsoft@ BG-BASETM File Makern Microsoft@ Other (17) System (60) Access (37) (44) Pro (16) Excel (3)
Database System
Mapping System
El No Mapping System (1 19) ga BG-Map (1 5) 0 Other computerized mapping system (1 7)
OAutodesk Product (12) flESRI@ Product (14)
Figure 1: Summary of the 177 Survey I Respondents about Database and Mapping Systems Combinations.
43

In Survey I, the botanical gardens staffs were asked if they found their
computer mapping software easy to learn. Of the three dominant software choices,
AutoCADB, ESRIB Products and BG-Map, the ease of use responses were as follows.
Of the twelve AutoCADB users, five found it easy to learn and seven did not. Of the
fifteen BG-Map users, ten found it easy to learn and five did not. Of the fourteen
ESRIB Product users who responded to the survey, eight found it easy to learn and six
did not find it easy to learn. This is illustrated in Figure 2: Survey I Response as to the
Ease of Learning the Software of the 41 Institutions with an AutoCADB, BG-Map or
ESRIB Software System
10
8
6
4
2
0 AutoCADO (1 2) BG Map (1 5) ESRKB (14)
Software Represented
Figure 2: Survey I Response as to the Ease of Learning the Software of the 41 Institutions with an AutoCADO, BG-Map or ESRIB Software System
44
1 1

In Survey I, users were asked five questions about their current
computerized mapping systems. The questions were: (1) “What do you believe are the
best features to your current mapping system?’’ (2) “What features do you use most
frequently with your current mapping system?’ (3) “What features do you like least in
your mapping system?” (4) “What features do you use least frequently in your current
mapping system?’’ and ( 5 ) “What additional features would you like to have in your
mapping system?” There was also an open ended question of (6) “Additional
comments?” The complete responses are available in Appendix D: on page 77. A
summary of the most common responses were as follows.
(1) “What do you believe are the best features to your current mapping system?” It links directly to the Database. Printing. Different levels can be used (with different colors) and the levels can be turned on and
off, especially in printing. support. Ability to share data with other industries. Ability to link our survey equipment. Simple- flexible.
(2) “What features do you use most frequently with your current mapping
Printing. Plant and object locator. Adding and relocating plants. Mapping non-plant features. Simple drawing features. Zoom in and out. Adding and subtracting layers.
system?”
(3) “What features do you like least in your mapping system?” Incompatibility with our database. Long learning curve to master. It is not always intuitiveheems to be overly complicated. Inability to change quad system. Inability to make major changes in base map without paying for tech support.
45

How the software determines the information to be displayed in a defined view map. I
The ability to work with “non plant objects” is limited without a separate module. would like to have more choice in the matter.
(4) “What features do you use least frequently in your current mapping system?” Many parts that I don’t know what they do. QuicWinder . Images. Many of the architectural features/CAD features are never used. Geo analysis capabilities. StreetdCity Maps options. We don’t use our mapping system to generate plant lists. We use our database to do
3-D features. All the special printing options.
this.
(5) “What additional features would you like to have in your mapping system?” Linked to database. 3-D modeling. Aerial photo integration. To have data available electronically in the field. Direct link between plant profile and the map. Ability to click on a plant and have the program take us directly to the plant record for
Greater flexibility in determining the information that is displayed in a defined view
Multiple users. Maps accessible and retrievable by visitors/over internet. More control over the printing scale/view/text size.
modification to the record.
map.
(5) “Additional comments?’’ From Institutions with computerized mapping software: I am very interested in seeing what’s available for a small garden (at a low cost!) We plan to purchase something else in the future. We are in the midst of developing a complex GIS/database combo. Are you looking into surveying and GPS devices that are used in the field? Overall, [institution] is very excited to have acquired both BG-BASETM and BG-Map.
We just need more resources (particularly staff) to use the systems more efficiently. We rely on mark Glicksman (BG-Map) for technical assistance.
We do not digitally map every plant, only long lived specimens. We draw in by hand the shorter lived species on the computer generated base maps, which will
46

I’
include the long-lived specimens when we can get them entered into the s ys tem .
I think that GIS mapping is a great tool for public Gardens.
(5) “Additional comments?” From institutions without computerized mapping software: We are in the process of purchasing software. About to start looking at mapping software. This survey should provide some use. Any recommendations on software that work with our particular database? May someday map, not necessary currently. We are very small and don’t have the funds to buy computer mapping software. I feel the AABGA could do a great service for many small/medium sized gardens by
providing customized-off-the-shelf software that is standardized for botanical gardens.
Can you send me a copy of the all available computerized database and mapping systems?
I’m looking for software for both right now. Please keep me posted on your results. We are a display garden focused around events and there is no intention of doing any
mapping.
Of the 119 out of 177 respondents (67%) who did not have a computerized
mapping system, ninety-five requested to receive copies of this final document, and
forty institutions stated that they were now or in the future planning on looking into or
purchasing computerized mapping software. This shows an interest from institutions
that do not currently have computerized mapping software to obtain software in the
future.
Of the fifty-eight respondents (33%) who stated they do currently have
computerized mapping software, fifty-three requested to receive copies of this final
document, and seven stated that they were now or in the future planning on purchasing
computerized mapping software. This shows that institutions that do currently have
software can benefit from this research as well.
47

1 1
3.3 Conclusions
Survey I, sent to member institutions of the American Association of
Botanic Gardens and Arboreta (AABGA), sought to discover what, if any,
computerized mapping systems member institutions currently use. Survey I also asked
institutions what features they employed most often and what tools they utilized the
least. After reviewing the information responses of Survey I, the researcher concludes
that 119 out of 177 (67%) of the respondents currently were not using computerized
mapping systems and 58 out of 177 (33%) do already use computerized mapping
systems. In addition the research concluded that many other gardens are considering
adding computerized mapping systems that would interact with their current database
systems.
The three software choices most commonly in use by botanic gardens are:
AutoCADO, ESRIO Products and BG-Map. The surveyed users of BG-Map and
ESRIO Products found those products easy to learn, while the majority of AutoCADO
users found that the product not as easy to learn.
When asked what features were the best, worst, most frequently and least
frequently used, along with what additional features the users would want to add to
their system, the following features were mentioned most frequently included:
The ability of the mapping system to interact with the database. Printing, including can the printing scale/view/symbols/text size be controlled by the
user. Layers. Technical support. Ability to access data in the field. Ability to publish to the web. Possibility of making personalized maps and informati na railable to the risitor. Having multiple users query, or outside sources (visitors) query information.
48

Ability of the mapping software to work with the survey equipment, especially survey
3-D modeling, 3-D capabilities. Finding plants. Adding and relocating plants. Aerial photo (ortho photo) integration. Learning curvehs the software intuitive? The ability to share data with other institutions.
equipment already in place at the facility.
Of the 119 out of 177 respondents who did not have computerized
mapping system, ninety-five requested to receive copies of this final document, and
forty institutions stated that they were now or in the future planning on looking into or
purchasing computerized mapping software. This shows an interest from institutions
that do not currently have computerized mapping software to obtain software in the
future.
Of the fifty-eight respondents who stated they do currently have
computerized mapping software, fifty-three requested to receive copies of this final
document, and seven stated that they were now or in the future planning on purchasing
computerized mapping software. This shows that institutions that do currently have
software can benefit from this research as well.
I
I
49

Chapter 4
SURVEY I1
This chapter presents the methods, results and conclusions of the
compilation of research data from Survey II. Using the most frequently mentioned
data of Survey I, a second survey was developed which is the focus of this chapter.
With this survey, users of computerized mapping software rated the importance of
twenty features and possible features of their software.
4.1 Methods
After analyzing the initial survey data, a second survey was created.
Survey II was created and forwarded to the Office of Vice Provost for Research
(OVPR) for approval. The approval letter can be found in Appendix B on page 7 1. A
copy of Survey II appears in Appendix E beginning on page 87. This survey was sent
to the fifty-six (56) respondents of Survey I who stated their organizations used
computerized mapping systems and stated that they would be available for a second
survey. The second survey was not sent to organizations that did not have a
computerized mapping system. Survey II was distributed primarily via e-mail, or via
the US Postal Service848 to respondents who did not provide an e-mail address. The
respondents had the option to reply by mail, fax or through the Internet site at
http://www .studentresearcher.com.
48 United States Postal Service8 and USPSO are copyrighted by the United States Postal Service, all rights reserved in the USA and/or other countries.
50

Survey II contained twenty questions asking the users how important they
found various features of their computer mapping software. These questions were
chosen based on the user responses from Survey I. Survey 11 also allowed users the
opportunity to write in other factors they found important when utilizing their mapping
system.
4.2 Results
There were 56 respondents to Survey I who stated that their organization
used computerized mapping systems and that were willing to be contacted again. A
second survey (Survey II) was sent to these organizations. The questions on this
survey were developed from the topics most frequently mentioned by the respondents
of Survey I. Of the fifty-six (56) surveys sent, forty-eight (48) individual institutions
responded to Survey 11 with a response rate of 85.7 %. Respondents were asked to rate
the importance of various features that pertain to their institution as well as write in
additional important features.
The survey associated a point-ranking scale to the responses of institutions
ranging from 5 points to 1 point with the following points assigned: Important (5
points), Relatively Important (4 points), Undecided (3 points), Relatively Unimportant
(2 points), and Unimportant (1 point). The computed results obtained from the
questionnaire as were derived by simply averaging the ranking scale. The averaging is
the total score divided by the number of responses. Only simple percentage figures
were computed. Although the institutions participating had a wide range in physical
size, number of mapped materials, and length of experience with the software, no
attempt was made to weight the results according to those factors. Rather, the intent
was to obtain the frequency and type of requests desired from the users in varying
51
I'

sized and staffed institutions. Figure 3 on page 53 shows the average scores for each
question asked in Survey II.
52


\
4.3 Conclusions
There were fifty-six out of 177 respondents to Survey I who stated that
their organization used computerized mapping systems and that were willing to be
contacted again. A second survey (Survey II) was sent to these organizations. The
questions on this survey were developed from the topics most frequently mentioned by
the respondents of Survey I.
The most important topic to the respondents was the ability to print. The
ability to print, define the users' own printing boundaries and printing scales were
three of the top five most important questions, according to the average scores of
Survey II. The open ended questions in Survey I also showed a desire to have more
control over printing ranges, sizes, scales and views. This could show that printing is
one of the most used tasks of computerized mapping software. It could also show that
printing is one of the more frustrating tasks to users who currently cannot control their
printing ranges, sizes, scales and views.
The next most important factor in a mapping software system was the
ability to map non-plant data, as well as plant data. This is showing that the users have
a desire to know where other objects besides plants are. Buildings are used as
reference points, some memorial items like benches and plaques have their own data,
and utilities like gas and water are important in the garden setting.
The fifth most important feature on mapping software was the ability of
the mapping system to interact with the database system. This shows the importance
of having the mapping system and the database relate to each other. This also shows
that to have a map without plant data is not useful to a cartographer in a botanic garden
setting.
54

The abilities to have multiple users being able to query data or edit data
and having a way of making information available to visitors all ranked highly. This
shows a desire by the current users to be able to have more people access the
information, and to make the information generally more accessible. This would allow
the person in charge of mapping and the database more time to focus on other tasks,
and less time spent on tasks that the other people could answer themselves if the data
were more accessible.
The three questions which received the lowest average scores, averaging
“Relatively Unimportant” were the topics of handling multiple coordinate systems, 3-
D information, and bar code data. These results could be viewed as these features are
not used on a regular basis, or that these features are not available on the computerized
mapping software these institutions currently use.
I
55
I
Chapter 5
SURVEY I11
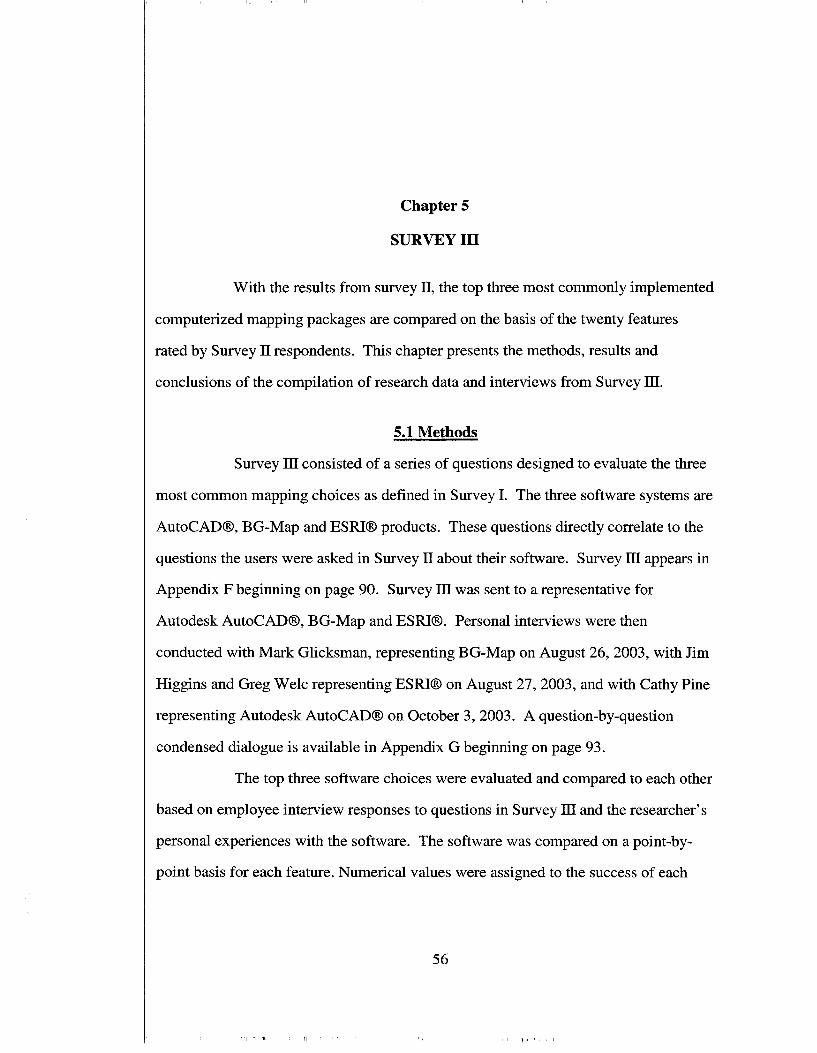
With the results from survey 11, the top three most commonly implemented
computerized mapping packages are compared on the basis of the twenty features
rated by Survey II respondents. This chapter presents the methods, results and
conclusions of the compilation of research data and interviews from Survey III.
5.1 Methods
Survey III consisted of a series of questions designed to evaluate the three
most common mapping choices as defined in Survey I. The three software systems are
AutoCADm, BG-Map and ESRIB products. These questions directly correlate to the
questions the users were asked in Survey II about their software. Survey III appears in
Appendix F beginning on page 90. Survey III was sent to a representative for
Autodesk AutoCADB, BG-Map and ESRIB. Personal interviews were then
conducted with Mark Glicksman, representing BG-Map on August 26,2003, with Jim
Higgins and Greg Welc representing ESRI@ on August 27,2003, and with Cathy Pine
representing Autodesk AutoCADB on October 3,2003. A question-by-question
condensed dialogue is available in Appendix G beginning on page 93.
The top three software choices were evaluated and compared to each other
based on employee interview responses to questions in Survey III and the researcher's
personal experiences with the software. The software was compared on a point-by-
point basis for each feature. Numerical values were assigned to the success of each I
56

I
software package to each question. The scores were totaled for each of the three
software choices to determine which software package is the most flexible.
5.2 Results
The three software systems were evaluated and compared to each other
based on their company representatives' answers to the questions in Survey ID and the
researcher's personal experience. A system for creating a numerical value was created
to weigh the usability of the software choices. If a software system was able to
accomplish the task, one point was given, and if the system could not accomplish the
task, no points were given. In an instance where BG-Map, for example, could not
accomplish the task, but the task could be completed by leaving the BG-Map interface
and going to AutoCADB or BG-BASETM interface, a half a point was given. If there
were multiple ways to answer the question, a point was given for each. Deductions
were not incurred if the user would have to purchase an additional extension to receive
the benefit. Then the points for that question were weighted according to the average
value assigned by the Users in Survey II.
Examine the following as a case in point:
"How available is the ability to handle topographic information?" Autodesk@ products can handle topographic information as a layer. BG- Map refers clients to use AutoCADB and create topographic information as a separate layer in AutoCADB. With ESRIB, the user has two options. First, they can obtain shaded relief information from the United States Geological Survey (USGS). Second, the user can purchase an additional extension like Spatial Analysis and 3D AnalystTM for additional capabilities.
57
AutoCADB can complete the task, so it is awarded one point. BG-Map
requires the user leave the BG-Map interface to complete the task in AutoCADB, so
BG-Map is awarded one-half a point. ESRIB has two options available for the user,
so it is awarded two points.
In Survey 11, the average user value of importance for this question was
3.32 points. Multiplying the average user value by the points received, Autodesk
products are awarded 3.32 points, BG-Map is awarded 1.66 points, and ESRIB
Products are awarded 6.64 points. A summary diagram of the points is found in Table
2: Top Three Software Packages Scored According to their Capabilities of Performing
Twenty Tasks that the Users found Important in their Computerized Mapping
Softwareavailable on page 59.
This process was completed for all twenty questions on Survey IT. The
points were totaled for each software option. ESRIB Products obtained the greatest
number of points, with Autodesk products having the second largest tally of points and
BG-Map having the smallest total points. It may therefore be concluded that ESRIB
Products are the most accommodating, Autodesk products are the next most
accommodating, and BG-Map is the least accommodating for the Survey 11
respondents stated desires.
58


![Geographic Information System [GIS]](https://img.pdfslide.us/doc/110x75/56813e57550346895da84a4e/geographic-information-system-gis-568e78fe5e678.jpg)