Embed Size (px)
Citation preview

Selection and Market Reallocation: Productivity Gains from Multinational Production
Laura Alfaro Maggie X. Chen
Working Paper 12-111

Working Paper 12-111
Copyright © 2015 by Laura Alfaro and Maggie X. Chen
Working papers are in draft form. This working paper is distributed for purposes of comment and discussion only. It may not be reproduced without permission of the copyright holder. Copies of working papers are available from the author.
Selection and Market Reallocation: Productivity Gains from Multinational Production
Laura Alfaro Harvard Business School
Maggie X. Chen George Washington University
Selection and Market Reallocation:
Productivity Gains from Multinational Production�
Laura Alfaroy
Harvard Business School and NBERMaggie X. Chenz
George Washington University
September 2015
Abstract
Assessing the productivity gains from multinational production has been a vi-tal topic of economic research and policy debate. Positive aggregate productivitygains are often attributed to within-�rm productivity improvement; however, analternative, less emphasized explanation is between-�rm selection and market re-allocation, whereby competition from multinationals leads to factor reallocationand the survival of only the most productive domestic �rms. We investigate theroles of the two di¤erent mechanisms in determining the aggregate productivitygains by exploring their distinct predictions on the distributions of domestic �rms:within-�rm productivity improvement shifts the productivity and revenue distri-butions rightward while between-�rm selection and market reallocation raise theleft truncation of the distributions and shift revenue leftward. Using a rich cross-country �rm-level panel dataset, we �nd signi�cant evidence of both mechanisms,but between-�rm selection and market reallocation accounts for the majority ofaggregate productivity gains, suggesting that ignoring this channel could lead tosubstantial bias in understanding the nature of gains from multinational produc-tion.JEL Codes: F2, O1, O4Key Words: Productivity gains, multinational production, selection, market
reallocation, and within-�rm productivity
�We thank Ann Harrison, Daniel Lederman, Aaditya Mattoo, Andrés Rodríguez-Clare, Carolina Villegas,Matt Weinzierl, Stephen Yeaple, and participants at the World Bank Structural Transformation and EconomicGrowth Conference, Columbia Business School Workshop on the Organizational Economics of Multinationals,Washington Area International Trade Symposium, Rocky Mountain Empirical Trade Conference, Texas A&MFDI and Labor Conference, World Bank International Trade and Integration, the Barcelona GSE SummerForum, the NBER Summer Institute �International Trade & Macroeconomics, the Empirical Investigations ofInternational Trade (EIIT) Conference, the Global Fragmentation of Production and Trade Policy Conference,and Bank of Spain "Structural Reforms in the Wake of Recovery: Where do We Stand?" Conference, andBoston College, Georgetown, Southern Methodist University, Carleton University, U.S. Census Bureau, GeorgeWashington University (international business), George Mason University, University of Brussels-ECARES,and University of Sao Paulo seminars for insightful comments and suggestions. Funding from the World BankStructural Transformation and Economic Growth project is gratefully acknowledged.
yEmail: [email protected]: [email protected].
1 Introduction
Assessing the impact of multinational activity on the productivity of host countries has been a
major topic of economic research and policy debate. Nations with greater openness to multi-
national production have been shown to exhibit, on average, higher aggregate productivity
and faster economic growth. This stylized fact, examined in numerous macro-level studies,1 is
often attributed to within-�rm productivity improvement, resulting from, for example, pos-
itive productivity spillover from foreign multinationals or the productivity self-upgrading of
domestic �rms.2 There is, however, a less emphasized, alternative explanation centering on
between-�rm selection and market reallocation. Greater openness to multinational produc-
tion leads to tougher competition in host-country product and factor markets, resulting in
a reallocation of resources from domestic to multinational and from less productive to more
productive �rms. This resource reallocation forces the least e¢ cient domestic �rms to exit the
market and increases the market share of the most productive �rms, raising the host country�s
average productivity.
Although both channels imply aggregate productivity gains from foreign multinational
production, they represent two distinct margins at which this occurs. Within-�rm produc-
tivity improvement operates through an "intensive margin" whereby foreign multinational
production raises the productivity of individual continuing domestic �rms; between-�rm se-
lection and market reallocation, in contrast, work at an "extensive margin" whereby foreign
multinational competition induces the exits of the least productive domestic �rms and in-
creases the weights of the most productive �rms in aggregate output. Their implications for
domestic economies are also sharply di¤erent: Within-�rm productivity improvement implies
domestic �rm growth whereas selection and market reallocation result in a contraction of
domestic industries. Distinguishing between the two channels is thus essential for improving
our understanding of the mechanisms by which an economy responds to foreign multinational
competition and setting corresponding economic policies. While an extensive body of research
has assessed the productivity spillover e¤ect of multinational �rms, little analysis has investi-
gated the role of selection and reallocation in the aggregate impact of multinational production
and how the two channels� distinctively as well as jointly� in�uence the potential gains from
1See, for example, Borensztein et al. (1998) and Alfaro et al. (2004).2See Harrison and Rodríguez-Clare (2011) and Kose et al. (2011) for recent overviews of the literature
on the relationship between multinational production, productivity, and economic growth. Evidence suggeststhat multinational production exerts a positive e¤ect on economic growth conditional on local conditions, suchas su¢ cient human capital stock and relatively developed �nancial markets. At the macro level, the cross-country correlations between average FDI-to-GDP ratio and average TFP and TFP growth are 0.27 and 0.26,respectively (sources: World Bank World Development Indicators and Penn World Tables; data: 1980-2005).
2
multinational competition.3
This paper disentangles the roles of within-�rm productivity improvement and between-
�rm selection and market reallocation in determining the aggregate productivity gains from
multinational production and investigates their relative importances. This cannot be accom-
plished by simply examining the relationship between multinational production and host-
country average productivity, as both channels predict a positive relationship. We therefore
use a general analytical framework based on a standard model of multinational production
and heterogeneous �rms to investigate how foreign multinational competition might a¤ect
host-country economies through within-�rm productivity improvement and between-�rm se-
lection and market reallocation, respectively. The predictions, generalizable to a broader class
of theoretical setups, explore the variations in how the two channels in�uence the distributions
of domestic �rms in dimensions including productivity, revenue, employment, and survival,
thereby enabling us to empirically distinguish between the two di¤erent channels.
In particular, greater competition from multinational production is predicted to raise
factor prices and reallocate labor and capital from domestic to multinational and from less
productive to more productive �rms. The between-�rm reallocation in labor market erodes
the revenue of individual domestic �rms and shifts the revenue distribution leftward, while the
between-�rm reallocation of capital results in higher cuto¤ revenue for domestic �rms. Both
e¤ects cause an increase in the cuto¤ productivity and force the least e¢ cient domestic �rms
to exit the market. In contrast, within-�rm productivity improvement implies a rightward
shift of the productivity distribution of surviving domestic �rms. The revenue distribution
might shift either rightward or leftward depending on the extent to which the between-�rm
e¤ect o¤sets the within-�rm e¤ect.
These hypotheses are evaluated empirically using a cross-country �rm panel dataset, drawn
from Orbis, that contains comprehensive �nancial, operation, and ownership information for
public and private manufacturing companies in over 30 developed and developing countries for
the 2002-2007 period. To account for the endogenous entry decision of multinational �rms, we
adopt the instrument and the speci�cation motivated by the analytical framework, examining
the entry decision of multinationals as a function of not only all time-variant country-pair
industry factors but also multinationals�ex-ante productivity and their host-country speci�c
3Although the role of selection and reallocation is underemphasized in evaluating gains from multinationalproduction, its role is well established in assessing the productivity gains from trade liberalization (see Melitz,2003). An important empirical study in this area, Pavcnik (2002), �nds that of the 19.3 percent manufactur-ing productivity growth from trade liberalization in Chile during 1979-1986, 12.7 percent is attributable toreallocation of resources from less to more e¢ cient producers and 6.6 percent to increased productivity withinplants. See Melitz and Redding (2013) for a recent overview.
3
�xed-cost shifter re�ecting, for example, changes in multinationals�real �nancial constraints
to operate in host countries. Speci�cally, we use changes in multinational headquarters�cash
�ow measured in the host-country PPP value as a proxy; multinationals that experience
a positive �nancial shock due to, for example, high investment returns in headquarters or
an appreciation of headquarter-country currency are expected to have a reduced �nancial
constraint in foreign investments� especially in host countries where the real value of the shock
is large� and thus more likely to make new entry. But such idiosyncratic �nancial shocks,
unlike other �rm characteristics such as productivity or the level of cash �ow, are unlikely
to be directly correlated with the future productivity growth of host-country domestic �rms,
thereby o¤ering an exclusion restriction for identifying the causal e¤ects of multinational
production.
We �nd that within-�rm productivity improvement and between-�rm selection and reallo-
cation are two signi�cant but distinctly di¤erent sources of gains from multinational produc-
tion. Entry of multinational �rms shifts the revenue distribution of domestic �rms leftward
while raising the cuto¤ productivity and the cuto¤ revenue. These results imply an increase
in factor prices and a decrease in the aggregate price as a result of increased competition and
reallocation in factor markets. We �nd consistent evidence when examining the employment
distribution and the wage of domestic �rms. After new multinational entry, smaller domestic
�rms are particularly crowded out in the labor market and the average wage rises. In con-
trast, the productivity distribution of domestic �rms shifts rightward, suggesting within-�rm
productivity improvement among surviving domestic �rms. In quantifying the productivity
gains from multinational production, we �nd based on our preferred estimations that when the
probability of a new multinational entry increases by 10 percentage points, aggregate weighted
domestic productivity increases by 1.6 percent across countries. Between-�rm selection and
reallocation alone account for 1.4-percent productivity gains, while within-�rm productivity
improvement by itself accounts for 0.2 percent. These results highlight that a substantial
share of productivity gains are channeled through between-�rm selection and reallocation.
Ignoring this channel could therefore drastically bias our understanding of the origin and the
magnitude of the productivity gains from multinational production.
We perform a series of additional exercises, including using alternative moments of the
distributions, re-estimating our parameters with di¤erent data samples such as industries
with relatively homogeneous products (to address potential markup issues in productivity
measures) and countries with better data coverage, including additional controls such as trade
growth, performing a falsi�cation test by manually truncating the data at the left tail, and
4
exploring between-industry factor reallocation and spillover with measures of industry-pairs�
relatedness in factor demand and technology. In all the exercises, we �nd consistent evidence
of between-�rm selection and market reallocation.
Our study is closely related to several strands of the literature. First, as mentioned
above, we build on an extensive empirical literature that assesses the existence of productiv-
ity spillover from multinational to domestic �rms. One of the earliest contributions to this
literature is Aitken and Harrison (1999) who �nd evidence of negative spillover in a panel
of Venezuelan manufacturing enterprises for the period 1975-1989. The authors attribute
the result to a market-stealing e¤ect whereby foreign multinational �rms steal market share
from domestic �rms. That paper soon spawned a large series of empirical studies. Keller
and Yeaple (2009), for example, �nd signi�cant evidence of within-industry positive spillover
from foreign multinational to domestic �rms in the United States. Similar results are found
in Aghion et al. (2012) for a panel of medium-sized and large Chinese enterprises for the
period 1998-2007. Javorcik (2004), exploring spillover through vertical production linkages in
Lithuania between 1996 and 2000, shows that multinational production generates positive ex-
ternalities via backward production linkage from multinational a¢ liates to local intermediate
input suppliers. Carluccio and Fally (2013) examine how productivity spillover via backward
linkages depend on technological incompatibilities between foreign and domestic technologies
and show that a decrease in the cost of inputs compatible with the foreign technology has het-
erogeneous e¤ects on domestic �rms. Studies by Arnold and Javorcik (2009) and Guadalupe
et al. (2012), which account for the endogenous acquisition decisions of foreign multinational
�rms, �nd that foreign ownership leads to signi�cant productivity spillover in acquired plants
even after addressing the acquisition decisions. Another� much less emphasized� factor that
could also lead to productivity improvement within domestic �rms is domestic �rms�produc-
tivity self-upgrading in response to foreign multinational competition. Bao and Chen (2014)
examine the issue by constructing a database of foreign investment news and investigating the
responses of domestic �rms to the threats of new multinational entry. Their analysis shows
that domestic �rms respond signi�cantly to the threats by increasing productivity, innovation,
and labor training and adjusting product composition.4
In contrast to the ample literature on within-�rm productivity improvement, evidence
4Bao and Chen (2014) suggests that within-�rm productivity improvement could also occur through within-�rm selection and reallocation whereby domestic �rms respond to foreign multinational competition by adjust-ing their product composition and reallocating resources to focus on competitive products. In this paper, wedo not attempt to disentangle the possible causes of within-�rm productivity improvement� a subject beyondthe scope of this research, but we note that the importance of selection and market reallocation could likelybe even greater if within-�rm selection and reallocation is also taken into account.
5
on the between-�rm selection and reallocation e¤ect of multinational production is scarce. A
number of studies o¤er related insights by evaluating the e¤ects of multinational production on
domestic wage rates and �nancial constraints. Aitken, Harrison, and Lipsey (1996) investigate
the impact of foreign-owned plants on the wages of domestically owned establishments in
Mexico and Venezuela and report an increase of industry wages due to foreign multinational
production. Similarly, Feenstra and Hanson (1997) �nd a higher level of maquiladora activity
to lead to a higher share of total wages going to skilled (nonproduction) workers in Mexico,
interpreting their result as increased demand for skilled labor from foreign multinational �rms.
Exploring the e¤ect of multinational production on domestic �nancial markets, Harrison and
McMillan (2003) �nd that domestic �rms are more credit-constrained than foreign �rms and
borrowing by foreign �rms exacerbates domestic �rms�credit constraints.5 Ramondo (2009),
using a panel of Chilean manufacturing plants, �nds entry by foreign plants to be associated
negatively with the market shares of domestic �rms and positively with the productivity of
domestic incumbents. Kosova (2012), analyzing exit and growth sales of domestic �rms in the
Czech Republic, �nds evidence consistent with crowding out and technology spillover.
Our paper contributes to the above literature by evaluating the distinct roles of within-
�rm productivity improvement and between-�rm reallocation in determining the gains from
multinational production. First, our micro theoretical framework incorporates both aspects
of multinational production into a standard �rm-heterogeneity model and informs a novel
empirical strategy for assessing their relative importances that applies beyond the model�s
speci�c attributes. Second, our empirical analysis accounts for the endogenous entry decision
of multinational �rms and the potential reverse causality between host-country productiv-
ity and multinational production using speci�cations motivated by the theory. Third, our
approach, by allowing both within-�rm and between-�rm e¤ects to play a role instead of fo-
cusing on one channel at a time, enables us to perform counterfactual analysis and quantify
the aggregate and the decomposed gains from greater openness to multinational production.
Our analysis thus o¤ers a uni�ed framework for understanding and evaluating the di¤erent
gains from multinational production.
More broadly, assessing the roles of spillover, selection, and reallocation from tougher
competition has been an important subject of inquiry in many �elds of economics. In addition
to trade (e.g. Pavcnik, 2002; Melitz, 2003), Combes et al. (2012), for example, study the role of
5 In contrast to Harrison and McMillian (2003), Harrison, Love, and McMillian (2004), using Worldscope dataon 7,079 �rms in 28 countries, �nd FDI in�ows to be associated with a reduction in �rms��nancing constraints.Harrison and Rodríguez-Clare (2011) note that these contrasting results point to policy complementarities likethose between FDI and local �nancial markets (see Alfaro et al., 2004, 2010).
6
agglomeration forces (externalities) versus selection in explaining the productivity advantage
of large cities,6 Bloom et al. (2012) analyze the e¤ects of technology spillover versus market
rivalry in R&D, and Acemoglu et al. (2013) examine how reallocation a¤ects the implications
of subsidies for growth and welfare in a model of �rm innovation with endogenous entry
and exit. Our work also connects to the growing literature that emphasizes the productivity
e¤ect of resource misallocation across establishments (see Hsieh and Klenow, 2009; Alfaro
et al., 2009; Bartelsman, Haltiwanger, and Scarpetta, 2013). Echoing these studies, our
paper suggests that the reallocation of capital and labor as a result of increased multinational
production could lead to important productivity gains.
Our �ndings have implications of interest to both policy and academic debates on FDI,
as understanding the sources of potential gains from multinational production is critical to
designing economic policies (Harrison and Rodríguez-Clare, 2011). If within-�rm produc-
tivity improvement is the primary source of productivity gains, special treatment to foreign
�rms, often provided by host countries in the form of tax breaks and �nancial incentives,
might be justi�able. But if productivity gains arise primarily from between-�rm selection
and reallocation as shown in the paper, it would be important to improve domestic market
conditions, including labor mobility and credit access, to facilitate the gains from competition
and resource reallocation.
The rest of the paper is organized as follows. Section 2 presents the analytical framework.
Section 3 describes the data used in the empirical analysis. Sections 4 and 5 report the
estimation results and robustness analyses, respectively. Section 6 quanti�es and decomposes
the productivity gains from increased multinational production. Section 7 concludes.
2 Framework
In this section, we employ a standard model of heterogeneous �rms and multinational pro-
duction, adapted from the work of Melitz (2003) and Helpman, Melitz and Yeaple (2004), to
help guide and provide intuition to the empirical analysis.7
6Both Combes et al (2012) and our paper are motivated by stylized models in the �rm heterogeneityliterature. Incorporating Melitz and Ottaviano (2008) with urban economics models, Combes et al. (2012)develop a new quantile regression approach to compare the distribution of establishment productivity foreach sector across French areas of di¤erent density. Our paper, built on Helpman, Melitz and Yeaple (2004)and Melitz (2003), examines the various gains from multinational production by exploring its e¤ects on theproductivity and revenue distributions of domestic �rms. Our approach estimates directly the moments derivedfrom the model to infer and decompose the e¤ects of multinational production on various outcome variablesincluding aggregate price, capital price, productivity spillover, and aggregate productivity.
7 In the robustness section, we discuss various considerations and empirical extensions to the model.
7
2.1 Environment
Suppose the world consists of two sectors, one di¤erentiated and one homogeneous. The
homogeneous good serves as the numeraire. In the di¤erentiated sector, each �rm produces a
di¤erent variety and draws a productivity level �. There are n+1 countries and, as in Melitz
(2003), countries are assumed to be symmetric.8 Given a CES utility function, the demand
function for the di¤erentiated good is given by
x(�) =E
P
�p(�)
P
��"; (1)
where x(�) denotes the quantity of demand for a given variety, E the aggregate expenditure on
the di¤erentiated product, p(�) the price of the product variety, P ��R�2 p(�)
1�"d�� 11�" the
aggregate price, the set of available varieties, and " � 1=(1� �) > 1 the demand elasticity.Production requires a marginal cost w=� where w is the common wage rate. In addition
to the home country (D), �rms may also serve a foreign country via either exports (X) or
multinational production (M). Firms must incur an iceberg trade cost d > 1 when exporting
and a �xed cost cfi=' for each market served where c is the unit capital price, fi denotes the
units of capital required in the �xed costs of domestic production (fD), exports (fX), and
foreign multinational production (fM ), and ' is a �rm-speci�c �xed-cost shifter governed by a
cumulative distribution function H('). The �xed-cost shifter captures cross-�rm variation in,
for example, �nancial constraints and foreign business networks, factors that could potentially
lead to heterogeneous levels of �xed costs. Heterogeneity in the foreign-market �xed cost also
allows the model to accommodate the possibility that two �rms with identical productivity �
may di¤er in their choices between exports and multinational production.
The pro�t-maximizing strategy is to set p(�) = w= (��), which yields the revenue and
pro�t functions, denoted as ri(�) and �i(�) with i = D;X;and M , below:
ri(�) =E
'
��P�
wdi
�"�1; �i(�) =
ri(�)
"� cfi='; (2)
where dX = d > 1, and dD = dM = 1. Firms will serve the home country if �D(�) > 0 and the
foreign country via exports if �X(�) > �M (�) and �X(�) > 0 and multinational production
if �M (�) > �X(�). These conditions generate the cuto¤ productivities for domestic �rms,
8As noted in Melitz (2003), this assumption ensures factor-price equalization so the analysis can examinemarket reallocation e¤ects that are independent of wage di¤erences. However, the assumption can be relaxedwithout altering our predictions and empirical strategy outlined later in the section, as they apply beyond thespeci�c attributes of the model.
8
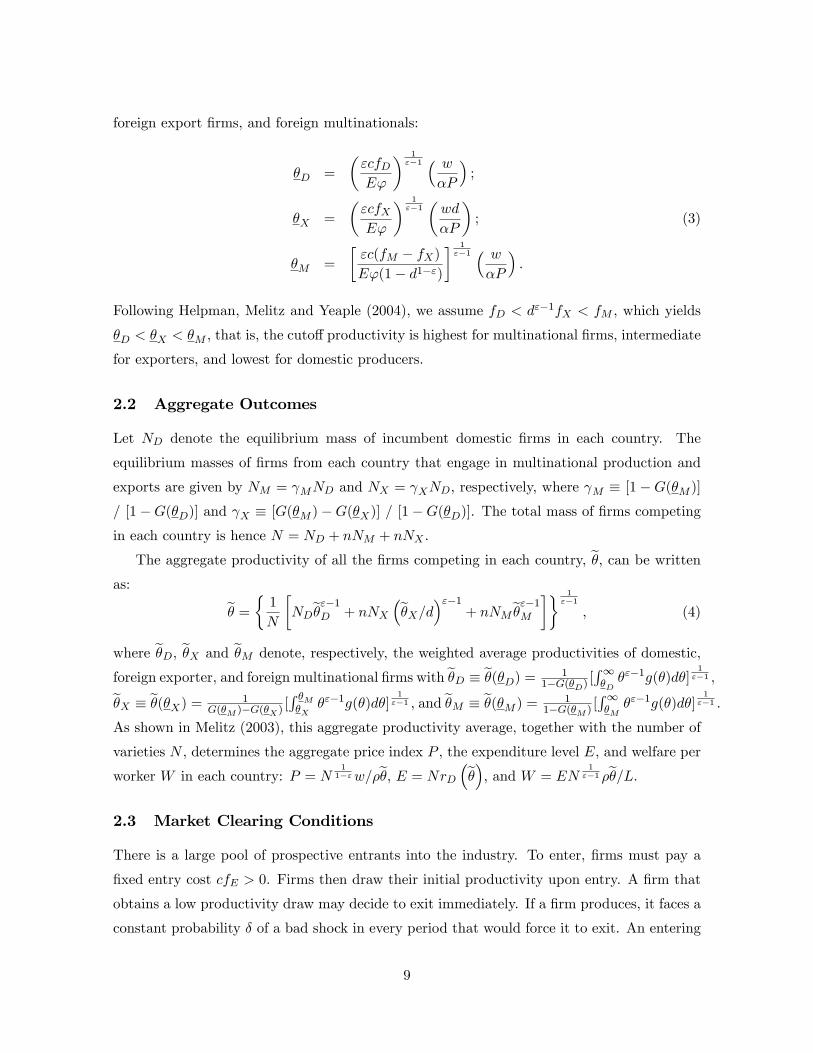
foreign export �rms, and foreign multinationals:
�D =
�"cfDE'
� 1"�1 � w
�P
�;
�X =
�"cfXE'
� 1"�1�wd
�P
�; (3)
�M =
�"c(fM � fX)E'(1� d1�")
� 1"�1 � w
�P
�:
Following Helpman, Melitz and Yeaple (2004), we assume fD < d"�1fX < fM , which yields
�D < �X < �M , that is, the cuto¤ productivity is highest for multinational �rms, intermediate
for exporters, and lowest for domestic producers.
2.2 Aggregate Outcomes
Let ND denote the equilibrium mass of incumbent domestic �rms in each country. The
equilibrium masses of �rms from each country that engage in multinational production and
exports are given by NM = MND and NX = XND, respectively, where M � [1�G(�M )]= [1�G(�D)] and X � [G(�M )�G(�X)] = [1�G(�D)]. The total mass of �rms competingin each country is hence N = ND + nNM + nNX .
The aggregate productivity of all the �rms competing in each country, e�, can be writtenas: e� = � 1
N
�NDe�"�1D + nNX
�e�X=d�"�1 + nNMe�"�1M
�� 1"�1
; (4)
where e�D, e�X and e�M denote, respectively, the weighted average productivities of domestic,
foreign exporter, and foreign multinational �rms with e�D � e�(�D) = 11�G(�D)
[R1�D�"�1g(�)d�]
1"�1 ,e�X � e�(�X) = 1
G(�M )�G(�X)[R �M�X
�"�1g(�)d�]1
"�1 , and e�M � e�(�M ) = 11�G(�M )
[R1�M�"�1g(�)d�]
1"�1 .
As shown in Melitz (2003), this aggregate productivity average, together with the number of
varieties N , determines the aggregate price index P , the expenditure level E, and welfare per
worker W in each country: P = N1
1�"w=�e�, E = NrD �e��, and W = EN1
"�1 �e�=L.2.3 Market Clearing Conditions
There is a large pool of prospective entrants into the industry. To enter, �rms must pay a
�xed entry cost cfE > 0. Firms then draw their initial productivity upon entry. A �rm that
obtains a low productivity draw may decide to exit immediately. If a �rm produces, it faces a
constant probability � of a bad shock in every period that would force it to exit. An entering
9
�rm with productivity � would exit if its pro�t level were negative or would produce and earn
�(�) in every period until it is hit with the bad shock and forced to exit.
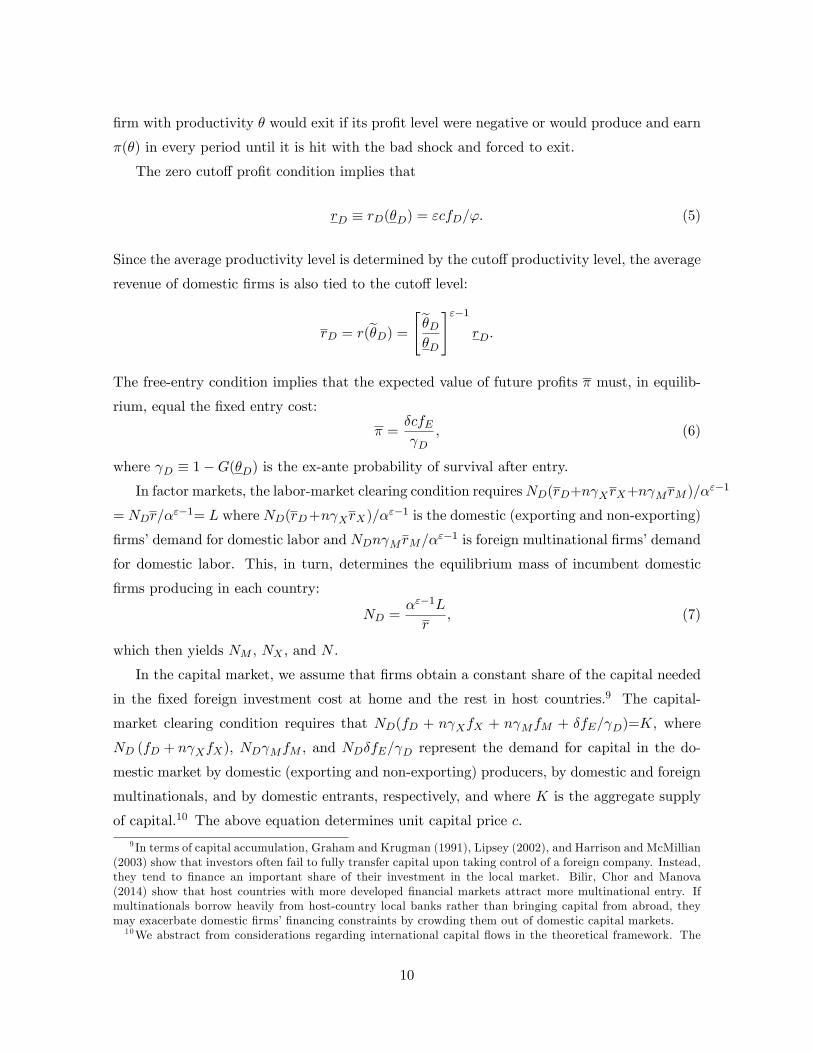
The zero cuto¤ pro�t condition implies that
rD � rD(�D) = "cfD=': (5)
Since the average productivity level is determined by the cuto¤ productivity level, the average
revenue of domestic �rms is also tied to the cuto¤ level:
rD = r(e�D) = "e�D�D
#"�1rD:
The free-entry condition implies that the expected value of future pro�ts � must, in equilib-
rium, equal the �xed entry cost:
� =�cfE D
; (6)
where D � 1�G(�D) is the ex-ante probability of survival after entry.In factor markets, the labor-market clearing condition requiresND(rD+n XrX+n MrM )/�
"�1
= NDr=�"�1= L where ND(rD+n XrX)=�"�1 is the domestic (exporting and non-exporting)
�rms�demand for domestic labor and NDn MrM=�"�1 is foreign multinational �rms�demand
for domestic labor. This, in turn, determines the equilibrium mass of incumbent domestic
�rms producing in each country:
ND =�"�1L
r; (7)
which then yields NM , NX , and N .
In the capital market, we assume that �rms obtain a constant share of the capital needed
in the �xed foreign investment cost at home and the rest in host countries.9 The capital-
market clearing condition requires that ND(fD + n XfX + n MfM + �fE= D)=K, where
ND (fD + n XfX), ND MfM , and ND�fE= D represent the demand for capital in the do-
mestic market by domestic (exporting and non-exporting) producers, by domestic and foreign
multinationals, and by domestic entrants, respectively, and where K is the aggregate supply
of capital.10 The above equation determines unit capital price c.
9 In terms of capital accumulation, Graham and Krugman (1991), Lipsey (2002), and Harrison and McMillian(2003) show that investors often fail to fully transfer capital upon taking control of a foreign company. Instead,they tend to �nance an important share of their investment in the local market. Bilir, Chor and Manova(2014) show that host countries with more developed �nancial markets attract more multinational entry. Ifmultinationals borrow heavily from host-country local banks rather than bringing capital from abroad, theymay exacerbate domestic �rms��nancing constraints by crowding them out of domestic capital markets.10We abstract from considerations regarding international capital �ows in the theoretical framework. The
10
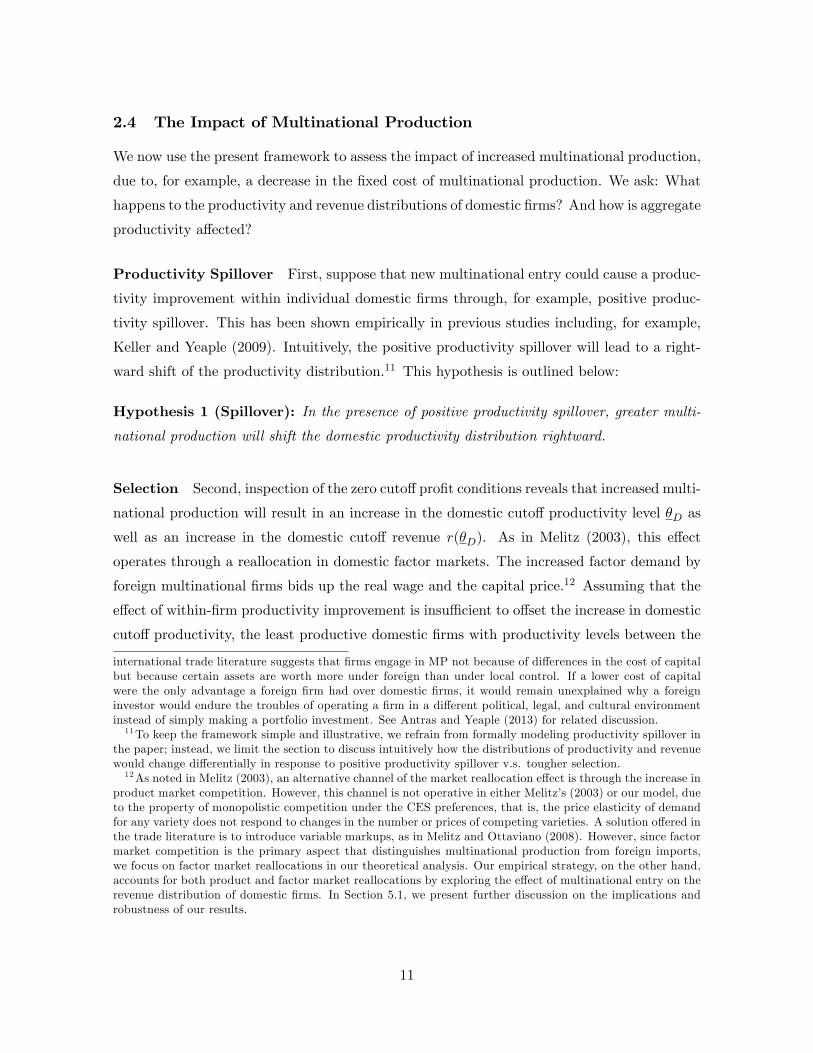
2.4 The Impact of Multinational Production
We now use the present framework to assess the impact of increased multinational production,
due to, for example, a decrease in the �xed cost of multinational production. We ask: What
happens to the productivity and revenue distributions of domestic �rms? And how is aggregate
productivity a¤ected?
Productivity Spillover First, suppose that new multinational entry could cause a produc-
tivity improvement within individual domestic �rms through, for example, positive produc-
tivity spillover. This has been shown empirically in previous studies including, for example,
Keller and Yeaple (2009). Intuitively, the positive productivity spillover will lead to a right-
ward shift of the productivity distribution.11 This hypothesis is outlined below:
Hypothesis 1 (Spillover): In the presence of positive productivity spillover, greater multi-
national production will shift the domestic productivity distribution rightward.
Selection Second, inspection of the zero cuto¤pro�t conditions reveals that increased multi-
national production will result in an increase in the domestic cuto¤ productivity level �D as
well as an increase in the domestic cuto¤ revenue r(�D). As in Melitz (2003), this e¤ect
operates through a reallocation in domestic factor markets. The increased factor demand by
foreign multinational �rms bids up the real wage and the capital price.12 Assuming that the
e¤ect of within-�rm productivity improvement is insu¢ cient to o¤set the increase in domestic
cuto¤ productivity, the least productive domestic �rms with productivity levels between the
international trade literature suggests that �rms engage in MP not because of di¤erences in the cost of capitalbut because certain assets are worth more under foreign than under local control. If a lower cost of capitalwere the only advantage a foreign �rm had over domestic �rms, it would remain unexplained why a foreigninvestor would endure the troubles of operating a �rm in a di¤erent political, legal, and cultural environmentinstead of simply making a portfolio investment. See Antras and Yeaple (2013) for related discussion.11To keep the framework simple and illustrative, we refrain from formally modeling productivity spillover in
the paper; instead, we limit the section to discuss intuitively how the distributions of productivity and revenuewould change di¤erentially in response to positive productivity spillover v.s. tougher selection.12As noted in Melitz (2003), an alternative channel of the market reallocation e¤ect is through the increase in
product market competition. However, this channel is not operative in either Melitz�s (2003) or our model, dueto the property of monopolistic competition under the CES preferences, that is, the price elasticity of demandfor any variety does not respond to changes in the number or prices of competing varieties. A solution o¤ered inthe trade literature is to introduce variable markups, as in Melitz and Ottaviano (2008). However, since factormarket competition is the primary aspect that distinguishes multinational production from foreign imports,we focus on factor market reallocations in our theoretical analysis. Our empirical strategy, on the other hand,accounts for both product and factor market reallocations by exploring the e¤ect of multinational entry on therevenue distribution of domestic �rms. In Section 5.1, we present further discussion on the implications androbustness of our results.
11
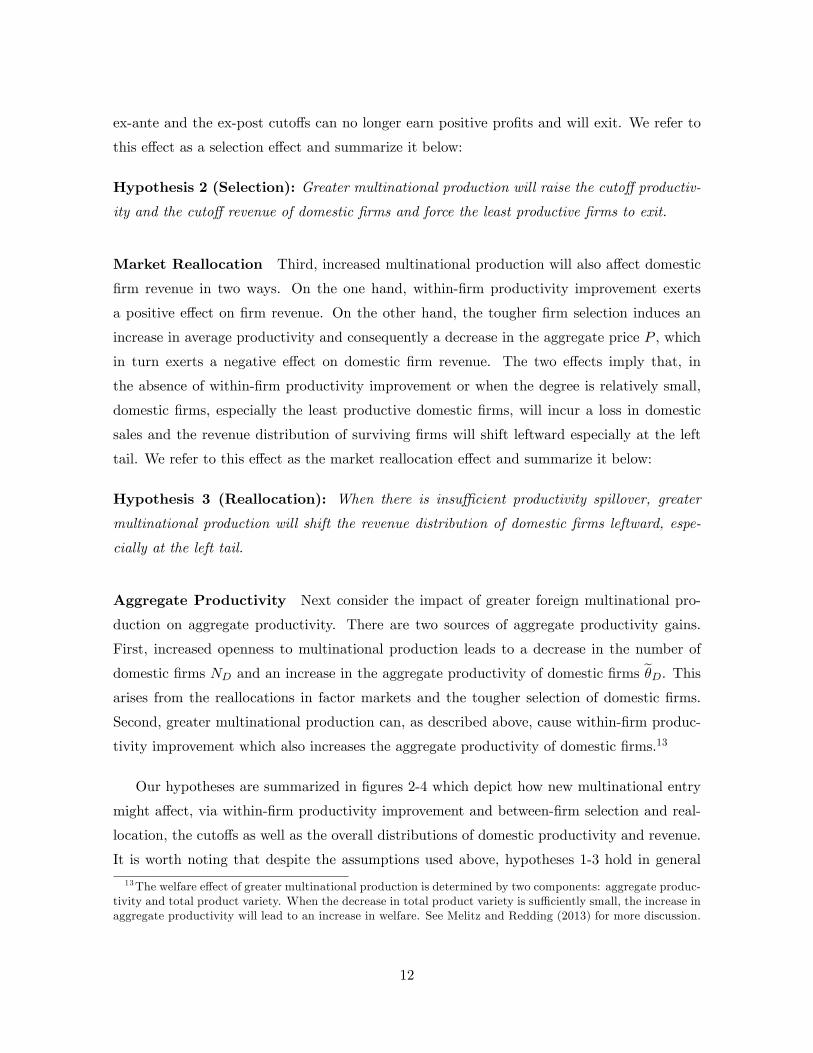
ex-ante and the ex-post cuto¤s can no longer earn positive pro�ts and will exit. We refer to
this e¤ect as a selection e¤ect and summarize it below:
Hypothesis 2 (Selection): Greater multinational production will raise the cuto¤ productiv-
ity and the cuto¤ revenue of domestic �rms and force the least productive �rms to exit.
Market Reallocation Third, increased multinational production will also a¤ect domestic
�rm revenue in two ways. On the one hand, within-�rm productivity improvement exerts
a positive e¤ect on �rm revenue. On the other hand, the tougher �rm selection induces an
increase in average productivity and consequently a decrease in the aggregate price P , which
in turn exerts a negative e¤ect on domestic �rm revenue. The two e¤ects imply that, in
the absence of within-�rm productivity improvement or when the degree is relatively small,
domestic �rms, especially the least productive domestic �rms, will incur a loss in domestic
sales and the revenue distribution of surviving �rms will shift leftward especially at the left
tail. We refer to this e¤ect as the market reallocation e¤ect and summarize it below:
Hypothesis 3 (Reallocation): When there is insu¢ cient productivity spillover, greater
multinational production will shift the revenue distribution of domestic �rms leftward, espe-
cially at the left tail.
Aggregate Productivity Next consider the impact of greater foreign multinational pro-
duction on aggregate productivity. There are two sources of aggregate productivity gains.
First, increased openness to multinational production leads to a decrease in the number of
domestic �rms ND and an increase in the aggregate productivity of domestic �rms e�D. Thisarises from the reallocations in factor markets and the tougher selection of domestic �rms.
Second, greater multinational production can, as described above, cause within-�rm produc-
tivity improvement which also increases the aggregate productivity of domestic �rms.13
Our hypotheses are summarized in �gures 2-4 which depict how new multinational entry
might a¤ect, via within-�rm productivity improvement and between-�rm selection and real-
location, the cuto¤s as well as the overall distributions of domestic productivity and revenue.
It is worth noting that despite the assumptions used above, hypotheses 1-3 hold in general
13The welfare e¤ect of greater multinational production is determined by two components: aggregate produc-tivity and total product variety. When the decrease in total product variety is su¢ ciently small, the increase inaggregate productivity will lead to an increase in welfare. See Melitz and Redding (2013) for more discussion.
12
settings. Speci�cally, within-�rm productivity improvement from increased multinational pro-
duction should imply a rightward shift of the distribution of domestic �rm�s productivity even
though the degree of improvement could be conditional on the productivities of domestic and
foreign multinational �rms. Between-�rm selection and reallocation due to greater multina-
tional production should result in exits of the least productive domestic �rms even in models
with variable markups as shown in Melitz and Ottaviano (2008) (see more discussion in Sec-
tion 5.1). Our empirical analysis exploits these generalizable predictions to quantify the gains
from multinational production.
3 Cross-Country Firm Financial and Ownership Data
We use a cross-country manufacturing �rm-level panel dataset, drawn from Orbis published
by Bureau van Dijk, that contains comprehensive �nancial, operation, and ownership in-
formation for public and private companies in over 30 developed and developing countries.
Bureau van Dijk is a leading source of company information and business intelligence and is
extensively used by empirical �rm-level studies in international trade, foreign direct invest-
ment, and other �elds (see, for example, Javorcik, 2004; and more recently, Bloom, Sadun,
and Van Reenen, 2012; Bloom et al., forthcoming). Orbis combines information from around
100 sources and information providers. Primary sources include Tax Authorities, Ministry
of Statistics, Provincial Bureau of Legal Entities, Securities and Investments Commissions,
National Banks, Municipal Chambers of Commerce, and State Register of Accounts. Over
99 percent of the companies included in Orbis are private. For each company, the dataset
reports: a) detailed 10-year �nancial information including 26 balance sheet and 25 income
sheet items, b) industries and activities including primary and secondary industry codes in
both local and international classi�cations, c) corporate structure including board members
and management, and d) ownership information, including shareholders and subsidiaries, di-
rect and indirect ownership, ultimate owner, independence indicator, corporate group, and
all companies with the same ultimate owner as the subject company.
Orbis provides several advantages that are central to our analysis. First, a notable strength
of Orbis is its ownership information, which covers over 30 million shareholder/subsidiary
links and is known for its scope and accuracy. The information is collected from a variety
of sources. The data show full lists of direct and indirect subsidiaries and shareholders, a
company�s degree of independence, its ultimate owner, and other companies in the same
corporate family. We explore the shareholder, ultimate owner, and subsidiary information to
13
identify (majority- and wholly owned) MNC activities across countries. Second, the �nancial
data in Orbis consist of a rich array of time-series information enabling us to measure and
compare a �rm�s total factor productivity over time. Third, Orbis provides a broad country
coverage, including a wide range of both industrial and emerging economies.
We use four categories of information for each �rm: (a) industry information including
the 4-digit NAICS code of the primary industry in which each establishment operates, (b)
ownership information including each �rm�s domestic and global parents and domestic and
foreign subsidiaries, (c) location information, and (d) non-consolidated �nancial information
including revenue, employment, assets, investment, and material cost.14 A �rm is considered
foreign-owned if it is majority- or wholly owned by a foreign multinational �rm. There are
about 36,000 foreign-owned subsidiaries in the �nal sample.15
While we believe that Orbis is a very informative and useful data source for answering
the question raised in our paper, we are aware of its limitations. Like most other datasets
that rely on public registries and proprietary sources, Orbis does not cover the population of
businesses across countries. An ideal alternative would be national census data that include
the entire population of �rms. However, such census data are hard to obtain (usually subject
to location and nationality restrictions and requirements) and nonexistent in many developing
countries. The reason for the lack of data is simple: high costs and institutional restrictions
prevent frequent collections of economic census for all the businesses existing in a country.
To assess the extent of coverage, in particular, with respect to small businesses, we compare
the data against several benchmarks including, for example, the Structural and Demographic
Business Statistics (SDBS) from the OECD. We �nd Orbis provides satisfactory coverage
in many of the countries considered. For France, for example, the SDBS dataset reports
that 84 and 91 percent of the enterprises have fewer than 10 and 20 employees, respectively,
in 2007. Orbis reports 80 and 86 percent. The coverage for some countries seems highly
satisfactory. For Sweden, SDBS reports close to 93 percent of the enterprises have fewer than
20 employees, while Orbis shows 95 percent. For some other countries, Orbis tends to have
14We imposed a number of requirements in cleaning the data. First, we dropped all records that lack revenue,employment, asset, and industry information. Second, we focused on manufacturing industries only. Third,we excluded countries with fewer than 100 observations. Last, we restricted the �nal sample to countrieswith a relatively good coverage of �rm �nancials that are required to estimate productivity. The main coun-tries in the �nal sample include Argentina, Australia, Austria, Bosnia and Herzegovina, Belgium, Bulgaria,China, Colombia, Croatia, Czech Republic, Germany, Estonia, Finland, France, Greece, Hungary, Indonesia,Italy, Japan, South Korea, Spain, Lithuania, Malaysia, Poland, Portugal, Romania, Russia, Sweden, Slovenia,Slovakia, Taiwan, and Ukraine.15The subsidiary data used in our paper do not distinguish between green�eld foreign investment and mergers
and acquisitions. However, our primary theoretical predictions and empirical approach are not dependent onthe mode of multinational entry.
14
a lower percentage of small �rms. For Spain and Portugal, for example, the percentage of
enterprises with fewer than 20 employees is 91 and 89 percent, respectively, in SDBS and 88
and 77 percent, respectively, in Orbis. The SDBS data does not include data for developing
countries, but the numbers in Orbis seem comparable for some of the countries. For Argentina,
for example, the share of enterprises with fewer than 20 employees was close to 90 percent
(with INDEC showing 82 percent for Buenos Aires). For Latvia, it was close to 78 percent in
Orbis while Eurostat reports 85 percent.
In Section 5.2, we further address potential issues with the data and data sampling in
a number of ways, including, in particular, redoing our analysis for subsamples of countries
with better data coverage and performing falsi�cation exercises.
Productivity: Estimation Methodology We use revenue, employment, asset, and
material cost information to estimate each �rm�s total factor productivity, a primary variable
of the paper. In particular, we use �rms��nancial data in the 2002-2007 period to derive
estimates of production function and productivity.16
A key challenge in the measurement and identi�cation of productivity relates to the endo-
geneity of the �rm�s optimal choice of inputs. Di¤erent estimation measures exhibit di¤erent
advantages and limitations. As shown by Ackerberg, Caves, and Frazer (2006), the use of
instruments based on lagged input decisions as the source of identi�cation in structural es-
timation methods such as Olley and Pakes (1996) and Levinsohn and Petrin (2003) may be
associated with collinearity problems.17
We considered a variety of productivity estimation methodologies, including Olley and
Pakes (1991), Levinsohn and Petrin (2003), Ackerberg, Caves, and Frazer (2006), and Ghandi
et al. (2012).18 Ghandi et al. (2012) use a transformation of the �rm�s �rst order condition for
�exible inputs that does not require �nding instrument for the �exible inputs or subtracting
them from output. The transformation enables a nonparametric regression of the �exible
input revenue share against all observed inputs to non-parametrically identify the �exible
input�s production elasticity and the ex-post shocks. We report our primary results based on
productivity estimates obtained using Ghandi et al.�s (2012) technique, but con�rm that the16Revenue, asset, and material cost are de�ated in the data. We obtained industry-level revenue, asset, and
material cost de�ators from the EU KLEMS, the OECD STAN database, and some other national data sources.For countries without industry-level de�ators, we used national income and capital de�ators. See Section 5.1for discussions on the implications of unobserved price information and the robustness analysis.17Ghandi et al (2012) show that the methods suggested by Ackerberg, Caves, and Frazer (2006), and
Wooldrige (2009), which are based on a quasi-�xed assumption on the inputs included in the productionfunction, mantain the same identi�cation problems.18Van Biesebroeck (2008) and Syverson (2011) provide a comparison of several di¤erent productivity esti-
mation methods and show them to produce similar productivity estimates.
15
�ndings are qualitatively similar when other estimation methods are used.
We estimate the production function for each NAICS 4-digit industry and obtain the
productivity of each �rm based on industry-speci�c production function estimates. In Fig-
ure 1, we show that multinational a¢ liate sales and host-country industry TFP exhibit a
positive and signi�cant relationship in both absolute levels and growth rates. Speci�cally,
countries with greater growth rates of multinational activity experience, on average, greater
TFP growth. In the empirical analysis, we divide the 6-year period into two sub-periods,
2002-2004 and 2005-2007, and investigate how new multinational entry a¤ects host-country
TFP growth.19
4 Empirical Evidence
In this section, we evaluate the hypotheses outlined in Section 2 and assess empirically the
e¤ects of increased multinational production. First, we examine multinational �rms�endoge-
nous decision to enter a host country, based on conditions described in Section 2. Then,
accounting for the endogeneity of multinational entry, we explore the properties of the pro-
ductivity and revenue distributions to examine the e¤ects of greater multinational production
within and across domestic �rms.
4.1 The Entry Decision of Multinational Firms
As shown in Section 2, a foreign �rm will invest in a host country if � > �M �h"c(fM�fX)E'(1�d1�")
i 1"�1 � w
�P
�.
This leads us to consider the following empirical speci�cation
Pr [entrykij = 1]
= �
24ln �ki + � 1
"� 1
�ln'kij � ln
8<:""cj(fMj � fXj)Ej(1� d1�"ij )
# 1"�1 � wj
�Pj
�9=; > 0
35 ; (8)
where entrykij is an indicator variable that represents whether a multinational �rm k head-
quartered in country i enters a host country j in a given period.
The above equation suggests that, as predicted in Helpman, Melitz and Yeaple (2004),
�rms with a large productivity draw �ki are more likely to enter new host countries. Moreover,
the �rm speci�c �xed-cost shifter 'kij in a given country re�ecting, for example, multination-
19Table A.1 reports the summary statistics of the main variables. Compared to entry, we observe relativelyfew exits of multinational �rms in the data. In the empirical analysis, we therefore focus on the e¤ect of newentry.
16
als��nancial constraints in the host country, is also expected to a¤ect multinationals�entry
decisions. In the empirical analysis, we consider changes in multinational headquarters�cash
�ow measured in the host-country PPP value as a proxy for changes in multinationals�ex-
pected real �nancial constraints in a given host country. Multinationals that experience an
idiosyncratic positive cash �ow shock at headquarters, due to, for example, high investment
returns or an appreciation of headquarter-country currency, see a decrease of �nancial con-
straints in foreign investments, especially in host countries where the real value of the shock is
large, and are thus more likely to enter new host countries.20 But these idiosyncratic cash �ow
shocks of multinational �rms, in contrast to other multinational characteristics such as pro-
ductivity and size, are unlikely to be directly correlated with the future productivity growth
of individual host-country domestic �rms, thereby serving as a suitable exclusion restriction
in the second stage to identify the causal e¤ects of multinational production.
We also use country-pair-industry-time �xed e¤ect to control for all time-variant host-
country, headquarter-country, and country-pair industry speci�c factors including not only
Ej , cj , Pj , wj , fMj , fXj , and dij but also all other potential determinants of multinational
entry such as host-country institutional characteristics, sectoral FDI and trade policies, and
domestic industry characteristics.21 Furthermore, as mentioned earlier, since multinational
�rms are likely to be attracted to host countries with faster productivity growth, the use
of the country�pair-industry-time �xed e¤ect accounts for this possibility by controlling for
host-country current and future productivity growth. In addition, �rm-level clustering is used
to allow for correlations of errors within each �rm.
Table 1 reports the estimation results.22 We �nd that, as expected in Section 2, more
productive �rms exhibit a greater likelihood of entering foreign countries, a result consistent
with, for example, Helpman, Melitz and Yeaple (2004), Yeaple (2009), and Chen and Moore
(2010). Further, �rms that experience a positive �nancial shock are more likely to enter new
host countries. These �ndings are robust to the inclusion of either host-country-industry
or country-pair-industry �xed e¤ects, which control for all (time-variant and time-invariant)
country-industry and country-pair-industry factors. Based on the estimates, we then obtain
20The role of �nancial shocks in multinationals�ability to overcome �nancial constraints and engage in newFDI has been shown since Froot and Stein (1991) who emphasize on �nancial shocks to host-country domestic�rms and �nd that a devaluation of host-country currency will increase the volume of M&As by otherwise�nancially-constrained foreign multinational �rms. In this paper, we examine how �nancial shocks to foreignmultinational headquarters would a¤ect their ability to engage in new FDI.21Because we examine the entry decision in a single period, the time dimension is suppressed in the �xed
e¤ect.22We use a linear probability model to avoid the incidental parameter problem that arises in �xed-e¤ect
maximum likelihood estimators.
17
the predicted probability of entry for each multinational �rm cPr [entrykijs = 1] and the ex-pected number of new multinational �rms in each host country bzMjs �
Pk;icPr [entrykijs = 1],
the latter to be used in the following analysis.
Now we move on to evaluate the e¤ect of multinational production on host-country do-
mestic �rms, taking into account the endogenous entry of multinational �rms.23 We �rst
estimate the net e¤ect of new multinational entry on the average productivity of domestic
�rms. Table 2 shows that multinational production exerts, on average, a positive and signi�-
cant e¤ect on the average productivity of domestic �rms, taking into account the endogeneity
of multinational entry.
There are, however, two important considerations behind these estimates. First, compar-
ing the OLS and the instrumented results, we �nd that failure to account for the endogenous
entry of multinational �rms can lead to an over-estimation of the e¤ect of multinational pro-
duction. According to column (2), a one-standard-deviation increase in the probability of new
multinational entry is associated with a 0.02-standard-deviation increase in average domestic
productivity, as opposed to a 0.05-standard-deviation increase according to the OLS results.
Second, as our theoretical framework shows, increases in average domestic productivity can
arise from both within-�rm productivity improvement and between-�rm selection and reallo-
cation. Looking at the relationship between multinational production and average domestic
productivity alone does not allow us to distinguish between the two sources of productivity
gains. We therefore proceed below to assess their relative importances by examining the
impact of multinational entry on the distributions of domestic �rms in dimensions including
productivity, revenue, and survival.
4.2 Within-Firm Productivity Improvement
First, consider the potential within-�rm productivity e¤ect of foreign multinationals, which
would shift the productivity distribution of surviving domestic �rms rightward as discussed
in Hypothesis 1. To examine that, we divide domestic �rms into four bins based on the initial
level of productivity and estimate the following equation:
ln �0kj(q)� ln �kj(q) = �� � zMj (9)
23Given that �rm productivity and MNC entry are both obtained from �rst-stage estimations, we bootstrapthe standard errors in all the estimations.
18
where ln �0kj(q)� ln �kj(q) is the log productivity change of domestic �rms k in the qth bin ofcountry j between 2002-2004 and 2005-2007 and zMj is an indicator of multinational entry.
Note that, in the above as well as the following equations, we control for all time-invariant
country-industry factors by essentially taking the �rst di¤erence and exploring the changes in
each outcome variable. In addition, we include separate �xed e¤ects in the �rst-di¤erenced
equations to control for all time-variant country and industry characteristics including macro-
economics factors like economic growth, domestic policies, and exchange rates and industry
factors like factor intensities. A country-industry clustering is also used to allow for correla-
tions of errors within each cluster. In the above and all the following estimating equations,
we account for the endogeneity of zMj by substituting it with the expected number of multi-
national entry bzMj obtained from the �rst stage.
Table 3 reports the results. The estimates suggest that a higher probability of new multi-
national �rms, on average, increases the within-�rm productivity of domestic �rms with ��
around 0:02. This e¤ect is witnessed throughout the productivity distribution� for domestic
�rms with di¤erent levels of initial productivity, implying a 0.2-percent rightward shift of the
productivity distribution when the probability of new multinational entry by 10 percentage
points.
4.3 Between-Firm Selection
Next, we examine the between-�rm selection and reallocation e¤ects. Section 2 suggests that
after the entry of new multinational �rms, a domestic �rm will survive if � > �0D where
�0D denotes the ex-post domestic cuto¤ productivity. This leads to the following empirical
speci�cation:
Pr [survivalkj = 1] = Pr�ln �kj � ln �0Dj(zMj ; �Dj) > 0
�; (10)
where the dependent variable survivalkj indicates whether a domestic �rm k survived in the
domestic market j in the second sub-period 2005-2007, �kj is the productivity of �rm k in the
�rst sub-period 2002-2004, and �0Dj , the ex-post (2005-2007) domestic cuto¤ productivity in
country j, is a function of multinational entry zMj and the ex-ante (2002-2004) domestic cuto¤
productivity �Dj , both of which are expected to have a negative impact on domestic �rms�
survival probability and separately controlled for in the equation. Again, we include vectors
of country and industry dummies and country-industry clustering to allow for correlations of
errors within each cluster.
Table 4 reports the results. We �nd that a greater probability of new multinational
19
production exerts a negative and signi�cant e¤ect on the survival probability of domestic
�rms. Domestic �rms are more likely to exit the market in the presence of new multinational
entry. This result, robust to the control of �rm characteristics including productivity and size,
suggests that the between-�rm reallocation e¤ect dominates the within-�rm productivity e¤ect
in explaining the aggregate impact of multinational entry on domestic �rms�survival.
We also consider an alternative speci�cation to examine the above �rm selection hypothesis
by estimating:
ln �kj = �ssurvivalkj � zMj + �0ssurvivalkj ; (11)
where �kj is the ex-ante 2002-2004 productivity of �rm k in market j and survivalkj is an
indicator of whether �rm k survived in the domestic market j in 2005-2007. If multinational
entry leads to tougher selection on domestic �rms, �s is expected to be positive.
As shown in Table 5, we �nd signi�cant evidence of a tougher selection from multinational
entry. Not only are surviving domestic �rms, on average, more productive than exiting do-
mestic �rms, the ex-ante productivity di¤erence between the two groups is also 1.2 percent
greater when there is a 10-percentage-point higher probability of a new multinational entry.
The selection e¤ect is also re�ected in terms of the ex-ante revenue di¤erence between sur-
viving and exiting �rms. Surviving �rms are, on average, greater than exiting �rms ex ante,
especially in cases of multinational entry.
As another check, we evaluate Hypothesis 2 by considering the following equation:
ln �0Dj � ln �Dj = �DzMj ; (12)
where ln �0Dj � ln �Dj denotes the log change in the cuto¤ productivity in a given country andindustry from 2002-2004 to 2005-2007. There are a number of ways to de�ne cuto¤ produc-
tivity in a country and industry, including the minimum productivity of surviving �rms, the
maximum productivity of exiting �rms, or less strict measures such as the productivity of the
bottom 10th-percentile of surviving �rms and the mean productivity of the bottom 10 percent
of surviving �rms. We considered all the above de�nitions and found the results qualitatively
similar. Below we show the results based on the minimum productivity of surviving �rms.
In Section 5, we further examine the robustness of the results by focusing on countries with
comprehensive coverage and performing a falsi�cation test.
Column (1) of Table 6 suggests that a higher probability of multinational entry leads to a
signi�cant increase in the minimum productivity of surviving domestic �rms. In particular,
we �nd �D = 0:83, implying that a 10-percentage-point increase in the probability of a new
20
multinational entry is associated with a 8.3-percent increase in the cuto¤. Domestic �rms
whose productivity falls between the ex-ante and the new, higher productivity thresholds
would be forced to exit the market.
Similarly, we can estimate changes in the cuto¤ revenue of domestic �rms by examining
the following equation:
ln r0Dj � ln rDj = �czMj (13)
where ln r0Djs� ln rDjs is the log change in the cuto¤ revenue of domestic �rms and similar toabove, the cuto¤ revenue in a country and industry is represented by the minimum revenue
of continuing �rms. The parameter �c, expected to be positive, captures the e¤ect of foreign
multinational production on capital price and subsequently the cuto¤ revenue. As shown in
column (2) of Table 6, we �nd, consistent with hypothesis 2, that a higher probability of
multinational entry signi�cantly increases the minimum revenue of surviving domestic �rms.
Speci�cally, a 10-percentage-point increase in the likelihood of a new multinational entry is
associated with a 4.9-percent increase in the cuto¤ revenue.
4.4 Between-Firm Market Reallocation
Next we evaluate the e¤ect on the revenue distribution. As shown in Section 2, rD(�) =
E��P�w
�"�1. Hypothesis 3 suggests that when positive productivity spillover is inadequate
to o¤set the factor market competition e¤ect, greater multinational production will shift the
revenue distribution of domestic �rms leftward, especially at the left tail. We therefore consider
the following speci�cation:
ln
r0Dkj(q)
E
!� ln
�rDkj(q)
E
�= ("� 1) (�P + ��) zMj ; (14)
where we again divide domestic �rms into four bins based on the initial level of productivity,
ln�r0Dkj(q)=E
�� ln (rDkj(q)=E) is the log change of the revenue share of a domestic �rm k in
the qth bin, and �P � ln (P 0=P � w=w0) and �� � ln(�0j=�j) denote, respectively, the changesin aggregate real price and within-�rm productivity. Given that we expect Pj=w > P 0j=w
0
and� in the presence of within-�rm productivity improvement� �0j > �j , the net e¤ect of
multinational entry on domestic �rms� revenue share is ambiguous. Evaluating the above
equation separately for di¤erent ranges of domestic �rms enables us to examine empirically
how the market reallocation e¤ect might vary with the initial productivity of domestic �rms.
Table 7 shows that a higher likelihood of multinational entry leads to a decrease in the
21
average revenue share of domestic �rms, especially for the least productive �rms. The e¤ect
on the most productive domestic �rms, in contrast, is insigni�cant. This result suggests that
the positive within-�rm TFP e¤ect of multinational entry is more than o¤set by the negative
factor market reallocation e¤ect, resulting in a reallocation of product market share from
domestic to multinational and from the less productive to the more productive �rms.24
The above �nding is similarly pronounced when we examine directly labor market real-
location by looking at labor employment outcomes. We �rst examine the employment share
distribution of domestic �rms. Section 2 predicts a reallocation of labor from domestic to
multinational �rms, motivating us to assess shifts of the employment distribution. As shown
in Table 8, we �nd that new multinational entry leads to a decrease in the average employment
share of domestic �rms and shifts the entire distribution leftward. This e¤ect, again espe-
cially strong for the least productive domestic �rms and insigni�cant for the most productive
domestic �rms, lends direct support to the prediction of labor market reallocation.
We also consider the average wage rate of domestic �rms. Section 2 predicts an increase
in wage rate as a result of increased labor demand by foreign multinational �rms. To examine
this hypothesis, we compute the average unit labor cost for domestic �rms in each country and
industry. As shown in Table 9, we �nd that a 10-percentage-point increase in the probability
of new multinational entry leads to a 0.2-percent increase in average wage rate.
Table 10 summarizes the above estimated e¤ects of multinational entry on the various
performance indicators of domestic �rms.
5 Discussion and Robustness Analysis
5.1 Measure of Productivity
In our main analysis, we estimate �rm productivity using a new methodology developed
by Ghandi et al. (2012). We have also compared our results using productivity estimates
obtained based on Levinsohn and Petrin (2003), Ackerberg, Caves, and Frazer (2006), and
simple labor productivity, and found the results to be qualitatively similar, all suggesting
market reallocation to constitute an important source of gains from multinational production.
As in most empirical work that exploits productivity estimates, we do not observe �rm-
level physical output quantities and prices. This information is especially di¢ cult to obtain
24While the monopolistic competition model adopted in the paper abstracts from reallocation through prod-uct market competition (due to the CES speci�cation), the latter is captured by the estimated e¤ect of multi-national entry on the revenue distribution of domestic �rms. In Section 6.2, we further discuss the implicationsof variable markups and the robustness of our results.
22
for the large cross-section of countries considered in this paper. We therefore estimate �rm
productivity based on the output value (instead of physical output) produced by each �rm,
given its inputs.25
It is important to note, however, the central, broader point we emphasize in this paper�
that between-�rm selection and reallocation could be an important source of gains from multi-
national production� is established by exploring various other characteristics� such as rev-
enue, employment, wage rate, and survival� of domestic �rms and thus does not depend on
the measures of productivity. Considering within-�rm productivity improvement as the only
mechanism by which countries realize productivity gains from multinational production would
lead to a biased understanding of both the nature and the magnitude of the gains, even if
physical output or true productivity were observed.
Next, we discuss the empirical implications when the productivity measure is systemati-
cally correlated with �rm prices and markups. Melitz and Ottaviano (2008) show that in a
variable-markup setup increased competition should induce a downward shift in the distri-
bution of markups across �rms (even in the absence of labor reallocation). They �nd that,
although only relatively more productive �rms survive (with higher markups than the less
productive �rms that exit), the surviving �rms�distributions of markups and prices should
shift downward. This prediction suggests that the estimates of within-�rm productivity im-
provement in our paper, derived on the basis of the shift of the revenue-based productivity
distribution, would be biased downward if the distribution of productivity partly re�ects the
distribution of markups.
Given the di¢ culty of obtaining the data required for measuring output-based produc-
tivity, one of the solutions suggested in the literature is to focus on homogeneous goods. In
industries with relatively homogeneous products, the concern that revenue-based productivity
is systematically correlated with prices or markups is mitigated. The shift of the productiv-
ity distribution is more likely to re�ect changes in productivity. We hence re-estimate the
within-�rm productivity e¤ect for industries that are classi�ed as relatively homogeneous by
Rauch (1999). We �nd the results to remain qualitatively similar (the �rst panel of Table
11). The within-�rm productivity of domestic �rms improves, on average, by 0.4 percent
when the probability of new multinational entry increases by 10 percentage points in these
25Note that even if price or physical output information were observed, the relationship between pricesand markups would still be unclear. Higher prices can re�ect higher quality, instead of higher markups. DeLoecker (2011) introduces a methodology that uses detailed product-level information to recover the markupsand the output-based productivity of �rms. However, this approach requires speci�c assumptions regardingthe mechanisms through which demand shocks a¤ect prices and productivity.
23
industries. The productivity distribution shifts rightward, especially for the least productive
domestic �rms, where the magnitude of the improvement (1.2 percent) is signi�cantly greater
than the earlier results in Table 3 (0.3 percent). We also reassess the e¤ect of multinational
entry on the cuto¤ productivity and the cuto¤ revenue and �nd the e¤ects remain positive
and signi�cant in the relatively homogeneous industries (the �rst panel of Table 12).
5.2 Data Coverage
The dataset used in our empirical analysis spans over 30 developed and developing countries.
While this enables us to evaluate the productivity gains from multinational production based
on a broad set of countries, the estimates can be a¤ected by the data coverage across countries.
For example, national public registries, an important source of our data, vary in their data
reporting criteria. Some registries impose certain minimum-size criteria on, for example,
revenue, censoring the data on the left tail. Such data censoring issues are likely to make
it di¢ cult to identify the market reallocation e¤ect through exploring changes in the left
truncations of the productivity and the revenue distributions, as the left truncations of these
distributions should have little change over time.
In this subsection, we take several measures to address possible data sampling issues, in-
cluding focusing on countries with arguably relatively better data coverage and performing
falsi�cation tests by manually truncating the data in all countries. First, we restrict the analy-
sis to the top 5 countries with the largest number of domestic �rms, namely, China, Spain,
France, Italy and Romania. Our earlier results remain qualitatively robust. For example, the
productivity distribution of domestic �rms shifts rightward by 0.2 percent when there is a
10-percentage-point increase in the probability of a multinational entry (the second panel of
Table 11). Further, the same increase in the probability of a multinational entry is associated
with a 6-percent increase in cuto¤ productivity and a 2.2-percent increase in cuto¤ revenue
(the second panel of Table 12).
We then perform a falsi�cation test by truncating the data at the left tail in both time
periods and including only �rms with more than 10 employee. When the data are censored
at the left tail and the smallest �rms are dropped from the sample, our estimated e¤ects of
multinational entry on cuto¤ productivity and cuto¤ revenue� now obtained based on �rms
above a minimum size� should be adjusted downward. The bottom panel of Table 12 con�rms
the hypothesis: the cuto¤ productivity and the cuto¤ revenue witness a more moderate rise
after multinational entry.
24
5.3 The Role of Trade
Our empirical analysis so far controls for all time-invariant country-industry factors by taking
�rst di¤erences of the key outcome equations (for example, cuto¤ productivity and revenue)
between the two sub-periods and all time-variant country factors as well as time-variant in-
dustry characteristics through the use of �xed e¤ects. Still, a possible concern that could arise
is that observed changes in domestic productivity and revenue distributions might be driven
by other factors such as export and import growth. For example, greater import competition
could similarly lead to increases in cuto¤ productivity and a leftward shift of the revenue
distribution. Increases in export activity, on the other hand, could shift both productivity
and revenue distributions rightward when there is signi�cant learning by exporting.
We adopted two strategies to address this concern. First, we accounted for the endogeneity
of multinational entry in the �rst stage by instrumenting with multinationals�ex-ante cash �ow
shock. Our analysis shows that foreign multinational entry exerts signi�cant within-�rm pro-
ductivity and between-�rm reallocation e¤ects even when we take into account the potential
endogeneity issue. Second, we explicitly controlled for export and import growth in host-
country industries. We obtained cross-country industry-level export and import data from
the UN COMTRADE and computed the export and import growth rates between 2002-2004
and 2005-2007. We found that controlling for the role of trade slightly lowers the estimated
e¤ect of multinational entry on cuto¤ productivity and on the productivity distribution.
On a related note, one may consider that di¤erences across horizontal, vertical, and export-
platform FDI might a¤ect the gains from multinational production through the role of trade.
In this paper and, in particular, in our theoretical analysis, we focus on reallocation e¤ects
stemming from increased factor (labor and capital) demand by foreign multinational �rms.
As these e¤ects apply to all types of FDI regardless of the �nal sales destinations, our main
qualitative point� that market reallocation constitutes an important source of gains from
multinational production� should remain valid. However, we acknowledge that the degrees
of product market competition, relationships with domestic upstream and downstream in-
dustries, and productivity spillover might, however, depend on the �nal market of foreign
multinationals (see, among others, Markusen and Venables, 1999; Markusen, 2002, for related
theoretical work). As in the case of most cross-country �rm-level datasets, Orbis does not
report intra-�rm trade data to di¤erentiate between the di¤erent types of FDI. One alterna-
tive is to use input-output tables and industry codes to identify potential production linkages
between MNC headquarters and subsidiaries (as in Alfaro and Charlton, 2009). However, this
would not be able to distinguish export-platform FDI from the rest. Assessing the gains from
25
di¤erent types of FDI thus remains an important topic of research that could be advanced by
availability of cross-country intra-�rm trade data.
5.4 Between-Industry Productivity Spillover and Factor Reallocation
Our main analysis has focused on quantifying within-industry gains from multinational pro-
duction. In this sub-section, we explore how multinational production can lead to gains
through between-industry productivity spillovers and factor reallocations.
We �rst explore the possibility of between-industry productivity spillover through vertical
production linkages. Considering spillovers via horizontal or vertical channels does not inval-
idate the main point that it is important to take into account the role of market reallocation
when analyzing the gains from multinational production. However, as mentioned in the intro-
duction, there is important evidence for productivity spillover from foreign �rms to domestic
�rms through vertical production linkages. Therefore, to complement our analysis, we explore
this e¤ect and examine how multinational production in a given industry can a¤ect the pro-
ductivity distribution of domestic �rms in related industries. Following Javorcik (2004), we
construct two variables, Backward linkagess0 and Forward linkagess0 , to measure the ex-
tent of the input-output relationships between each pair of industries. Backward linkagess0
measures the share of a downstream industry s0 inputs that come from an upstream industry
s and Forward linkagess0 the share of a downstream industry s inputs that come from an
upstream industry s0. The shares are computed using the 2002 Benchmark Input-Output
Accounts published by the Bureau of Economic Analysis. We interact the above variables
with predicted multinational production in each industry s0 and compute the weighted sum
of multinational production in downstream and upstream industries, respectively.
Our results suggest signi�cant productivity spillovers via both backward and forward
linkages, from downstream foreign multinational �rms to upstream domestic �rms and vice
versa (Table 13). However, interestingly we �nd that the productivity spillover through back-
ward linkage is pronounced primarily for the less productive domestic �rms while the spillover
through forward linkage is witnessed for the middle- and the high-productivity domestic �rms.
Overall, our �ndings are consistent with evidence from existing studies.
Next we examine how increased multinational production in one industry may cause in-
creased demand for labor and capital and subsequently factor reallocations in related indus-
tries. This between-industry factor reallocation e¤ect could in�uence the production costs of
domestic �rms in other industries, especially in industries that employ similar types of labor
and capital goods.
26
To capture this potential factor market externality between industries, we construct two
measures. First, we construct a measure of an industry-pair�s similarity in occupational labor
requirements, Labor similarityss0 . Industries with greater similarity in occupational labor
structure are expected to share greater externality in labor markets. We use the Bureau of
Labor Statistics 2006 National Industry-Occupation Employment Matrix (NIOEM), which
reports industry-level employment across detailed occupations (for example, Assemblers and
Fabricators, Textile, Apparel, and Furnishings Workers, Business Operations Specialists, Fi-
nancial Specialists, Computer Support Specialists, and Electrical and Electronics Engineers).
As in Ellison et al. (2010), we convert occupational employment counts into occupational
percentages for each industry and measure the correlation of each industry pair s and s0in
occupational percentages. Second, we attempt to evaluate capital-good market externality by
constructing a measure of industries�similarity in demand for capital goods, Capital � goodsimilarityss0 . This variable uses capital �ow data from the Bureau of Economic Analysis
(BEA), a supplement to the 1997 benchmark input-output (I-O) accounts, which shows de-
tailed purchases of capital goods (for example, motors and generators, textile machinery,
mining machinery and equipment, wood containers and pallets, computer storage devices,
and wireless communications equipment) by using industry. We measure the similarity of
each using-industry pair s and s0 in capital-good demand by the correlation of investment
�ow vectors.
Constructing the industry-relatedness measures using U.S. industry account data is moti-
vated by two considerations. First, the measures re�ect standardized production technologies
and are relatively stable over time. Second, the measures require detailed factor demand
information and the U.S. industry account data are more disaggregated than those of most
other countries.
We interact the two measures of industry-relatedness with predicted multinational pro-
duction in each industry s0 and compute the weighted sum of multinational production in
industries with similar labor and capital-good demand. The results are reported in Table
14. We �nd that increased multinational production in industries with similar labor demand
can lead to an increase in the domestic cuto¤ productivity. This suggests that an increase in
labor demand can lead to labor reallocations between related industries. The analysis also
shows evidence of capital reallocations between industries. As shown in column (2), increased
multinational production in an industry will lead to an increase in cuto¤ revenue, a function
of capital costs, in industries with similar capital-good demand. These �ndings suggest that
the market reallocation e¤ect of multinational production can also occur between industries,
27
further stressing the importance of this channel in determining the productivity gains from
multinational production.
6 Quantifying the Productivity Gains fromMultinational Pro-
duction
In this section, we quantify the aggregate as well as the decomposed productivity gains from
greater multinational production. Speci�cally, we follow Pavcnik (2002) by decomposing
the weighted aggregate productivity measure e�W into two parts: the unweighted aggregate
productivity measure �t and the total covariance between a �rm�s share of the industry output
sit and its productivity �it:
e�wt =Pi sit�it = �t +Pi(sit � st)(�it � �t): (15)
Comparing the weighted aggregate productivity measure e�W in two periods yields:
�e�wt = ��t +�Pi(sit � st)(�it � �t):
Given that we abstract from new entering �rms in the analysis, the above equation can be
further written as:
�e�wt = ��survivingt � �survivingt�1
�within�firm
+��survivingt�1 � �allt�1
�selection
+�Pi(sit � st)(�it � �t)reallocation
: (16)
The �rst component on the right hand side, �survivingt � �survivingt�1 , represents the con-
tribution of within-�rm productivity improvement (among surviving domestic �rms) to the
aggregate weighted productivity gain and is positive as we show in Section 4.2 that multi-
national entry induces signi�cant within-�rm productivity improvement. In particular, we
�nd that a 10-percentage-point higher probability of multinational entry leads to, on average,
0.2 percent increase in within-�rm productivity. The second component, �survivingt�1 � �allt�1,
represents the contribution of the selection e¤ect to the aggregate productivity gain. Given
that in Section 4.3 we �nd that more productive domestic �rms are more likely to survive
after multinational entry and, in particular, the average productivity of surviving �rms is
1.2 percent higher than that of exiting �rms when the probability of a multinational entry
is 10 percentage points higher, this second term is positive as well. The third component,
28
�Pi(sit � st)(�it � �t), represents the contribution of the market reallocation e¤ect to the
aggregate productivity gain. In Section 4.4, we �nd signi�cant evidence of market reallocation
as the least productive domestic �rms experience the sharpest decline in revenue share. To
evaluate the magnitude of the reallocation e¤ect, we compute �Pi(sit � st)(�it � �t) at the
country-industry level and �nd the covariance to be, on average, 0.2 percent greater when
there is a 10-percentage-point higher probability of multinational entry.
The above results suggest that it is important to take into account the role of between-�rm
selection and reallocation in determining the productivity gains from multinational produc-
tion. Our analysis shows that between-�rm selection, in particular, contributes the most to
aggregate productivity gain. Ignoring the selection and the market reallocation channels can
lead to signi�cant biases in understanding the nature and the magnitude of productivity gains
from multinational production.
7 Conclusion
Assessing productivity gains from greater openness to multinational production has been a
fundamental topic of economic research. A primary challenge in empirical investigations is to
distinguish the sources of productivity gains, including gains from within-�rm productivity
improvement and from between-�rm selection and reallocation. However, this task cannot
be accomplished by simply examining the relationship between multinational production and
host-country average productivity, as both channels predict a positive relationship. We thus
develop a standard model of heterogeneous �rms and multinational production to address
simultaneously the endogenous entry of multinational �rms and the within- and between-�rm
e¤ects of multinational production.
Our theoretical framework suggests that, while both within-�rm productivity improvement
and between-�rm reallocation predict a positive relationship between openness to multina-
tional production and aggregate domestic productivity, the e¤ects can be distinguished by
exploring their distinct predictions on the productivity, revenue and employment distribu-
tions of domestic �rms. Within-�rm productivity improvement implies a rightward shift of
the productivity and revenue distributions; between-�rm selection and reallocation, in con-
trast, cause a leftward shift of the revenue and employment distributions and an increase in
the cuto¤ productivity and revenue.
Evaluating these predictions using a cross-country �rm panel dataset, we show that multi-
national production leads to not only within-�rm productivity improvement but also between-
29
�rm selection and market reallocation in domestic markets. Entry of multinational �rms raises
the cuto¤ productivity of domestic �rms, pushing the least productive to exit the markets.
New multinational production also leads to an increase in the minimum revenue of continuing
domestic �rms, indicating an increase in �xed production cost and capital price. Following
the entry of multinational �rms, the revenue distribution of domestic �rms shifts leftward,
especially for the least productive domestic �rms. In contrast, the productivity distribution
of domestic �rms shifts rightward, while the distribution becomes more left truncated.
When quantifying the gains from multinational production, we �nd that, when the proba-
bility of a new multinational entry increases by 10 percentage points, the aggregate domestic
productivity increases by 1.6 percent, with between-�rm selection and reallocation alone ac-
counting for 1.4 percent. These results suggest that it is critical to take into account the role
of selection and reallocation when assessing the gains from multinational production. Ignor-
ing this source can lead to a biased understanding of the nature and the magnitude of the
productivity gains, with consequent biases in the design of FDI and industrial policies.
Two potential extensions of our analysis are worthy of particular attention. First, the
e¤ects of multinational production might take a longer term to fully realize in domestic
economies. Our estimates thus capture the lower bound of the total gains from multinational
production due to the time length of the available data. It would be useful to investigate
the long-run impact of multinational competition when longer time-series data are available.
Second, future work could explore the heterogeneous gains from multinational production
across countries. For example, how might domestic labor-market rigidities and �nancial mar-
kets a¤ect the extent of factor market reallocation and the subsequent productivity e¤ects of
multinational production? How might the di¤erent levels of domestic human capital and tech-
nology stock across host countries in�uence the degree of gains from productivity spillover?
Such analysis on the role of economic and institutional characteristics in determining coun-
tries�gains from multinational production will provide additional research and policy insights.
References
[1] Acemoglu, Daron, Ufuk Akcigit, Nicholas Bloom, and William R. Kerr. "Innovation,Reallocation and Growth." NBER Working Paper 18993.
[2] Ackerberg, D., Caves, K., and Frazer, G. 2006. "Structural Identi�cation of ProductionFunctions." mimeo.
30
[3] Aghion, Philippe, Mathias Dewatripont, Luosha Du, Ann Harrison, and Patrick Legros.2012. "Industrial Policy and Competition." American Economic Journal: Macroeco-nomics, forthcoming.
[4] Aitken, Brian, and Ann Harrison. 1999. "Do Domestic Firms Bene�t from Foreign DirectInvestment? Evidence from Venezuela." American Economic Review 89(3), 605-618.
[5] Aitken, Brian, Ann Harrison, and Richard E. Lipsey. 1996. "Wages and Foreign Own-ership: A Comparative Study of Mexico, Venezuela and the Unites States." Journal ofInternational Economics 40(3-4), 345-371.
[6] Alfaro, Laura and Andrew Charlton. 2009. Intra-Industry Foreign Direct Investment.American Economic Review 99(5): 2096-2119.
[7] Alfaro, Laura, Andrew Charlton, and Fabio Kanczuk. 2009. "Plant-Size Distribution andCross-Country Income Di¤erences." In NBER International Seminar on Macroeconomics2008. Cambridge, MA: NBER.
[8] Alfaro, Laura, Areendam Chanda, Sebnem Kalemli-Ozcan, and Selin Sayek. 2004. "FDIand Economic Growth: The Role of Local Financial Markets." Journal of InternationalEconomics 64(1), 89-112.
[9] Alfaro, Laura, Areendam Chanda, Sebnem Kalemli-Ozcan, and Selin Sayek. 2010. "DoesForeign Direct Investment Promote Growth? Exploring the Role of Financial Marketson Linkages." Journal of Development Economics 91(2), 242-256.
[10] Antras, Pol and Stephen R. Yeaple. 2013. "Multinational Production and the Structureof International Trade." Draft in preparation for the 4th Edition of the Handbook ofInternational Economics.
[11] Arnold, Jens and Beata Javorcik. 2009. "Gifted Kids or Pushy Parents? Foreign DirectInvestment and Plant Productivity in Indonesia." Journal of International Economics79(1), 42-53.
[12] Bao, Ge and Maggie X. Chen. 2014. "When Foreign Rivals are Coming to Town: FirmResponses to Multinational Investment News." mimeo.
[13] Bartelsman, Eric, John Haltiwanger, and Stefano Scarpetta. 2013. "Cross-Country Dif-ferences in Productivity: The Role of Allocation and Selection." American EconomicReview, 103(1): 305-34.
[14] Bilir, Kamran, Davin Chor, and Kalina Manova. 2014. "Host-Country Financial Devel-opment and Multinational Activity." NBER Working Paper 20046.
[15] Bloom, Nicholas, Ra¤aella Sadun, and John Van Reenen. 2012. "Americans Do IT Better:US Multinationals and the Productivity Miracle." American Economic Review, 102(1):167-201.
[16] Bloom, Nick, Mark Schankerman and John van Reenen. 2013 "Identifying TechnologySpillovers and Product Market Rivalry." Econometrica 81(4): 1347-1393.
31
[17] Bloom, Nick, Mirko Draca and John van Reenen. forthcoming. "Trade Induced TechnicalChange: The Impact of Chinese Imports on Innovation, Di¤usion and Productivity."Review of Economic Studies.
[18] Borenszteina Eduardo, Jose De Gregorio, and Jong-Wha Lee. 1998. "How Does ForeignDirect Investment A¤ect Economic Growth." Journal of International Economics 45,115-135.
[19] Carluccio, Juan and Thibault Fally. 2013. "Foreign Entry and Spillovers with Technolog-ical Incompatibilities in the Supply Chain." Journal of International Economics 90 (1):123-135.
[20] Chen, Maggie X. and Michael Moore. 2010. "Location Decision of Heterogeneous Multi-national Firms." Journal of International Economics 80(2), 188-199.
[21] Combes, Pierre-Philippe, Gilles Duranton, Laurent Gobillon, Diego Puga and SébastienRoux, 2012. "The Productivity Advantages of Large Cities: Distinguishing Agglomera-tion From Firm Selection," Econometrica 80(6), 2543-2594.
[22] De Loecker, Jan. 2011. "Product Di¤erentiation, Multi-Product Firms and Estimatingthe Impact of Trade Liberalization on Productivity." Econometrica, 79(5), 1407-1451.
[23] Ellison, Glenn, Edward Glaeser, and William Kerr. 2010. "What Causes Industry Ag-glomeration? Evidence from Coagglomeration Patterns." American Economic Review100, 1195�1213
[24] Feenstra, Robert C., and Gordon H. Hanson. 1997. "Foreign Direct Investment and Rela-tive Wages: Evidence from Mexico�s Maquiladoras." Journal of International Economics42(3-4), 371-394.
[25] Froot, Kenneth and Jeremy Stein.1991. "Exchange Rates and Foreign Direct Investment:an Imperfect Capital Market Approach." Quarterly Journal of Economics 106, 1191�1217.
[26] Ghandi, Amit, Salvador Navarro, and David Rivers. 2012. "On the Identi�cation ofProduction Functions: How Heterogeneous is Productivity." mimeo.
[27] Graham, Edward and Paul Krugman. 1991. Foreign Direct Investment in the UnitedStates. Washington D.C.: Institute for International Economics.
[28] Guadalupe, María, Olga Kuzmina, and Catherine Thomas. 2012. "Innovation and ForeignOwnership." American Economic Review 102(7), 3594-3627.
[29] Harrison, Ann and Margaret McMillian. 2003. "Does Foreign Direct Investment A¤ectDomestic Firm Credit Constraints?" Journal of International Economics 61(1), 73-100.
[30] Harrison, Ann, Inessa Love, and Margaret McMillian. 2004. "Global Capital Flows andFinancing Constraints." Journal of Development Economics 75(1), 269-301.
[31] Harrison, Ann and Andrés Rodriguez-Clare. 2011. "Trade, Foreign Investment, and In-dustrial Policy." In Handbook of Development Economics, edited by Dani Rodrik andMark Rosenzweig. Amsterdam: Elsevier, 4039-4214.
32
[32] Helpman, Elhanan, Marc Melitz, and Stephen Yeaple. 2004. "Export versus FDI withHeterogeneous Firms." American Economic Review 94(1), 300-316.
[33] Hsieh, Chang-Tai and Peter Klenow. 2009. "Misallocation and Manufacturing TFP inChina and India." Quarterly Journal of Economics 124(4), 1403-1448.
[34] Irarrazabal, Alfonso, Andreas Moxnes, and Luca David Opromolla. 2012. "The Marginsof Multinational Production and the Role of Intra �rm Trade." mimeo.
[35] Javorcik, Beata. 2004. "Does Foreign Direct Investment Increase the Productivity of Do-mestic Firms? In Search of Spillovers through Backward Linkages." American EconomicReview 94(3), 605-627.
[36] Keller, Wolfgang and Stephen Yeaple. 2009. "Multinational Enterprises, InternationalTrade, and Productivity Growth: Firm-Level Evidence from the United States." Reviewof Economics and Statistics 91(4), 821-831.
[37] Kose, M. Ayhan, Eswar Prasad, Kenneth Rogo¤, and Shang-Jin Wei. 2011. "FinancialGlobalization and Economic Policies." In Handbook of Development Economics, editedby Dani Rodrik and Mark Rosenzweig. Amsterdam: Elsevier, 4283-4359.
[38] Kosova, Renata. 2010. "Do Foreign Firms Crowd out Domestic Firms? Evidence fromthe Czech Republic." Review of Economics and Statistics 92(4): 861-881.
[39] Levinsohn, James and Amil Petrin. 2003. "Estimating Production Functions Using Inputsto Control for Unobservables." Review of Economic Studies 70(2), No. 243, 317-342.
[40] Lipsey, Richard E. 2002. "Home and Host Country E¤ects of FDI." NBER WP 9293.
[41] Markusen, James. 2002. Multinational Firms and the Theory of International Trade.Cambridge: MIT Press.
[42] Markusen, James and Anthony J. Venables. 1999. "Foreign Direct Investment as a Cat-alyst for Industrial Development." European Economic Review 43(3), 335-338.
[43] Melitz, Marc. 2003. "The Impact of Trade on Intra-Industry Reallocations and AggregateIndustry Productivity." Econometrica 71(6), 1695�1725.
[44] Melitz, Marc and Giancarlo I. P. Ottaviano. 2008. "Market Size, Trade, and Productiv-ity." Review of Economic Studies, 295-316.
[45] Melitz, Marc and Stephen J. Redding. 2013. "Heterogeneous Firms and Trade." Draft inpreparation for the 4th Edition of the Handbook of International Economics.
[46] Olley, G. Steven and Ariel Pakes. 1996. "The Dynamics of Productivity in the Telecom-munications Equipment Industry." Econometrica 64(6), 1263�1297.
[47] Pavcnik, Nina. 2002. "Trade Liberalization, Exit, and Productivity Improvement: Evi-dence from Chilean Plants." Review of Economic Studies 69(1), 245-76.
[48] Ramondo, Natalia. 2009. "The E¤ects of Foreign Plants on Industry Productivity: Evi-dence from Chile." Scandinavian Journal of Economics 111(4), 789�809.
33
[49] Syverson, Chad. 2011. ""What Determines Productivity?" Journal of Economic Litera-ture, 49:2, 326�365
[50] Van Biesebroeck, Johannes 2008. "The Sensitivity of Productivity Estimates: RevisitingThree Important Debates." Journal of Business and Economic Statistics 26(3), 321-338.
[51] Wooldridge, Je¤rey M. 2009. "On Estimating Firm-level Production Functions UsingProxy Variables to Control for Unobservables." Economics Letters 104(3), 112-114.
[52] Yeaple, Stephen. 2009. "Firm Heterogeneity and the Structure of U.S. MultinationalActivity: An Empirical Analysis." Journal of International Economics 78(2), 206-215.
34
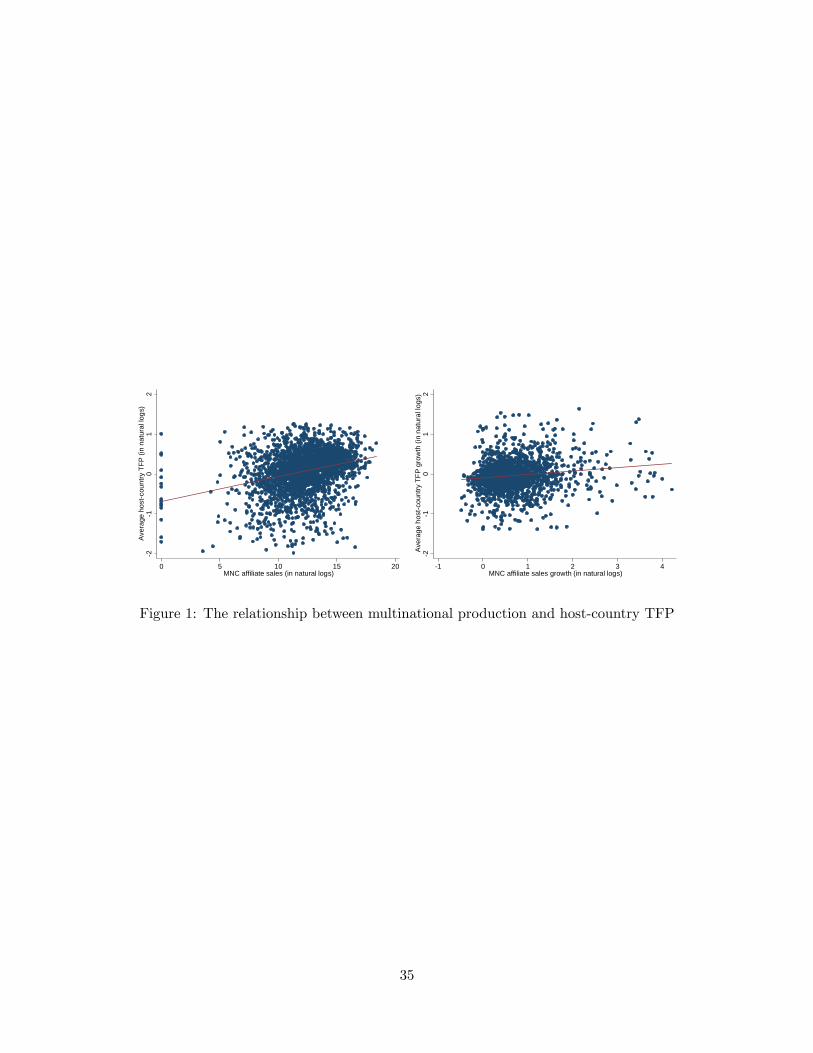
-2-1
01
2Av
erag
e ho
st-c
ount
ry T
FP (i
n na
tura
l log
s)
0 5 10 15 20MNC affiliate sales (in natural logs)
-2-1
01
2Av
erag
e ho
st-c
ount
ry T
FP g
row
th (i
n na
tura
l log
s)
-1 0 1 2 3 4MNC affiliate sales growth (in natural logs)
-2-1
01
2Av
erag
e ho
st-c
ount
ry T
FP (i
n na
tura
l log
s)
0 5 10 15 20MNC affiliate sales (in natural logs)
-2-1
01
2Av
erag
e ho
st-c
ount
ry T
FP g
row
th (i
n na
tura
l log
s)
-1 0 1 2 3 4MNC affiliate sales growth (in natural logs)
Figure 1: The relationship between multinational production and host-country TFP
35
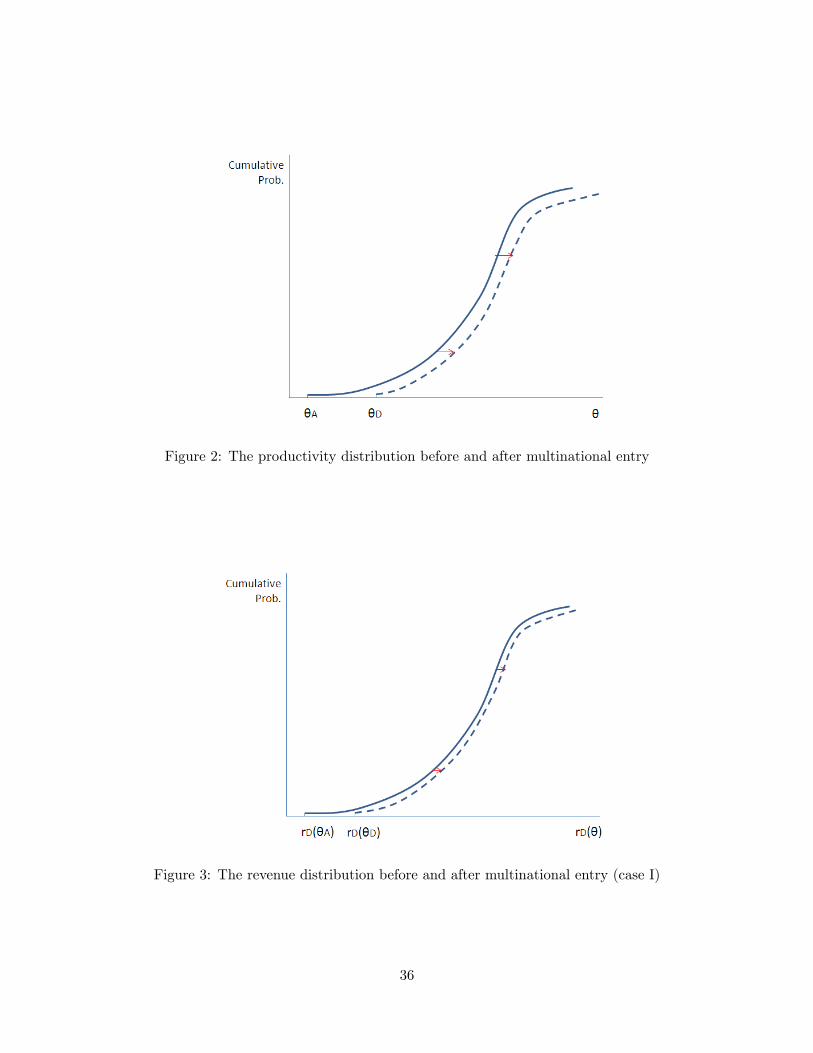
Figure 2: The productivity distribution before and after multinational entry
Figure 3: The revenue distribution before and after multinational entry (case I)
36
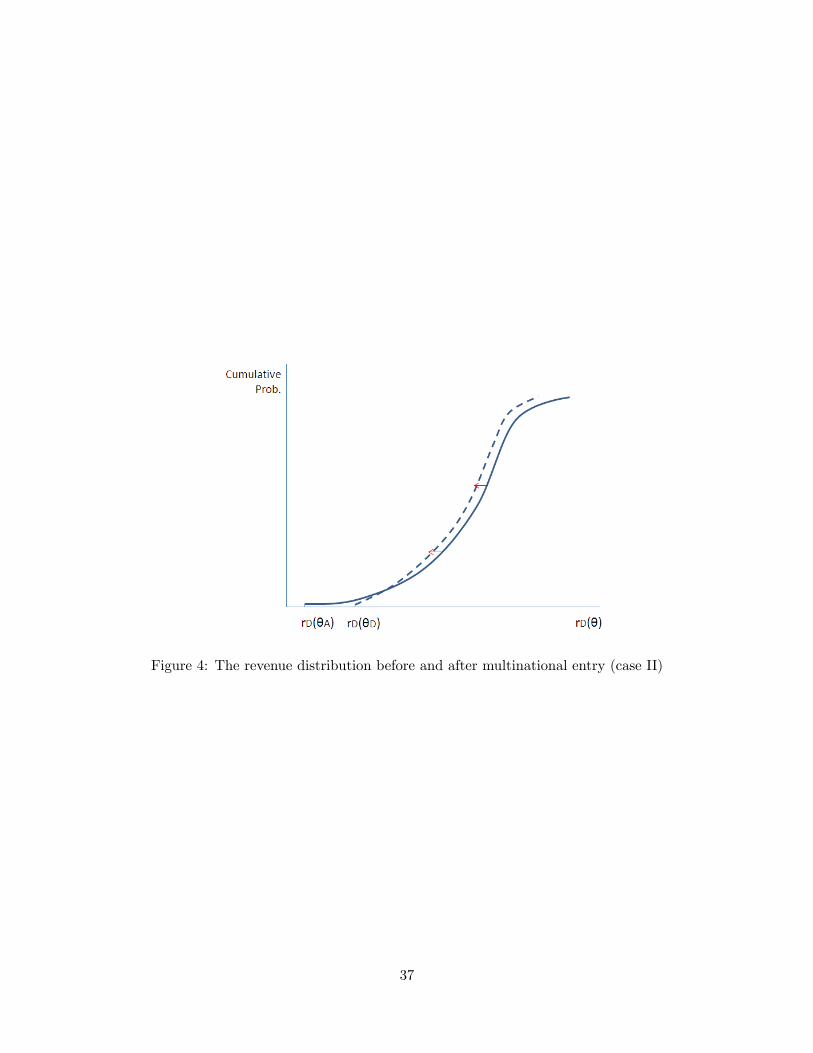
Figure 4: The revenue distribution before and after multinational entry (case II)
37
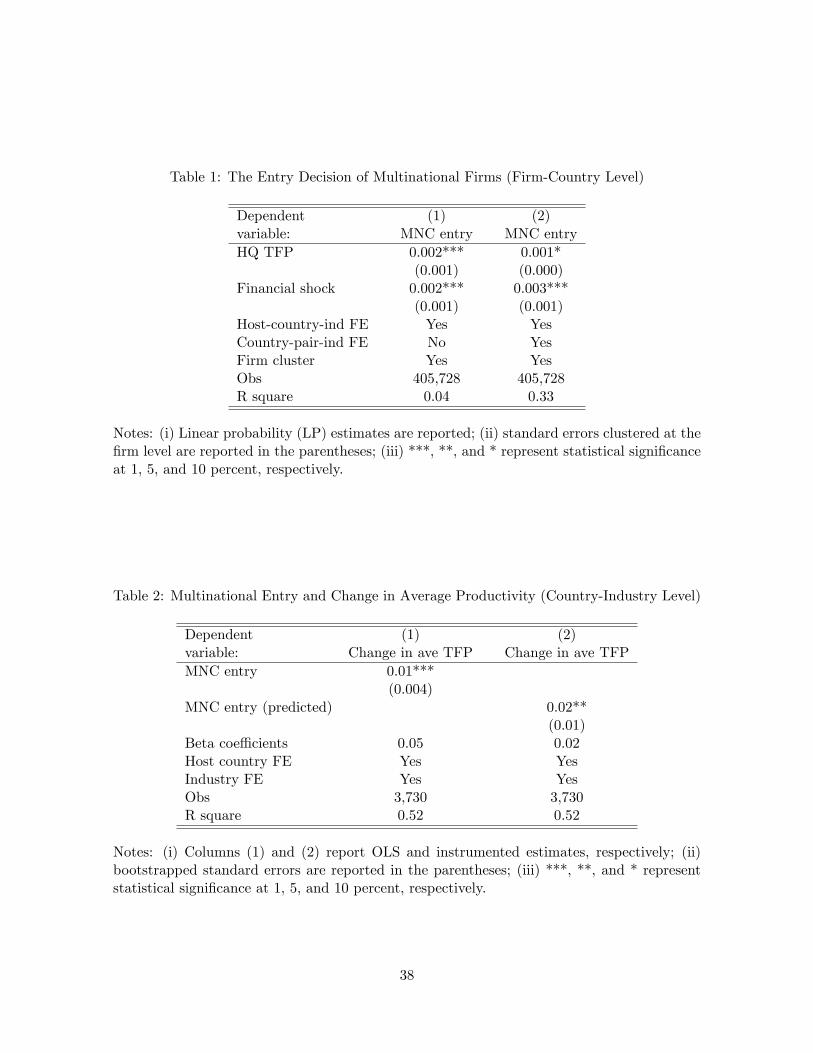
Table 1: The Entry Decision of Multinational Firms (Firm-Country Level)
Dependent (1) (2)variable: MNC entry MNC entryHQ TFP 0.002*** 0.001*
(0.001) (0.000)Financial shock 0.002*** 0.003***
(0.001) (0.001)Host-country-ind FE Yes YesCountry-pair-ind FE No YesFirm cluster Yes YesObs 405,728 405,728R square 0.04 0.33
Notes: (i) Linear probability (LP) estimates are reported; (ii) standard errors clustered at the�rm level are reported in the parentheses; (iii) ***, **, and * represent statistical signi�canceat 1, 5, and 10 percent, respectively.
Table 2: Multinational Entry and Change in Average Productivity (Country-Industry Level)
Dependent (1) (2)variable: Change in ave TFP Change in ave TFPMNC entry 0.01***
(0.004)MNC entry (predicted) 0.02**
(0.01)Beta coe¢ cients 0.05 0.02Host country FE Yes YesIndustry FE Yes YesObs 3,730 3,730R square 0.52 0.52
Notes: (i) Columns (1) and (2) report OLS and instrumented estimates, respectively; (ii)bootstrapped standard errors are reported in the parentheses; (iii) ***, **, and * representstatistical signi�cance at 1, 5, and 10 percent, respectively.
38
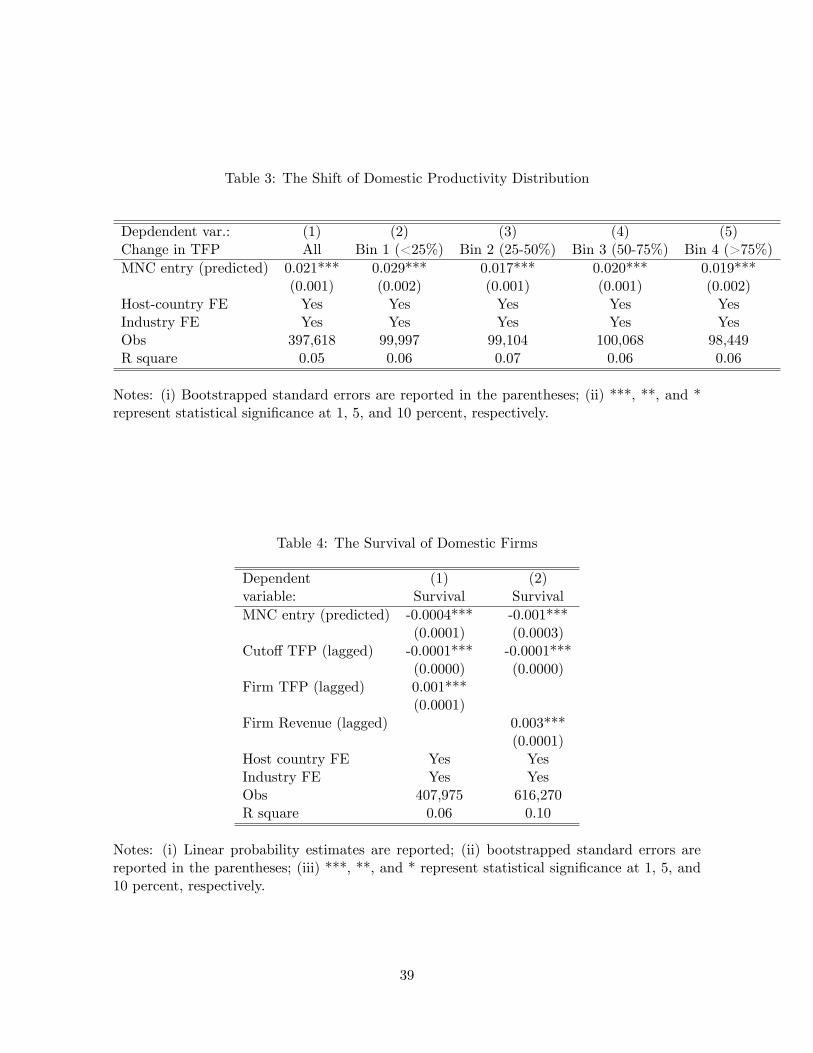
Table 3: The Shift of Domestic Productivity Distribution
Depdendent var.: (1) (2) (3) (4) (5)Change in TFP All Bin 1 (<25%) Bin 2 (25-50%) Bin 3 (50-75%) Bin 4 (>75%)MNC entry (predicted) 0.021*** 0.029*** 0.017*** 0.020*** 0.019***
(0.001) (0.002) (0.001) (0.001) (0.002)Host-country FE Yes Yes Yes Yes YesIndustry FE Yes Yes Yes Yes YesObs 397,618 99,997 99,104 100,068 98,449R square 0.05 0.06 0.07 0.06 0.06
Notes: (i) Bootstrapped standard errors are reported in the parentheses; (ii) ***, **, and *represent statistical signi�cance at 1, 5, and 10 percent, respectively.
Table 4: The Survival of Domestic Firms
Dependent (1) (2)variable: Survival SurvivalMNC entry (predicted) -0.0004*** -0.001***
(0.0001) (0.0003)Cuto¤ TFP (lagged) -0.0001*** -0.0001***
(0.0000) (0.0000)Firm TFP (lagged) 0.001***
(0.0001)Firm Revenue (lagged) 0.003***
(0.0001)Host country FE Yes YesIndustry FE Yes YesObs 407,975 616,270R square 0.06 0.10
Notes: (i) Linear probability estimates are reported; (ii) bootstrapped standard errors arereported in the parentheses; (iii) ***, **, and * represent statistical signi�cance at 1, 5, and10 percent, respectively.
39
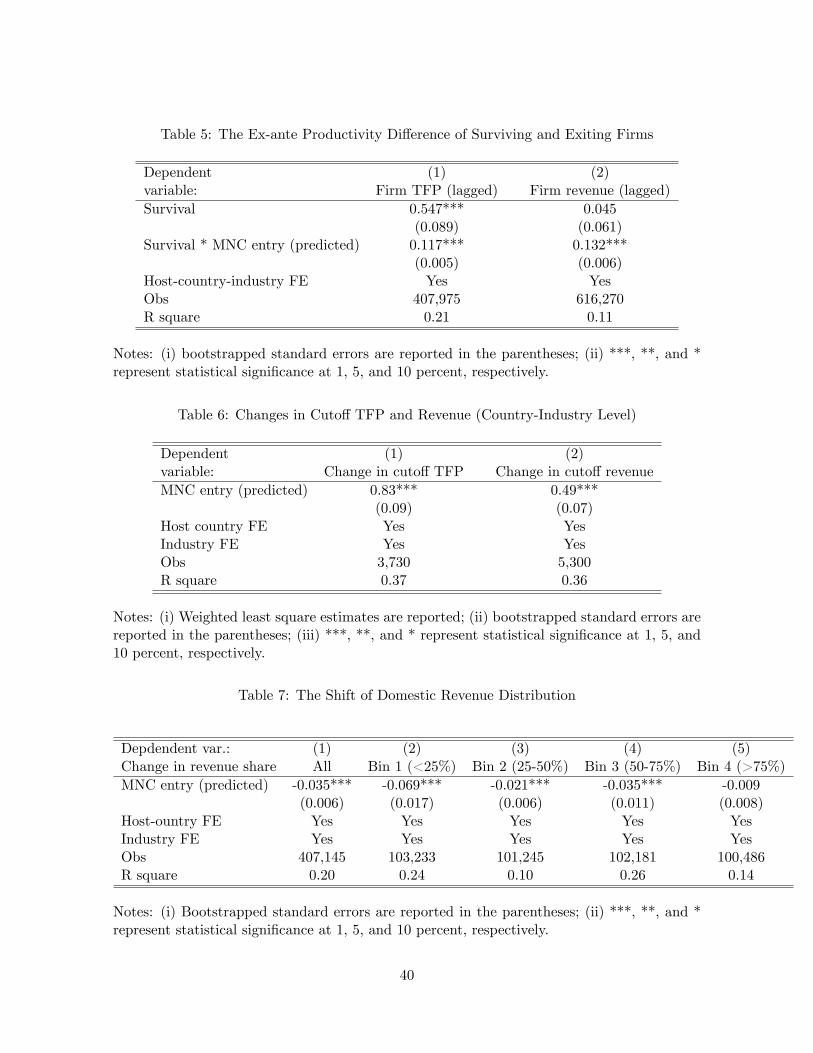
Table 5: The Ex-ante Productivity Di¤erence of Surviving and Exiting Firms
Dependent (1) (2)variable: Firm TFP (lagged) Firm revenue (lagged)Survival 0.547*** 0.045
(0.089) (0.061)Survival * MNC entry (predicted) 0.117*** 0.132***
(0.005) (0.006)Host-country-industry FE Yes YesObs 407,975 616,270R square 0.21 0.11
Notes: (i) bootstrapped standard errors are reported in the parentheses; (ii) ***, **, and *represent statistical signi�cance at 1, 5, and 10 percent, respectively.
Table 6: Changes in Cuto¤ TFP and Revenue (Country-Industry Level)
Dependent (1) (2)variable: Change in cuto¤ TFP Change in cuto¤ revenueMNC entry (predicted) 0.83*** 0.49***
(0.09) (0.07)Host country FE Yes YesIndustry FE Yes YesObs 3,730 5,300R square 0.37 0.36
Notes: (i) Weighted least square estimates are reported; (ii) bootstrapped standard errors arereported in the parentheses; (iii) ***, **, and * represent statistical signi�cance at 1, 5, and10 percent, respectively.
Table 7: The Shift of Domestic Revenue Distribution
Depdendent var.: (1) (2) (3) (4) (5)Change in revenue share All Bin 1 (<25%) Bin 2 (25-50%) Bin 3 (50-75%) Bin 4 (>75%)MNC entry (predicted) -0.035*** -0.069*** -0.021*** -0.035*** -0.009
(0.006) (0.017) (0.006) (0.011) (0.008)Host-ountry FE Yes Yes Yes Yes YesIndustry FE Yes Yes Yes Yes YesObs 407,145 103,233 101,245 102,181 100,486R square 0.20 0.24 0.10 0.26 0.14
Notes: (i) Bootstrapped standard errors are reported in the parentheses; (ii) ***, **, and *represent statistical signi�cance at 1, 5, and 10 percent, respectively.
40
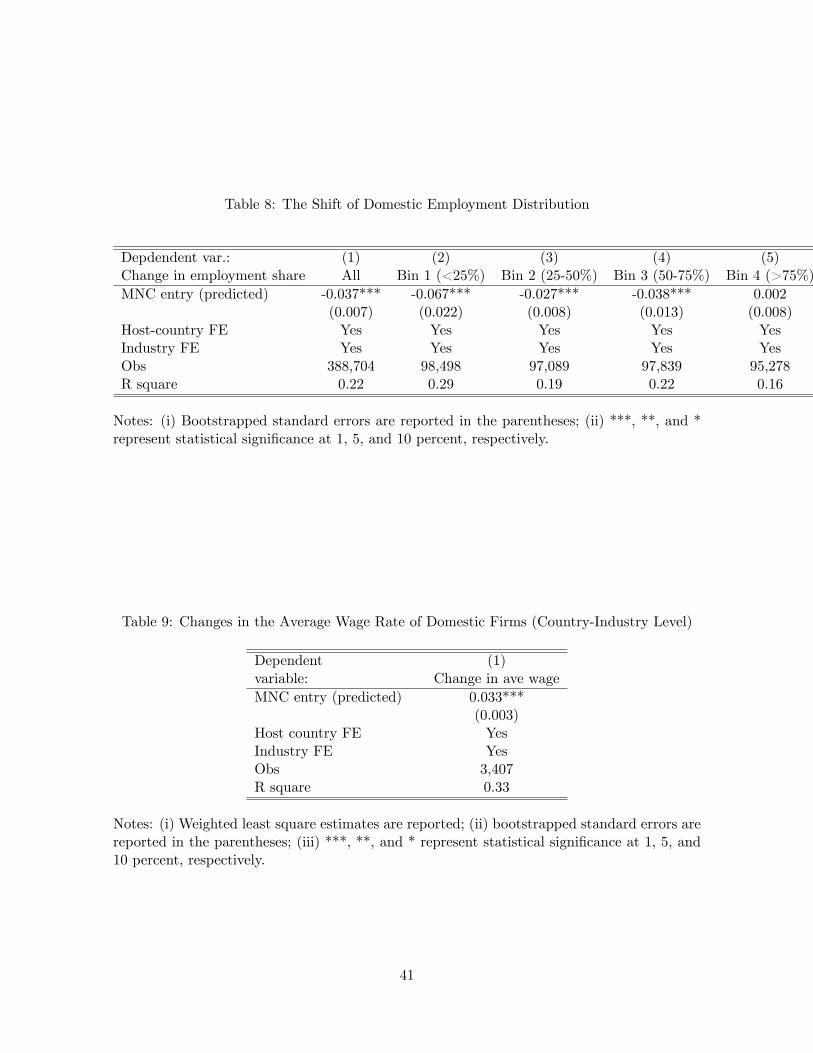
Table 8: The Shift of Domestic Employment Distribution
Depdendent var.: (1) (2) (3) (4) (5)Change in employment share All Bin 1 (<25%) Bin 2 (25-50%) Bin 3 (50-75%) Bin 4 (>75%)MNC entry (predicted) -0.037*** -0.067*** -0.027*** -0.038*** 0.002
(0.007) (0.022) (0.008) (0.013) (0.008)Host-country FE Yes Yes Yes Yes YesIndustry FE Yes Yes Yes Yes YesObs 388,704 98,498 97,089 97,839 95,278R square 0.22 0.29 0.19 0.22 0.16
Notes: (i) Bootstrapped standard errors are reported in the parentheses; (ii) ***, **, and *represent statistical signi�cance at 1, 5, and 10 percent, respectively.
Table 9: Changes in the Average Wage Rate of Domestic Firms (Country-Industry Level)
Dependent (1)variable: Change in ave wageMNC entry (predicted) 0.033***
(0.003)Host country FE YesIndustry FE YesObs 3,407R square 0.33
Notes: (i) Weighted least square estimates are reported; (ii) bootstrapped standard errors arereported in the parentheses; (iii) ***, **, and * represent statistical signi�cance at 1, 5, and10 percent, respectively.
41
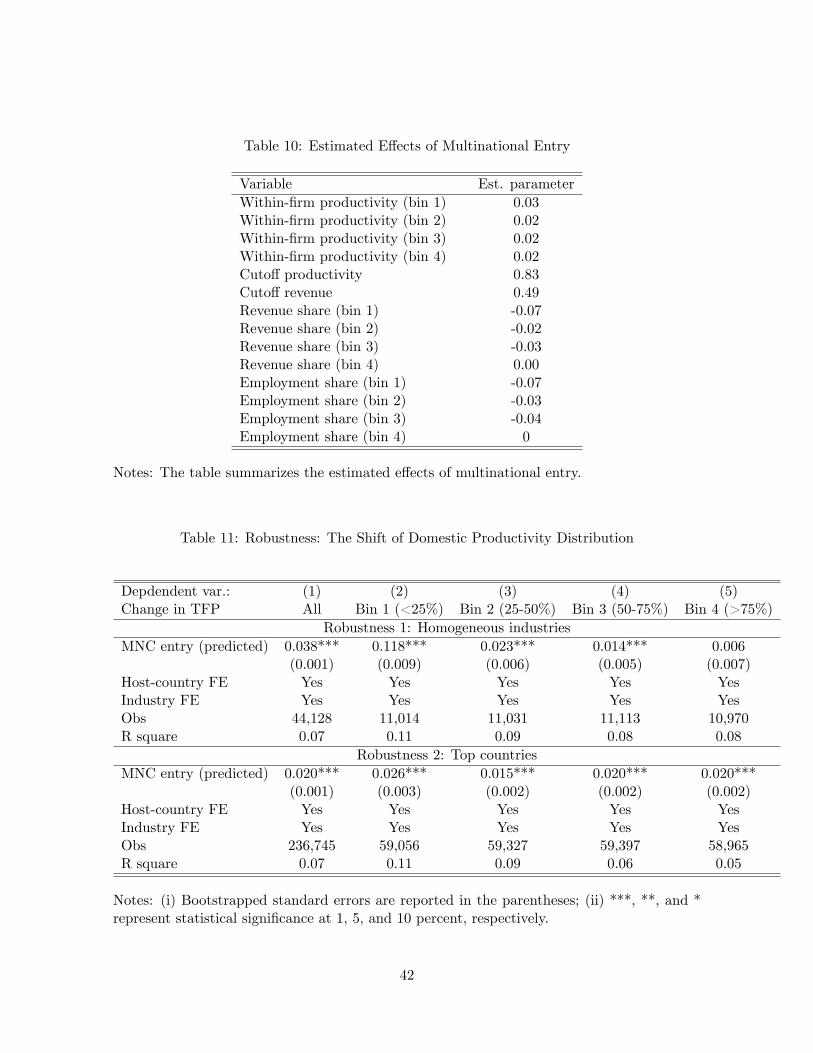
Table 10: Estimated E¤ects of Multinational Entry
Variable Est. parameterWithin-�rm productivity (bin 1) 0.03Within-�rm productivity (bin 2) 0.02Within-�rm productivity (bin 3) 0.02Within-�rm productivity (bin 4) 0.02Cuto¤ productivity 0.83Cuto¤ revenue 0.49Revenue share (bin 1) -0.07Revenue share (bin 2) -0.02Revenue share (bin 3) -0.03Revenue share (bin 4) 0.00Employment share (bin 1) -0.07Employment share (bin 2) -0.03Employment share (bin 3) -0.04Employment share (bin 4) 0
Notes: The table summarizes the estimated e¤ects of multinational entry.
Table 11: Robustness: The Shift of Domestic Productivity Distribution
Depdendent var.: (1) (2) (3) (4) (5)Change in TFP All Bin 1 (<25%) Bin 2 (25-50%) Bin 3 (50-75%) Bin 4 (>75%)
Robustness 1: Homogeneous industriesMNC entry (predicted) 0.038*** 0.118*** 0.023*** 0.014*** 0.006
(0.001) (0.009) (0.006) (0.005) (0.007)Host-country FE Yes Yes Yes Yes YesIndustry FE Yes Yes Yes Yes YesObs 44,128 11,014 11,031 11,113 10,970R square 0.07 0.11 0.09 0.08 0.08
Robustness 2: Top countriesMNC entry (predicted) 0.020*** 0.026*** 0.015*** 0.020*** 0.020***
(0.001) (0.003) (0.002) (0.002) (0.002)Host-country FE Yes Yes Yes Yes YesIndustry FE Yes Yes Yes Yes YesObs 236,745 59,056 59,327 59,397 58,965R square 0.07 0.11 0.09 0.06 0.05
Notes: (i) Bootstrapped standard errors are reported in the parentheses; (ii) ***, **, and *represent statistical signi�cance at 1, 5, and 10 percent, respectively.
42
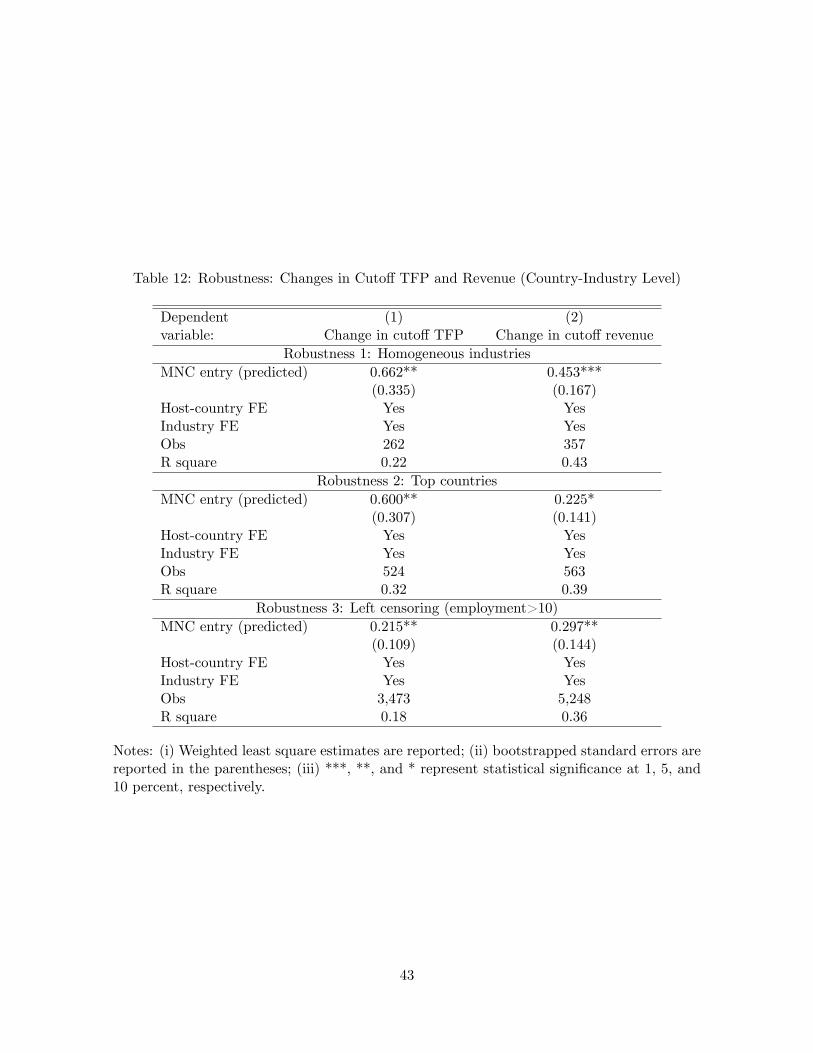
Table 12: Robustness: Changes in Cuto¤ TFP and Revenue (Country-Industry Level)
Dependent (1) (2)variable: Change in cuto¤ TFP Change in cuto¤ revenue
Robustness 1: Homogeneous industriesMNC entry (predicted) 0.662** 0.453***
(0.335) (0.167)Host-country FE Yes YesIndustry FE Yes YesObs 262 357R square 0.22 0.43
Robustness 2: Top countriesMNC entry (predicted) 0.600** 0.225*
(0.307) (0.141)Host-country FE Yes YesIndustry FE Yes YesObs 524 563R square 0.32 0.39
Robustness 3: Left censoring (employment>10)MNC entry (predicted) 0.215** 0.297**
(0.109) (0.144)Host-country FE Yes YesIndustry FE Yes YesObs 3,473 5,248R square 0.18 0.36
Notes: (i) Weighted least square estimates are reported; (ii) bootstrapped standard errors arereported in the parentheses; (iii) ***, **, and * represent statistical signi�cance at 1, 5, and10 percent, respectively.
43
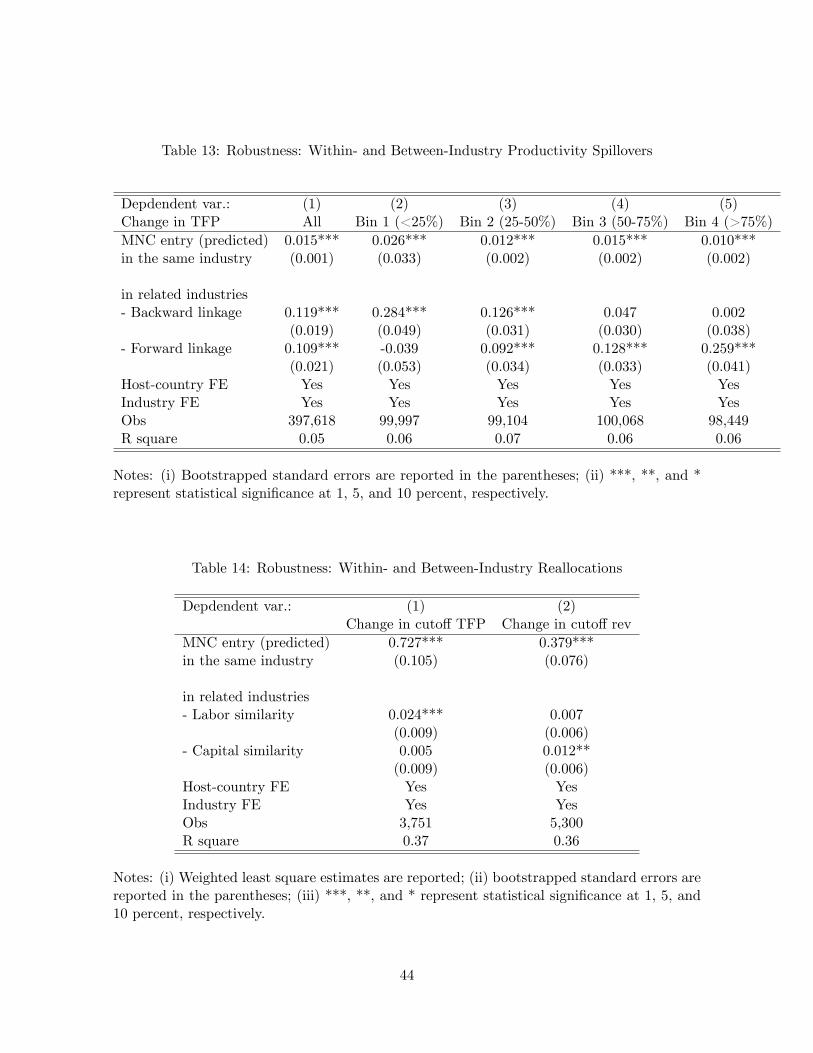
Table 13: Robustness: Within- and Between-Industry Productivity Spillovers
Depdendent var.: (1) (2) (3) (4) (5)Change in TFP All Bin 1 (<25%) Bin 2 (25-50%) Bin 3 (50-75%) Bin 4 (>75%)MNC entry (predicted) 0.015*** 0.026*** 0.012*** 0.015*** 0.010***in the same industry (0.001) (0.033) (0.002) (0.002) (0.002)
in related industries- Backward linkage 0.119*** 0.284*** 0.126*** 0.047 0.002
(0.019) (0.049) (0.031) (0.030) (0.038)- Forward linkage 0.109*** -0.039 0.092*** 0.128*** 0.259***
(0.021) (0.053) (0.034) (0.033) (0.041)Host-country FE Yes Yes Yes Yes YesIndustry FE Yes Yes Yes Yes YesObs 397,618 99,997 99,104 100,068 98,449R square 0.05 0.06 0.07 0.06 0.06
Notes: (i) Bootstrapped standard errors are reported in the parentheses; (ii) ***, **, and *represent statistical signi�cance at 1, 5, and 10 percent, respectively.
Table 14: Robustness: Within- and Between-Industry Reallocations
Depdendent var.: (1) (2)Change in cuto¤ TFP Change in cuto¤ rev
MNC entry (predicted) 0.727*** 0.379***in the same industry (0.105) (0.076)
in related industries- Labor similarity 0.024*** 0.007
(0.009) (0.006)- Capital similarity 0.005 0.012**
(0.009) (0.006)Host-country FE Yes YesIndustry FE Yes YesObs 3,751 5,300R square 0.37 0.36
Notes: (i) Weighted least square estimates are reported; (ii) bootstrapped standard errors arereported in the parentheses; (iii) ***, **, and * represent statistical signi�cance at 1, 5, and10 percent, respectively.
44
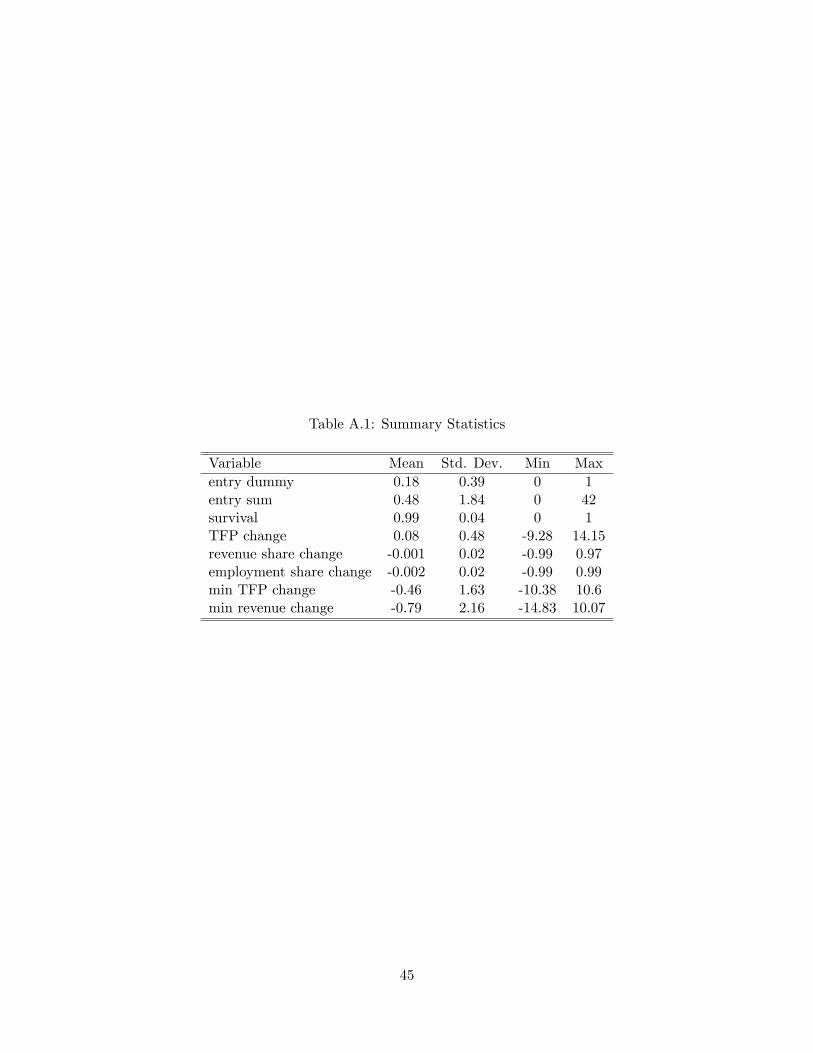
Table A.1: Summary Statistics
Variable Mean Std. Dev. Min Maxentry dummy 0.18 0.39 0 1entry sum 0.48 1.84 0 42survival 0.99 0.04 0 1TFP change 0.08 0.48 -9.28 14.15revenue share change -0.001 0.02 -0.99 0.97employment share change -0.002 0.02 -0.99 0.99min TFP change -0.46 1.63 -10.38 10.6min revenue change -0.79 2.16 -14.83 10.07
45