Embed Size (px)
Citation preview
Selection and Agreement on the most appropriate modelling platform to develop Operating Rules for the Save Basin
10 February 2014
In support of: Prepared by:
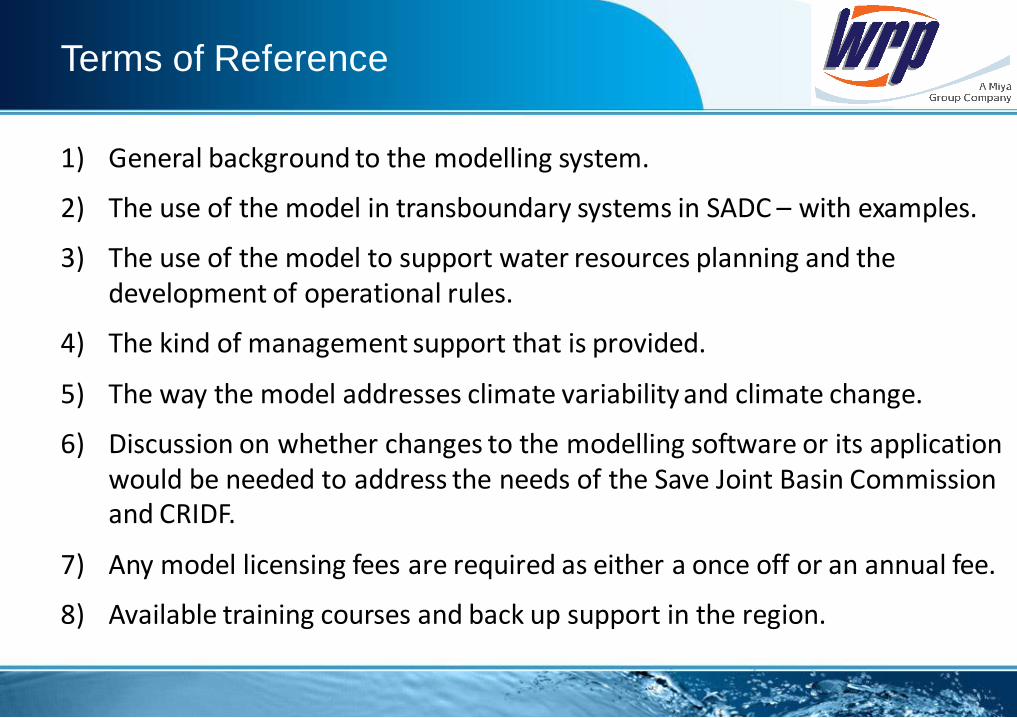
1) General background to the modelling system.
2) The use of the model in transboundary systems in SADC – with examples.
3) The use of the model to support water resources planning and the development of operational rules.
4) The kind of management support that is provided.
5) The way the model addresses climate variability and climate change.
6) Discussion on whether changes to the modelling software or its application would be needed to address the needs of the Save Joint Basin Commission and CRIDF.
7) Any model licensing fees are required as either a once off or an annual fee.
8) Available training courses and back up support in the region.
Terms of Reference
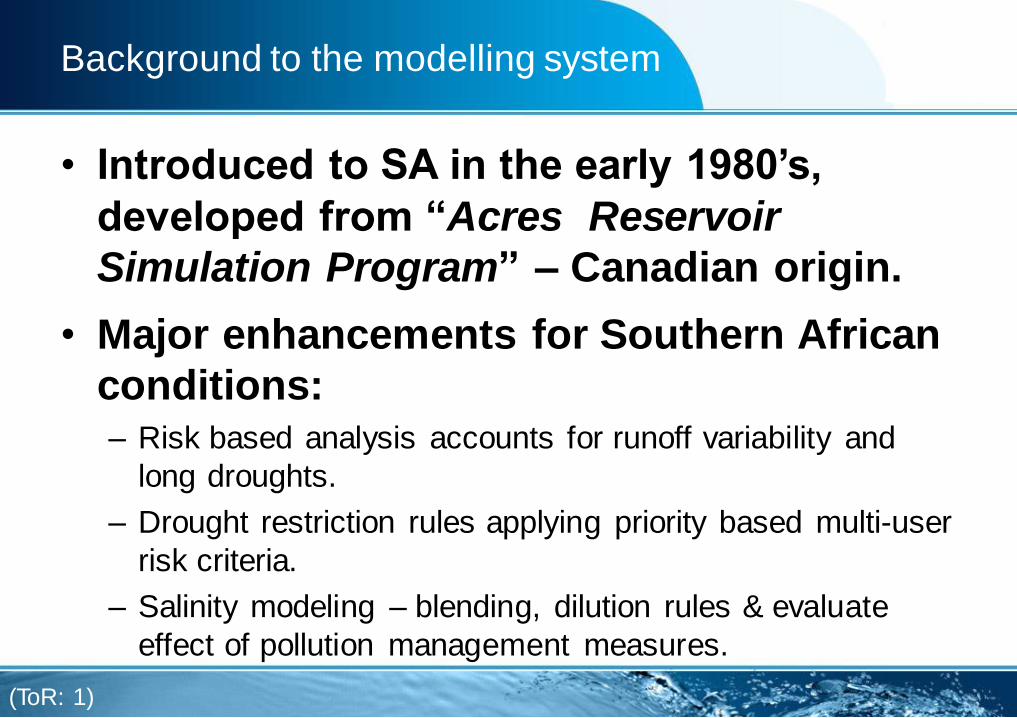
• Introduced to SA in the early 1980’s,
developed from “Acres Reservoir
Simulation Program” – Canadian origin.
• Major enhancements for Southern African
conditions: – Risk based analysis accounts for runoff variability and
long droughts.
– Drought restriction rules applying priority based multi-user
risk criteria.
– Salinity modeling – blending, dilution rules & evaluate
effect of pollution management measures.
Background to the modelling system
(ToR: 1)
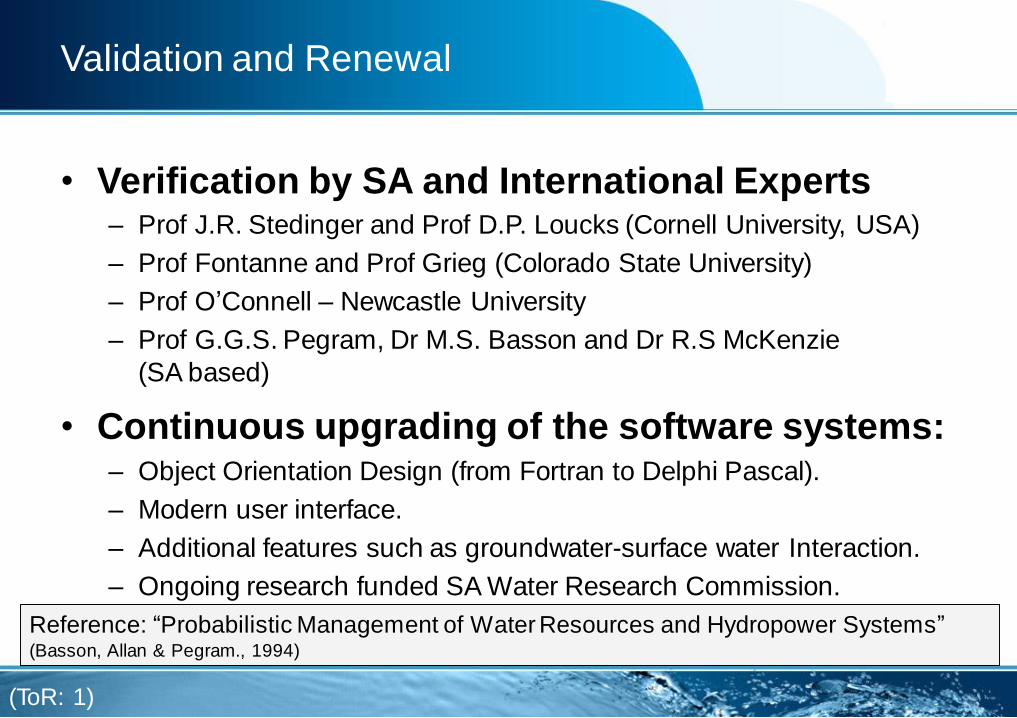
• Verification by SA and International Experts– Prof J.R. Stedinger and Prof D.P. Loucks (Cornell University, USA)
– Prof Fontanne and Prof Grieg (Colorado State University)
– Prof O’Connell – Newcastle University
– Prof G.G.S. Pegram, Dr M.S. Basson and Dr R.S McKenzie
(SA based)
• Continuous upgrading of the software systems:– Object Orientation Design (from Fortran to Delphi Pascal).
– Modern user interface.
– Additional features such as groundwater-surface water Interaction.
– Ongoing research funded SA Water Research Commission.
Validation and Renewal
Reference: “Probabilistic Management of Water Resources and Hydropower Systems”(Basson, Allan & Pegram., 1994)
(ToR: 1)
• Linear network solver:– Optimising flows in time step (monthly) according to user-
defined weights which implements the required operating regime.
– Supply priority hierarchy achieved irrespective of the position of the abstraction in the system.
– Account for physical, continuity and connectivity constraints.
• Risk analysis:– Rigorous multi-site stochastic stream flow generator
accounting for cross and serial correlations and maintain historical statistical characteristics.
Core simulation engines
(ToR: 1)
• Water Resource Yield Model:– Constant development simulations to perform long-term
historical and stochastic (risk based) yield analysis.
– Optimisation of inter sub-system operating rules.
– Generate short-term yield reliability characteristics as input to WRPM, driver of risk based drought restriction rules.
• Water Resource Planning Model:– Projection analysis for operational and development planning
decision support.
– Dynamic changing water use, new infrastructure, maintenance schedule and project the risk of drought curtailments.
Purpose of WRYM and WRPM
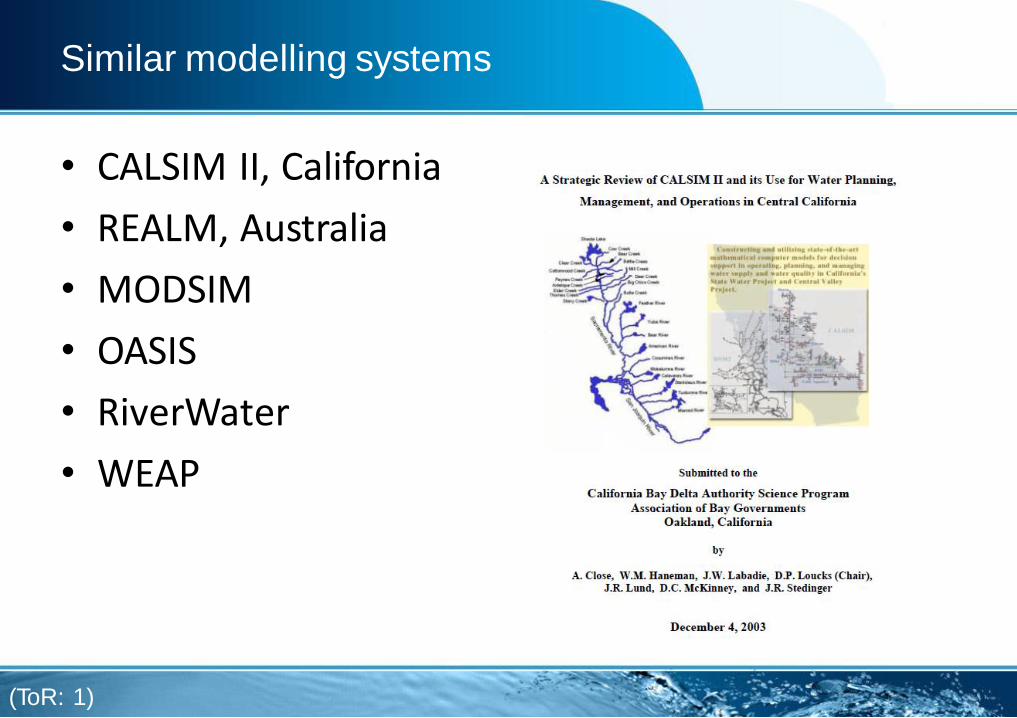
• CALSIM II, California
• REALM, Australia
• MODSIM
• OASIS
• RiverWater
• WEAP
Similar modelling systems
(ToR: 1)
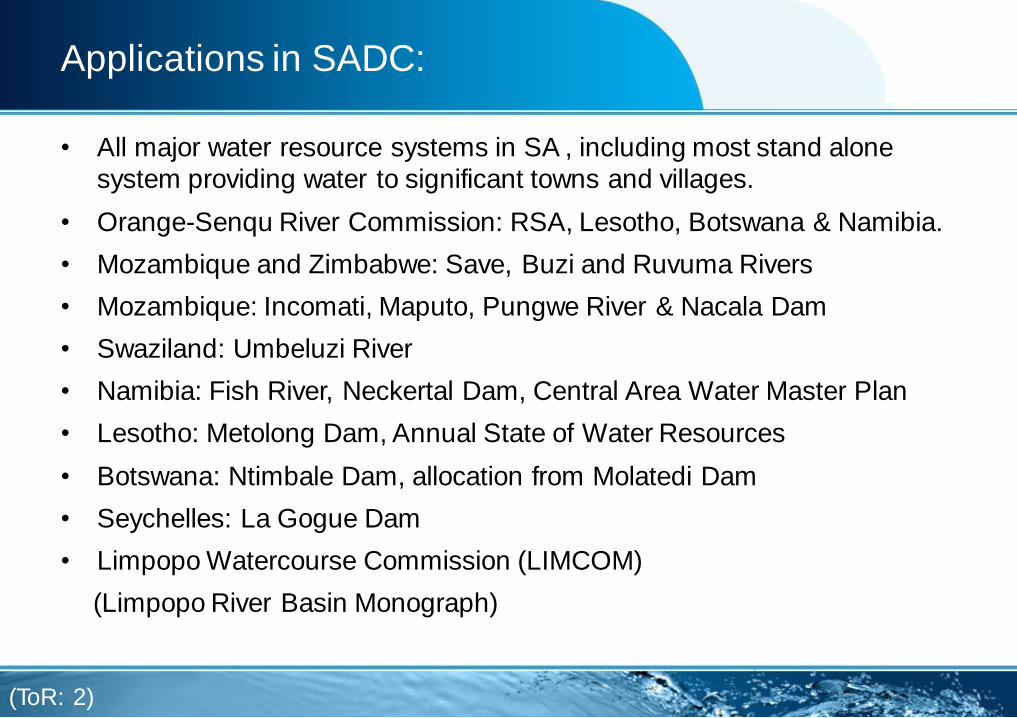
• All major water resource systems in SA , including most stand alone
system providing water to significant towns and villages.
• Orange-Senqu River Commission: RSA, Lesotho, Botswana & Namibia.
• Mozambique and Zimbabwe: Save, Buzi and Ruvuma Rivers
• Mozambique: Incomati, Maputo, Pungwe River & Nacala Dam
• Swaziland: Umbeluzi River
• Namibia: Fish River, Neckertal Dam, Central Area Water Master Plan
• Lesotho: Metolong Dam, Annual State of Water Resources
• Botswana: Ntimbale Dam, allocation from Molatedi Dam
• Seychelles: La Gogue Dam
• Limpopo Watercourse Commission (LIMCOM)
(Limpopo River Basin Monograph)
Applications in SADC:
(ToR: 2)
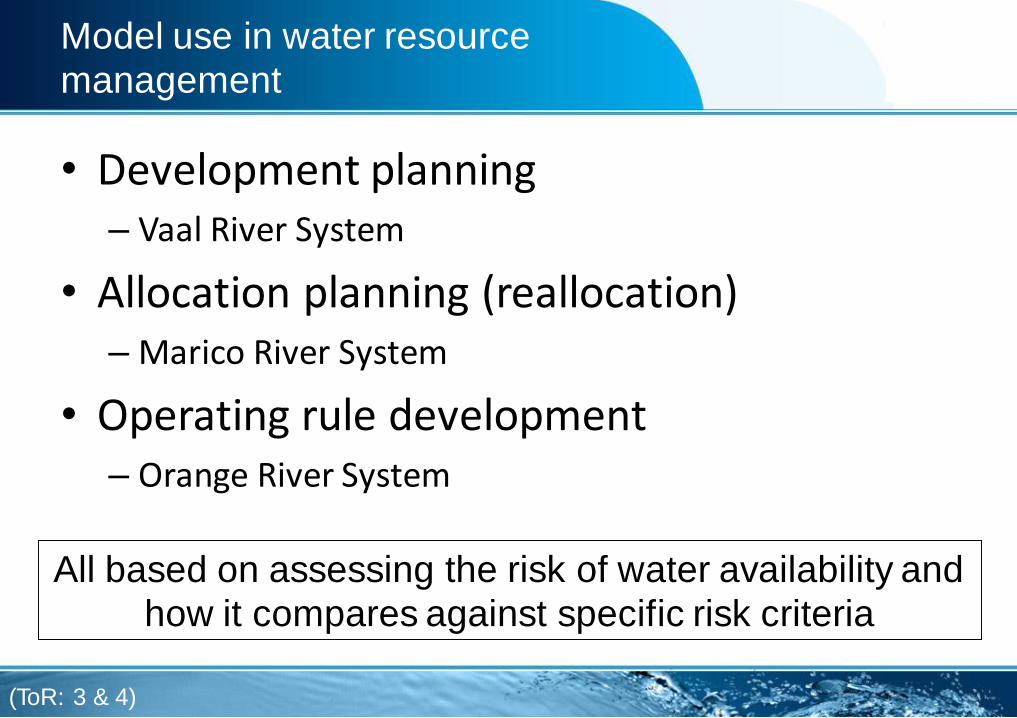
• Development planning– Vaal River System
• Allocation planning (reallocation)– Marico River System
• Operating rule development– Orange River System
Model use in water resource
management
All based on assessing the risk of water availability and
how it compares against specific risk criteria
(ToR: 3 & 4)
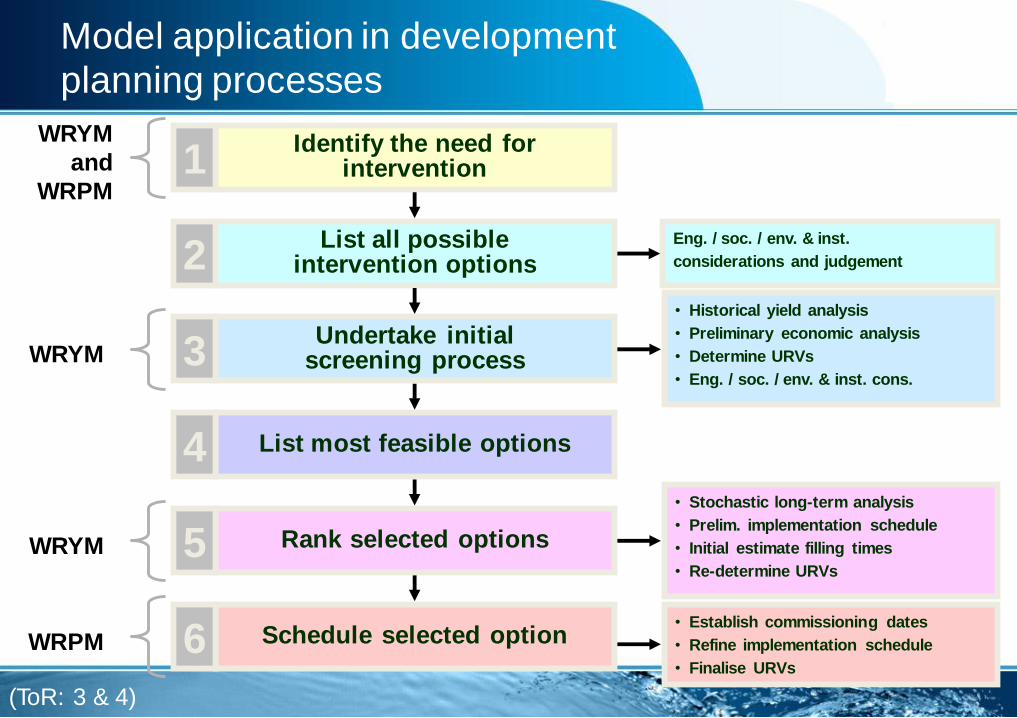
• Historical yield analysis
• Preliminary economic analysis
• Determine URVs
• Eng. / soc. / env. & inst. cons.
• Stochastic long-term analysis
• Prelim. implementation schedule
• Initial estimate filling times
• Re-determine URVs
• Establish commissioning dates
• Refine implementation schedule
• Finalise URVs
Eng. / soc. / env. & inst.
considerations and judgement
Identify the need forintervention
Undertake initialscreening process
List most feasible options
Rank selected options
Schedule selected option
1
3
4
5
6
List all possibleintervention options2
WRYM
and
WRPM
WRYM
WRYM
WRPM
Model application in development
planning processes
(ToR: 3 & 4)
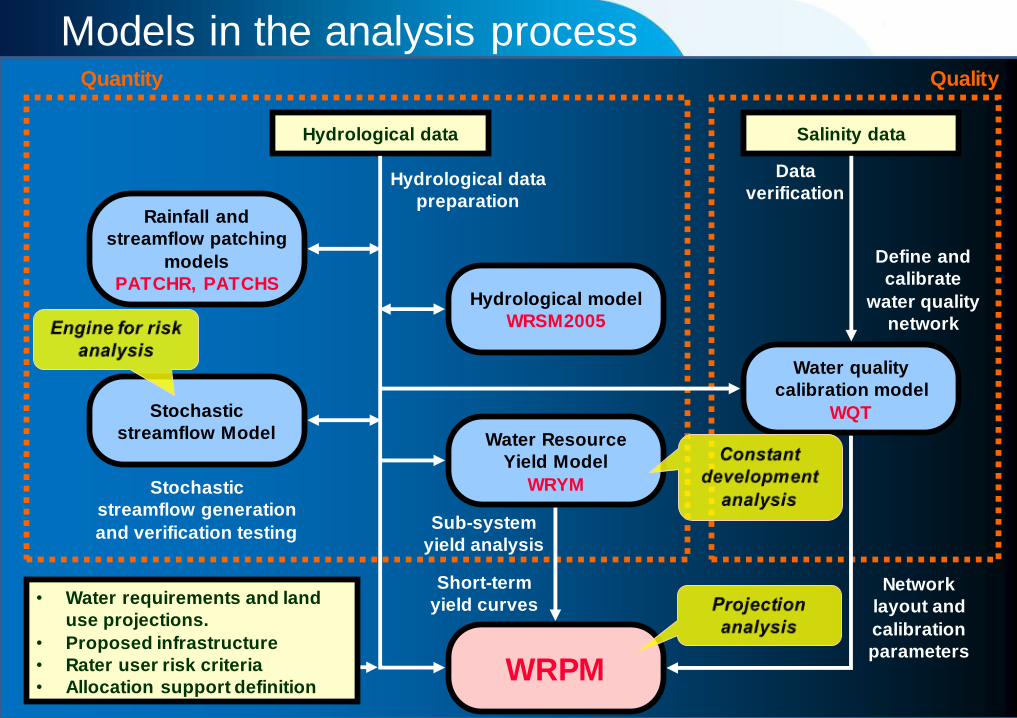
Models in the analysis process
Hydrological data Salinity data
Data
verification
Define and
calibrate
water quality
network
Network
layout and
calibration
parameters
Sub-system
yield analysis
Short-term
yield curves
Hydrological data
preparation
Stochastic
streamflow generation
and verification testing
Quantity Quality
WRPM
Water Resource
Yield Model
WRYM
Hydrological model
WRSM2005
Rainfall and
streamflow patching
models
PATCHR, PATCHS
Stochastic
streamflow Model
Water quality
calibration model
WQT
• Water requirements and land
use projections.
• Proposed infrastructure
• Rater user risk criteria
• Allocation support definition
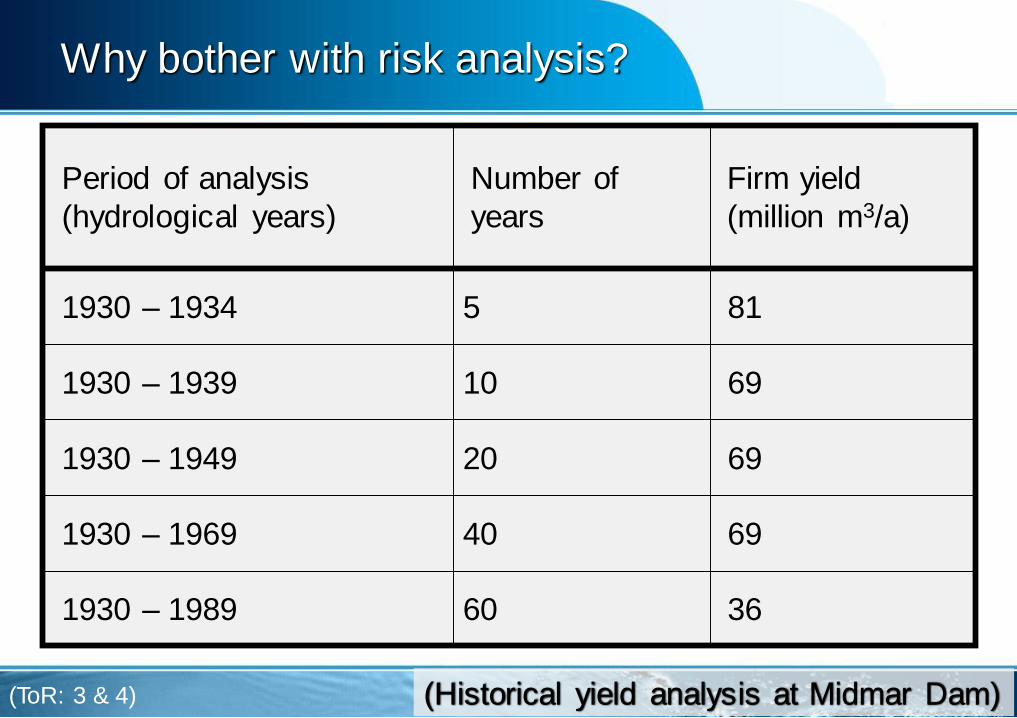
(Historical yield analysis at Midmar Dam)
Period of analysis
(hydrological years)
Firm yield
(million m3/a)
Number of
years
1930 – 1934 815
1930 – 1939 6910
1930 – 1949 6920
1930 – 1969 6940
1930 – 1989 3660
Why bother with risk analysis?
(ToR: 3 & 4)
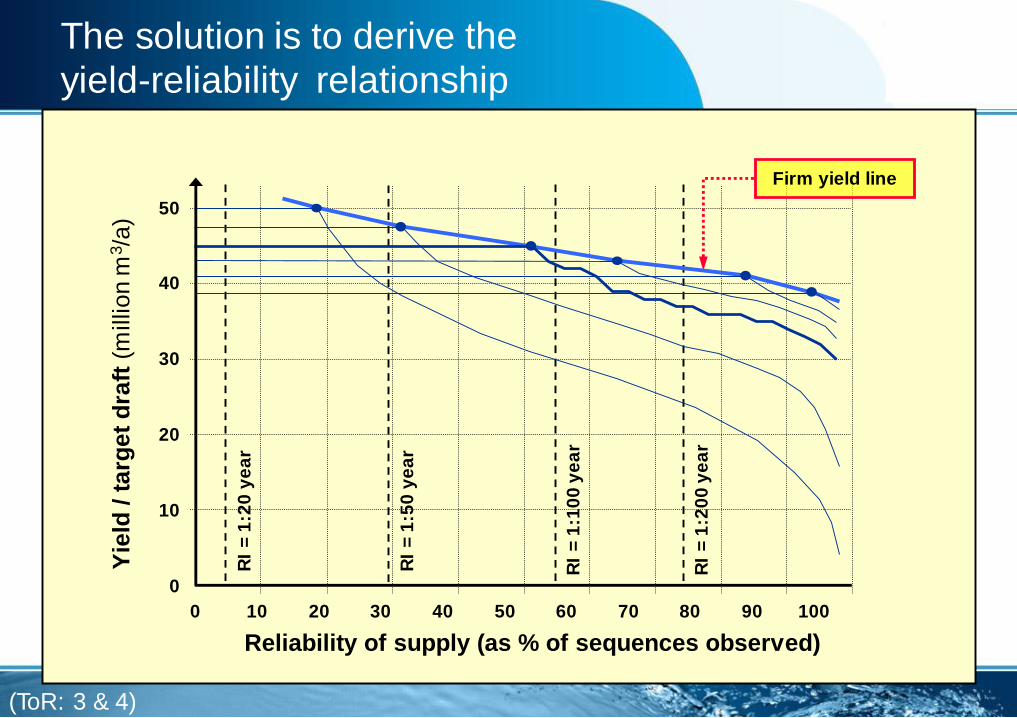
The solution is to derive the
yield-reliability relationship
RI
= 1
:20
0 y
ea
r
RI
= 1
:10
0 y
ea
r
RI
= 1
:20
ye
ar
RI
= 1
:50
ye
ar
0 10 20 30 40 50 60 70 80 90 100
Reliability of supply (as % of sequences observed)
50
40
30
20
10
0
Yie
ld /
ta
rge
t d
raft
(m
illio
n m
3/a
)
Firm yield line
(ToR: 3 & 4)
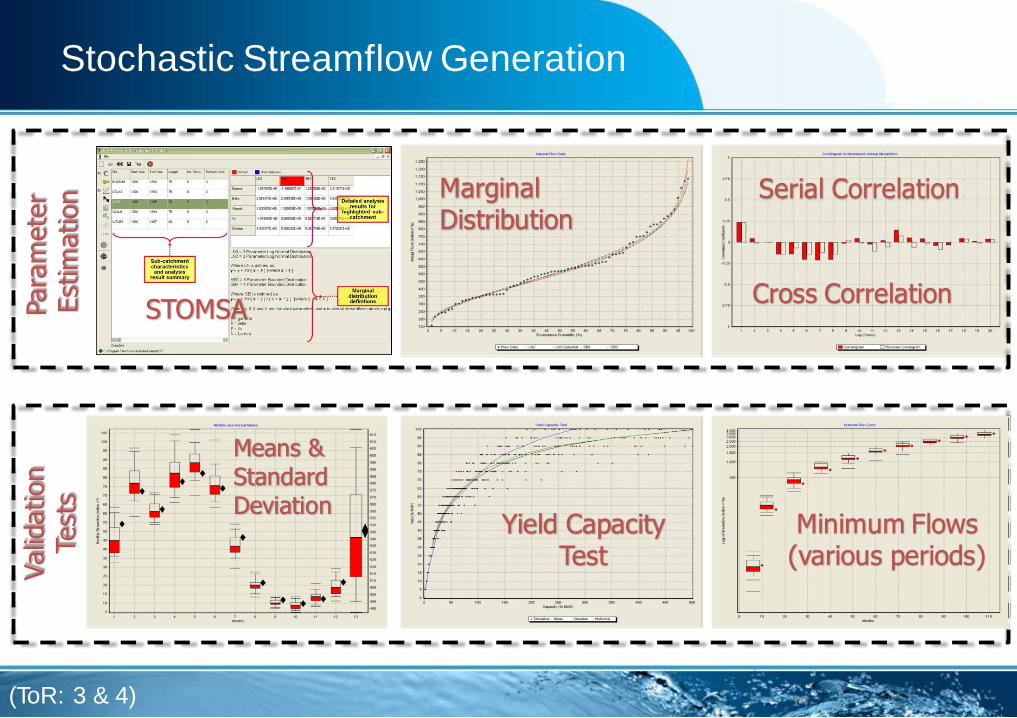
Stochastic Streamflow Generation
14
Para
mete
r Est
imation
STOMSA
Marginal Distribution
Serial Correlation
Cross Correlation
Valid
ation
Test
s
Means & Standard Deviation
Yield CapacityTest
Minimum Flows(various periods)
(ToR: 3 & 4)
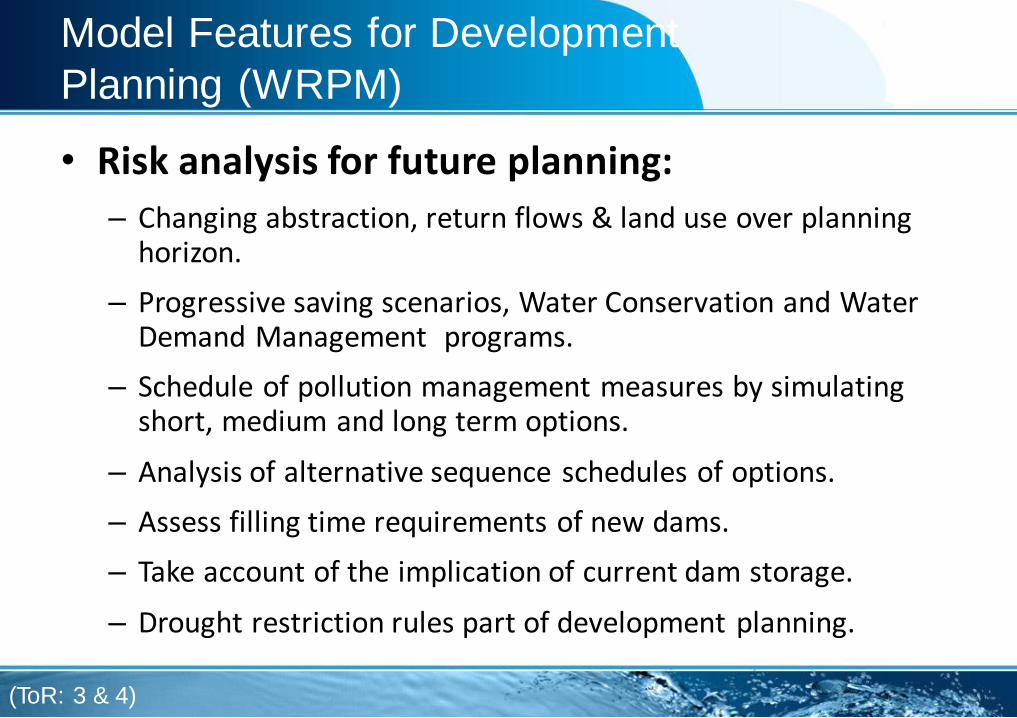
• Risk analysis for future planning:
– Changing abstraction, return flows & land use over planning horizon.
– Progressive saving scenarios, Water Conservation and Water Demand Management programs.
– Schedule of pollution management measures by simulating short, medium and long term options.
– Analysis of alternative sequence schedules of options.
– Assess filling time requirements of new dams.
– Take account of the implication of current dam storage.
– Drought restriction rules part of development planning.
Model Features for Development
Planning (WRPM)
(ToR: 3 & 4)
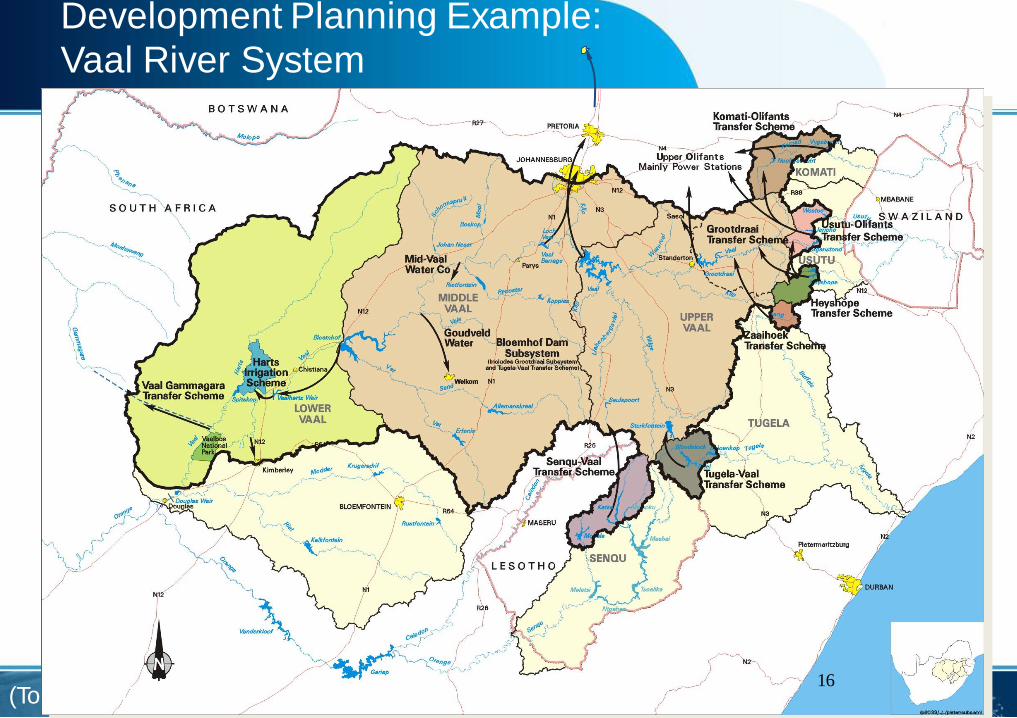
Development Planning Example:
Vaal River System
16(ToR: 3 & 4)
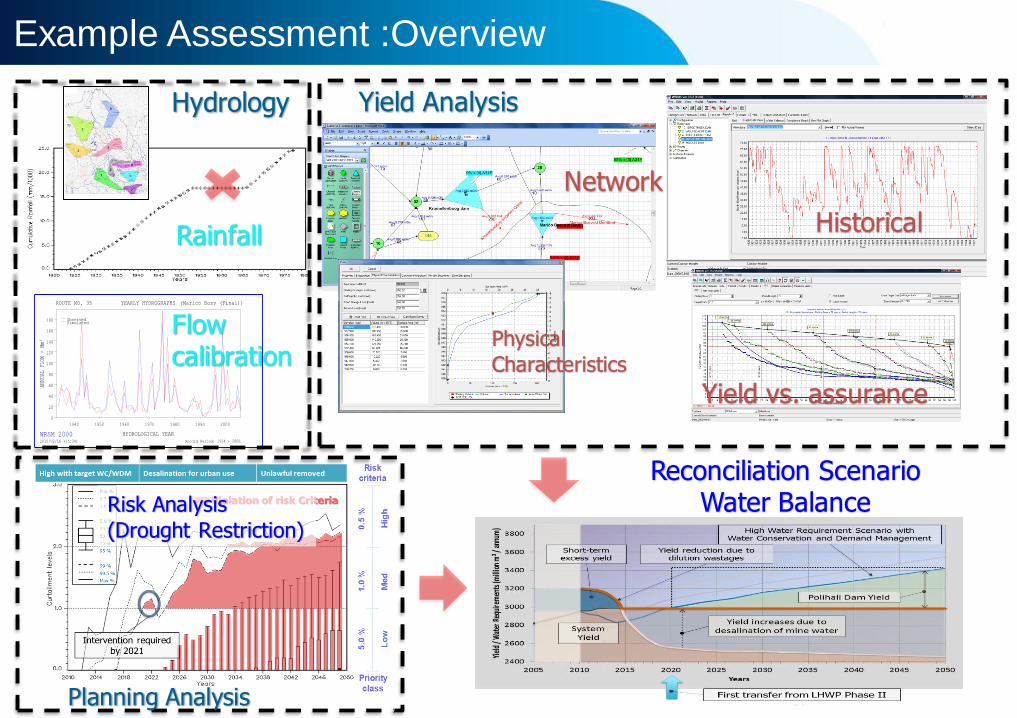
Example Assessment :Overview
17
YEARLY HYDROGRAPHS
HYDROLOGICAL YEAR
ANNUAL FLOW - Mm³
1940 1950 1960 1970 1980 1990 2000
0
20
40
60
80
100
120
140
160
180 Observed Simulated
ROUTE NO. 35 (Marico Bosv (Final))
WRSM 20002010/02/16 (15:34) Record Period: 1934 - 2006
Hydrology
Rainfall
Flow calibration
Yield Analysis
Network
Historical
Yield vs. assurance
Physical
Characteristics
Risk Analysis
(Drought Restriction)
Reconciliation Scenario Water Balance
Planning Analysis
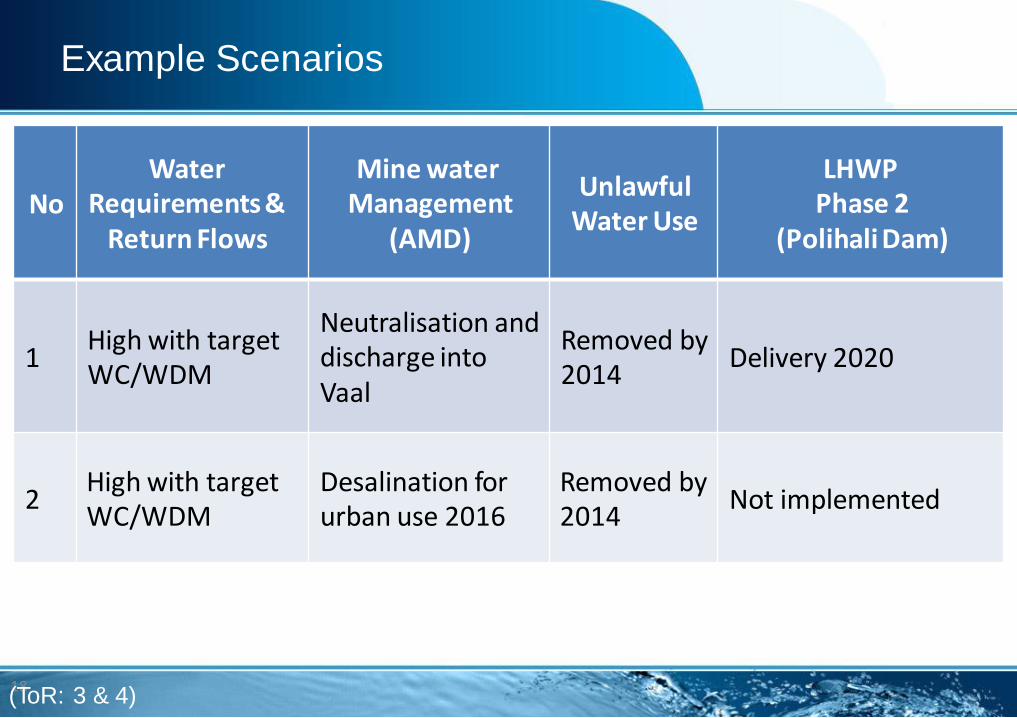
Example Scenarios
18
NoWater
Requirements & Return Flows
Mine water Management
(AMD)
Unlawful Water Use
LHWPPhase 2
(Polihali Dam)
1High with target WC/WDM
Neutralisation and discharge into Vaal
Removed by 2014
Delivery 2020
2High with target WC/WDM
Desalination forurban use 2016
Removed by 2014
Not implemented
(ToR: 3 & 4)
2400
2600
2800
3000
3200
3400
3600
3800
2005 2010 2015 2020 2025 2030 2035 2040 2045 2050
Wat
er
Re
qu
ire
me
nts
(m
illi
on
m3/a
nn
um
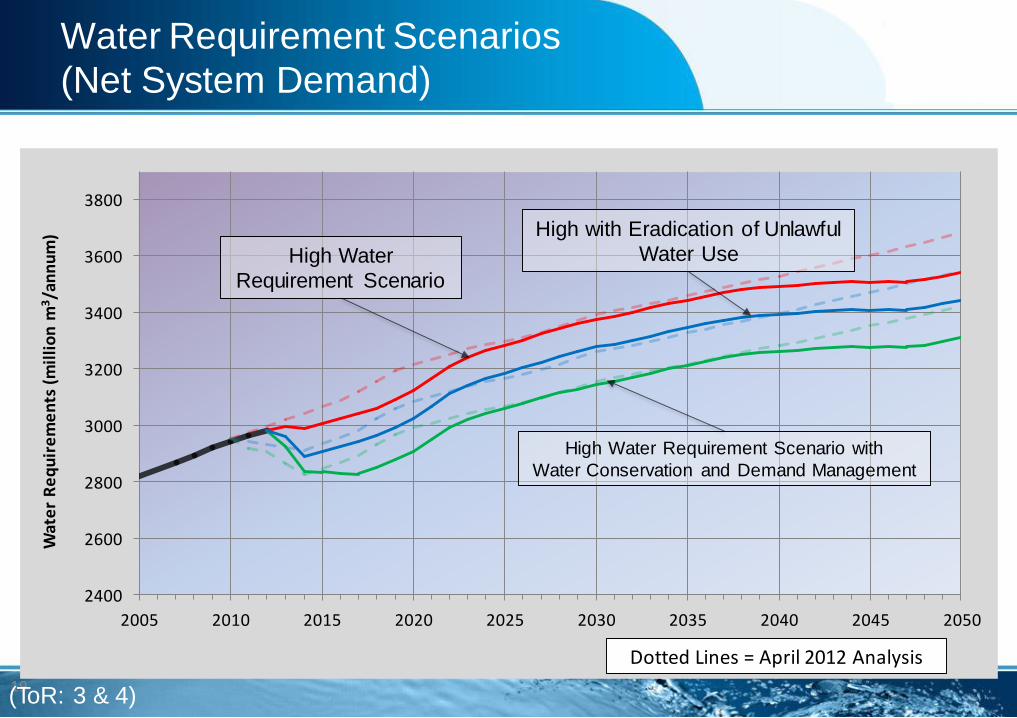
)Water Requirement Scenarios
(Net System Demand)
19
High Water
Requirement Scenario
High with Eradication of Unlawful
Water Use
High Water Requirement Scenario with
Water Conservation and Demand Management
Dotted Lines = April 2012 Analysis
(ToR: 3 & 4)
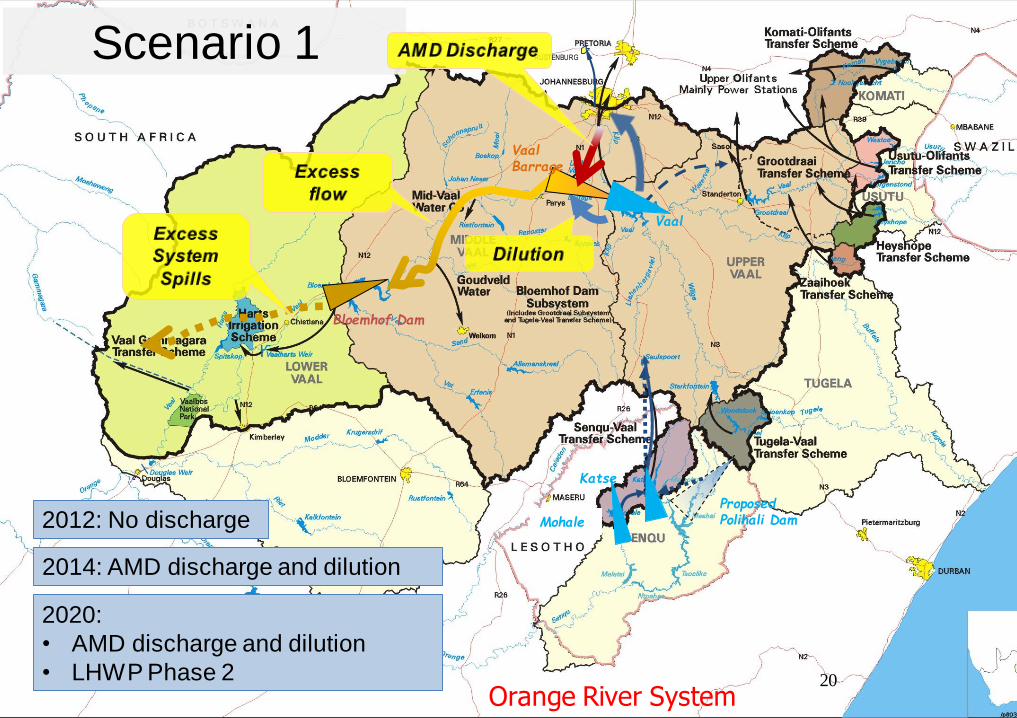
RUSTENBURG
20
Bloemhof Dam
Vaal
Katse
Proposed Polihali DamMohale
Orange River System
2012: No discharge
2014: AMD discharge and dilution
2020:
• AMD discharge and dilution
• LHWP Phase 2
Scenario 1
Vaal Barrage
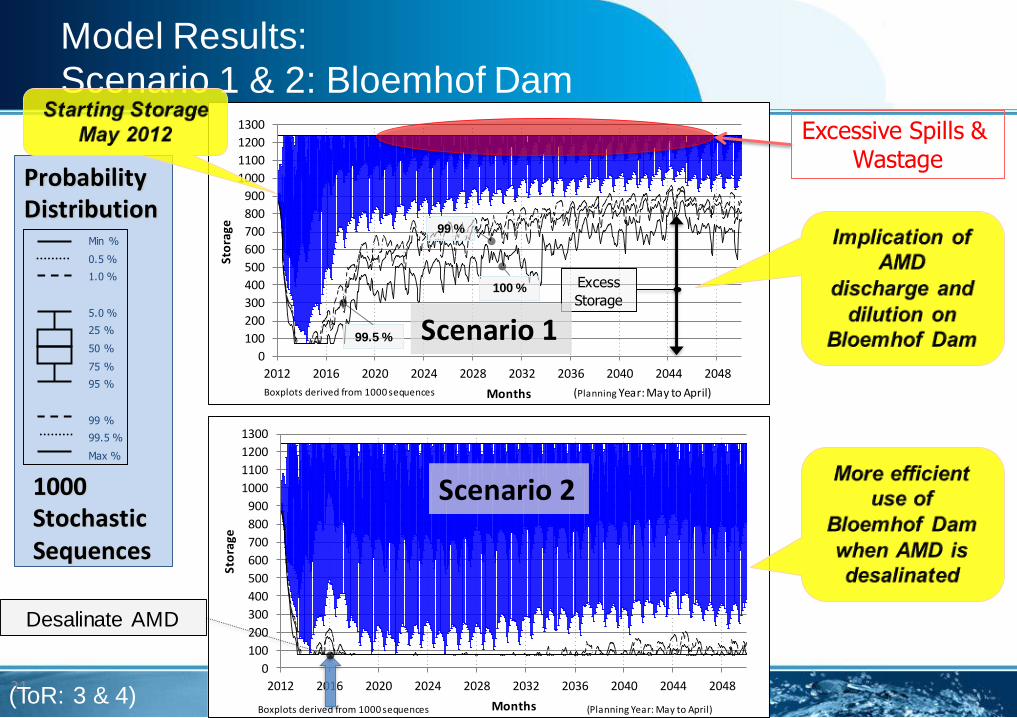
Model Results:
Scenario 1 & 2: Bloemhof Dam
21
0
100
200
300
400
500
600
700
800
900
1000
1100
1200
1300
2012 2016 2020 2024 2028 2032 2036 2040 2044 2048
Sto
rage
MonthsBoxplots derived from 1000 sequences (Planning Year: May to April)
Excess
Storage
0
100
200
300
400
500
600
700
800
900
1000
1100
1200
1300
2012 2016 2020 2024 2028 2032 2036 2040 2044 2048
Sto
rage
MonthsBoxplots derived from 1000 sequences (Planning Year: May to April)
Scenario 2
Excessive Spills & Wastage
Min %
0.5 %
1.0 %
5.0 %
25 %
50 %
75 %
95 %
99 %
99.5 %
Max %
Probability Distribution
Scenario 1
(ToR: 3 & 4)
Desalinate AMD
100 %
99.5 %
99 %
1000 Stochastic Sequences
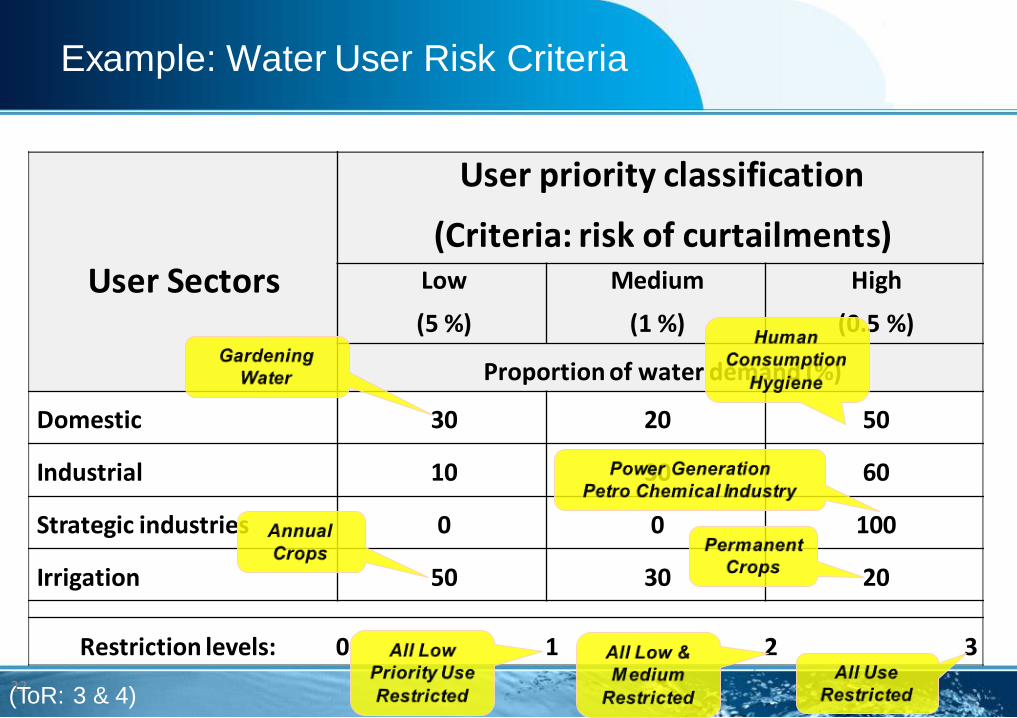
Example: Water User Risk Criteria
22
User Sectors
User priority classification
(Criteria: risk of curtailments)Low
(5 %)
Medium
(1 %)
High
(0.5 %)
Proportion of water demand (%)
Domestic 30 20 50
Industrial 10 30 60
Strategic industries 0 0 100
Irrigation 50 30 20
Restriction levels: 0 1 2 3
(ToR: 3 & 4)
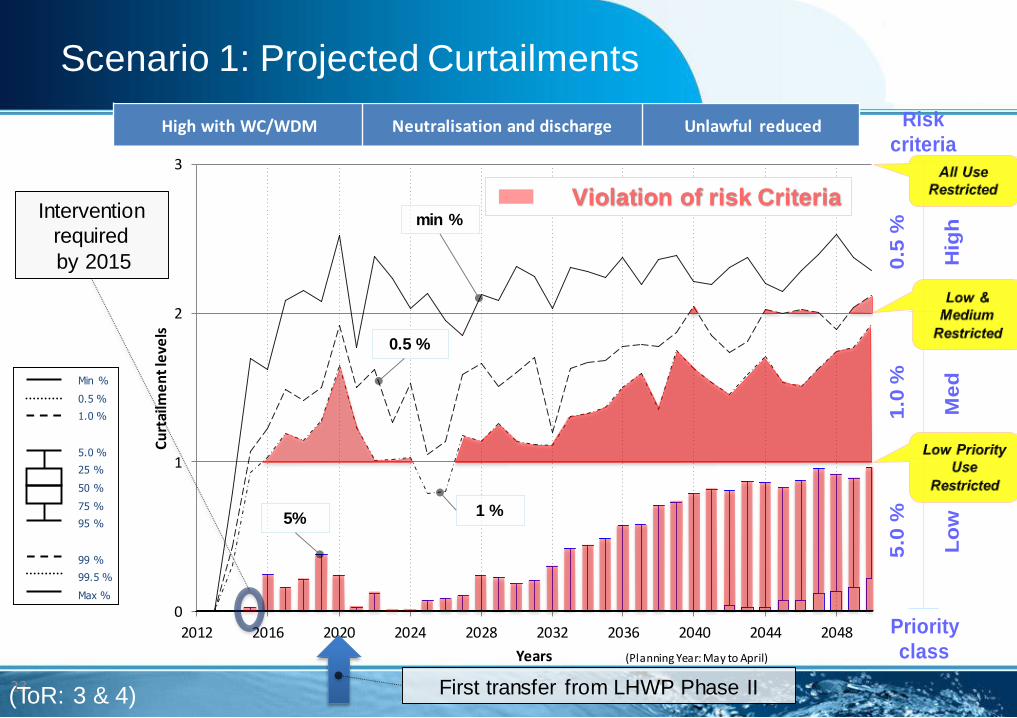
0
1
2
3
2012 2016 2020 2024 2028 2032 2036 2040 2044 2048
Cu
rtai
lme
nt
leve
ls
Years (Planning Year: May to April)
Scenario 1: Projected Curtailments
23
Min %
0.5 %
1.0 %
5.0 %
25 %
50 %
75 %
95 %
99 %
99.5 %
Max %
5.0
%
1.0
%
0
.5 %
Lo
w
Me
d
H
igh
Priority
class
Risk
criteria
Violation of risk CriteriaIntervention
required
by 2015
First transfer from LHWP Phase II
High with WC/WDM Neutralisation and discharge Unlawful reduced
1 %
0.5 %
min %
5%
(ToR: 3 & 4)
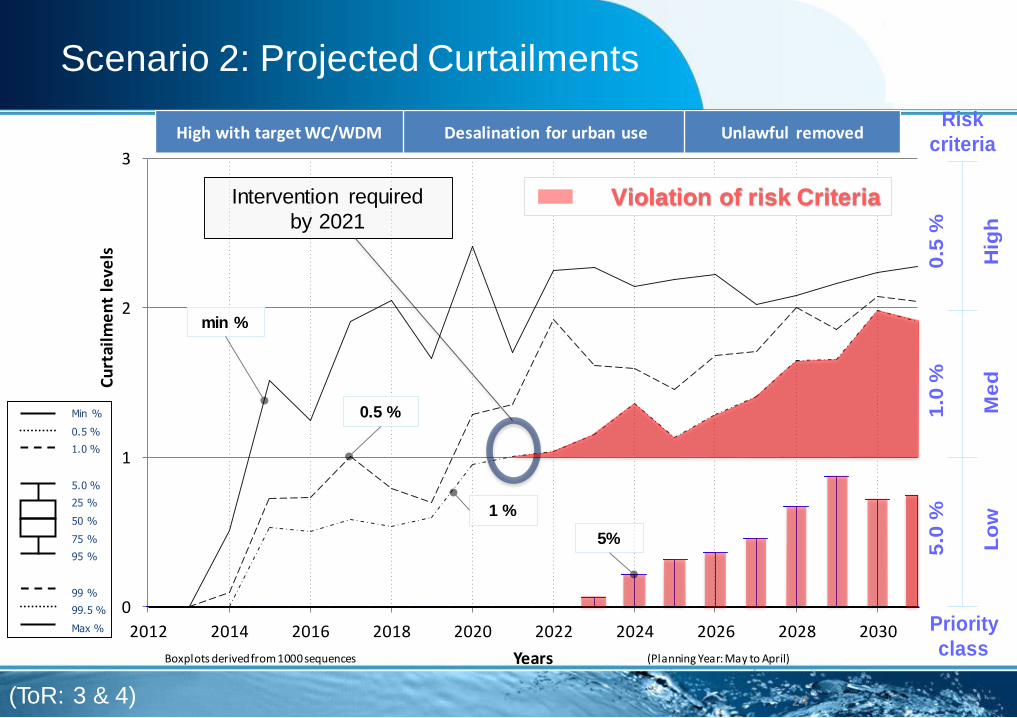
0
1
2
3
2012 2014 2016 2018 2020 2022 2024 2026 2028 2030
Cu
rtai
lme
nt
leve
ls
YearsBoxplots derived from 1000 sequences (Planning Year: May to April)
Scenario 2: Projected Curtailments
24
Min %
0.5 %
1.0 %
5.0 %
25 %
50 %
75 %
95 %
99 %
99.5 %
Max %
5.0
%
1.0
%
0
.5 %
Lo
w
Me
d
H
igh
Priority
class
Risk
criteria
Violation of risk CriteriaIntervention required
by 2021
High with target WC/WDM Desalination for urban use Unlawful removed
1 %
0.5 %
min %
5%
(ToR: 3 & 4)
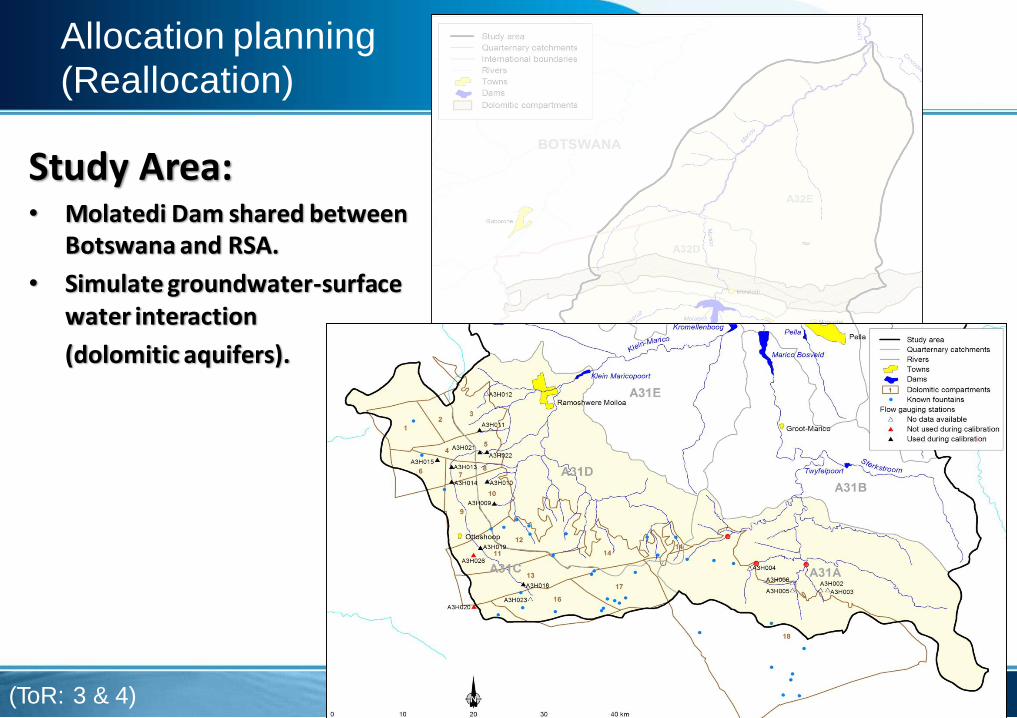
Study Area:• Molatedi Dam shared between
Botswana and RSA.
• Simulate groundwater-surface water interaction
(dolomitic aquifers).
Allocation planning
(Reallocation)
(ToR: 3 & 4)
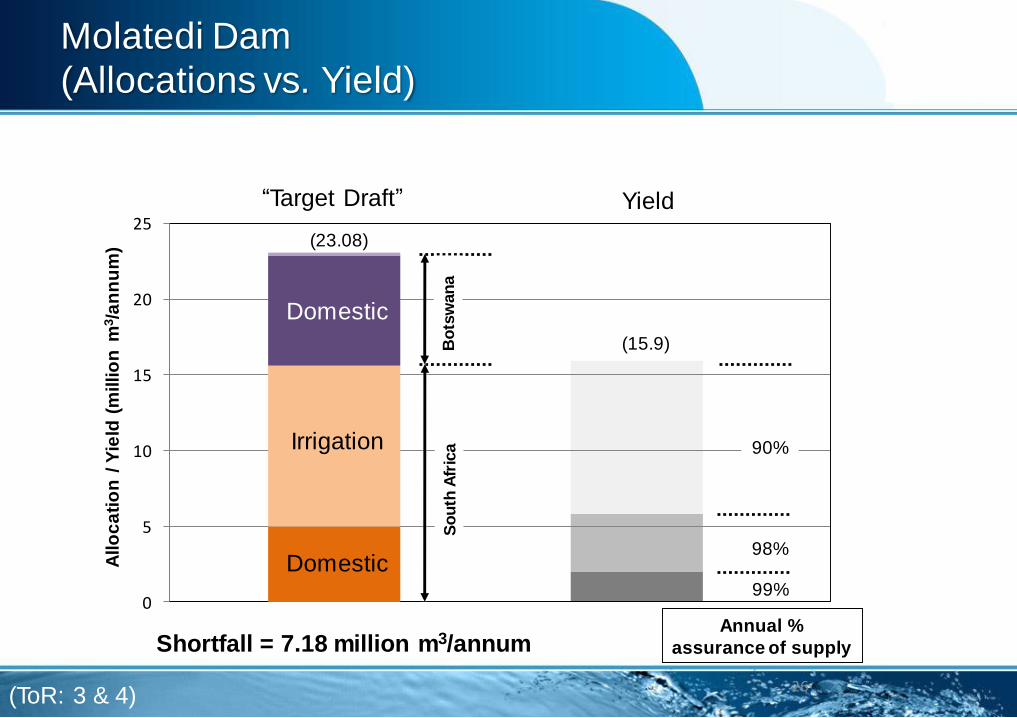
Molatedi Dam
(Allocations vs. Yield)
26
0
5
10
15
20
25
0
5
10
15
20
25
“Target Draft”
Domestic
Domestic
IrrigationS
ou
th A
fric
aB
ots
wan
a
Yield
99%
98%
90%
(15.9)
(23.08)
Shortfall = 7.18 million m3/annum
Allo
ca
tio
n /
Yie
ld (
millio
n m
3/a
nn
um
)
Annual %
assurance of supply
(ToR: 3 & 4)
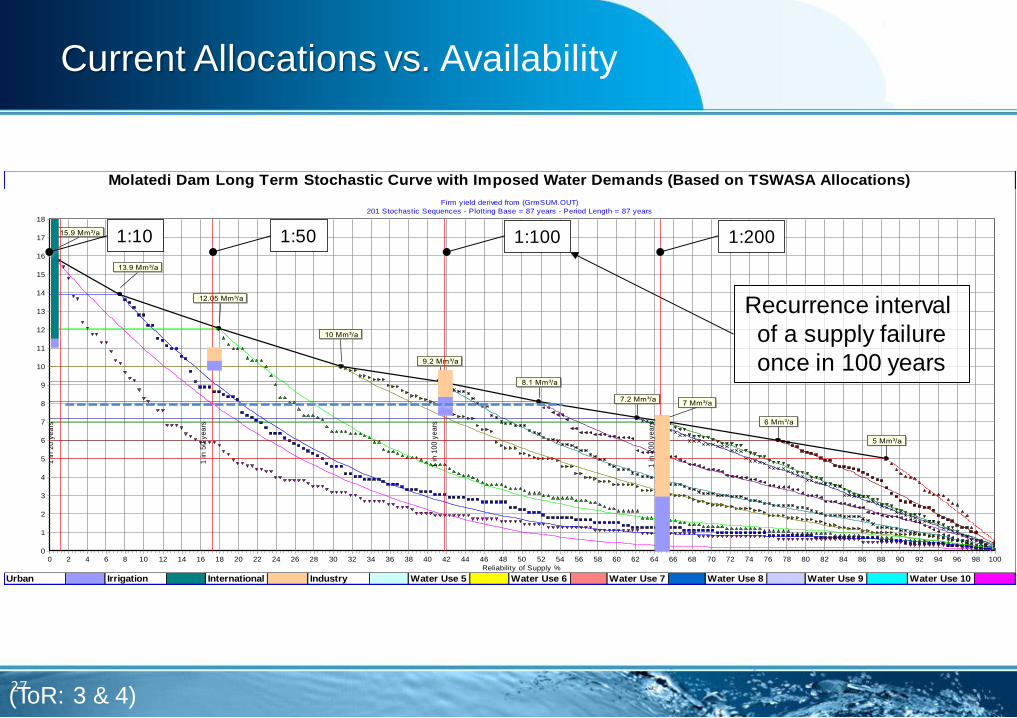
Current Allocations vs. Availability
27
Urban Irrigation International Industry Water Use 5 Water Use 6 Water Use 7 Water Use 8 Water Use 9 Water Use 10
Molatedi Dam Long Term Stochastic Curve with Imposed Water Demands (Based on TSWASA Allocations)
Firm yield derived from (GrmSUM.OUT)
201 Stochastic Sequences - Plotting Base = 87 years - Period Length = 87 years
Reliability of Supply %
10098969492908886848280787674727068666462605856545250484644424038363432302826242220181614121086420
Ta
rge
t D
raft
(mill
ion
m3
/a)
18
17
16
15
14
13
12
11
10
9
8
7
6
5
4
3
2
1
0
5 Mm³/a
6 Mm³/a
7 Mm³/a7.2 Mm³/a
8.1 Mm³/a
9.2 Mm³/a
10 Mm³/a
12.05 Mm³/a
13.9 Mm³/a
15.9 Mm³/a
1 i
n 1
0 y
ea
rs
1 i
n 2
0 y
ea
rs
1 i
n 5
0 y
ea
rs
1 i
n 1
00
ye
ars
1 i
n 2
00
ye
ars
1:2001:1001:501:10
Recurrence interval
of a supply failure
once in 100 years
(ToR: 3 & 4)
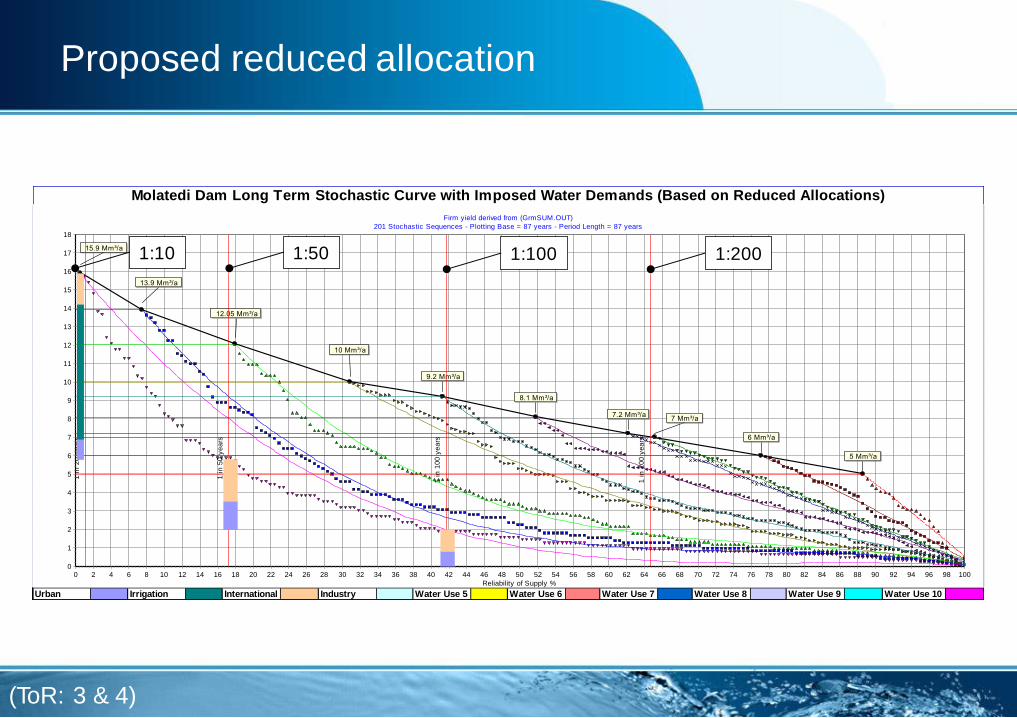
Proposed reduced allocation
Urban Irrigation International Industry Water Use 5 Water Use 6 Water Use 7 Water Use 8 Water Use 9 Water Use 10
Molatedi Dam Long Term Stochastic Curve with Imposed Water Demands (Based on Reduced Allocations)
Firm yield derived from (GrmSUM.OUT)
201 Stochastic Sequences - Plotting Base = 87 years - Period Length = 87 years
Reliability of Supply %
10098969492908886848280787674727068666462605856545250484644424038363432302826242220181614121086420
Ta
rge
t D
raft
(millio
n m
3/a
)
18
17
16
15
14
13
12
11
10
9
8
7
6
5
4
3
2
1
0
5 Mm³/a
6 Mm³/a
7 Mm³/a7.2 Mm³/a
8.1 Mm³/a
9.2 Mm³/a
10 Mm³/a
12.05 Mm³/a
13.9 Mm³/a
15.9 Mm³/a
1 i
n 1
0 y
ea
rs
1 i
n 2
0 y
ea
rs
1 i
n 5
0 y
ea
rs
1 i
n 1
00
ye
ars
1 i
n 2
00
ye
ars
1:2001:1001:501:10
(ToR: 3 & 4)
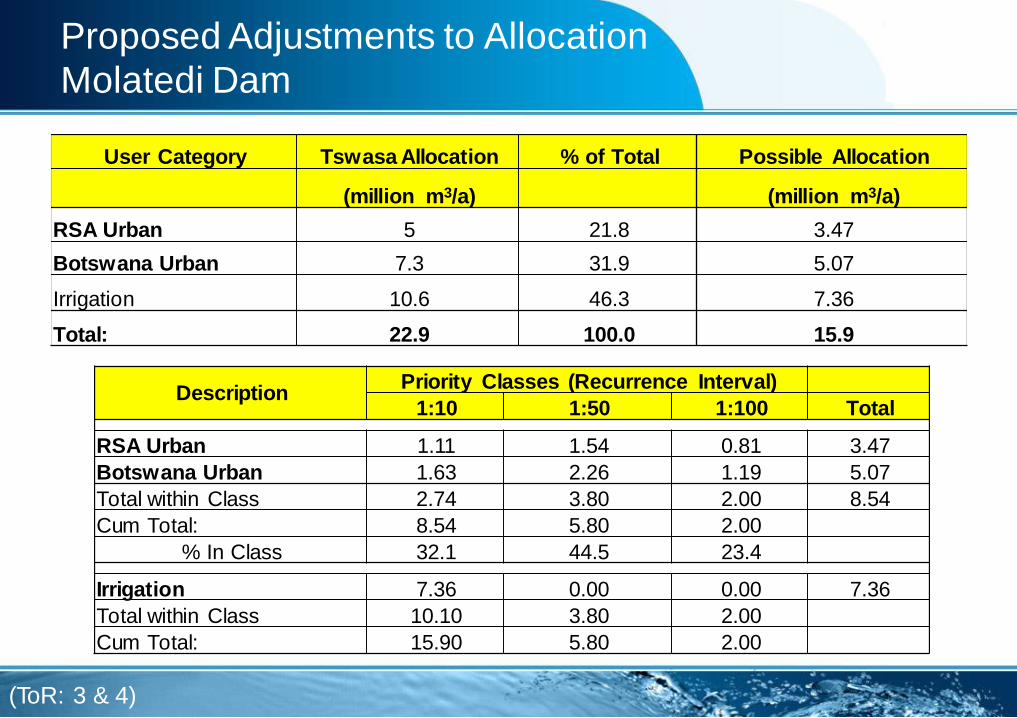
User Category Tswasa Allocation % of Total Possible Allocation
(million m3/a) (million m3/a)
RSA Urban 5 21.8 3.47
Botswana Urban 7.3 31.9 5.07
Irrigation 10.6 46.3 7.36
Total: 22.9 100.0 15.9
Proposed Adjustments to Allocation
Molatedi Dam
DescriptionPriority Classes (Recurrence Interval)
1:10 1:50 1:100 Total
RSA Urban 1.11 1.54 0.81 3.47
Botswana Urban 1.63 2.26 1.19 5.07
Total within Class 2.74 3.80 2.00 8.54
Cum Total: 8.54 5.80 2.00
% In Class 32.1 44.5 23.4
Irrigation 7.36 0.00 0.00 7.36
Total within Class 10.10 3.80 2.00
Cum Total: 15.90 5.80 2.00
(ToR: 3 & 4)
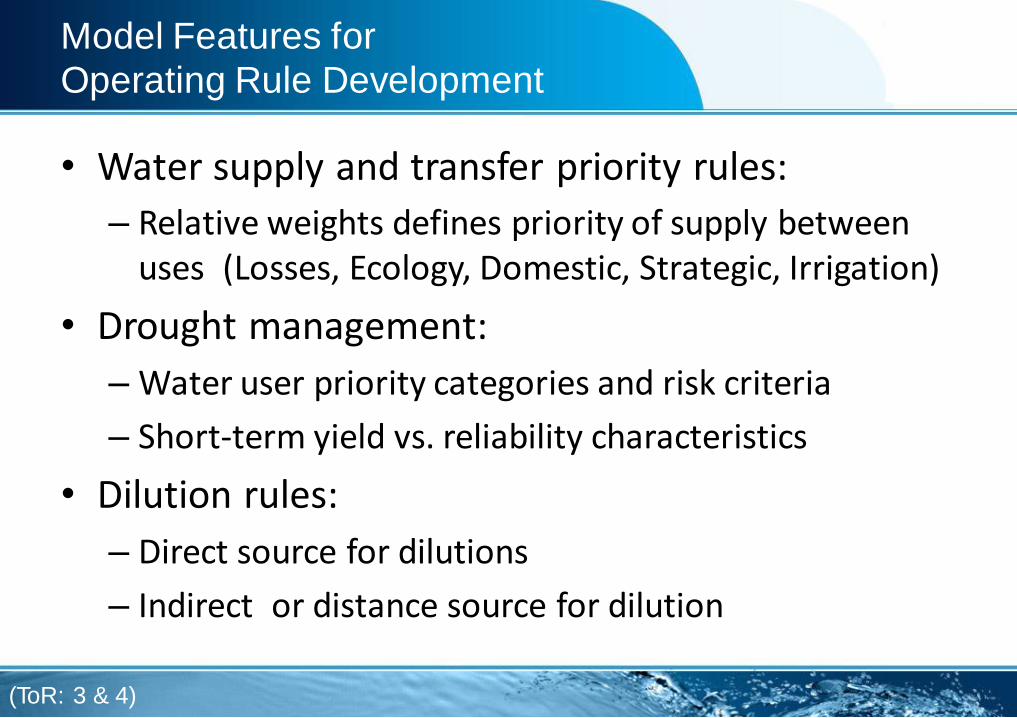
• Water supply and transfer priority rules:
– Relative weights defines priority of supply between uses (Losses, Ecology, Domestic, Strategic, Irrigation)
• Drought management:
– Water user priority categories and risk criteria
– Short-term yield vs. reliability characteristics
• Dilution rules:
– Direct source for dilutions
– Indirect or distance source for dilution
Model Features for
Operating Rule Development
(ToR: 3 & 4)
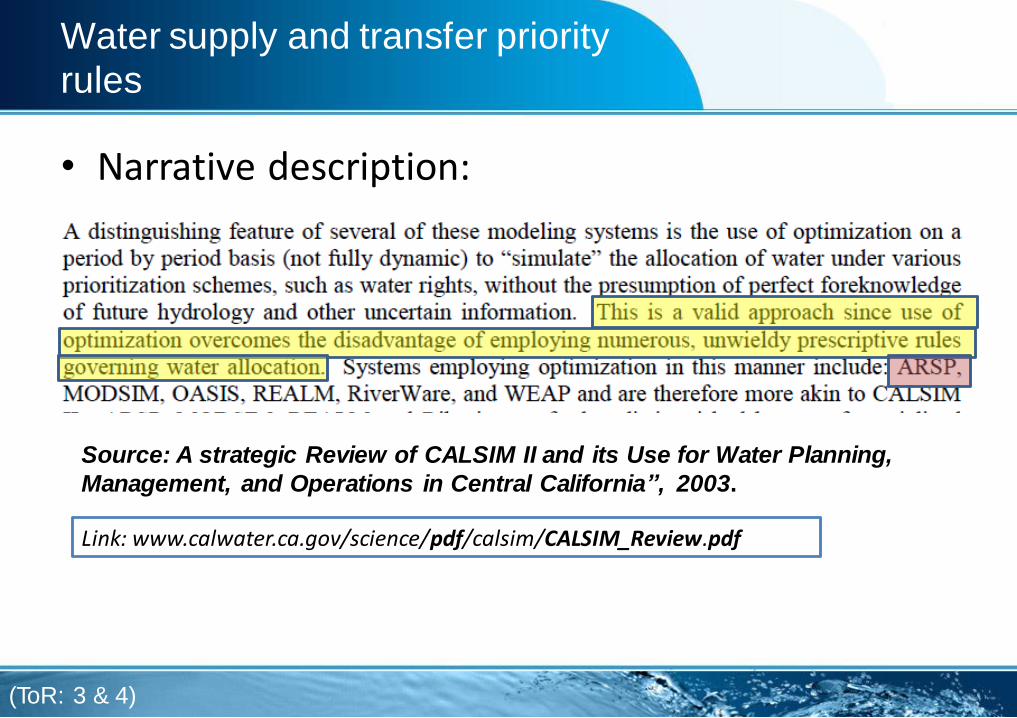
• Narrative description:
Water supply and transfer priority
rules
Source: A strategic Review of CALSIM II and its Use for Water Planning,
Management, and Operations in Central California”, 2003.
Link: www.calwater.ca.gov/science/pdf/calsim/CALSIM_Review.pdf
(ToR: 3 & 4)
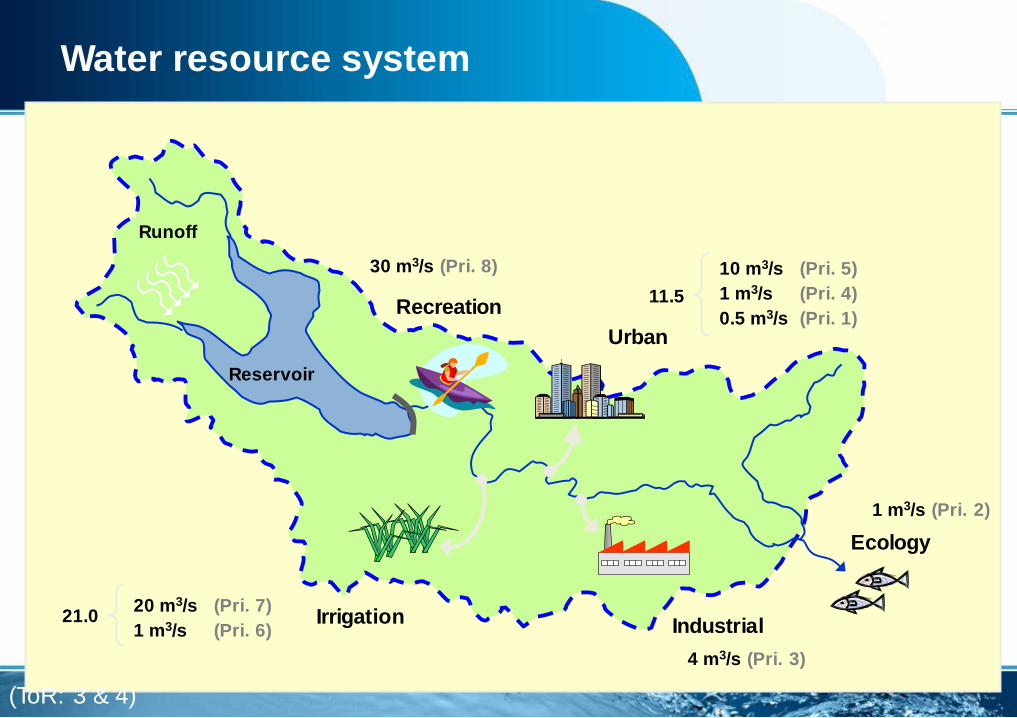
Reservoir
Irrigation
Recreation
Urban
Industrial
Ecology
Runoff
11.5
30 m3/s (Pri. 8) (Pri. 5)
(Pri. 4)
(Pri. 1)
10 m3/s
1 m3/s
0.5 m3/s
21.0(Pri. 7)
(Pri. 6)
20 m3/s
1 m3/s
4 m3/s (Pri. 3)
1 m3/s (Pri. 2)
Water resource system
(ToR: 3 & 4)
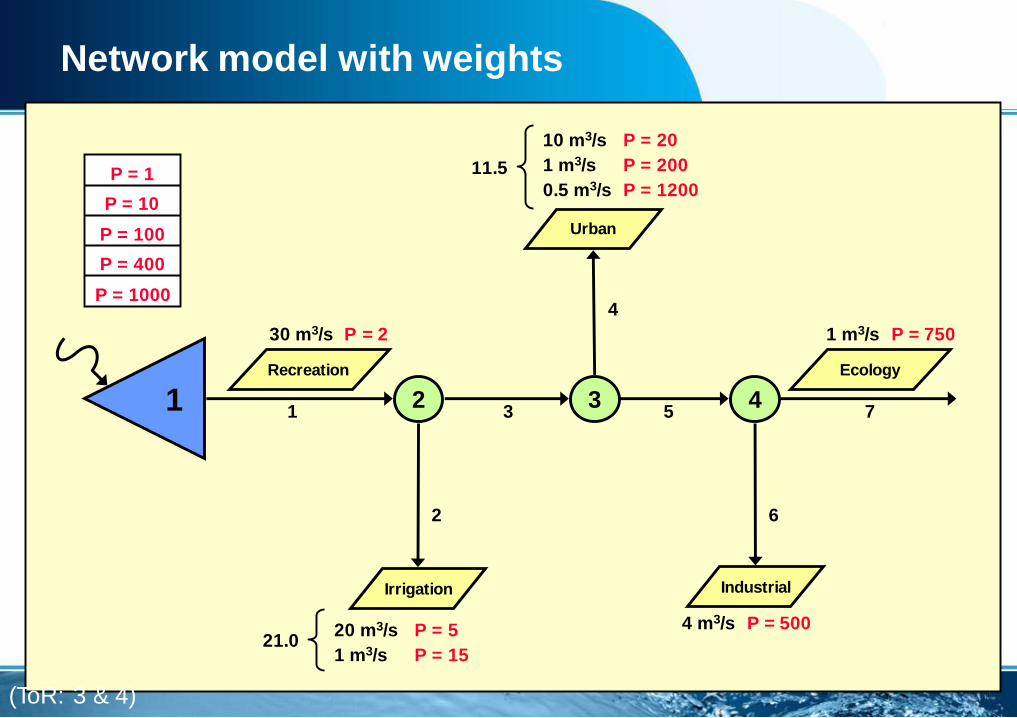
Network model with weights
2
Urban
IndustrialIrrigation
31 4
EcologyRecreation
P = 1
P = 10
P = 100
P = 400
P = 1000
11.5
30 m3/s P = 2
P = 20
P = 200
P = 1200
10 m3/s
1 m3/s
0.5 m3/s
21.0P = 5
P = 15
20 m3/s
1 m3/s
4 m3/s P = 500
1 m3/s P = 750
3 5
4
2
7
6
1
(ToR: 3 & 4)
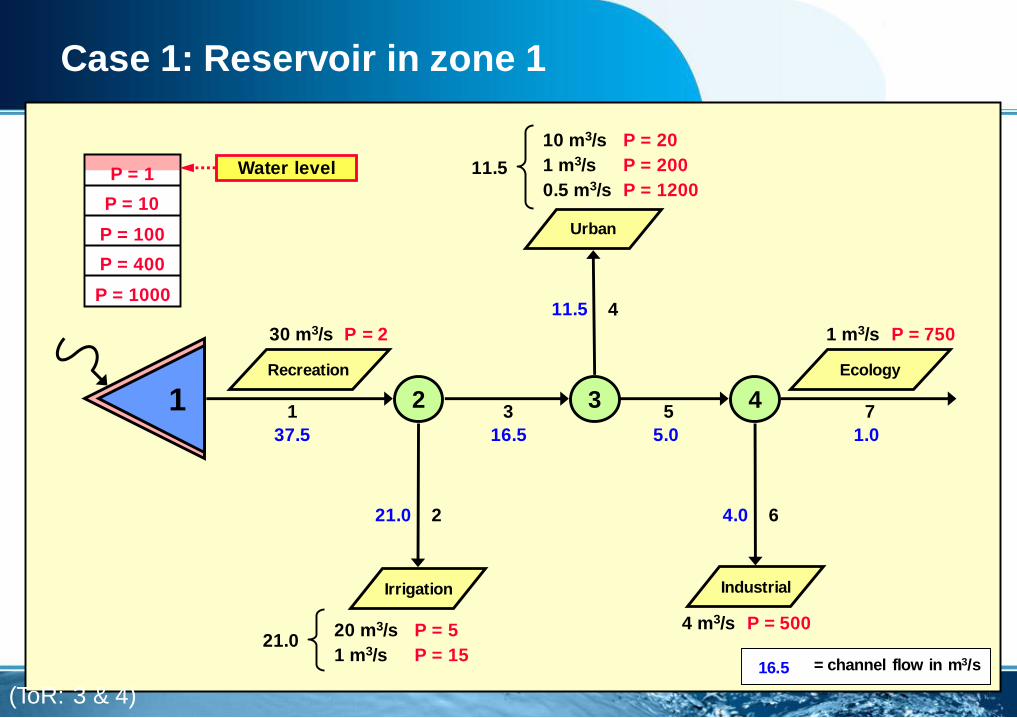
Case 1: Reservoir in zone 1
2
Urban
IndustrialIrrigation
33 5
4
4
2
EcologyRecreation
7
6
P = 1
P = 10
P = 100
P = 400
P = 1000
11.5
30 m3/s P = 2
P = 20
P = 200
P = 1200
10 m3/s
1 m3/s
0.5 m3/s
21.0P = 5
P = 15
20 m3/s
1 m3/s
4 m3/s P = 500
1 m3/s P = 750
Water level
1
= channel flow in m3/s
1.037.5 16.5 5.0
11.5
21.0 4.0
16.5
1
(ToR: 3 & 4)
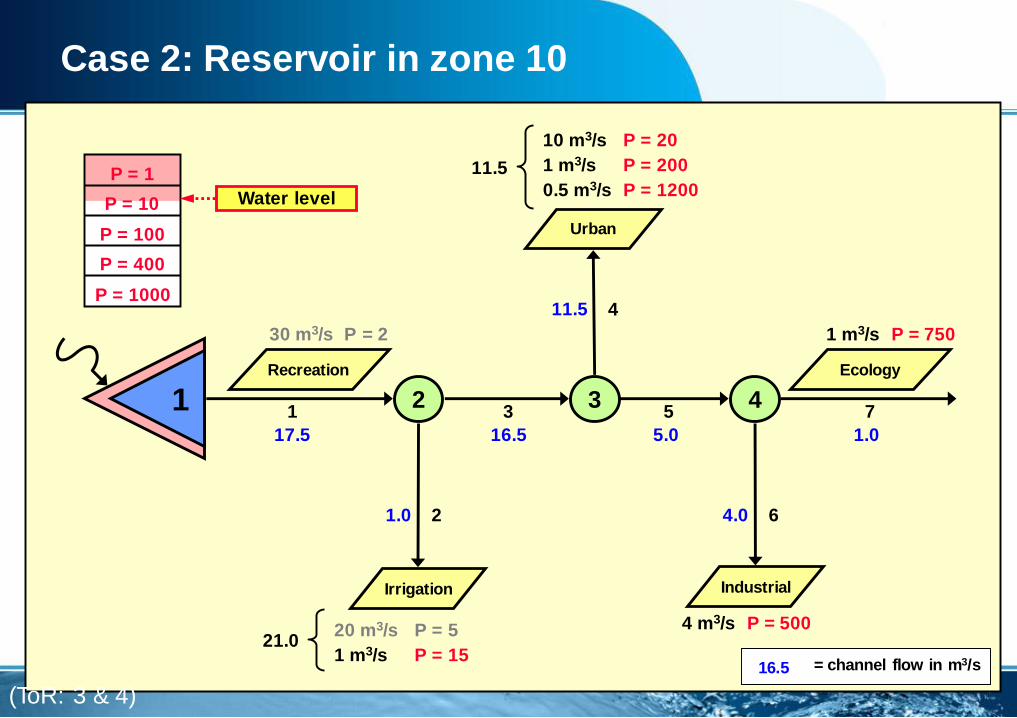
Case 2: Reservoir in zone 10
2
Urban
IndustrialIrrigation
33 5
4
4
2
EcologyRecreation
7
6
P = 1
P = 10
P = 100
P = 400
P = 1000
11.5
30 m3/s P = 2
P = 20
P = 200
P = 1200
10 m3/s
1 m3/s
0.5 m3/s
21.0P = 5
P = 15
20 m3/s
1 m3/s
4 m3/s P = 500
1 m3/s P = 750
Water level
= channel flow in m3/s
1.017.5 16.5 5.0
11.5
1.0 4.0
16.5
11
(ToR: 3 & 4)
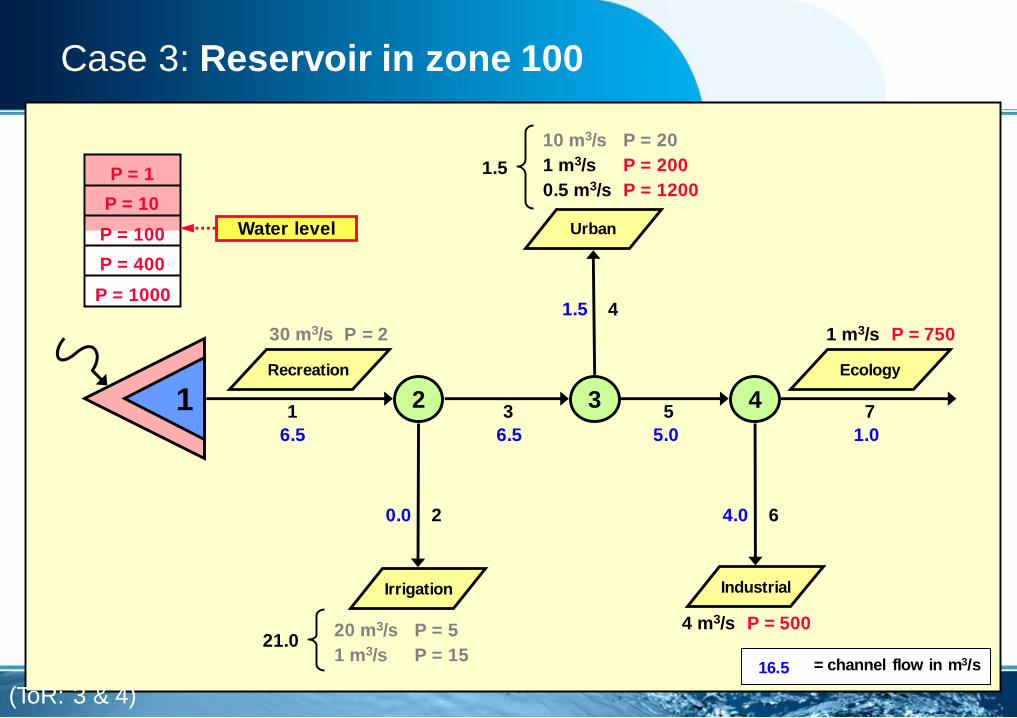
Case 3: Reservoir in zone 100
2
Urban
IndustrialIrrigation
33 5
4
4
2
EcologyRecreation
7
6
P = 1
P = 10
P = 100
P = 400
P = 1000
1.5
30 m3/s P = 2
P = 20
P = 200
P = 1200
10 m3/s
1 m3/s
0.5 m3/s
21.0P = 5
P = 15
20 m3/s
1 m3/s
4 m3/s P = 500
1 m3/s P = 750
Water level
= channel flow in m3/s
1.06.5 6.5 5.0
1.5
0.0 4.0
16.5
11
(ToR: 3 & 4)
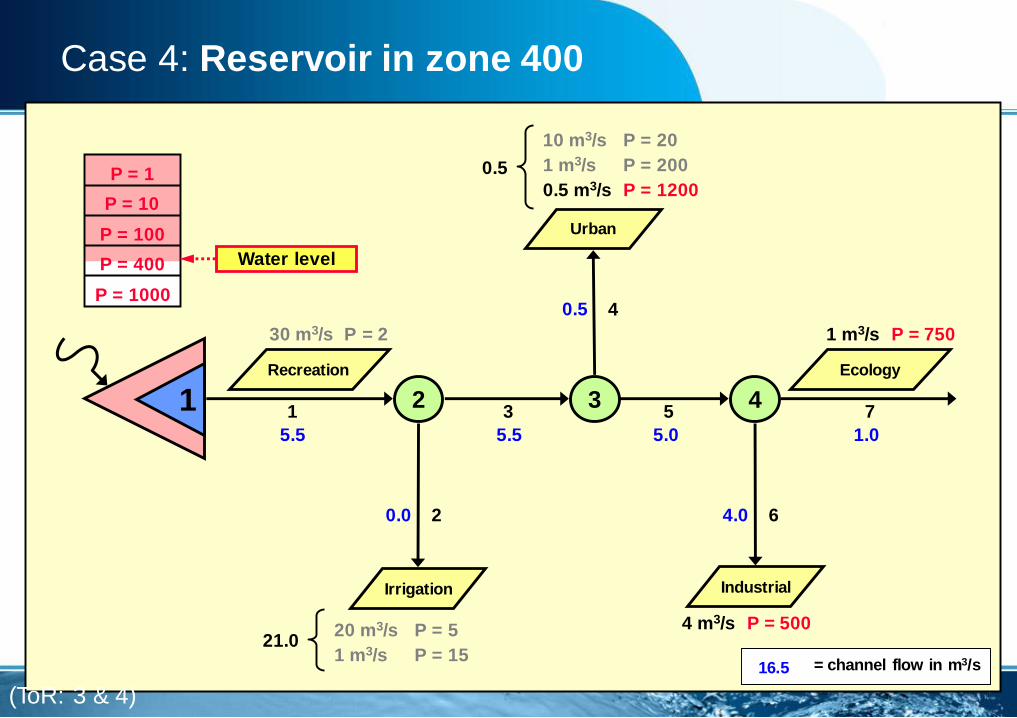
Case 4: Reservoir in zone 400
2
Urban
IndustrialIrrigation
33 5
4
4
2
EcologyRecreation
7
6
P = 1
P = 10
P = 100
P = 400
P = 1000
0.5
30 m3/s P = 2
P = 20
P = 200
P = 1200
10 m3/s
1 m3/s
0.5 m3/s
21.0P = 5
P = 15
20 m3/s
1 m3/s
4 m3/s P = 500
1 m3/s P = 750
Water level
= channel flow in m3/s
1.05.5 5.5 5.0
0.5
0.0 4.0
16.5
11
(ToR: 3 & 4)
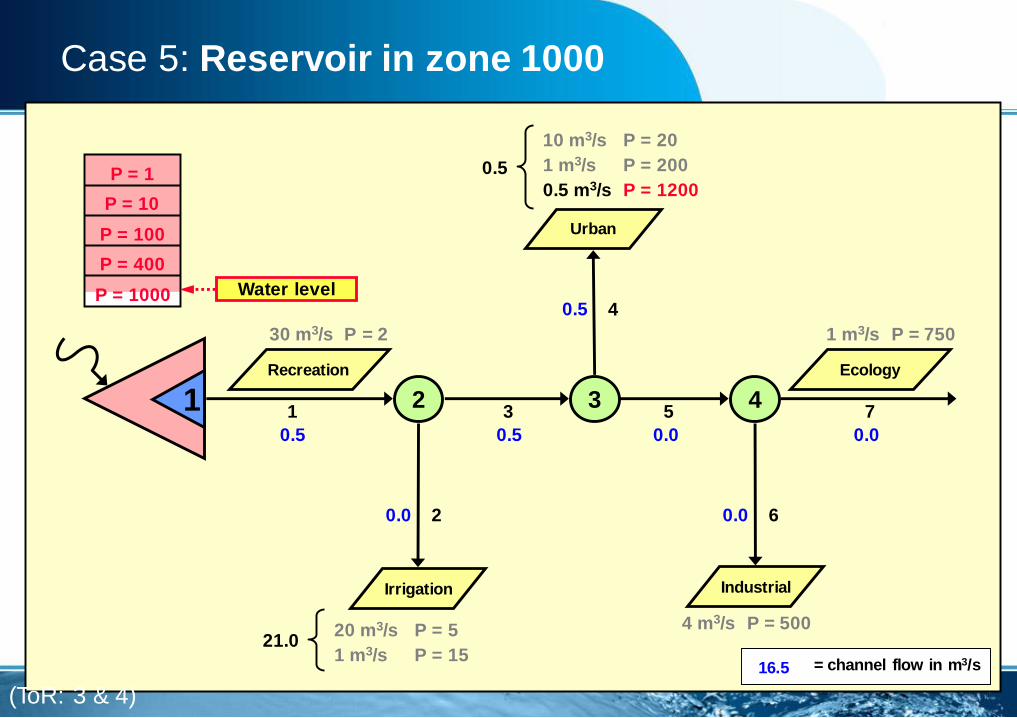
Case 5: Reservoir in zone 1000
2
Urban
IndustrialIrrigation
33 5
4
4
2
EcologyRecreation
7
6
P = 1
P = 10
P = 100
P = 400
P = 1000
0.5
30 m3/s P = 2
P = 20
P = 200
P = 1200
10 m3/s
1 m3/s
0.5 m3/s
21.0P = 5
P = 15
20 m3/s
1 m3/s
4 m3/s P = 500
1 m3/s P = 750
Water level
= channel flow in m3/s
0.00.5 0.5 0.0
0.5
0.0 0.0
16.5
11
(ToR: 3 & 4)
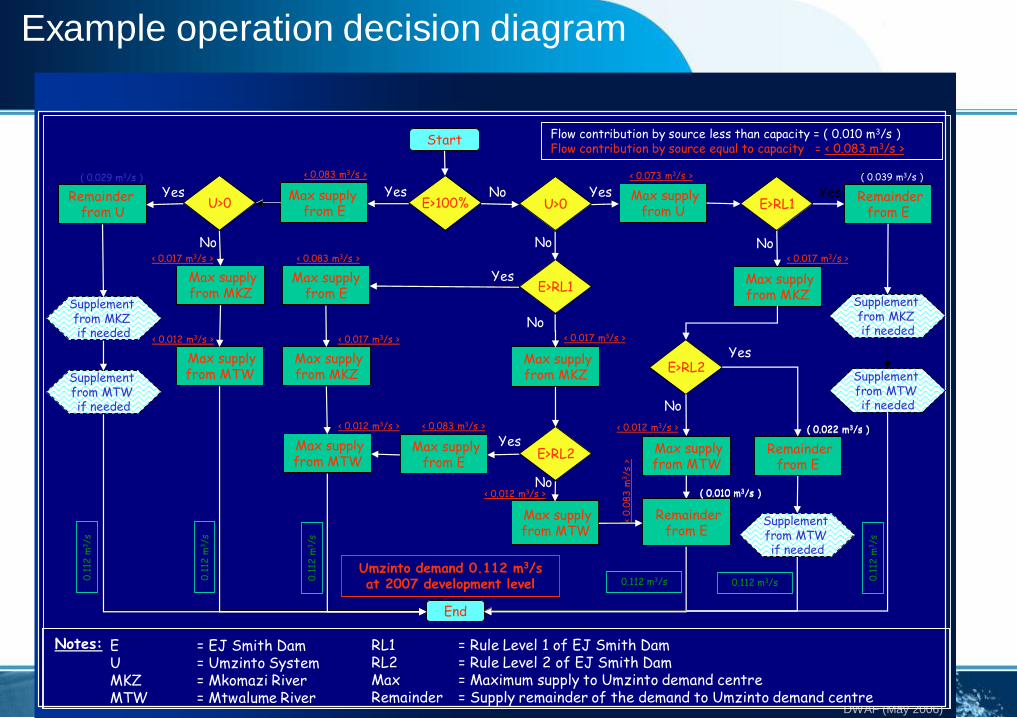
Example operation decision diagram
DWAF (May 2006)
E>100%
Start
Max supply from E
Yes NoU>0
Yes
No
Max supplyfrom U
U>0YesRemainder
from U
No
E>RL1Remainder
from E
Yes
No
E>RL1Max supply
from EYes
No
Max supplyfrom MKZ
E>RL2Max supplyfrom MTW
Max supplyfrom MKZ
Max supplyfrom MTW
Max supplyfrom MKZ
E>RL2
Max supplyfrom MKZ
Remainderfrom E
End
Yes
No
Max supplyfrom MTW
Yes
Max supplyfrom MTW
Max supplyfrom E
No
E = EJ Smith DamU = Umzinto SystemMKZ = Mkomazi RiverMTW = Mtwalume River
RL1 = Rule Level 1 of EJ Smith DamRL2 = Rule Level 2 of EJ Smith DamMax = Maximum supply to Umzinto demand centreRemainder = Supply remainder of the demand to Umzinto demand centre
Umzinto demand 0.112 m3/s at 2007 development level
0.1
12 m
3/s
0.1
12 m
3/s
0.1
12 m
3/s
0.1
12 m
3/s
< 0.083 m3/s >( 0.029 m3/s )
< 0.083 m3/s >
< 0.083 m3/s >< 0.017 m3/s >
< 0.017 m3/s > < 0.017 m3/s >
< 0.017 m3/s >
< 0.012 m3/s >
< 0.012 m3/s > < 0.012 m3/s >
< 0.012 m3/s >
< 0.073 m3/s > ( 0.039 m3/s )
( 0.010 m3/s )
( 0.022 m3/s )
< 0
.08
3 m
3/s
>
Flow contribution by source less than capacity = ( 0.010 m3/s )Flow contribution by source equal to capacity = < 0.083 m3/s >
0.112 m3/s
Remainderfrom E
Supplement from MKZ if needed
Supplement from MTW if needed
Supplement from MTW if needed
Supplement from MKZ if needed
Supplement from MTW if needed
0.112 m3/s
Notes:
( 0.010 m3/s )
( 0.022 m3/s )
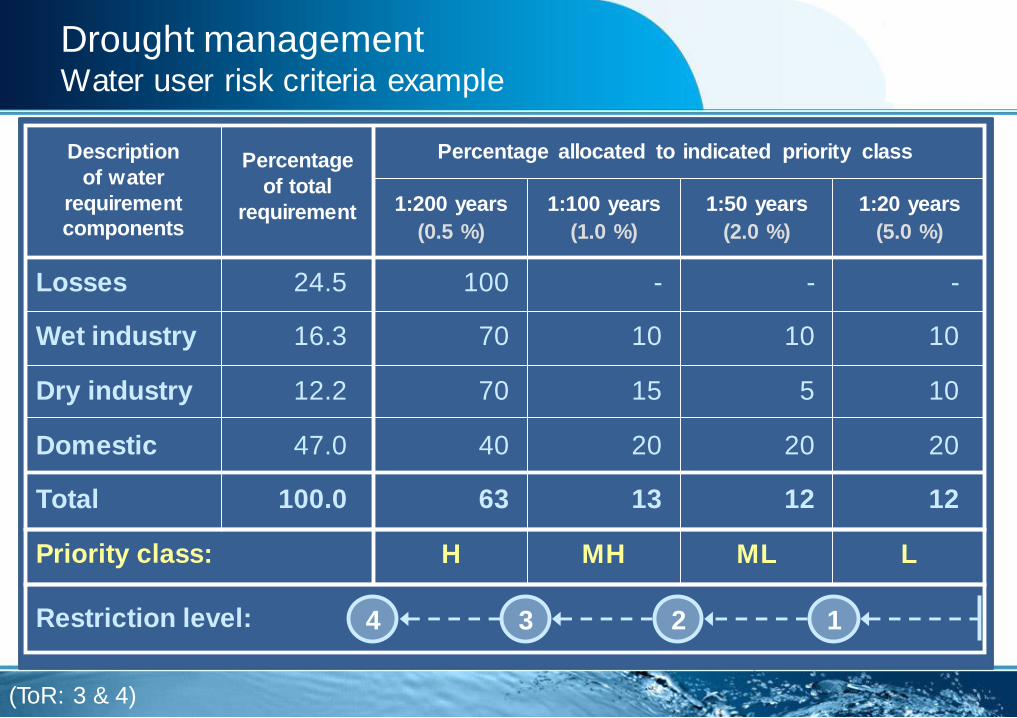
Drought management Water user risk criteria example
Description
of water
requirement
components
Losses
Wet industry
Dry industry
Domestic
Total
Priority class:
Restriction level:
24.5
16.3
12.2
47.0
100.0
100
70
70
40
63
Percentage allocated to indicated priority classPercentage
of total
requirement 1:200 years
(0.5 %)
1:100 years
(1.0 %)
1:50 years
(2.0 %)
1:20 years
(5.0 %)
-
10
15
20
13
-
10
5
20
12
-
10
10
20
12
H MH ML L
234 1
(ToR: 3 & 4)
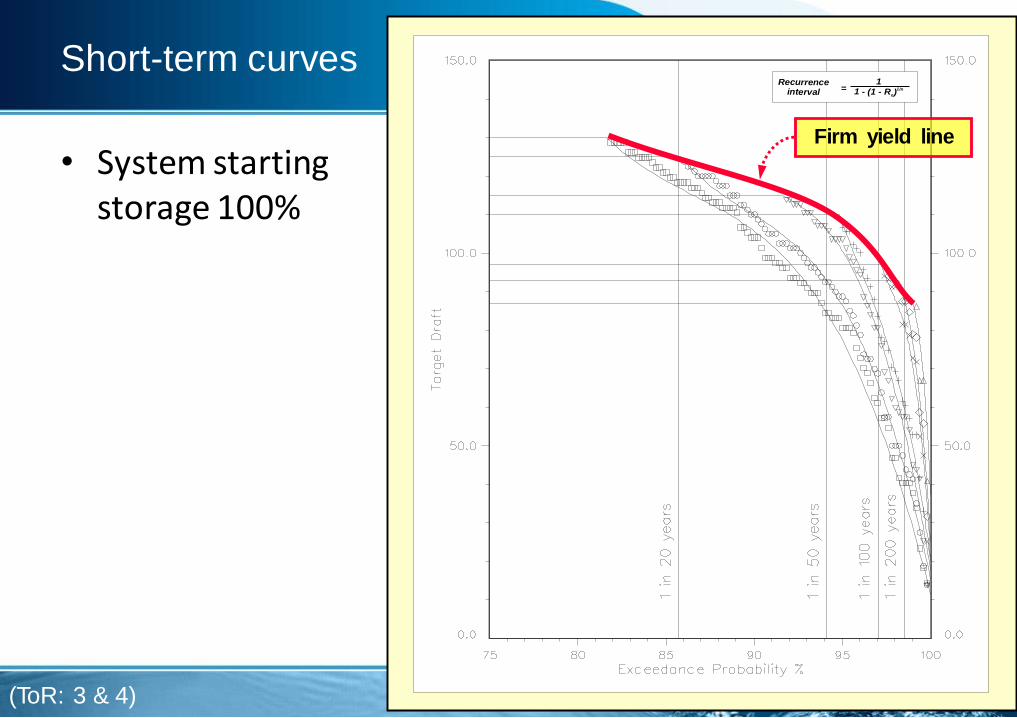
• System starting storage 100%
Short-term curvesRecurrence
interval = 1
1 - (1 - R )n
1/n
Firm yield line
(ToR: 3 & 4)
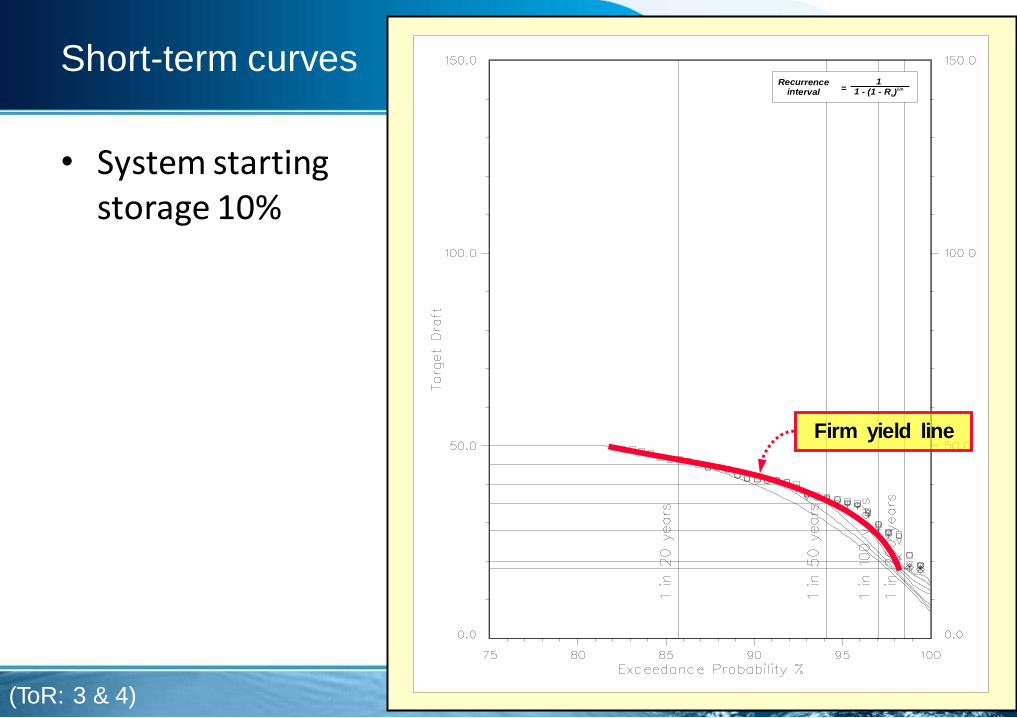
• System starting storage 10%
Short-term curvesRecurrence
interval = 1
1 - (1 - R )n
1/n
Firm yield line
(ToR: 3 & 4)
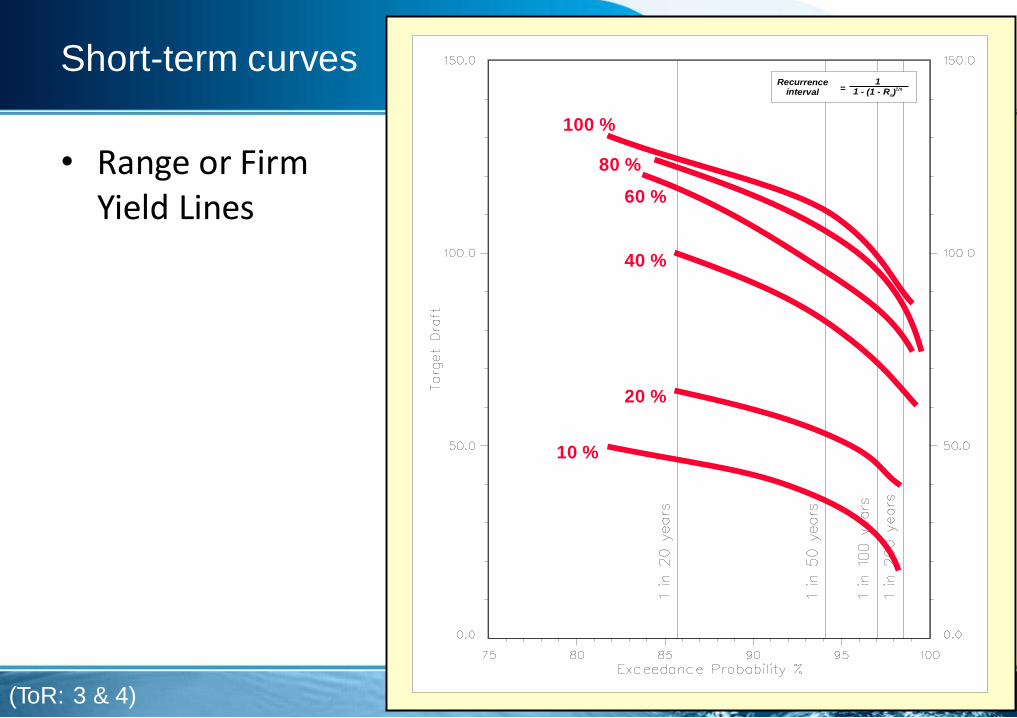
• Range or Firm Yield Lines
Short-term curvesRecurrence
interval = 1
1 - (1 - R )n
1/n
100 %
80 %
60 %
40 %
20 %
10 %
(ToR: 3 & 4)
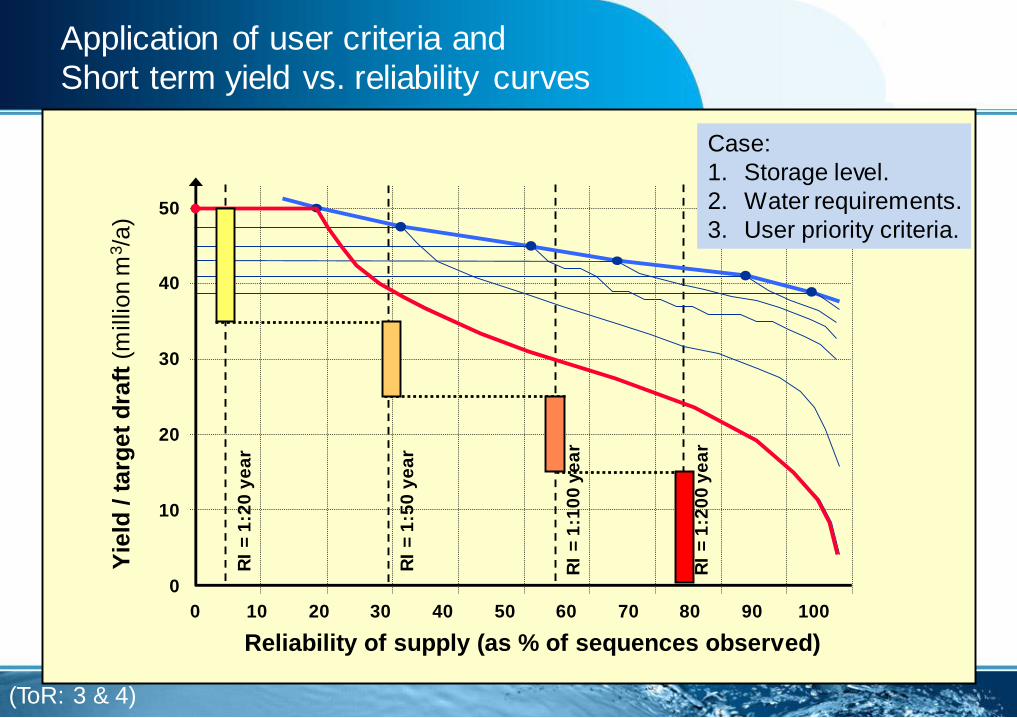
Application of user criteria andShort term yield vs. reliability curves
RI
= 1
:20
0 y
ea
r
RI
= 1
:10
0 y
ea
r
RI
= 1
:20
ye
ar
RI
= 1
:50
ye
ar
0 10 20 30 40 50 60 70 80 90 100
Reliability of supply (as % of sequences observed)
50
40
30
20
10
0
Yie
ld /
ta
rge
t d
raft
(m
illio
n m
3/a
)
(ToR: 3 & 4)
Case:
1. Storage level.
2. Water requirements.
3. User priority criteria.
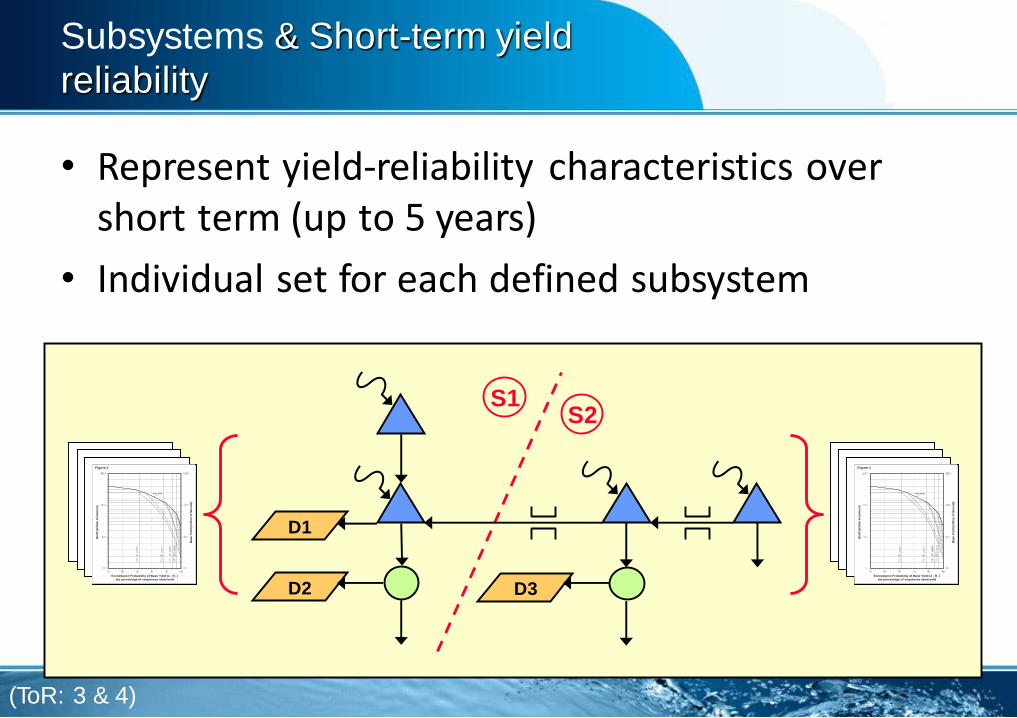
Subsystems & Short-term yield
reliability
D2
D1
D3
S1S2
Figure 1
Ba
se
Yie
ld (
mil
lio
n m
/an
nu
m)
3
Dra
ft (
mil
lio
n m
/an
nu
m)
3
Exceedance Probability of Base Yield (1 - R )
(as percentage of sequences observed)n
Firm yield
Figure 1
Ba
se
Yie
ld (
mil
lio
n m
/an
nu
m)
3
Dra
ft (
mil
lio
n m
/an
nu
m)
3
Exceedance Probability of Base Yield (1 - R )
(as percentage of sequences observed)n
Firm yield
• Represent yield-reliability characteristics over short term (up to 5 years)
• Individual set for each defined subsystem
(ToR: 3 & 4)
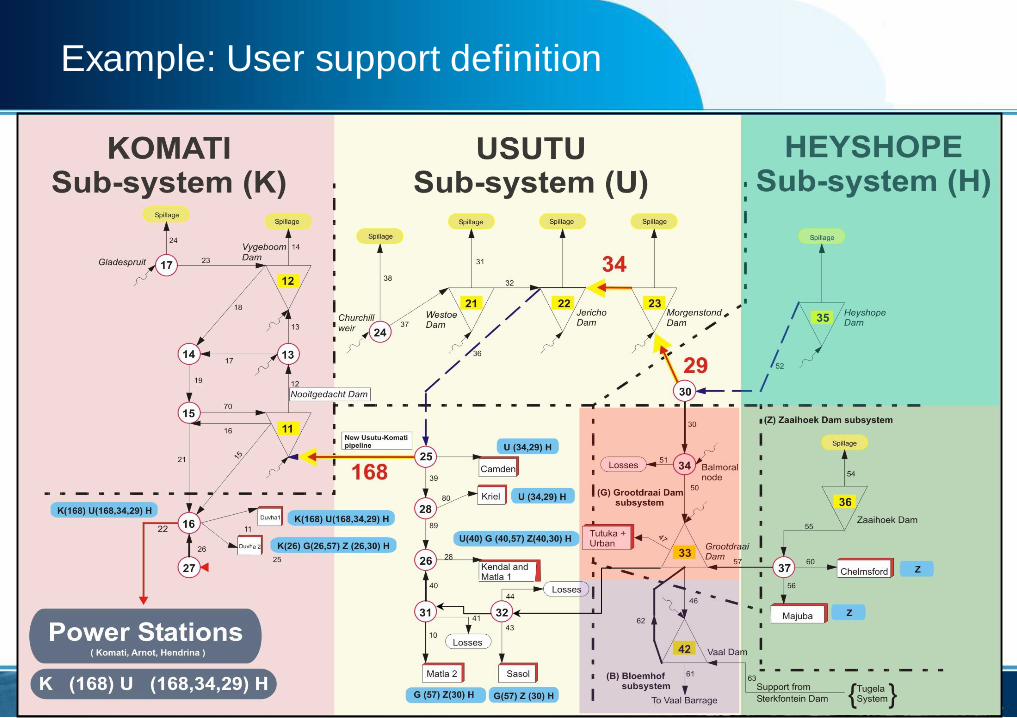
Example: User support definition
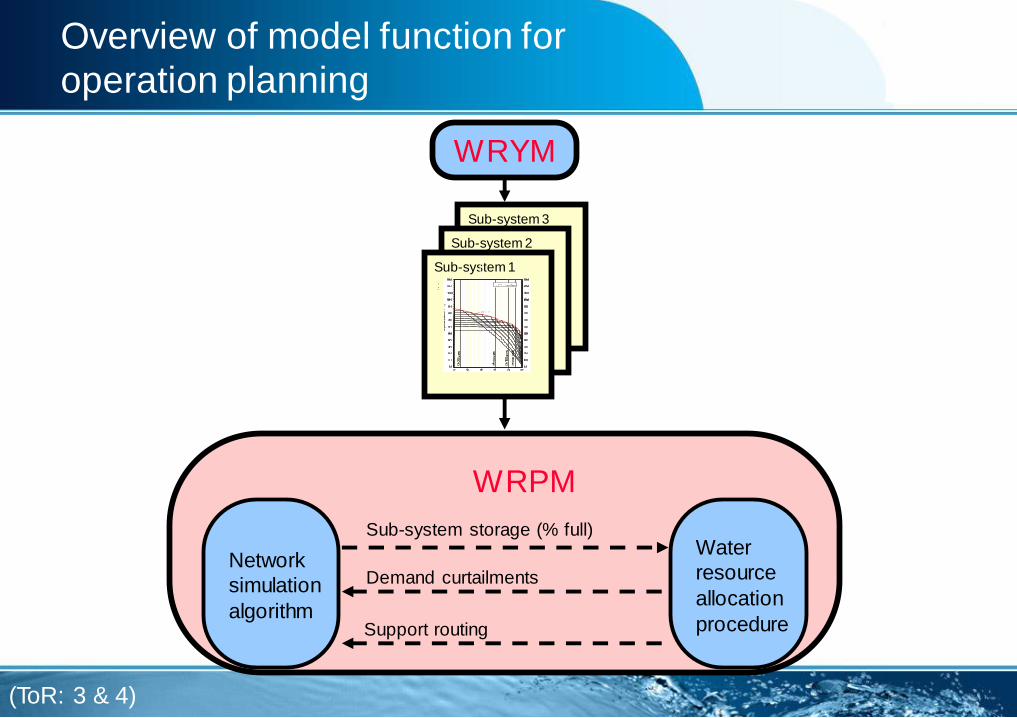
Overview of model function for
operation planning
Sub-system 3
Sub-system 2
Sub-system 1
au
3
r e ci e = 1
1 R
m
y l e
Stochastic yield analysis
Ta
rg
et
Dra
ft(m
ill
ion
mT
arg
et
Dra
ft(m
ill
ion
ma
um
3
r e c
i e=
1
1 R
m y l e
Short-term yield
characteristic curves
for each sub-system
Sub-system storage (% full)
Demand curtailments
Support routing
WRYM
WRPM
Network
simulation
algorithm
Water
resource
allocation
procedure
(ToR: 3 & 4)
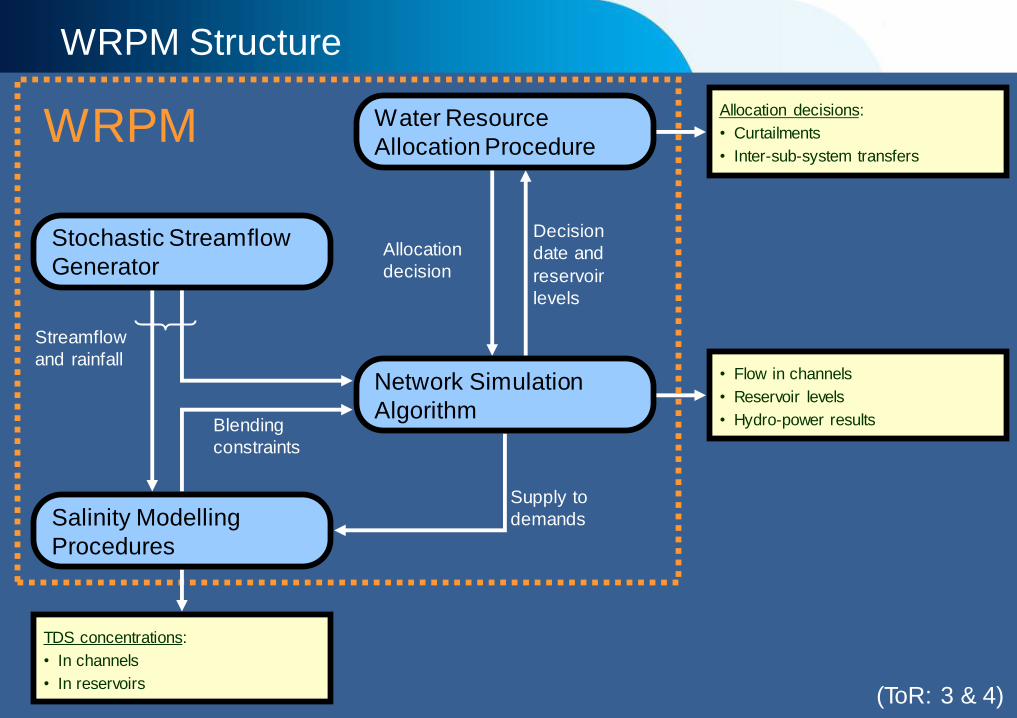
WRPM Structure
Allocation decisions:
• Curtailments
• Inter-sub-system transfers
Allocation
decision
Decision
date and
reservoir
levels
Streamflow
and rainfall• Flow in channels
• Reservoir levels
• Hydro-power resultsBlending
constraints
Supply to
demands
TDS concentrations:
• In channels
• In reservoirs
WRPM Water Resource
Allocation Procedure
Stochastic Streamflow
Generator
Network Simulation
Algorithm
Salinity Modelling
Procedures
(ToR: 3 & 4)
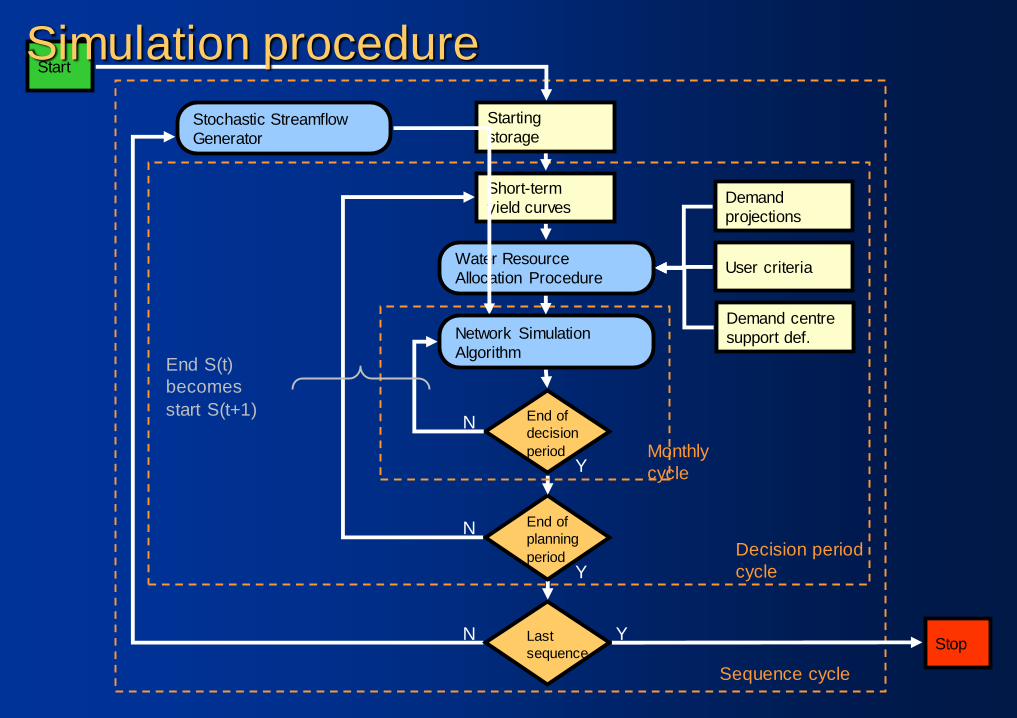
Last
sequence
N
Sequence cycle
Y
YStop
End of
planning
period
NDecision period
cycle
Y
Start
User criteria
Demand
projections
Demand centre
support def.
Short-term
yield curves
Starting
storage
Water Resource
Allocation Procedure
End of
decision
period
N
End S(t)
becomes
start S(t+1)
Monthly
cycle
Simulation procedure
Stochastic Streamflow
Generator
Network Simulation
Algorithm
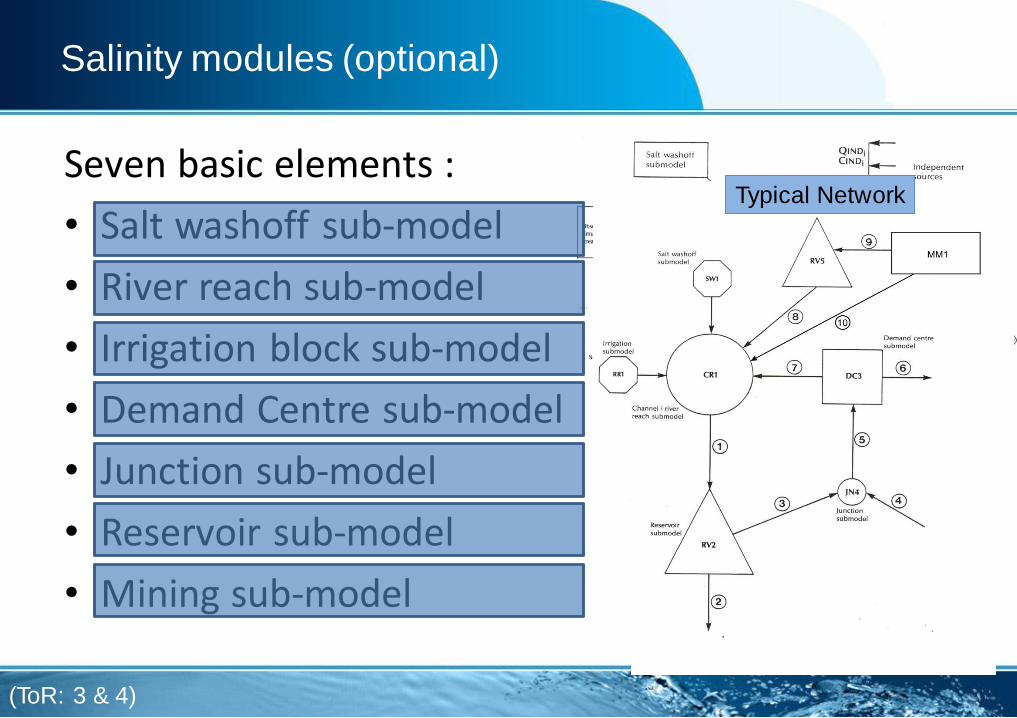
Salinity modules (optional)
Seven basic elements :
• Salt washoff sub-model
• River reach sub-model
• Irrigation block sub-model
• Demand Centre sub-model
• Junction sub-model
• Reservoir sub-model
• Mining sub-model
(ToR: 3 & 4)
Typical Network
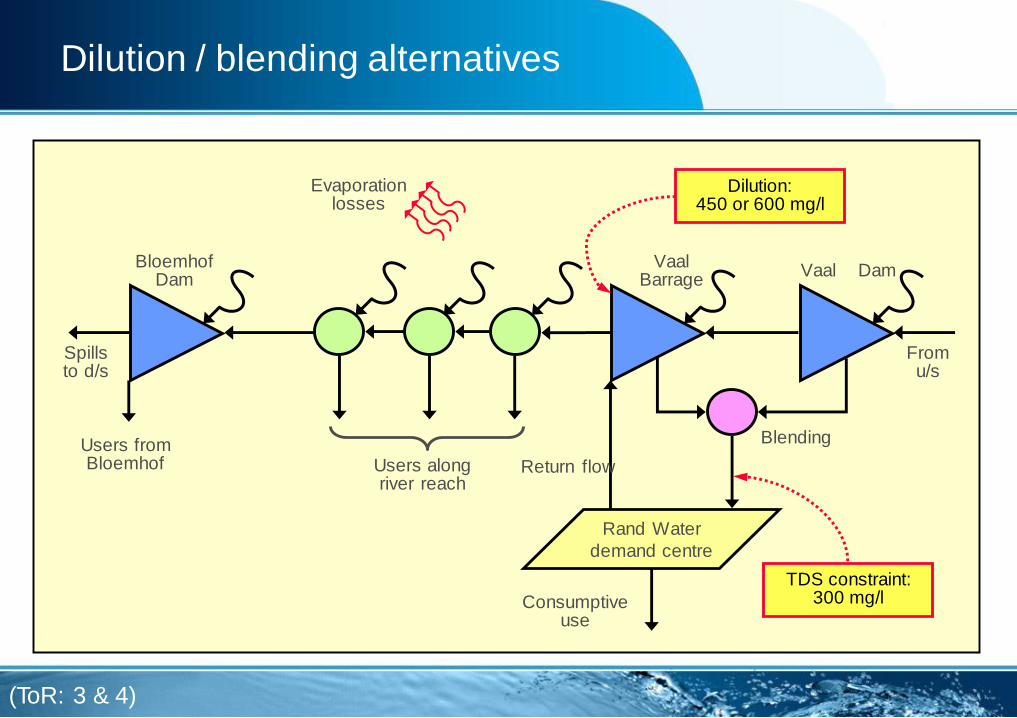
Dilution / blending alternatives
Users along river reach
Spillsto d/s
Rand Water
demand centre
Evaporation losses
Users from Bloemhof
Vaal Dam
Blending
Return flow
Vaal Barrage
Consumptive use
Bloemhof Dam
Dilution:450 or 600 mg/l
TDS constraint:300 mg/l
Fromu/s
(ToR: 3 & 4)
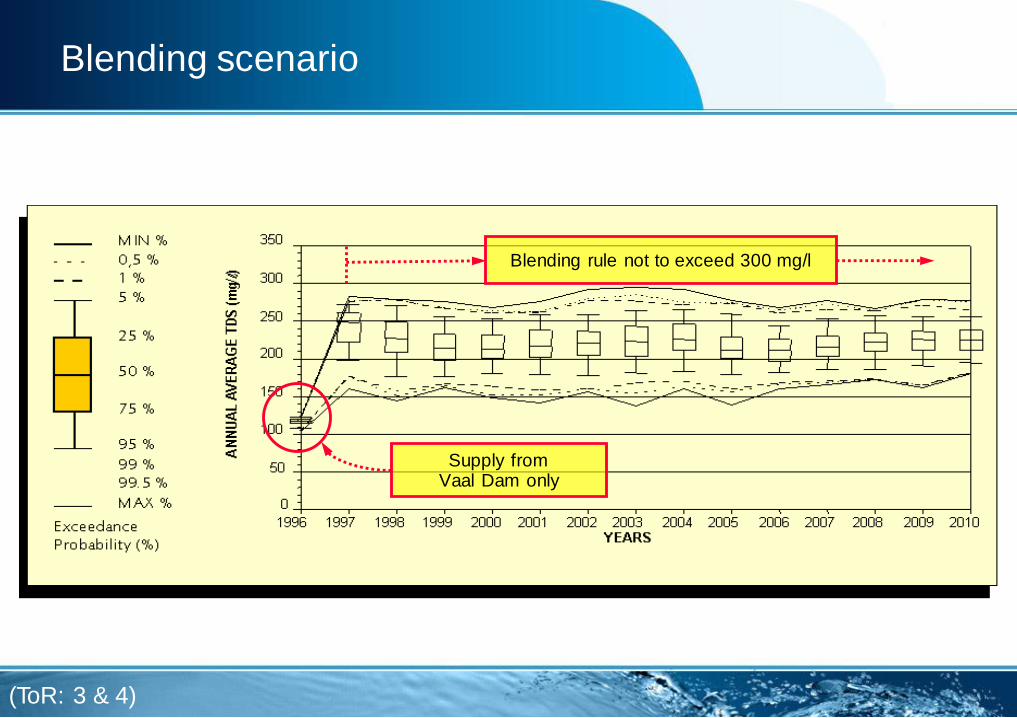
Blending scenario
Blending rule not to exceed 300 mg/l
Supply fromVaal Dam only
(ToR: 3 & 4)
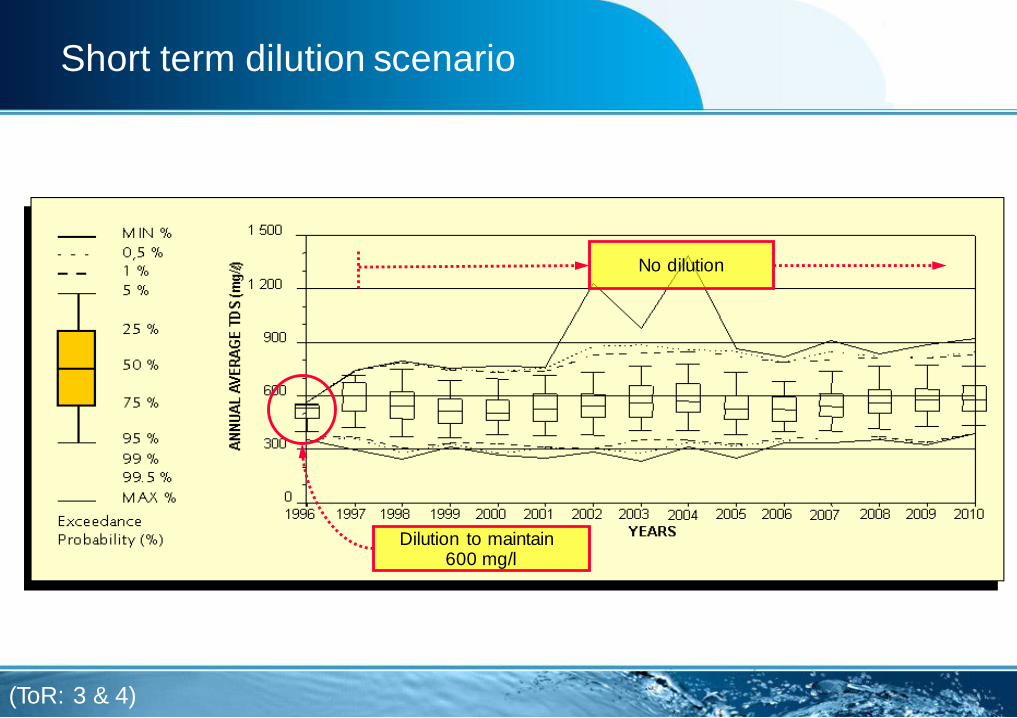
Short term dilution scenario
Dilution to maintain 600 mg/l
No dilution
(ToR: 3 & 4)
Thank You
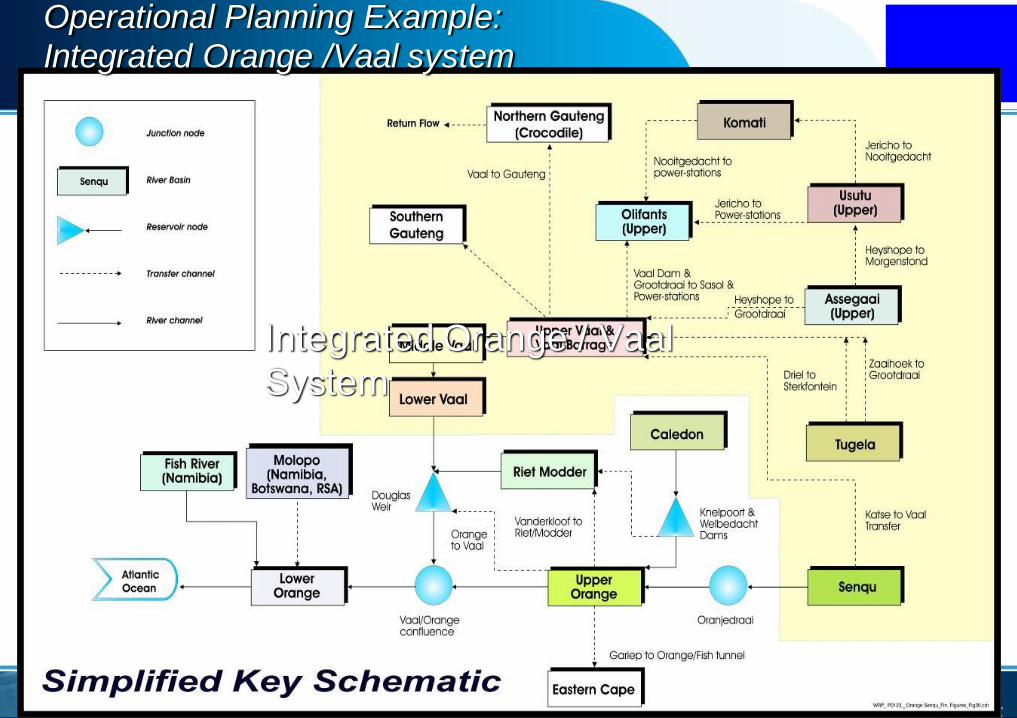
Operational Planning Example:
Integrated Orange /Vaal system
Integrated Orange / Vaal
System
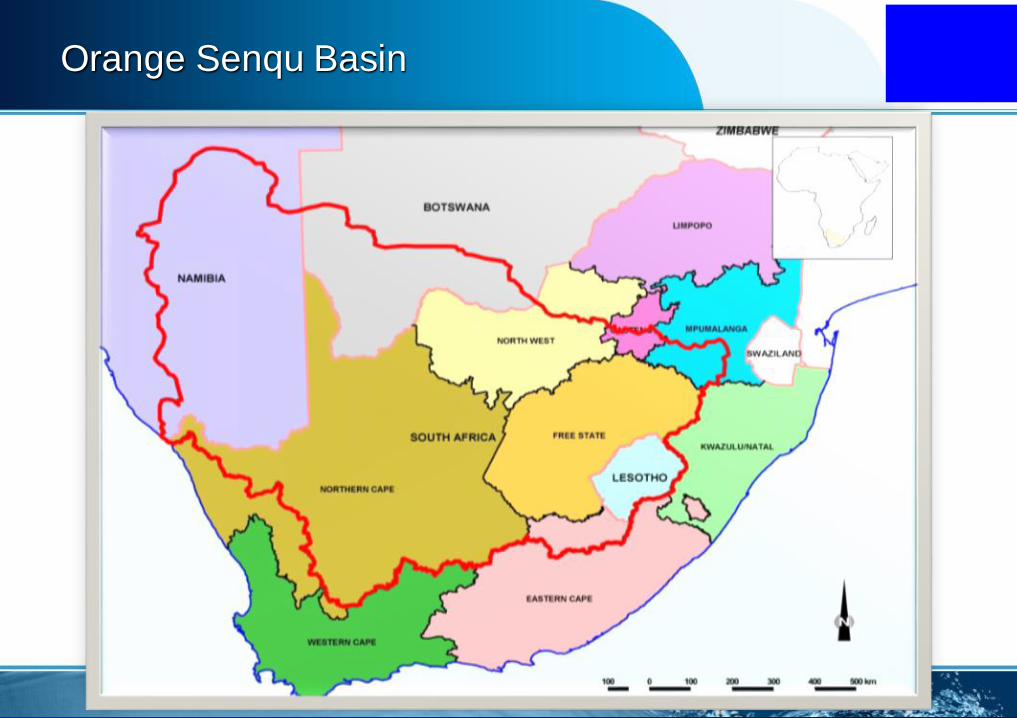
Orange Senqu Basin
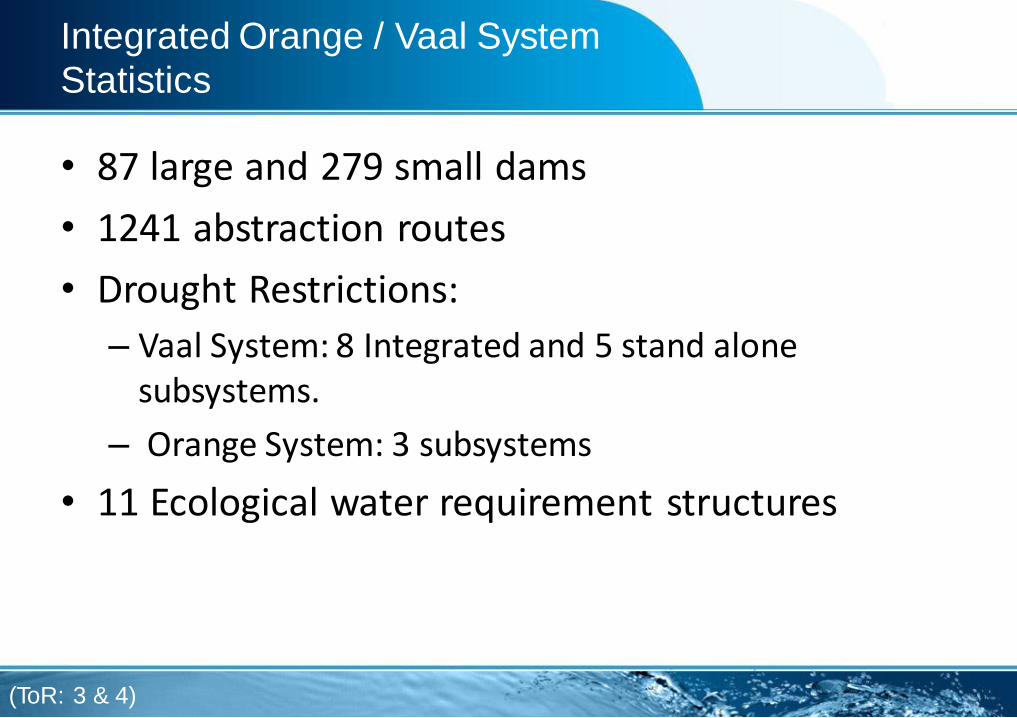
• 87 large and 279 small dams
• 1241 abstraction routes
• Drought Restrictions:
– Vaal System: 8 Integrated and 5 stand alone subsystems.
– Orange System: 3 subsystems
• 11 Ecological water requirement structures
Integrated Orange / Vaal System
Statistics
(ToR: 3 & 4)

Reservoir operation and
monitoring
1257
1257.5
1258
1258.5
1259
Oct Nov Dec Jan Feb Mar Apr May Jun Jul Aug Sep
Lev
el (
ma
msl
)
Months
Gariep SCC
Gariep FSL Gariep SCC- May 200820% SCC May 2009 SCC Nov 2009
100%
95.8%
92.7%1169.5
1170
1170.5
1171
Oct Nov Dec Jan Feb Mar Apr May Jun Jul Aug Sep
Lev
el (
ma
msl
)
Months
Vanderkloof SCC
Vdrklf FSL Vdrklf SCC- May 2009 Vdrklf SCC- November 2009
100%
98%
95.9%
0.00
50.00
100.00
150.00
200.00
250.00
300.00
May-13 Jul-13 Sep-13 Nov-13 Jan-14 Mar-14
Flo
w m
illio
n m
3/m
on
th
Months
Vanderkloof Release Pattern
VDK releases for d/s demands Eskom hydropower requirement
(ToR: 3 & 4)
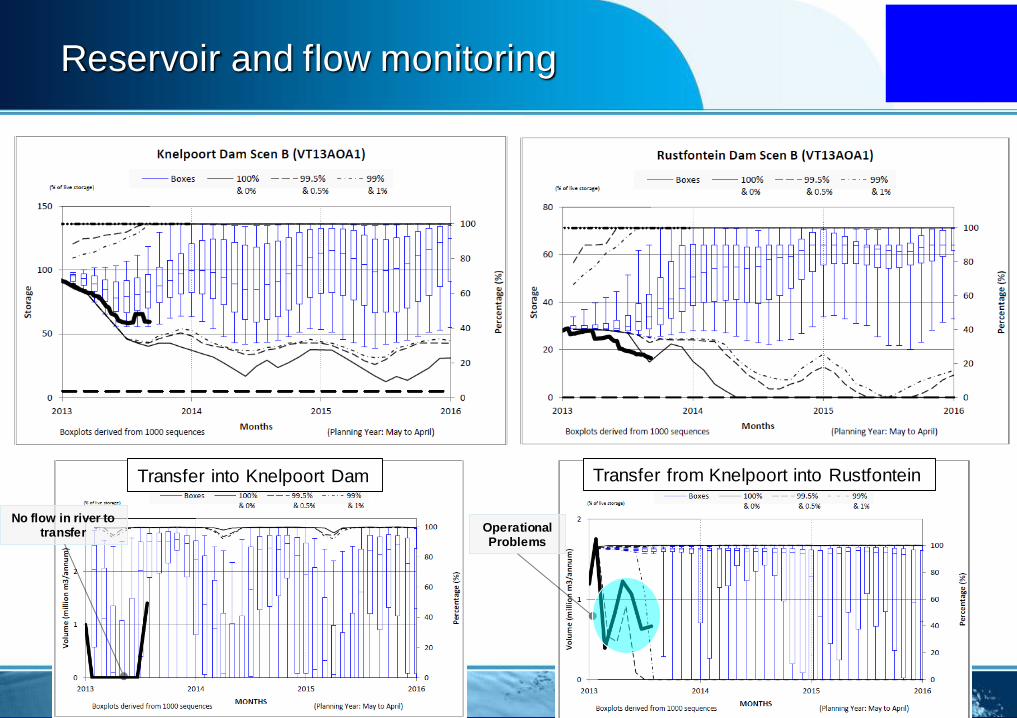
Reservoir and flow monitoring
Transfer into Knelpoort Dam Transfer from Knelpoort into Rustfontein
No flow in river to transfer Operational
Problems
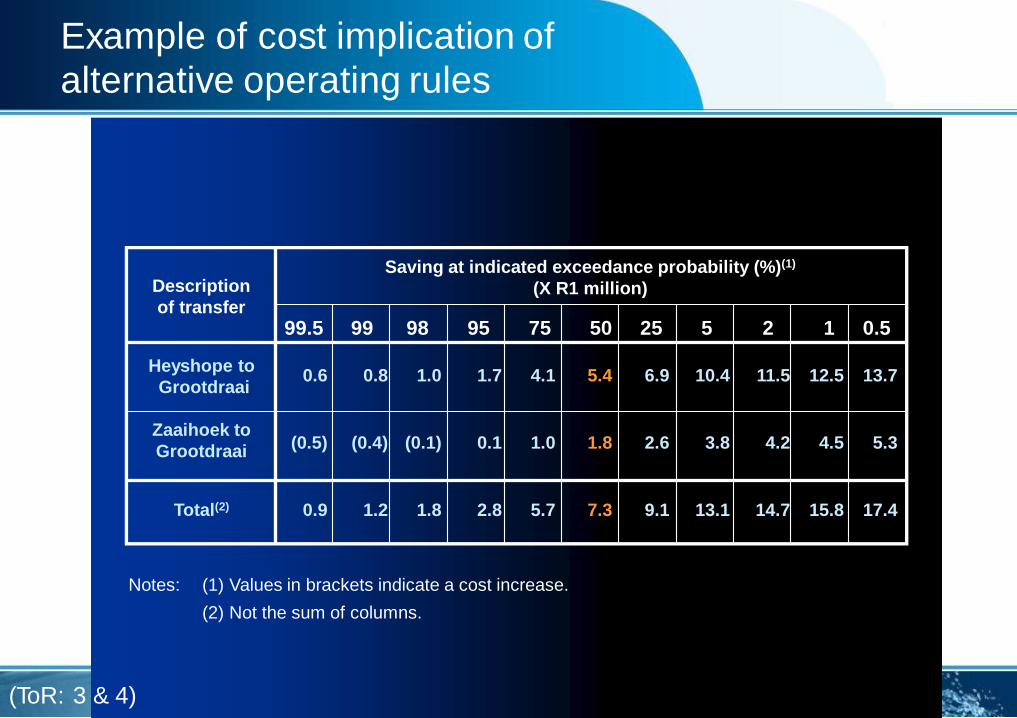
Example of cost implication of
alternative operating rules
99.5 99 98 95 75 50 25 5 2 1 0.5
Heyshope to
Grootdraai
Zaaihoek to
Grootdraai
Total(2)
0.8
(0.4)
1.2
1.0
(0.1)
1.8
1.7
0.1
2.8
4.1
1.0
5.7
5.4
1.8
7.3
6.9
2.6
9.1
10.4
3.8
13.1
11.5
4.2
14.7
12.5
4.5
15.8
13.7
5.3
17.4
0.6
(0.5)
0.9
(1) Values in brackets indicate a cost increase.
(2) Not the sum of columns.
Notes:
Description
of transfer
Saving at indicated exceedance probability (%)(1)
(X R1 million)
(ToR: 3 & 4)
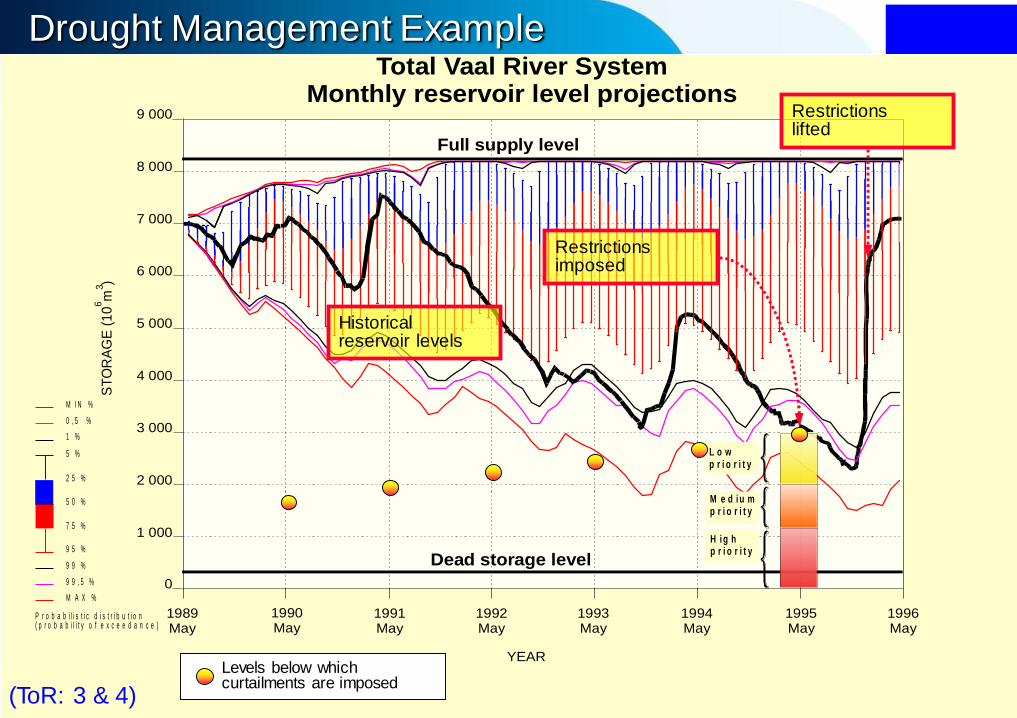
Drought Management ExampleTotal Vaal River System
Monthly reservoir level projections9 000
8 000
7 000
6 000
5 000
4 000
3 000
2 000
1 000
0
1989May
1990May
1991May
1992May
1993May
1994May
1995May
1996May
YEAR
Full supply level
Dead storage level
ST
OR
AG
E (
10
m)
63
M I N %
5 %
0 , 5 %
1 %
2 5 %
5 0 %
7 5 %
9 5 %
9 9 , 5 %
9 9 %
M A X %
P r o b a b i l i s t i c d i s t r i b u t i o n( p r o b a b i l i t y o f e x c e e d a n c e )
L o wp r i o r i t y
M e d i u mp r i o r i t y
H i g hp r i o r i t y
Historicalreservoir levels
Levels below whichcurtailments are imposed
Restrictionsimposed
Restrictionslifted
(ToR: 3 & 4)
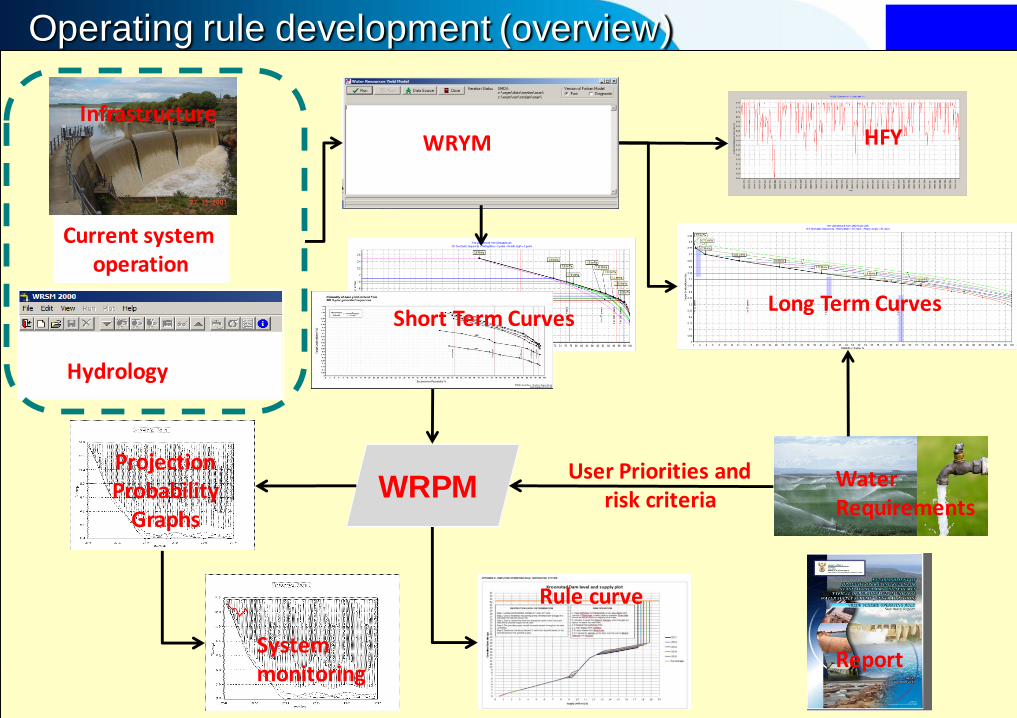
Operating rule development (overview)
Infrastructure
Water Requirements
Hydrology
WRYM
Short Term CurvesLong Term Curves
HFY
Current system operation
Rule curve
ProjectionProbability
Graphs
System monitoring
Report
WRPMUser Priorities and
risk criteria

• Stochastic model was designed to account for the variability experiences in Southern Africa.
• Extensively tested and applied in numerous studies.
• Stochastic analysis generate sequences that are wetter and drier than observed historically.
• Option of changing stochastic model parameters to alter flow generation.
Climate variability and climate
change
(ToR: 5)
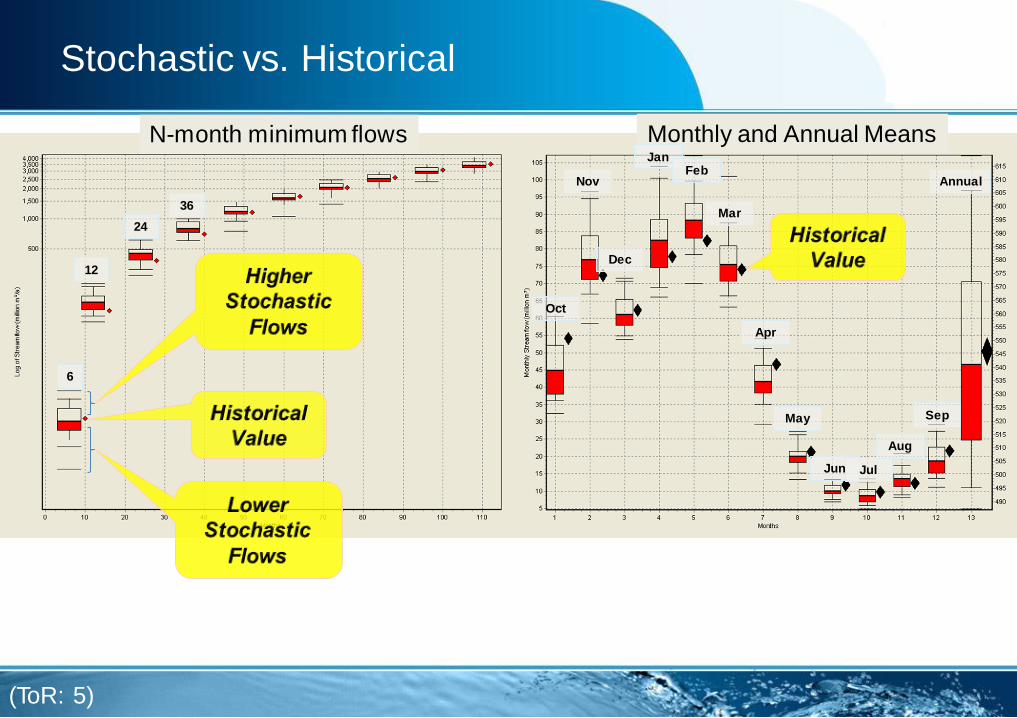
Stochastic vs. Historical
N-month minimum flows Monthly and Annual Means
6
12
24
36
Oct
Nov
Dec
JanFeb
Mar
Apr
May
Jun Jul
Aug
Sep
Annual
(ToR: 5)
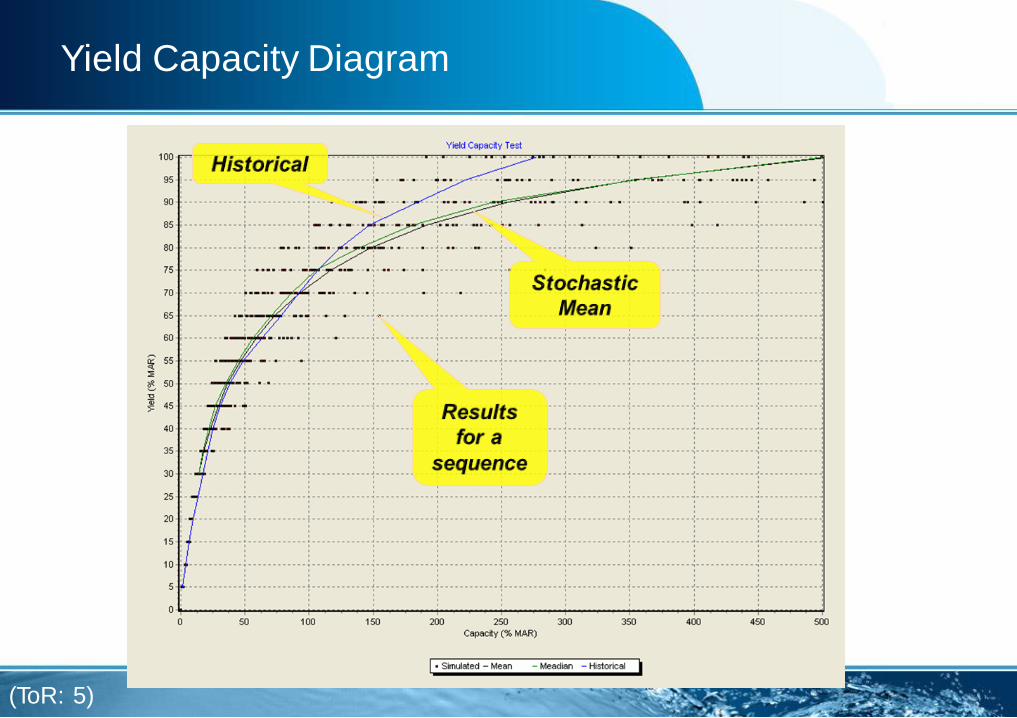
Yield Capacity Diagram
(ToR: 5)
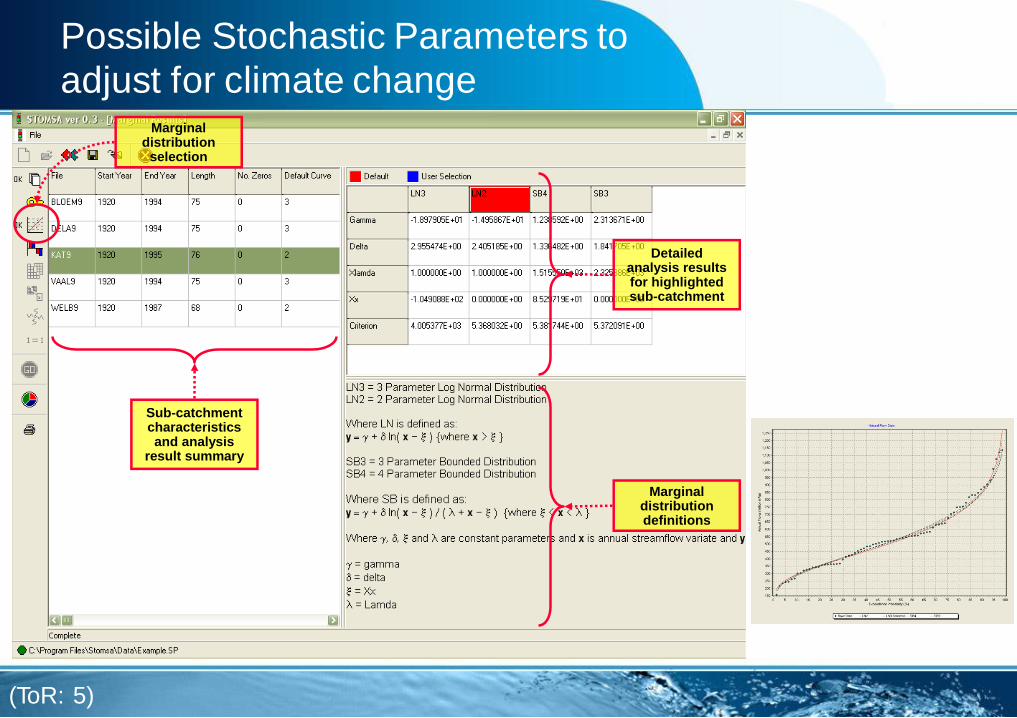
Possible Stochastic Parameters to
adjust for climate change Marginal
distribution selection
Sub-catchment characteristics and analysis
result summary
Marginal distribution definitions
Detailed analysis results for highlighted sub-catchment
(ToR: 5)
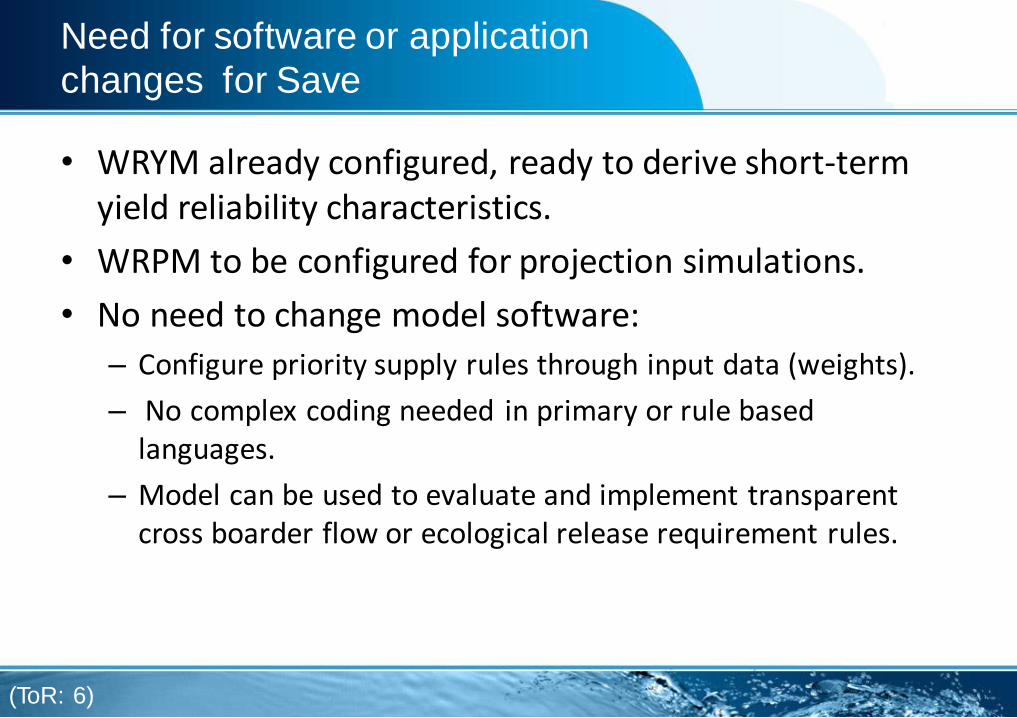
• WRYM already configured, ready to derive short-term yield reliability characteristics.
• WRPM to be configured for projection simulations.
• No need to change model software:
– Configure priority supply rules through input data (weights).
– No complex coding needed in primary or rule based languages.
– Model can be used to evaluate and implement transparent cross boarder flow or ecological release requirement rules.
Need for software or application
changes for Save
(ToR: 6)
• None, SA Government makes models available for use in SADC countries.
• The suit of models is the product of substantial R&D expenditure over many years.
• Continuous enhanced through WRC research and other government funding.
– Rainfall stochastic generator.
– Incorporate quantification of uncertainty.
Licensing fees
(ToR: 7)
• One or two day courses for managers and decision makers.
• Training for model users:– Hydrology training – 3 to 4 days.
– WRYM and WRPM – 5 day course.
• Service provided on a time and cost basis.
• Part of post graduate courses at University of Pretoria and Stellenbosch University.
• SA Department of Water Affairs also provide training courses.
Training courses
(ToR: 8)
• SA Department of Water Affairs has a user support helpdesk and web site - Pretoria.
• Model enhancements funded by SA DWA & WRC.
• WRP provides the following services:
–Model users that can assist with queries via e-mail.
–Model development and enhancement services.
– Application training to officials and consultants as part of water resource studies.
Backup support
(ToR: 8)

Thank you for the opportunity and your
attention
In support of: Prepared by: