Embed Size (px)
Citation preview


Selecting Candidates for Selecting Candidates for Fracture Prevention Based on Fracture Prevention Based on
Risk PredictionRisk Prediction
Lubna Pal, MBBS, MRCOG, MSLubna Pal, MBBS, MRCOG, MS Assistant ProfessorAssistant Professor
Department of Obstetrics, Gynecology Department of Obstetrics, Gynecology and Reproductive Sciencesand Reproductive Sciences
Yale University School of MedicineYale University School of MedicineNew Haven, ConnecticutNew Haven, Connecticut
““A systemic skeletal disease characterized by low A systemic skeletal disease characterized by low bone mass and microarchitectural deterioration of bone mass and microarchitectural deterioration of bone tissue, with a consequent increase in bone bone tissue, with a consequent increase in bone fragility and susceptibility to fracture.”fragility and susceptibility to fracture.”Consensus Development Conference on Osteoporosis, 1993Consensus Development Conference on Osteoporosis, 1993
OsteoporosisOsteoporosis
Normal BoneNormal Bone OsteoporosisOsteoporosisPeck WA, et al. Am J Med. 1993;94:646. Graphics courtesy of the International Osteoporosis Foundation.
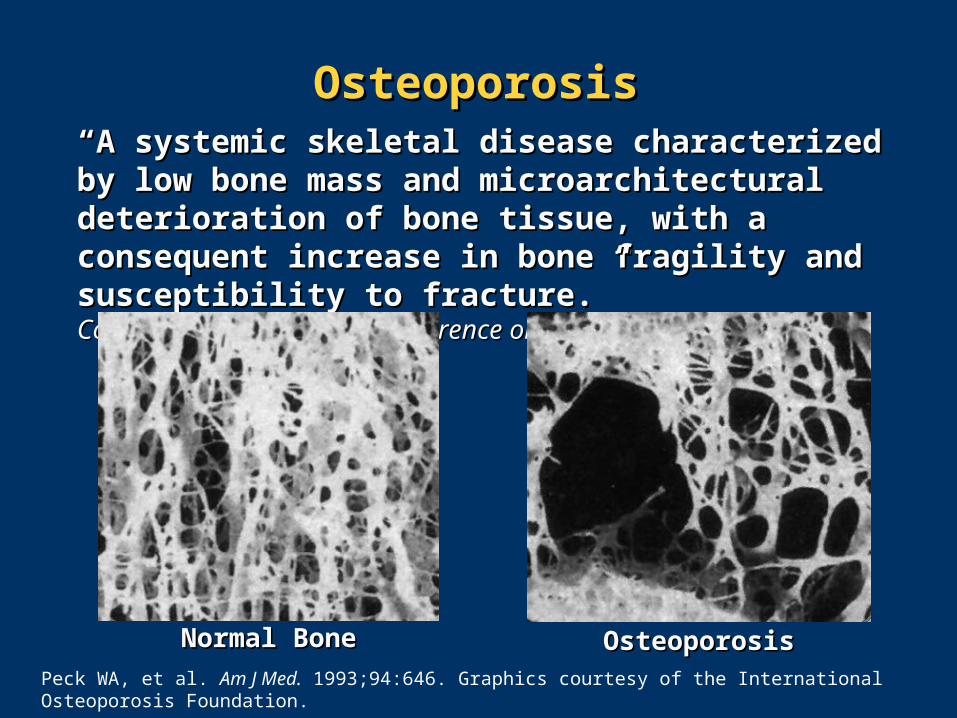
Demographics of OsteoporosisDemographics of Osteoporosis
WorldwideWorldwide11
1 in 3 women and 1 in 5 men 1 in 3 women and 1 in 5 men >50 years of age will >50 years of age will develop osteoporosis-develop osteoporosis-related fracturerelated fracture
30%–50% of women and 30%–50% of women and 15%–30% of men will 15%–30% of men will experience an osteoporosis-experience an osteoporosis-related fracture in their related fracture in their lifetimelifetime
75 million people in the US, 75 million people in the US, Europe, and Japan are Europe, and Japan are affected by osteoporosisaffected by osteoporosis
1. International Osteoporosis Foundation. Facts and statistics about osteoporosis and its impact. Available at: http://www.iofbonehealth.org/facts-and-statistics.html. 2. National Osteoporosis Foundation. Available at: http://www.iofbonehealth.org/facts-and-statistics.html#factsheet-category-23.
United StatesUnited States22
By 2010:By 2010: 12 million >50 years of age will 12 million >50 years of age will
have osteoporosishave osteoporosis 40 million will have low bone mass40 million will have low bone mass
By 2020:By 2020: 14 million >50 years of age will 14 million >50 years of age will
have osteoporosishave osteoporosis 47 million will have low bone mass47 million will have low bone mass
By 2040:By 2040: Hip fractures will increase 2-3 foldHip fractures will increase 2-3 fold
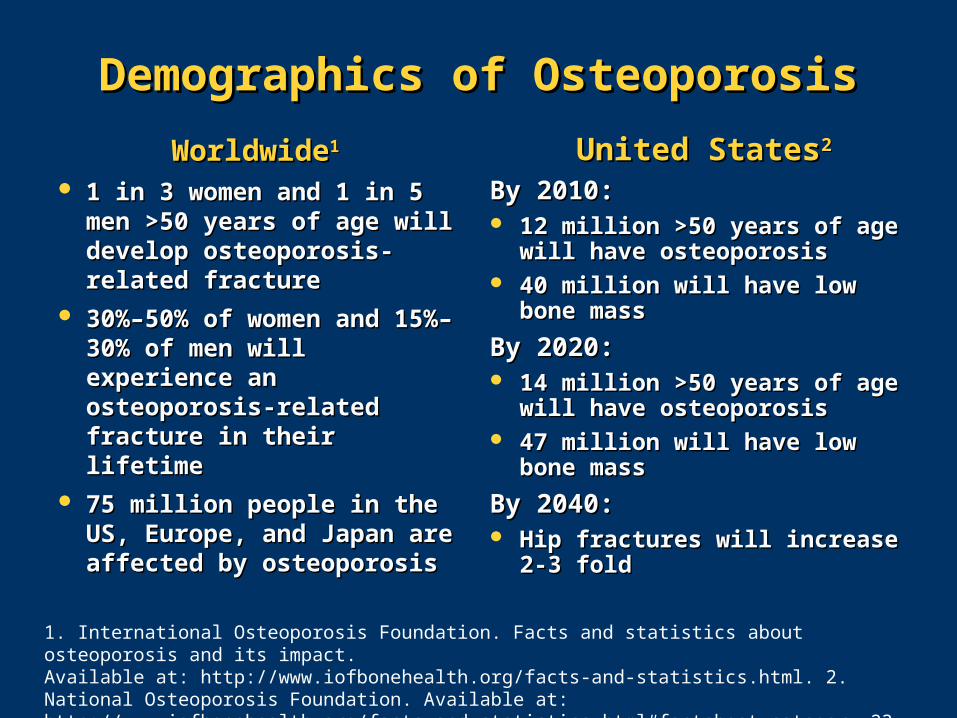
Implications of OsteoporosisImplications of Osteoporosis Mortality Mortality MorbidityMorbidity
– Quality of lifeQuality of life
– DependenceDependence
– PainPain
– Health issues (pulmonary, gastrointestinal)Health issues (pulmonary, gastrointestinal)
Healthcare burdenHealthcare burden– >1.5 million Americans experience osteoporosis->1.5 million Americans experience osteoporosis-
related fractures/yearrelated fractures/year
– Annual cost of $14 BillionAnnual cost of $14 Billion
International Osteoporosis Foundation. Facts and statistics about osteoporosis and its impact. Available at: http://www.iofbonehealth.org/facts-and-statistics.html.
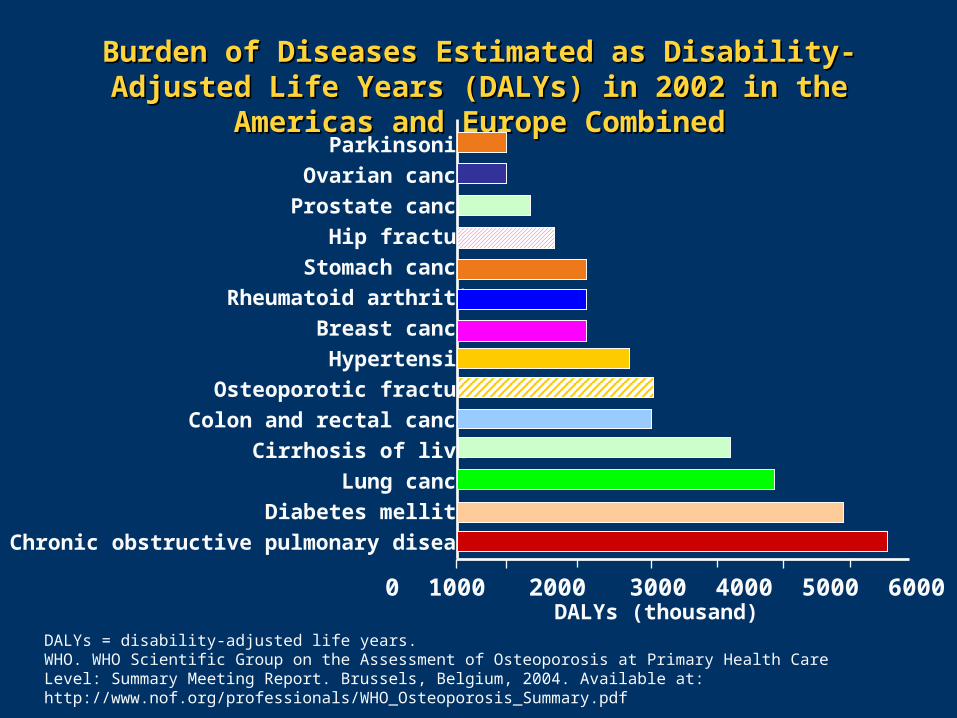
Burden of Diseases Estimated as Disability-Adjusted Life Burden of Diseases Estimated as Disability-Adjusted Life Years (DALYs) in 2002 in the Americas and Europe CombinedYears (DALYs) in 2002 in the Americas and Europe Combined
DALYs = disability-adjusted life years.WHO. WHO Scientific Group on the Assessment of Osteoporosis at Primary Health Care Level: Summary Meeting Report. Brussels, Belgium, 2004. Available at: http://www.nof.org/professionals/WHO_Osteoporosis_Summary.pdf
Parkinsonism
Ovarian cancer
Prostate cancer
Hip fracture
Stomach cancer
Rheumatoid arthritis
Breast cancer
Hypertension
Osteoporotic fracture
Colon and rectal cancer
Cirrhosis of liver
Lung cancer
Diabetes mellitus
Chronic obstructive pulmonary disease
0 1000 2000 3000 4000 5000 6000DALYs (thousand)
60
70
80
90
100
30 40 50 60 70 80 90
Age (years)
Rel
ativ
e B
MD
(%
)
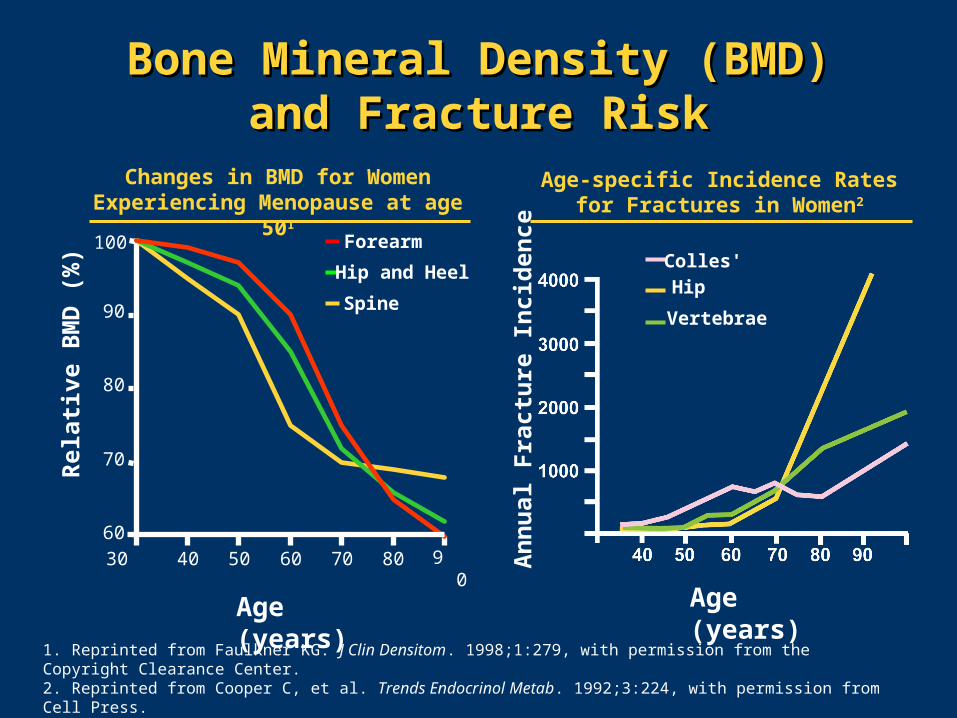
Forearm
Hip and Heel
Spine
Colles'
Vertebrae
Hip
Age (years)
An
nu
al F
ract
ure
In
cid
ence
1. Reprinted from Faulkner KG. J Clin Densitom. 1998;1:279, with permission from the Copyright Clearance Center.2. Reprinted from Cooper C, et al. Trends Endocrinol Metab. 1992;3:224, with permission from Cell Press.
Bone Mineral Density (BMD)Bone Mineral Density (BMD)and Fracture Riskand Fracture Risk
Changes in BMD for Women Experiencing Menopause at age 501
Age-specific Incidence Rates for Fractures in Women2

Reprinted from Hui SL, et al. J Clin Invest. 1988;81:1804, with permission from The Copyright Clearance Center.
Qualitative Skeletal Deterioration Qualitative Skeletal Deterioration with Agingwith Aging
Fra
ctu
re R
isk
per
100
0 P
erso
n-Y
ears
Bone Mass (g/cm)
Age (years)
80+
75–79
70–74
65–69
60–64
55–5950–5445–49<45
Addressing Osteoporosis in Addressing Osteoporosis in At-Risk PopulationsAt-Risk Populations
IdentifyIdentify
– Bone mineral densityBone mineral density
– Risk factors Risk factors
InterveneIntervene
– Reduction in incident fracturesReduction in incident fractures
BMD Screening StrategyBMD Screening Strategy LimitationsLimitations
– Expense Expense
– ExpertiseExpertise
– Logistic constraints for patientsLogistic constraints for patients
– Preferential skeletal site?Preferential skeletal site?
BMD is 1 measure of skeletal structure and strengthBMD is 1 measure of skeletal structure and strength11 – Fracture burden is highest in patients with BMD T-scoreFracture burden is highest in patients with BMD T-score
of -2.5of -2.5aa or less or less
– Clinical history can identify fracture risk to degree Clinical history can identify fracture risk to degree comparable to BMDcomparable to BMD
1. Kanis JA, et al. Osteoporos Int. 2005;16:581.
aStandard deviation below young average value.BMD = bone mineral density.
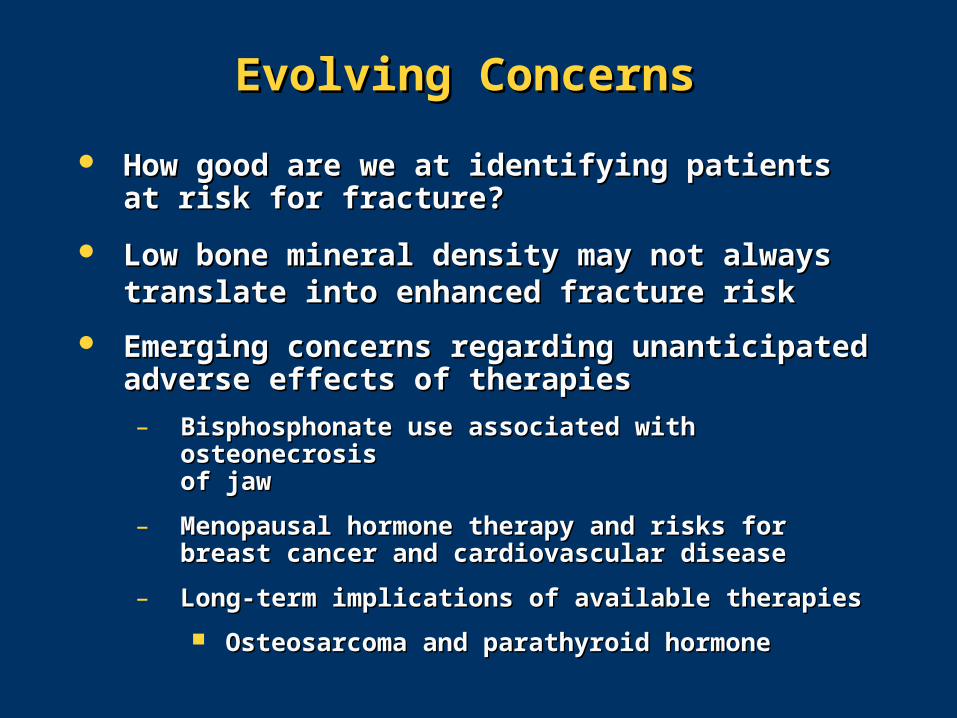
Evolving Concerns Evolving Concerns
How good are we at identifying patients at risk How good are we at identifying patients at risk for fracture?for fracture?
Low bone mineral density may not always Low bone mineral density may not always translate into enhanced fracture risktranslate into enhanced fracture risk
Emerging concerns regarding unanticipated Emerging concerns regarding unanticipated adverse effects of therapiesadverse effects of therapies
– Bisphosphonate use associated with osteonecrosisBisphosphonate use associated with osteonecrosisof jawof jaw
– Menopausal hormone therapy and risks for breast Menopausal hormone therapy and risks for breast cancer and cardiovascular diseasecancer and cardiovascular disease
– Long-term implications of available therapiesLong-term implications of available therapies
Osteosarcoma and parathyroid hormoneOsteosarcoma and parathyroid hormone
a Characteristics capture aspects of fracture risk over and above that provided by bone mineral density.
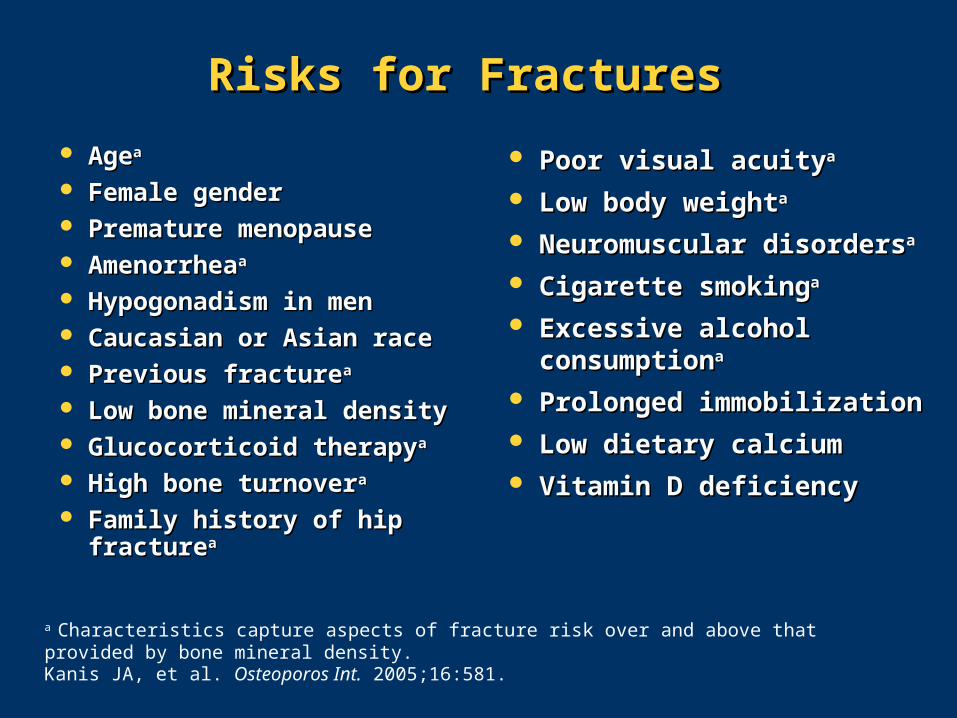
Risks for Fractures Risks for Fractures
AgeAgeaa
Female gender Female gender Premature menopausePremature menopause AmenorrheaAmenorrheaaa
Hypogonadism in menHypogonadism in men Caucasian or Asian raceCaucasian or Asian race Previous fracturePrevious fractureaa
Low bone mineral density Low bone mineral density Glucocorticoid therapyGlucocorticoid therapyaa
High bone turnoverHigh bone turnoveraa
Family history of hip fractureFamily history of hip fractureaa
Poor visual acuityPoor visual acuityaa
Low body weightLow body weightaa
Neuromuscular disordersNeuromuscular disordersaa
Cigarette smokingCigarette smokingaa
Excessive alcohol Excessive alcohol consumptionconsumptionaa
Prolonged immobilizationProlonged immobilization Low dietary calciumLow dietary calcium Vitamin D deficiencyVitamin D deficiency
Kanis JA, et al. Osteoporos Int. 2005;16:581.
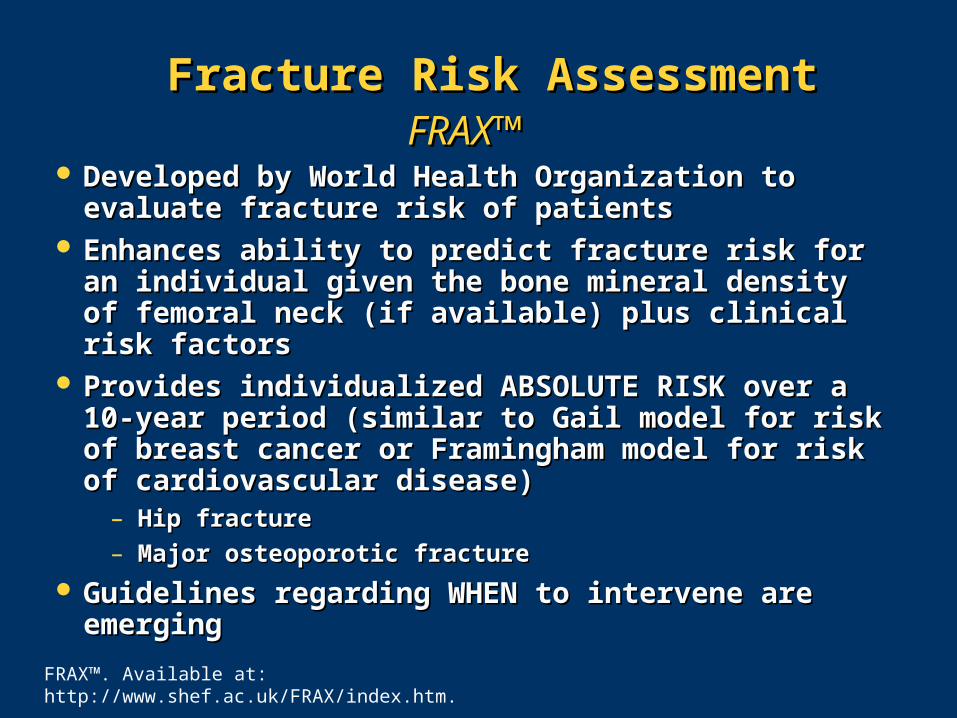
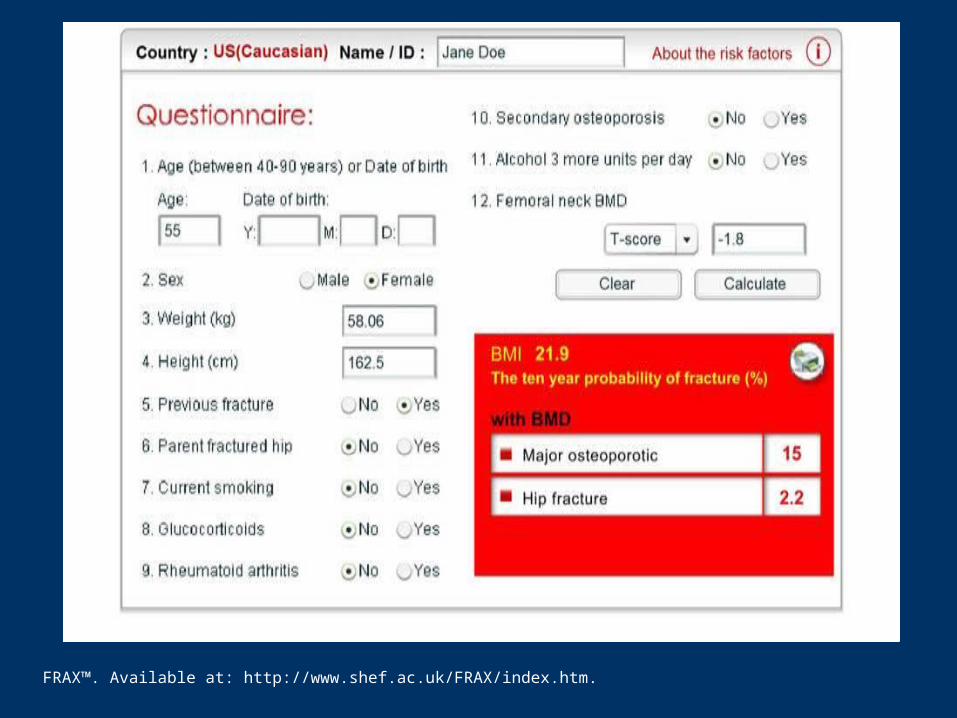
Fracture Risk AssessmentFracture Risk AssessmentFRAX™FRAX™
Developed by World Health Organization to evaluate Developed by World Health Organization to evaluate fracture risk of patientsfracture risk of patients
Enhances ability to predict fracture risk for an Enhances ability to predict fracture risk for an individual given the bone mineral density of femoral individual given the bone mineral density of femoral neck (if available) plus clinical risk factorsneck (if available) plus clinical risk factors
Provides individualized ABSOLUTE RISK over a Provides individualized ABSOLUTE RISK over a 10-year period (similar to Gail model for risk of 10-year period (similar to Gail model for risk of breast cancer or Framingham model for risk of breast cancer or Framingham model for risk of cardiovascular disease) cardiovascular disease)
– Hip fractureHip fracture
– Major osteoporotic fractureMajor osteoporotic fracture
Guidelines regarding WHEN to intervene are Guidelines regarding WHEN to intervene are emergingemerging
FRAX™. Available at: http://www.shef.ac.uk/FRAX/index.htm.
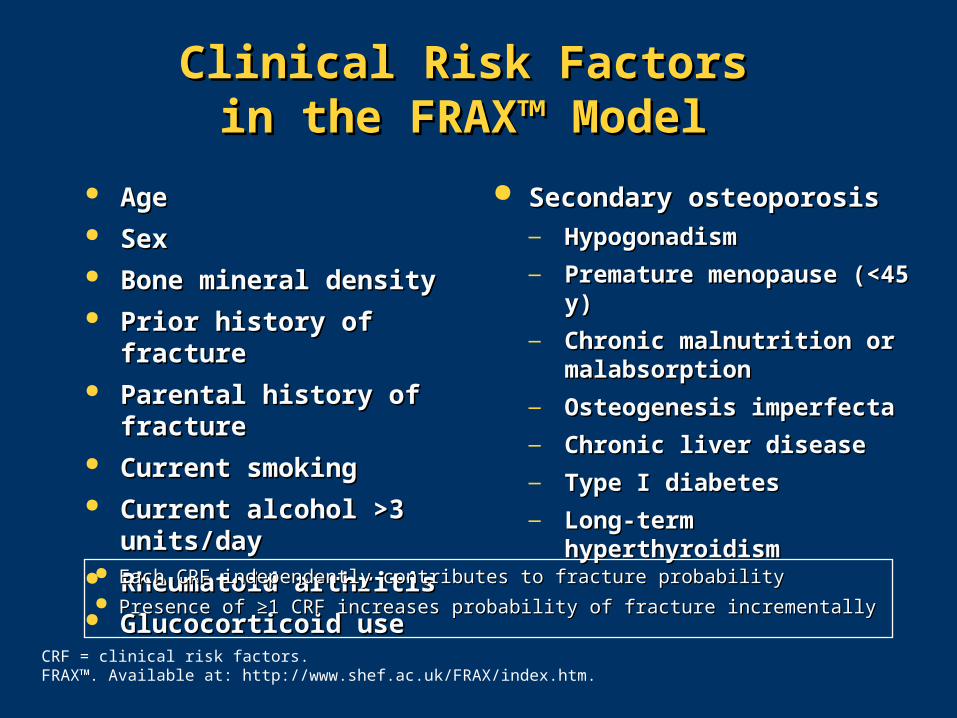
AgeAge SexSex Bone mineral densityBone mineral density Prior history of fracturePrior history of fracture Parental history of fractureParental history of fracture Current smokingCurrent smoking Current alcohol >3 units/dayCurrent alcohol >3 units/day Rheumatoid arthritisRheumatoid arthritis Glucocorticoid use Glucocorticoid use
Secondary osteoporosisSecondary osteoporosis— Hypogonadism Hypogonadism
— Premature menopause (<45 y)Premature menopause (<45 y)
— Chronic malnutrition or Chronic malnutrition or malabsorptionmalabsorption
— Osteogenesis imperfectaOsteogenesis imperfecta
— Chronic liver diseaseChronic liver disease
— Type I diabetesType I diabetes
— Long-term hyperthyroidismLong-term hyperthyroidism
Clinical Risk Factors Clinical Risk Factors in the FRAX™ Model in the FRAX™ Model
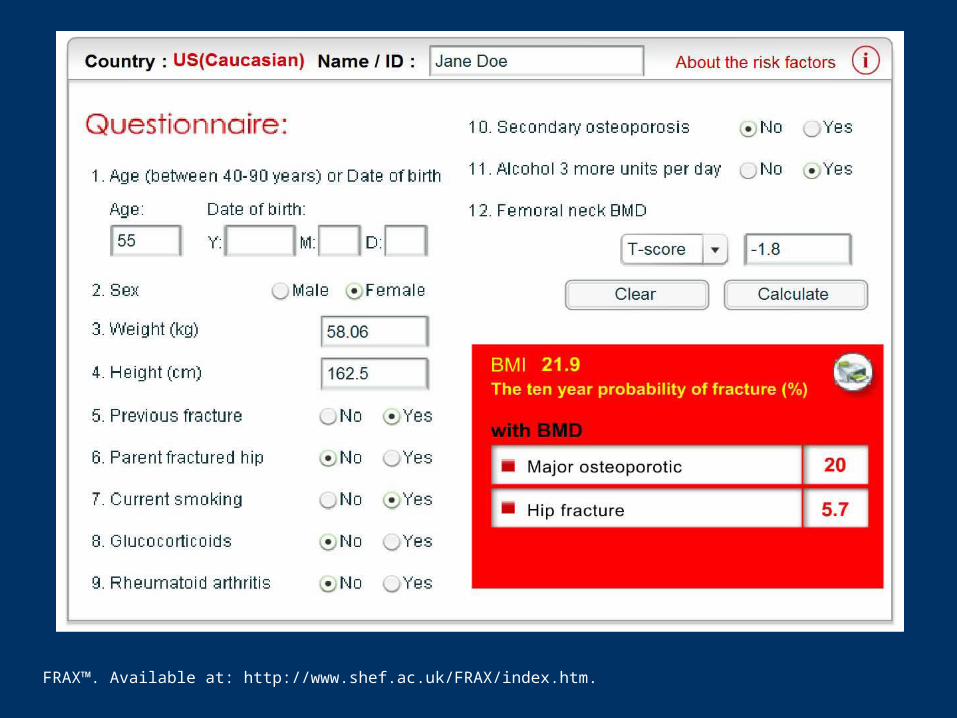
Each CRF independently contributes to fracture probability Each CRF independently contributes to fracture probability
Presence of ≥1 CRF increases probability of fracture incrementallyPresence of ≥1 CRF increases probability of fracture incrementally
CRF = clinical risk factors.FRAX™. Available at: http://www.shef.ac.uk/FRAX/index.htm.

FRAX™. Available at: http://www.shef.ac.uk/FRAX/index.htm.
FRAX™. Available at: http://www.shef.ac.uk/FRAX/index.htm.
FRAX™. Available at: http://www.shef.ac.uk/FRAX/index.htm.
Fracture Risk ReductionFracture Risk Reduction
Optimize an Optimize an
appreciation of risk appreciation of risk
factors other than low factors other than low
bone mineral densitybone mineral density
Minimize over-zealous Minimize over-zealous
treatment of those at treatment of those at
indeterminate riskindeterminate risk

ConclusionsConclusions
Bone mineral density alone is inadequate for Bone mineral density alone is inadequate for identifying individuals at risk for fractureidentifying individuals at risk for fracture
Low BMD may not always translate into Low BMD may not always translate into enhanced fracture riskenhanced fracture risk
Fracture risk may be predicted by a patient’s Fracture risk may be predicted by a patient’s clinical history almost as reliably as by BMD clinical history almost as reliably as by BMD assessment aloneassessment alone
Fracture risk assessment approach Fracture risk assessment approach comprehensively addresses the morbidity of comprehensively addresses the morbidity of fracture rather than skeletal densityfracture rather than skeletal density
– Guidelines regarding WHEN to intervene are Guidelines regarding WHEN to intervene are emergingemerging

BriefBrief
Q & AQ & A