Embed Size (px)
Citation preview

Selected Results from Chronic Disease Management and Behavioral HealthLaura Jacobus-Kantor, Ph.D.
The Michigan Purchasers Health Alliance September 21, 2006

2
Ensuring Solutions to Alcohol Problems Located at George Washington University
Medical Center Funded by The Pew Charitable Trusts Goal: Improving access to alcohol treatment How: Providing research-based materials
through targeted outreach to business leaders, policy makers and advocates
www.ensuringsolutions.org

National Business Coalition on Health (NBCH) & eValue8 More than 80 state and regional business coalitions made
up of 10,000 employer members nationwide employing over 34 million covered lives
eValue8 RFI is a uniform, annual assessment of the quality of care for a range of health concerns provided by health plans to employees
Survey conducted by businesses for business – purchasing, accountability, incentives and penalties

2003 eValue8 Participating Plans

2006 eValue8 Participating Plans
Key:
Participating States

Michigan Plans Surveyed in 2006
• Aetna HMO• Aetna PPO• Blue Care Network HMO• BCBS PPO• Care Choices HMO• Care Choices PPO• HAP HMO• HAP PPO
• Health Plus HMO• Humana PPO• M-Care HMO• Physicians Health Plan
HMO• Physicians Health Plan
South MI HMO• Priority Health HMO
7
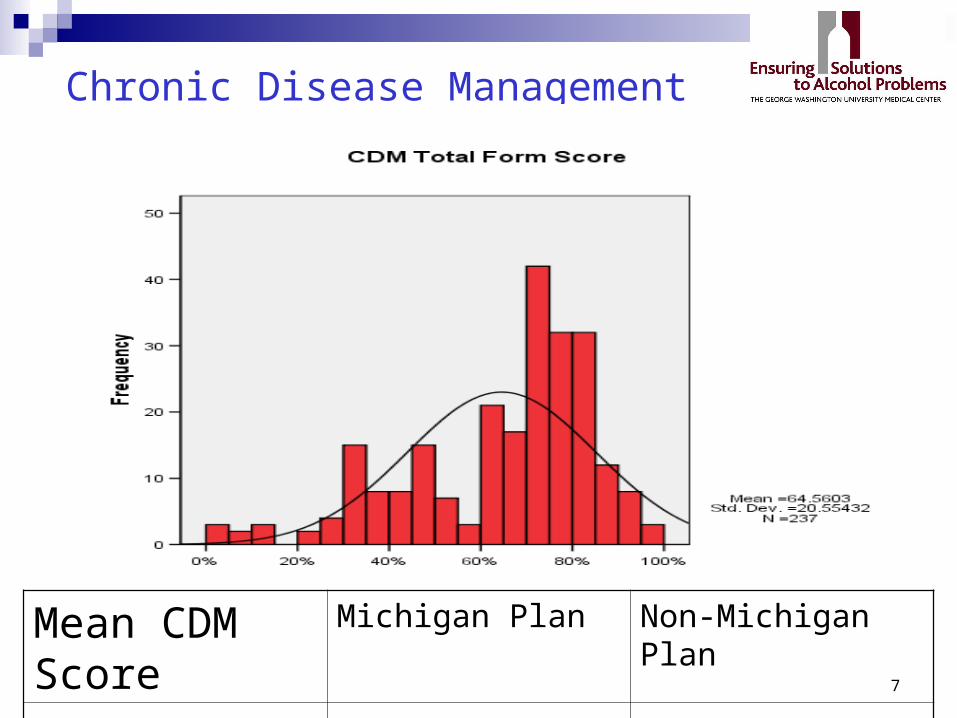
Chronic Disease Management
Mean CDM Score
Michigan Plan Non-Michigan Plan
79% 63%

8
HEDIS Trends: Asthma- Appropriate Medication
0%
20%
40%
60%
80%
100%
2002 2003 2004 2005 2006
5 to 9
10 to 17
18 to 56

9
HEDIS Trends: Cardiovascular 2002-2006
0%
20%
40%
60%
80%
100%
2002 2003 2004 2005 2006
Control BP
LDL Level
Beta Blocker
LDL Screen

10
HEDIS Trends: Diabetes 2002-2006
0%
20%
40%
60%
80%
100%
2002 2003 2004 2005 2006
Retinal Exam
Nephropathy
Poor HbA1c Control
HbA1c test
LDL Screen

11
Asthma Disease Management
29% Asthma is a vendor program
96% have a DM program in place
87% structured as an opt-out
6% structured opt-in
3% opt-in or opt-out
89% plan wide and available to all members

Who Has Alcohol Problems?
11.1% of full-time workers ages 18 – 49 Approximately 12.3% of MI workers
Twice as many men (13.7%) as women (7.4%) Prevalence by age:
18-25 (18.9%)26-34 (12.5%)34-49 (7.8%)

Here is the Problem:
Source: Office of Applied Studies. (2004). Results from the 2003 National Survey on Drug Use and Health: National findings. Rockville, MD: Substance Abuse and Mental Health Services Administration.

Secondary Causes of Disease (Ages 35 and Older)
Cancer Lip, Mouth and Pharynx
Esophagus
Larynx
Liver and Bile Ducts
Stomach
50% (men) 40% (women)
75%
50% (men) 40% (women)
15%
20%
Diabetes 5%
Gastrointestinal Disease 20%
Injuries Attributable to Alcohol
Motor Vehicle Fatalities
Injuries
41%
9%
Violence (Including Homicide) 46%
Problem Drinking Causes Disease and Injury

How do alcohol problems cost businesses? Lower productivity Lost workdays Extra health care use Other costs:
Workers compensation and disability Accidents and damage Turnover and worker replacement Diverted supervisory and co-worker time Workplace friction Family disruption

Spending by Insurers 1991-2001
Chart Source, SAMHSA, 2005

Spending by Insurance Source 1991-2001
Chart Source, SAMHSA, 2005

Employment-based health benefits treat addiction as if it were an acute illness or willful bad
behavior
General medical system unprepared and un-paid to identify or treat alcohol problems
early
Specialty substance use treatment system hampered by low insurance reimbursement, acute care model
Many people with alcohol problems do not want the primary treatment goal offered: abstinence
Current State of Treatment

Behavioral Health Overview
Mean BH Score
Michigan Plan Non-Michigan Plan
69% 53%

20
Alcohol Disease Management
64% Alcohol is managed by an MBHO
57% BH is accredited by NCQA or JCHAO
< 1% Have no BH program
75% Alcohol screening plan-wide and available to all members
80% Alcohol treatment plan-wide and available to all members

Recent estimates suggest that almost 8% of the US population has an alcohol problem
92%
8%
Estimated Percentage of Plan Members with an Alcohol Problem

92%
8%
Less than 1% of Michigan members are identified.
How many get Identified?

Recent estimates suggest that almost 9% of the US population has a major depressive disorder
91%
9%
Estimated Percentage of Plan Members with Depression

91%
9%
4.3% of Michigan members are identified.
How many get Identified?

Alcohol 5%
Depression 47%
Diabetes 65%
Hypertension 70%
Identification Rates for Other Health Conditions

Alcohol Screening Instruments for Primary Care Providers
Percent Recommending Tool
7%
19%
13%
47%
11%
49%
18%
0% 10% 20% 30% 40% 50% 60%
None
TWEAK
MHQ
DSM IV/ICD9
AUDIT
CAGE
MAST/BMAST
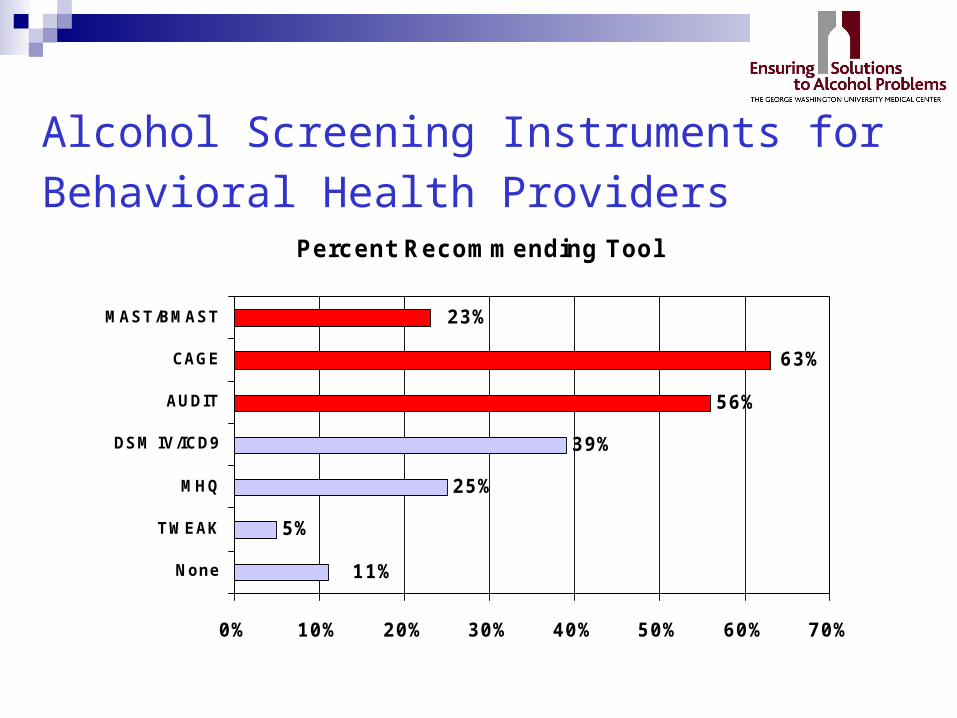
Alcohol Screening Instruments for Behavioral Health Providers
Percent Recommending Tool
5%
25%
39%
56%
23%
63%
11%
0% 10% 20% 30% 40% 50% 60% 70%
None
TWEAK
MHQ
DSM IV/ICD9
AUDIT
CAGE
MAST/BMAST

DepressionHEDIS Collected 2003-2006
0%
20%
40%
60%
80%
100%
2003 2004 2005 2006
7 Days
30 Days
Acute Phase
Cont. Phase
Contacts

Behavioral Health Comparisons Disparities between behavioral health and non-
behavioral health are evident: Identification rates
Use of data elements to identify affected members
Rate of communication between plans Rate of activities that encourage follow-up with
identified or high-risk individuals

What more can be done?
Employee Assistance Programs Work with other businesses and health care
providers Use EAP and Health Plan data to build the case
for the effectiveness of employment-based alcohol treatment in business terms: Avoidable health care costs Avoidable productivity losses Avoidable absenteeism

What Businesses Can Do to Make Their Workplaces Safer, Healthier and More Productive Comprehensive Health Insurance Benefits
Average cost of upgrading is around $5 per beneficiary per month
Equitable co-pays, deductibles, limits. Co-pays less than $10/session.
It is being done!
Managing health plan benefits National Business Coalition on Health’s eValu8 RFI at www.nbch.org
Confidential screening and brief intervention
Encourage primary care screening and treatment
Monitoring utilization and outcomes

Looking forward: The 2007 eValue8 RFI
Investigate eValue8 scales-both within and between sections: Section scales Summary scales eValue8 total scale
What are the properties of these scales? Do they accurately measure what we want them to?
Which items do not contribute any unique variance to scales and can be eliminated from future versions of the RFI?