Embed Size (px)
Citation preview
Industrial Engineering and Operations Research
Nlr 'OfJA. PCUUTION PPEVENTlON CENTER FOR HlGhER ECUCAllON
Selected Reading Material
Robert A. Frosch and Nicholas E. Gallopoulos: "Strategies for Manufacturing." Scientific American 261 (September 1989): 144-152.
H. C. Haynsworth and R. Tim Lyons: "Remanufacturing By Design, the Missing Link." Production and Inventory Management (2nd Quarter 1987): 24-29.
Robert 1. Kraft: "Incorporate Environmental Reviews into Facility Design." Chemical Engineering Progress 88 (August 1 992): 46-52.
National Pollution Prevention Center for Higher Education = University of Michigan Dana Building, 430 Easl Unlverslry, Ann Arbor MI 48104-1 115 Phone: 31 3.764.1 41 2 Fax: 313.647.5841 E-mail: [email protected]
May be reproduced freely lor non-commercial educational pufposes.
Pollulion Prevention Syllabi ApriT 1995
Strategies for Manufacturing Wastes from one industrial process can serve
~eprinted with as the raw materials for another, thereby reducinp permission. .'
V
Copyright @ 1989 the impact o f industry on the environment by Scientific American, Inc. All rights reserved.
by Robert A. Frosch and Nicholas E. Gallopoulos
P eople create new technologies and industries to meet human needs more effectively and at
lower cost. Innovation is a major agent of progress, and yet inno\.ators' in- complete knowledge sometimes leads to undesirable side effects. Such un- foreseen consequences of new inven- tions are not unique to the feverish industrialization of the 19th and 20th centuries. The ancient Greek myths tell of Pandora and the box full of plagues, of Prometheus punished for stealing fire from the gods and of Icarus. who plummeted from the sky when the sun's heat melted the wax of his ~ i n g s . In historical times the shift from rawhide to tanned leather, al- though i t made for garments and tools that lasted much longer and were more comfortable to wear and use, brought stenches and disease, so that tanneries had to be segregated from the communities they served.
Today such inadvertent effects can have a global impact. Consider, for example, the invention of chlorinat- ed fluorocarbons. Before crc's were developed in the 19301s, refrigerator compressors contained ammonia or
ROBERT A. FROSCH and NICHOLAS E. C,UIOPOULOS work at the General Mo- tors Research Laboratories in Warren. Mich. Frosch, who has a Ph.D. in theoret- ical physics from Columbia Universily. has been \-ice-president in charge of the research laboratones at GM since 1982. Before that he was head of the National Aeronautics and Space Administration. associate director of the Woods Hole Oceanographic Institution and assistant executive director of the United Nations fnnronment Program. Gallopoulos has -ecently been appointed head of GM's englne research department; he was previously head of the enb-ironmental sclence department and assistant head of the fuels and lubricants department. Gallopoulos received his MS. In chemi- cal enginwring from Pennsylvania State Unnersity and his B.S. from Texas A&M I 'nwersit).
sulfur diodde; either chemical was toxic, and leaks killed or injured many people. c r c ' s saved lives, saved money and provided such elements of mod- e m life as air-conditioned buildings and untainted food. Only later did at- mospheric scientists determine that crc's contribute to global warming and affect the chemistry of the upper atmosphere, where they destroy ozone.
Such failures should not diminish the fact that technology has improved the lot of people everywhere. Stan- dards of living in many parts of the world are better today than they were 20 or 30 years ago. Many of the ad- verse effects of industrialization have been brought under control by further applications of technology. Yet as the world's population and standard of living increase, some of the old solu- tions to industrial pollution and ev- eryday wastes no longer work. There is often no "other side of town" where the modern equivalents of tanneries can be put, no open space beyond the village gates where garbage can be dumped and d o no harm.
B y the year 2030, 10 billion peo- ple are Bkely €0 live on this plan- et; Ideally, all would enjoy stan-
dards of living-equivalent to those of industrial democracies such as the U.S. or Japan. If they consume crit- ical natural resources such as cop- per, cobalt, molybdenum, nickel and petroleum at current U.S. rates, and i f new resources are not dkco\.ered or substitutes developed, such an ideal would last a decade o r less. On the waste side of the ledger. at current U.S. rates 10 billion people would generate 400 billion tons of solid waste every year-enough to bury greater Los An- geles 100 meters deep.
These calculations are not meant to be forecasts of a grim future. Instead they emphasize the incentives for re- cycling. conservation and a s ~ i t c h to altemative materials. Thcy lead to the recognition that the traditional model
of industrial activity-in which indi- vidual manufacturing proccsses take in raw materials and generate prod- ucts to be sold plus waste to be dis- posed of-should be transformed into a more integrated model: an industrial ecosystem. In such a system the con- sumption of energy and materials is optimized, waste generation is mmi- mized and the effluents of one proc- ess-whether they are spent catalysts from petroleum refining, fly and bot- tom ash from electric-power gener- ation or discarded plastic containers from consumer products-serve as the raw material for another process.
The industrial ecosystem would function as an analogue of biological ecosystems. (Plants synthesize nutri- ents that feed herbivores, which in turn feed a chain of carnivores whose wastes and bodies eventually feed fur- ther generations of plants.) An ideal industrial ecosystem may never be at- tained in practice. but both manufac- turers and consumers must change their habits to approach i t more close- ly if the industrialized world is to maintain its standard of living-and the developing nations are to raise thein to a similar level-without ad- versely affecting the environment.
If both industrialized and develop- ing nations embrace changes. it will be possible to develop a more closed in- dustrial ecosystem, one that is more sustainable in the face of decreasing supplies of raw materials and increas-
INDUSTRIAL PLANTS such a s this oil refinery In New Jersey make the prod- ucts and materials that sustain mod- e m life. They also emit pollutants that are difficult to dispose of and that may have long-lasting adverse effects on the environment. Meeting environrnen- tal needs calls for manufacturing plants that not only produce goods more effi- ciently but also fit together into a more harmonious industrial ecosystem At the same time. consumers must learn to use those products less wastefully.
144 Sclr :~ nnc AWRICAN September 1989
ing problems of waste and pollution Industr!alized nations hill have to make major and mlnor changes in their current practices. Developing na- tions hill have to leapfrog older. less ecologically sound technologies and adopt new methods more compatible with the ecosystem approach.
$laterials In a n deal industrial eco- system are not depleted any more than those in a biological one are; a chunk of sreel could porentially show up one year In a tin can, the next tear in an automobile and 10 years later In the skeleton of a building. Manufac- rurlng processes in an mdustrial eco- system simpl) transform circulating stocks of materials from one shape to a-other; the circulating stock dccreas- c ,..hen some material is unavoidably lost. and it increases to meet the needs of a growing population Such r e v cling still requires the expenditure of energy and the unavoidable genera- tion of wastes and harmful by-prod- ucts, but at much lower levels thanare typical roday.
Todafs industrial operations do not form an ideal industrial ecosystem, and many subsystems and processes are less than perfect Yet there are developments that could be cause for optimism. Some manufacturers are al- ready making use of "designed offai." or "engineered scrap," in the manufac- ture of metals and some plastics: tai- loring the production of waste from a manufacturing process so that the
waste can be fed direcrly back into that process or into a related one. Other manufacturers are designing packaging to incorporate recycled ma- tenals wherever possible or are find- ing ~movative uses for materials that were formerly considered wastes.
T hree examples delineate some of the issues involved in devel- oping self-sustaining industri-
al process systems, the conversion of petroleum denvatikes to plastics, the conversion of iron ore to steel, and the refining and use of platinurn-group metals as catalysts. We have picked these examples because each repre- sents a different stage in the evolu- tion of a closed cycle. Examining their workings and shortcomings should pro\ide insight into how subsystems can be improved so as to develop an industrial ecosystem.
The iron cycle. in which recycling is well established, is a very mature process with a h~story dating back thousands of years, even though ex- tensive production of steel did not begin until the 19th century. The plas- tics cycle, in which reuse is just be- ginning to make its mark. is less than 100 yearsold; the first completely syn- thetic plastic, Bakelite, was introduced shortly after the turn of the century. The platinum-group-metals cycle-in which reuse is common because of the high cost of the materials involved-is even younger: industrial noble-metal
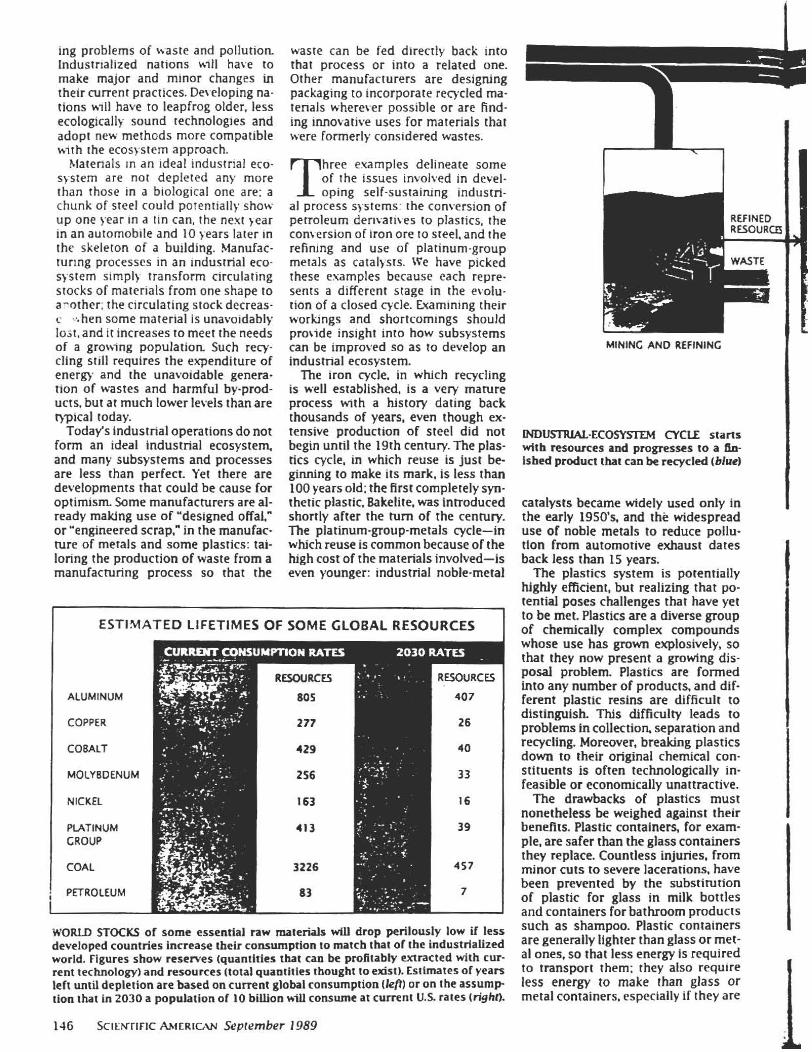
EST
ALLlMlNUM
COPPER
COBALT
'[MATED LIFETIMES OF SOME GLOBAL RESOURCES
W O W STOCKS of some essential taw materials wfll drop perilousty low if less deveIoped countties increase their consumption to match that of the industrialized world. Figures show reserves (quantities that can be profirably exrracted with cur- rent technology) and resources (total quantities thought toexist). Estimates of yearr left until depletion are based on current global consumption (/en) or on the assump tion that in 2030 a population of 10 billion w i l l consume at current U.S. rates (righr).
MINING AND REFINING
~ ~ - E C O ~ CYCE stans with resources and progresses to a h- lshed product that can be recycled (blue)
catatysts became widely used only in the early 1950's, and the widespread use of noble metals to reduce pollu- tion from automotive exhaust dates back less than 15 years.
The plasrics system is potentialIy highly efficient, bur realizing that po- tential poses challenges that have yet to be met. Plastics are a diverse group of chemically complex compounds whose use has grown explosively, so that they now present a growing dis- posal problem. Plastics are formed into any number of products. and dif- ferent plastic resins are difficult to distinguish This difficulty leads to problems in collection, separation and recycling. Moreover, breaking plastics down to their original chemical con- stituents is often technologically in- feasible or econormcally unattractive.
The drawbacks of plastics must nonetheless be weighed against their benefits. Plasttc containers, for exam- ple, are safer than the glass containers they replace. Countless injuries. from minor cuts to severe lacerations, have been prevented by the substitut~on of plastic for glass in milk bottles and containers for bathroom products such a s shampoo. Plastic containers are generally lighter than glass or met- al ones, so that less energy is required to transport them; they also require less energy to make than glass o r metal containers. especially if they are
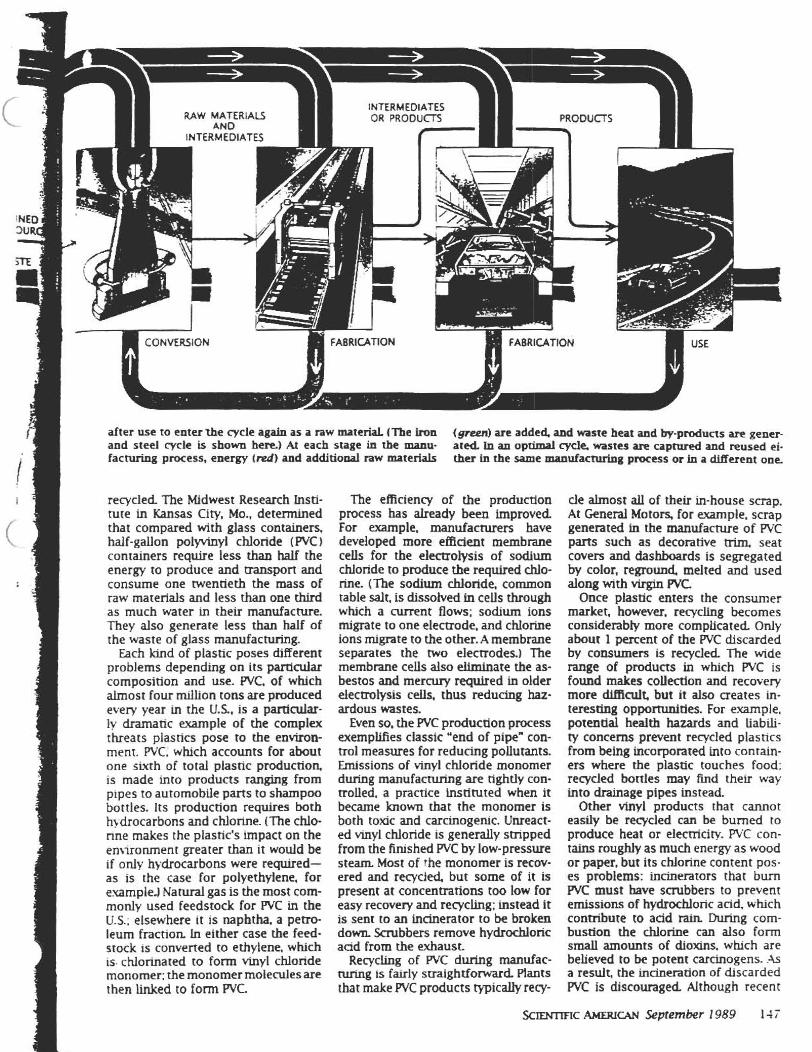
after use to enter a e cycle again as a raw material (Tbe h n (green) are added. and waste heat and by-products are gencr- and steel ~ c l e is shown herel At each stage in tbe manu- ated in an op- c y d c wastes up caprnred and reused ei. facturhg process, energy (red) and additional raw mareriah ther in the same manulacruring process or In a merent one
recyded The Midwest Research Insti- tute in Kansas City, Mo., determined that compared with glass containers. half-gallon poiyvmyl chloride ( WC) containers require less than half the energy to produce and transport and consume one twendetb the mass of raw materials and less than one third as much water in their manufactwe. They also generate less than half of the waste of glass manufacturing.
Each land of plastic poses different problems depending on its pamcular composition and use. W C of whch almost four rmllion tons are produced every year in the US., is a partjcdar- lv dramatic example of the complex threats plastics pose to the environ- ment PVC, whch accounts for about one sixth of total plastic production. is made into products ranging from plpes to automobile parts to shampoo bottles. Its production requires both hydrocarbons and chlorine. (The chlo- nne makes the plastic's impact on the emironment greater than it would be if only hydrocarbons were required- a s is the case for polyethylene, for e.uarnpleJ N a n d gas is the mosr com- monly used feedstock for WC in the U.S.; elsewhere it is naphtha, a petro- leum fraction In either case the feed- stock is converted to ethylene. which is. chlorinated to form vinyl chloride monomer; the monomer moieculesare then M e d to fonn WC.
The efficiency of the production process has already been improved For example. manulacrurers have dwelo ped more eiRcient membrane cells for the eiectrolysis of sodium chloride to produce the required do- rine (The sodium chloride. common table salt, is dissolved in cells rhrough which a current flows; sodium ions migrate to one electrode. and chlonne ions migrate to the 0ther.A membrane separates the two electrodes.) The membrane cells also elirmnate the as- bestos and m e w requred in older elecwlysis cells, thus reducing haz- ardous wastes.
Even so. the WC production process exemplifies classic "end of pipe" con- trol measures for reducing poIlutants. Emissions of vinyl chloride monomer during manufacturing are tightly con- trolled. a practice instituted when it became known that the monomer is both toac and carcinogenic. Unreacr- ed vinyl chloride is generally snipped from the finished WC by low-pressure steam Most of the monomer is recov- ered and recycled, but some of it is present at concentrations too low for easy recovery and recycling; instead it is sent to an incinerator to be broken dawn. Srrubbers remove hydrochloric acid from the exhaust.
Recycliug of W C during rnanufac- m g is fairly straightforward. Plants that make WC products typically recy-
de almost all of their in-house scrap. At General Motors, for example, scrap generated in the manufacture of PVC parts such as decorative trim. seat covers and d a s b d s is segregated by color, reground, melted and used along with virm WC Once plastic enters the consumer
market. however, recycling becomes considerably more complicated. Only about 1 percent of the PVC dscarded by consumers is recycled The wide range of products in which WC is found makes coUeetfon and recovery more diacult, but it also creates in- teresting opportunities. For example, potential health hazards and Liabdi- ty concerns prevent recycled plastics from being incorporated into contain- ers where the plastic touches food: recyded bottles may find their way into drainage pipes instead Other vinyl products that cannot
eas~ly be recycled can be burned to produce heat or dectriciw. PVC con- tains roughly as much energy as wood or paper, but its chlorine content pos- es problems: incinerators that burn WC must have saubbers to prevent emissions of hydrochloric acid. which contribute to add rain. Dunng com- bustion the chlorine can also form small amounts of dioxins. whkh are believed to Ix potent carcinogens. .4s a result, the incineration of djscarded WC is discouraged Although recent
S c m c AMER~C~W September 1989 1 4 i
tests by the New York State Energ) Research and Development Authority have shown that properly designed and operated incinerators do not emit significant quantities of hydrochloric acid or dioxins, environmentalists and regulators are not convinced that in- cmerators would achleve such low emission levels in practice.
Because of its chlorine content. WC is a worst-case example of the prob- lems plastics pose. Other polymers such as polypropylene and polyethyl- ene present fewer en~lronmental haz- ards. They have physical properties similar to those of WC, but they con- tain no chlorine. Polyeth\,lene tere- phthalate (PET), the matenal used in carbonated beverage bottles, is r e v - cled in nine states that have mandato- ry deposit laws: California. Connecti- cut, Delaware, Maine, Massachusetts, mchgan, New York, Oregon and Ver- mont. Bottles collected in these states account for 150 million of the 750 million pounds of PET resin produced every year. Recyclers pay from SlOO to %I40 per ton of PET, making it the second most valuable component of municipal solid waste after alumi- num. The PIX is reconstituted into resins for injection molding to pro- duce products ranging from automo- bile parts to electronic devices or is
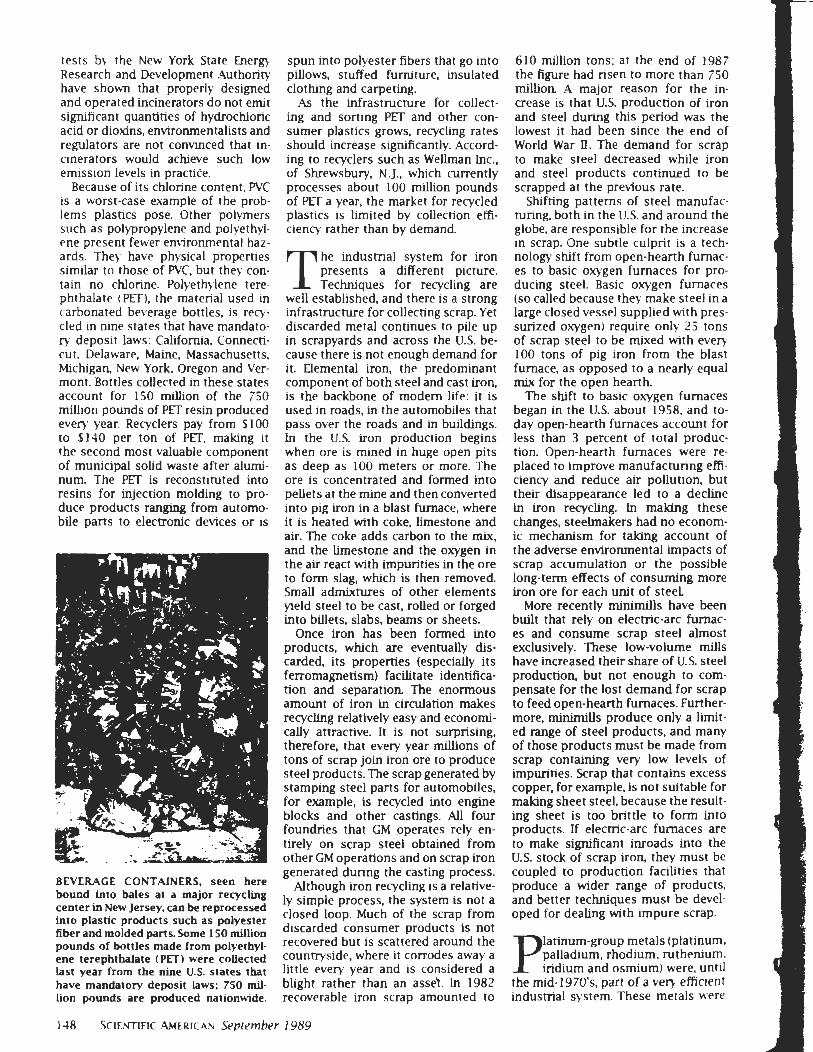
BEVERAGE CONTAINERS, seen here bound into bales at a major recycling center in New Jersey. can be reprocessed into plastic products such as polyester fiber and molded parts. Some 150 million pounds of bottles made from polyethyl- ene terephthalate (PIT) were collected last year from the nine U.S. states that have mandatory deposit laws; 750 mil- lion pounds are produced nationwide.
spun into polyester fibers that go into pillows, stuffed furniture, insulated clothng and carpeting.
As the infrastructure for collect- ing and somng PET and other con- sumer plastics grows, recycling rates should increase significantly. Accord- ing to recyclers such as Wellman Inc., of Shrewsbury, N. J., whlch currently processes about 100 million pounds of PIX a year, the market for recycled plastics is limited by collection el%- ciency rather than by demand.
T he indusmal system for iron presents a different picture. Techmques for recycling are
well established, and there is a strong infrastructure for collecting scrap. Yet discarded metal continues to pile up in scrapyards and across the US. be- cause there is not enough demand for it. Elemental iron, the predominant component of both steel and cast iron, is the backbone of modem life: it is used in roads, in the automobiles that pass over the roads and in buildings. In the U.S. iron production begins when ore is mined in huge open pits as deep as 100 meters or more. The ore is concentrated and formed into pellets at the mine and then converted into pig iron in a blast furnace, where it is heated with coke, lunestone and air. The coke adds carbon to the mix, and the Limestone and the oxygen in the air react with impurities in the ore to form slag, which is then removed. Small admumrres of other elements yield steel to be cast, rolled or forged into billets, slabs, beams or sheets.
Once iron has been formed into products, which are eventually dis- carded, its properties (especially its ferromagnetism) facilitate identifica- tion and separation The enormous amount of iron in circulation makes recycling relatively easy and economi- cally attractive. It is not surprising, therefore, that every year millions of tons of scrap join iron ore to produce steel products. The scrap generated by stamping steel parts for automobiles. for example, is recycled into engine blocks and other castings. All four foundries that GM operates rely en- tirely on scrap steel obtained from other GM operations and on scrap iron generated during the casting process.
Although iron recycling is a relative- ly simple process, the system is not a closed loop. Much of the scrap from discarded consumer products is not recovered but is scattered around the countryside. where it corrodes away a little every year and is considered a blight rather than an asse't. In 1982 recoverable iron scrap amounted to
610 million tons: at the end of 1987 the figure had risen to more than 750 million A major reason for the in- crease is that U.S. production of iron and steel during this period was the lowest it had been since the end of World War n. The demand for scrap to make steel decreased while iron and steel products continued to be scrapped at the previous rate.
Shifting patterns of steel manufac- turing, both in the U.S. and around the globe, are responsible for the increase in scrap. One subtle culprit is a tech- nology shift from open-hearth furnac- es to basic owgen furnaces for pro- ducing steel. Basic oxygen furnaces (SO called because they make steel in a large closed vessel supplied with pres- surized oxygen) require only 23 tons of scrap steel to be mixed with every 100 tons of pig iron from the blast furnace, as opposed to a nearly equal mix for the open hearth.
The s h f t to basic oxygen furnaces began in the U.S. about 1958. and to- day open-hearth furnaces account for less than 3 percent of total produc- tion. Open-hearth fumaces were re- placed to improve manufacturing effi- ciency and reduce air pollut~on, but their disappearance led to a d e c h e in iron recycling. In making these changes, steelmakers had no econom- ic mechanism for talang account of the adverse environmental impacts of scrap accumulation or the possible long-term effects of consuming more iron ore for each unit of steel
More recently minunills have been built that rely on electric-arc furnac- es and consume scrap steel almost exclusively. These low-volume mills have increased their share of U.S. steel production, but not enough to com- pensate for the lost demand for scrap to feed open-hearth furnaces. Further- more, minimills produce only a limit- ed range of steel products, and many of those products must be made from scrap containing very low levels of impurities. Scrap that contains excess copper, for example. is not suitable for makmg sheet steel, because the result- ing sheet is too brittle to form into products. ff electric-arc fumaces are to make significant inroads into the U.S. stock of scrap iron, they must be coupled to production facilities that produce a wider range of products, and better techniques must be devel- oped for dealing with impure scrap.
P latinum-group metals (platinum. palladium, rhodium, ruthenium, iridium and osmium) were, untll
the mid. 19701s, part of a ver) efficient industrial system. These metals were
1 4 3 S C I E N ~ F I C .WERIGW September 1989
once recycled with efficiencies of 85 percent or better, but the advent of catalytic converters for automobiles dealt t h s system a shock from whch recycling rates are only now begmning to recover.
Recycling of platinum-group metals is dictated not so much by the envi- ronmental effects of their disposal as by their limited supply and the diffi- culties of mining and refining them. Ores contain only about seven parts per million of mixed platinum-group metals. so that about 20 million met- ric tons a year must be refined to pro- duce 143 tons of purified metals-an amount that could fit into a cube roughly two meters on a side.
About 60 percent of the platinum- group metals mined is formed into metal products such as jeq . Iry, ingots for investors and chem; &reaction vessels; these products are eventually recycled with almost complete effi- ciency. The remainder is used to make chemicals and catalysts for chemical plants, petroleum refineries and auto- mobiles. Catalysts adsorb molecules on their surfaces and promote chemi- cal reactions that either join the mol- ecules together or break them into smaller ones. Catalytic conveners for automobiles, whlch reduce exhaust emissions of hydrocarbons. carbon monoxide and oxides of nitrogen, are the most rapidly growing use of plati- num-group metals; consumption rose from about 11.5 metric tons in 1975 to about 40 in 1988. Automobiles cur- rently account for most of the yearly permanent consumption of platinum- group metals.
Platinum-group metals in industri- al applications are recycled quite el%- ciently. Each plant uses large amounts of catalyst. so that the payoffs from recycling are clear. Used catalysts are generally recycled every few months, providing a large, continuing stream of materials for reclaimers to proc- ess. In chemical and pharmaceutical plants, for example, catalysts are typi- cally recycled in less than a year, and about 85 percent of the platinum- group metals in them are recovered Some petroleum refineries are even more successful, recovering up to 97 percent of their noble metals.
The automotive pattern of noble- metal use stands in sharp contrast to that of the process industries: there are tens of millions of catalytic conven- ers, each of whlch contains only a few grams of platinum-group metals (less than two grams of platinum, for exam- ple), and the lifespan of about 10 years for an average car makes for a much slower turnover of recyclable materi-
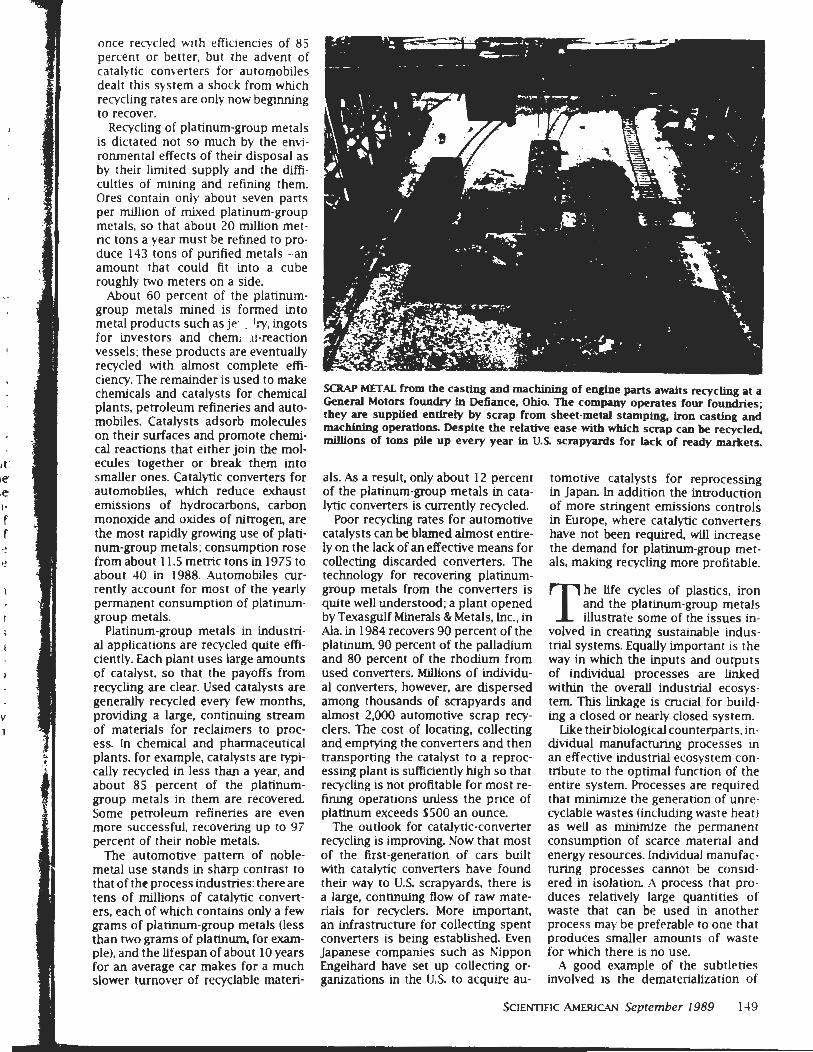
W m A L from the casting and machining of engine parts awaits recycling at a General Motors foundry in Defiance, Ohio. The company operates four foundries: they are supplied entlrely by scrap from sheetmetal stamping, h n casting and machining operadons Desplte the relative ease with which scrap can be recycled. millions of tons pile up every year in U.S scrapyards for lack of ready markets.
als. As a result. only about 12 percent of the platinum-group metals in cata- lytic conveners is currently recycled.
Poor recycling rates for automotive catalysts can be blamed almost entire- ly on the lack of an effective means for collecting discarded converters. The technology for recovering platinurn- group metals from the converters is quite well understood; a plant opened by Texasgulf Minerals &Metals, hc., in Ala. in 1984 recovers 90 percent of the platinum 90 percent of the palladium and 80 percent of the rhodium from used conveners. Millions of individu- al converters. however, are dispersed among thousands of scrapyards and almost 2,000 automotive scrap recy- clers. The cost of locating, collecting and emptying the converters and then transporting the catalyst to a reproc- essing plant is sufficiently high so that recycling IS not profitable for most re- fining operations unless the price of platinum exceeds S500 an ounce.
The outlook for catalytic-converter recycling is improving. Now that most of the first-generation of cars built with catalync converters have found their way to U.S. scrapyards. there is a large, continuing flow of raw mate- rials for recyclers. More important. an ~nfrastrucrure for collecting spent converters is being established. Even Japanese companies such as Nippon Engelhard have set up collecting or- ganizations in the U.S. to acquire au-
tomotive catalysts for reprocessing in Japan In addition the introduction of more stringent emissions controls in Europe, where catalync converters have not been required, will increase the demand for platinum-group met- als, malang recycling more profitable.
T he life cycles of plastics, iron and the platinum-group metals illustrate some of the issues in-
volved in creating sustainable indus- trial systems. Equally important is the way in which the inputs and outputs of individual processes are linked within the overall industrial ecosys- tem This linkage is crucial for b u d - ing a closed or nearly closed system.
Wte their biolog~cal counterparts. In- dividual manufacturing processes UI an effective industrial ecosystem con- tribute to the optimal function of the entire system. Processes are required that minimize the genera tion of unre- cyclable wastes (including waste heat) as well as minimize the permanent consumption of scarce material and energy resources. Lndlvidual manufac- turing processes cannot be consid- ered in isolation A process that pro- duces relatively large quantities of waste that can be used in another process may be preferable to one that produces smaller amounts of waste for whlch there is no use.
A good example of the subtleties involved is the dematerialization of
SCIENTIFIC AMWCAN September 1989 149
manufactured goods-the use of plas- t~cs , composites and high-strength al- loys to reduce the mass of products. The trend toward dematerialization has d r a w increasing attention in re- cent years. The mass of a typical auto- mobile, for example, has decreased by more than 400 kilograms since 1975; about 100 hlograms of the decrease are due to the subst~tution of alumi- num and plastics for steel. Lghter cars burn less gasoline. Steel, however, is easy to reel cle, whereas the composite plastics that have replaced it reslst reuse. The net result may be an imme- diate drop in fuel consumption but an 01 erall increase in the amount of per- manent ivaste created and m the re- sources consumed.
w aste-minimization acthities in U.S. industries have been aided by regulations devel-
oped in the late 1970's to control hazardous-waste disposal. The reg- ulations, reflecting long-term emiron- mental costs, have increased the cost of landfill disposal from less than 520 a ton to 5300 a ton or more, mak- ing alternatnes to disposal profitable.
Many companies find it profitable to sell their wastes as raw materials. For example. Meridian National in Oho, a midwestern steel-processing compa- ny, reprocesses the sulfuric acid with which it removes scale from steel sheets and slabs, reuses the acid and sells ferrous sulfate compounds to magnetic-tape manufacturers.
If the production of wecyclable wastes is to be eliminated, similar steps must be taken for each of the low-level by-products in large streams of process effluents. .2lthough emis- SI ns at each stage of such manu- facturing processes ma) be relati\,ely small, taken together they can cause serious pollution problems. Minimiz- ing each of these m ~ n a d smaller emis- sions one at a time is a complex and potentiall), costly challenge.
The challenge can be met in part by implementing a multitude of rela- tively small changes. Some chemical plants and oil refineries, for example. have significantly reduced their haz- ardous-waste output by simpl)' chang- ing their procedures for buying and storing cleaning solutions and other low-volume chemicals. By doing so,
they have been able to eliminate the need to dispose of leftover amounts.
At ARCO's 1.0s .4ngeles refinery com- plex, a series of relativelv low-cost changes have reduced waste volumes from about 12,000 rons a year during the early 1980's to about 3.400 today. generahng revenue and saving rough- ly $ 2 million a year in disposal costs. The company sells its spent alumina catalysts to Allied Chemical and its spent silica catalysts to cement mak- ers. Pre\iously these malerials were classified as hazardous wastes and had to be disposed of in landfills at a cost of perhaps 5300 a ton.
Akaline carbonate sludge from a water-softenmg operation at the refin- e~ goes to a sulfuric acid manufacrur- e r a few miles ac\a\,, where ~t neurraliz- es acidic wastewater. (The acid man- ufacturer previously purchased pure sodium hydroxide for the same pur- pose.) A few outflow pipes have been rerouted to improve access for load- ing, and plant personnel must track the pH of their sludge, but the total investment has been minimal.
The .%CO refinery has also started to reco\,er oil from internal spills and
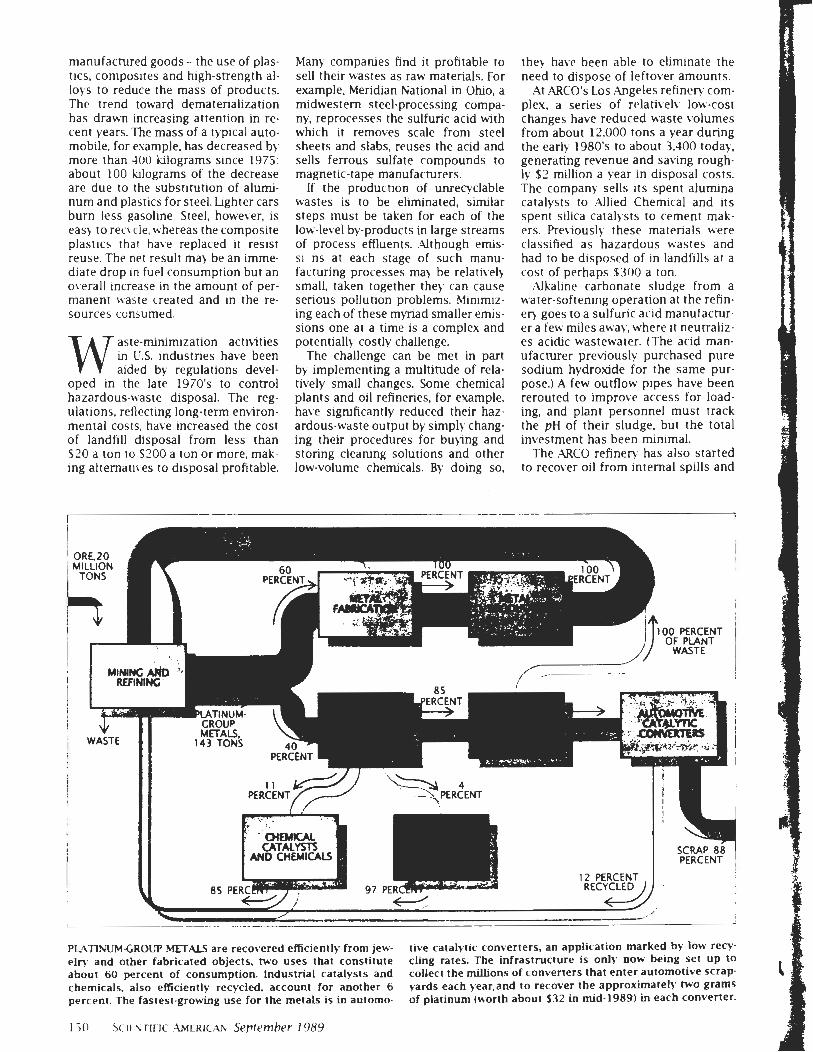
PLL\TlNUMCROUP MFTrllS are recovered efficiently from jew- rive cataly-tic converters, an application marked by low recy elr). and other fabricated objects. two uses that constitute cling rates. The infrastructure is only now being set up to about 60 percent of consumption Industrial catalysts and collect the millions of conveners that enter automotive scrap chemicals. also efficiently recycled. account for another 6 yards each year,and to recover the approximatel), two grams percent. The fastest-growing use for the metals is in automo- of platinum (worth about $32 in mid-1989) in each convener.
other t%asres In a new 9 1 -m~tlion re- ccllng facd~n. hhen the ren-cler 1s fully operat~onal nest vear. ~t IS ewect- ed ro reduce s astes b\- another 2.000 tons. Off-srte rrcarmenr or landfilling w1I st111 be needed for misce!laneous wastes such as solvents. spray cans and the wreral hundred tons of as- bestos ~nsulanon bemg removed from the plant each vear.
.UCO's sltuatlon is not unique: other major refiners and chem~cal manul'acmrers are engaged In srrm- lar efforts. For example, invesrments of 5300,000 in process changes and recoven equipment at Ciba-Ge~gy's Toms River plant in New Jersey re- duced hsposal cosrs by mote than 5 1.8 million between 1985 and 1988. Dow Chemical esrablished a separate unit to recover evcess hydrochloric acid. which it then either r eqdes to acid-using processes or sells on the open market. The operation recovers a million tons of acid a year at a profit of 520 milIion
B y-products and effluents created during manufacturing represent only the supply side of the in-
dustrial ecosystem The demand side is the consumer, who takes in manu- factured goods and produces scrap that could be the raw materials for the next cycle of production. If the indus- trial-ecosystem approach is to become widespread. changes in manufacrur- ing must be matched by changes in consumers' demand panerns and in the rreatment of materials once they have been purchased and used
The behavior of consumers in the U.S. today consritutes an aberration in both m e and space Whereas a typical New Yorker. for example. discards nearly two kilograms of solid waste every day, a resident of Hamburg or Rome throws out only about half that-as New Yorken did at the turn of the century- Moreover, U.S consu- mer habits and baste-management practices form a complex pattern that hmders efforts to reduce haste gen- erarion and the growing pressure on municipal landfills. The vast bulk of consumer wastes consists of organic marenals and plastics that could rela- tively easf y be composred. recycled or burned to produce energy but instead are stored in Iandfills, for which land was readlly amlable in the past and where costs were low.
Today, as tandfills across the U.S. near capacity. many communities have initiated garbage-sorting pro- grams to reduce the amount of unre- cycled waste: more initiatives are like- ly to follow, Some other counmes
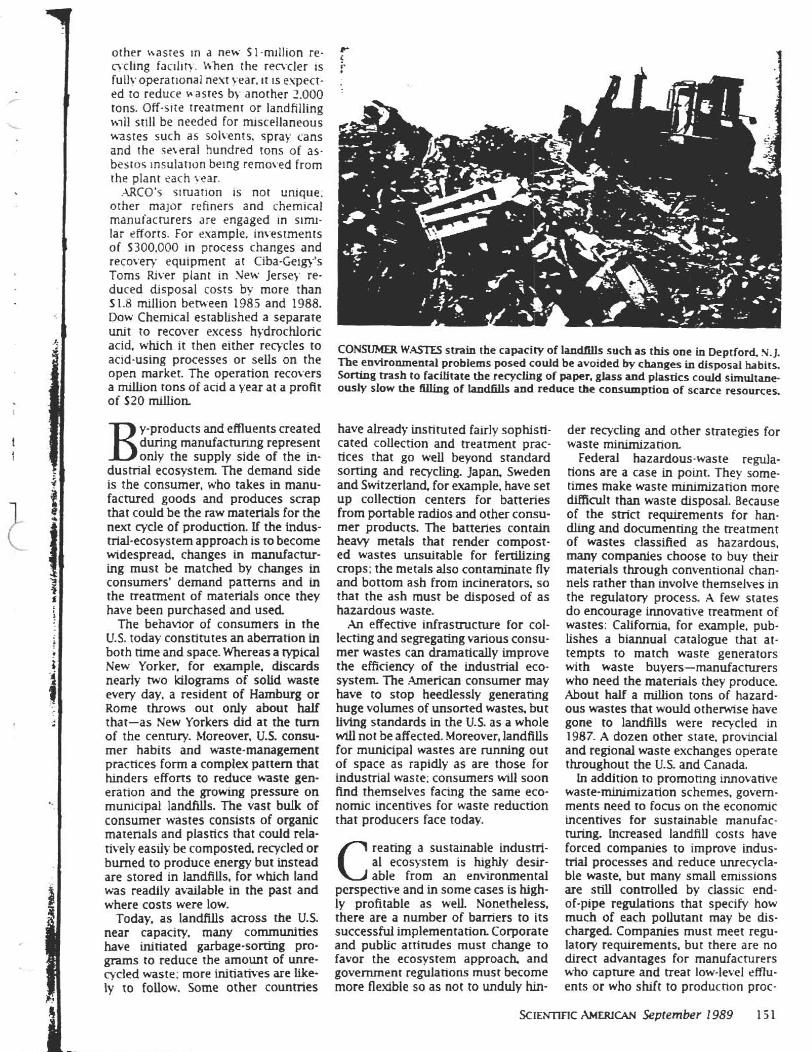
CONSUMER WASES strain the capacity of hndblls such as this one La Deptford 3. j. The environmental problems posed codd be avoided by changes in disposal habits. Sorting trash to facilitate the recycling of paper, glass and plasrics could simultane- ously slow the W g of landfills and reduce thc consumption of scarce resources.
have already instituted fairly sophisti- cated collection and neatment prac- tices that go weU beyond standard sorring and recycling. Japan Sweden and Switzerland. for example, have set up collection centers for batteries from ponable radios and other consu- mer products. The barteries contain heavy metals that render composr- ed wastes unsuitable for fertilizing crops: the metals also contaminate fly and bottom ash from incinerators, so that the ash must be disposed of as hazardous waste. .4n effective Lnfrasmcnrre for col-
lecting and segregating various consu- mer wastes can dramancally improve the efficiency of the industrial eco- system The .4merican consumer may have to stop heedlessly generating huge volumes of unsorted wastes, but living standards in the U.S. as a whole wdl not be affected. Moreover, landfills for municipal wastes are nrnning out of space as rapidly as are those for industrial waste; consumers MI soon find rhemselves facing the same eco- nomic incentives for waste reduction that producers face roday.
C reating a sustainable indusrri- a1 ecosystem is highly desir- able from an en~ironmental
perspecnt-e and in some cases is high- ly profitable as weU. Nonetheless. there are a n u m k r of bamers to its successful implementation Corporate and public attitudes must change to favor the ecosystem approach and government regulations must become more fleable so as not to unduly hin-
der recycling and other strategies for waste minimization
Federal hazardous- waste regula- tions are a case in point. The): some- times make waste minimization more drfficult than waste disposal. Because of the stria requvements for han- d h g and documenting the rreatment of wastes classified as hazardous, many companies choose to buy their materials through conventional chan- nels rather than involve themselves in the regulatory process. A few states do encourage innovative m a m e n t of wastes: California. for example. pub- lishes a biannual catalogue that at- tempts to match waste generators with waste buyers-manufacnuers who need the materials they produce. About half a million tons of hazard- ous wastes that would otherwise have gone to landfills were recycled in 1987. A dozen other stare. provincial and regional wasre exchanges operate throughout the U.S. and Canada.
In addition to promoting innovative waste-rninrmization schemes, govern- ments need to focus on the economic incentives for sustainable manufac- turing. Increased landfill costs have forced companies to improve indus- trial processes and reduce unrecycla- ble wasre, but many small emissions are still controlled by ckssic end- of-pipe reguiarions that specify how much of each poUutant may be dis- charged. Companies must meet regu- latory requirements. but there are no direct advantages for manufacrurers who capture and meat low-level emu- ents or who shift to producnon proc-
SCIENTIFIC AMERICAN September 1989 1 5 1
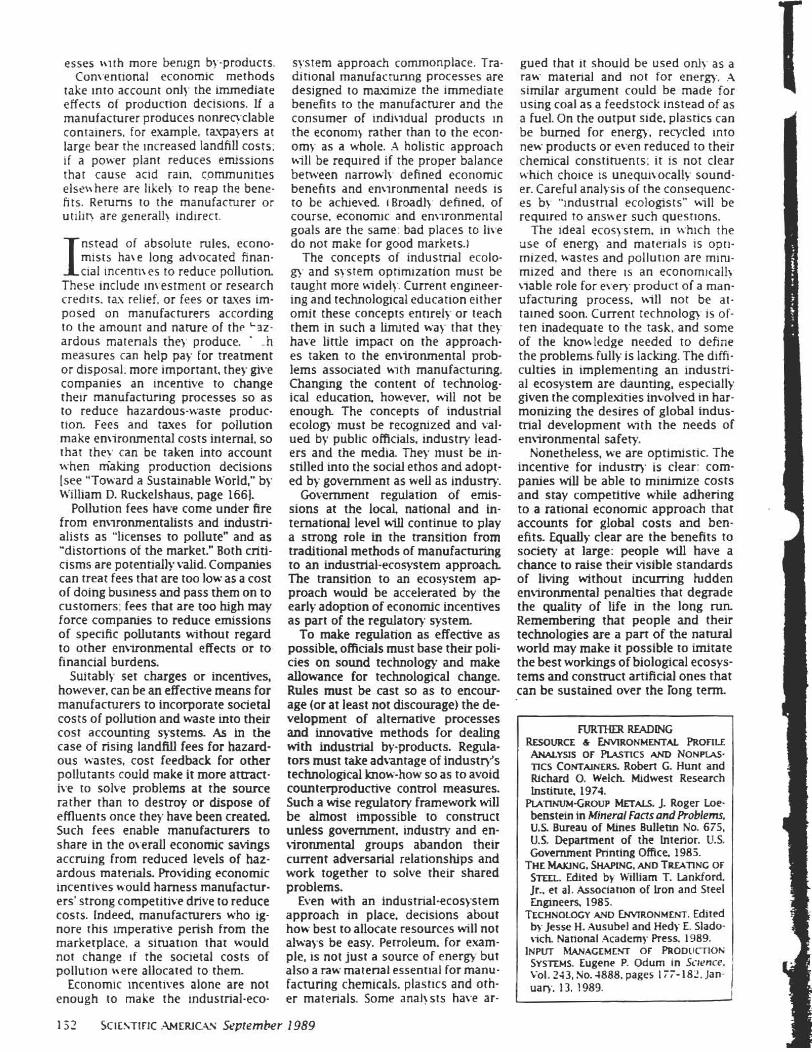
esses r c ~ th more bemgn by-products. Conrmt~onal economlc methods
rake Inro account onl) the ~mmediate effects of producnon decis~ons. If a manufacturer produces nonremclable contamers, tor example, taxpayers at large bear the rncreased landfill costs. i f a power plant reduces ermsslons t ha r cause and ram. cpmmunlries elsen here are I~kelj to reap the bene- fits. Rerurns to the manufacmrer or utilrn are generalh ~ndirect.
I nstead of absolute rules. econo- mists hate long ad!-ocated finan- cial mcentnes to reduce pollution.
These include Inwstment or research credits. t a ~ relief, or fees or tmes im- posed on manufacturers according to the amount and narure of r h ~ L3z-
ardous marenals they produce. ' -h measures can help pay lor treatment or disposal. more important. they give companies an incennve to change thew manufacrunng processes so as to reduce hazardous-waste produc- tion Fees and taxes for pollution make eniironmental costs internal. so that thev can be taken into account when riaking production decisions [see "Toward a Sustainable World," by Wlliam D. Ruckelshaus. page 1661.
Pollution fees have come under fire from env~ronmentalists and indusrri- alists as "licenses to pollute" and as "distonions of the market." Both criti- cisms are potentially valid. Companies can treat fees that are too lowas a cost of doing busmess and pass them on to customers: fees that are too hlgh may force companies to reduce emissions of speclfic pollutants without regard to other enwonmental effects or to finanaal burdens.
Suitably set charges or incentives, however, can be an effective means for manufacturers to incorporate societal costs of pollution and waste mto their cost accounnng systems. k in the case of rising landfill fees for hazard- ous wastes, cost feedback for other pollurants could make it more attract- ive to solve problems at the source rather than to destroy or dispose of effluents once they have been created. Such fees enable manufacturers to share in the o\.erall economic savings accruing from reduced levels of haz- ardous materials. Pro\~ding economic incentives would harness manufactur- ers' strong competitive drive to reduce costs. Indeed. manufacrurers who rg- nore this imperative perish from the marketplace, a simatron that would nor change rf the socretal costs of pollutron \\ere allocared to them.
Economic mcentives alone are not enough ro make the ~ndustrial-eco-
system approach commonplace. Tra- ditional rnanufacrunng processes are designed to madmize the rmmediate benefits to the manufacturer and the consumer of indn~dual products in the econom) rather than to the econ- omy as a whole. .A holisric approach will be required if the proper balance behveen narrowly defined economic benehts and en~lronmcntal needs 1s to be achleved I Broadlj. defined, of course. economic and ent~ronmental goals are the same: bad places to live do not make for good markets.)
The concepts of indusrnal ecolo- gy and ?+?stern opt~m~zation must be [aught more uidel)'. Current engineer- ing and rechnological education either omit these conceprs enrlrely or teach them in such a h t e d wa)- thar they have little impact on the approach- es taken to the emironmental p rob lems associated ~ i t h rnanufactunng Changmg the content of technolog- ical education, however. will nor be enough The conceprs of industrial ecolom must be recognized and val- ued by public officials. i ndusm lead- ers and the medla. They must be in- srilled into the social ethos and adopt- ed by government as weU as industry.
C o v e m e n t regulation of ernis- sions at the local, national and in- ternational level WIU continue to play a strong role in the transition from uadnional methods of manufacturing to an indusnial-ecosystem approach The transition to an ecosystem ap- proach would be accelerated by the early adoption of economic incentives as part of the regulatov system
To make regulation as effective as possible. officials must base their poli- cies on sound technology and make allowance for technologjcal change. Rules must be cast so as to encour- age (or at least not discourage) the de- velopment of alternative processes and innovative methods for dealing with industrial by-products. Regula- tors must take advanrage of industry" technological how-how so as to avoid counterproductive control measures. Such a wise regulatory framework will be almost impossible ro consmct unless government. industry and en- \ironmental groups abandon their current adversarial relationshtps and work rogether to solve their shared problems.
Even with an industrial-ecosystem approach in place. decisions about how best to allocate resources will not always be easy. Penoleurn. for exam- ple. 1s not just a source of ene rn but also a raw marenal essent~al for manu- facturing chemicals, plastlcs and oth- er materials. Some analists have ar-
gued that it should be used od \ - as a raw material and not for energ), .4 similar argument could be made for using coal as a feedstock mstead of as a fuel. On the output slde. plastics can be burned for energ), recycled Into new products or even reduced to their chemical constiruenrs: i t is not clear whch choice is unequhocally sound- er. Careful analys~s of the consequenc- es bv "lndusrnal ecologists" will be required to anmer such questtons.
The Ideal ems)-stem, in w'hich the use of energ) and materials IS opt]- mired. wastes and pollut~on are rniru- mired and there IS an econom~call?~ able role for ever)- product of a man- ufacturing process. \%ill not be at- tamed soon. Current technolog! is of- ten inadequate to the task. and some of the knohledge needed to define the problems fully is laclung. The drffi- culties in ~mplementing an industri- al ecosystem are daunting, especially given the complexities i n d v e d in har- monizing the desires of global indus- trial development w t h the needs of en\uonmental safety.
Nonetheless, we are optimistic. The incentive for indusrr)' is clear: com- panies will be able to minimize costs and stay competitive while adhering to a rational economic approach that accounts for global costs and ben- efits. Equally clear are the benefits to society at large: people hill have a chance to raise their visible standards of Iiving without incumng hrdden environmental penalties that degrade the quality of life in the long run Remembering that people and their technologies are a p a n of the natural world may make it possible to imitate the best w o r h g s oibiological ecosys- tems and construa artificial ones that can be sustained over the rong term.
F V R m READING WmcE m R o H M w a RDnu ANALYSIS OF PLASTICS AND NONPLG- ncs COKTAINWS Roben G. Hunt and Ricfiard 0. Welch Midwest Research Institute. 1974.
PLATINUMGROUP METALS. J. Roger Loe- benstein in Mineral Facts and ProbIems. U.S. Bureau of Mines Bullenn No. 675, U.S. Depamnent of the Interior. Lr.5. Gwenunenr Printing Office. 1985.
THC MAKING. SHAPING. AND Twnlvc OF STEEL. Ehted by T. bnkford. Jr.. et al. .~ssclciatlon of lron and Steel Engineers. 1985.
TECHNOLQCY AND WRONMEN~. Edited bv Jesse H. ..\usuhl and Hedy E. Slado- r ich Nanonal .Academy Press. 1989.
INPUT ~WACEMEKT OF PRo~~lrnOlr; SYSTEMS. Eugene P. Odum In h-rrnce. Vol. 1 4 3 , No. 4888. paEes I;;-lK!. Jan- uar): 13. 1989.
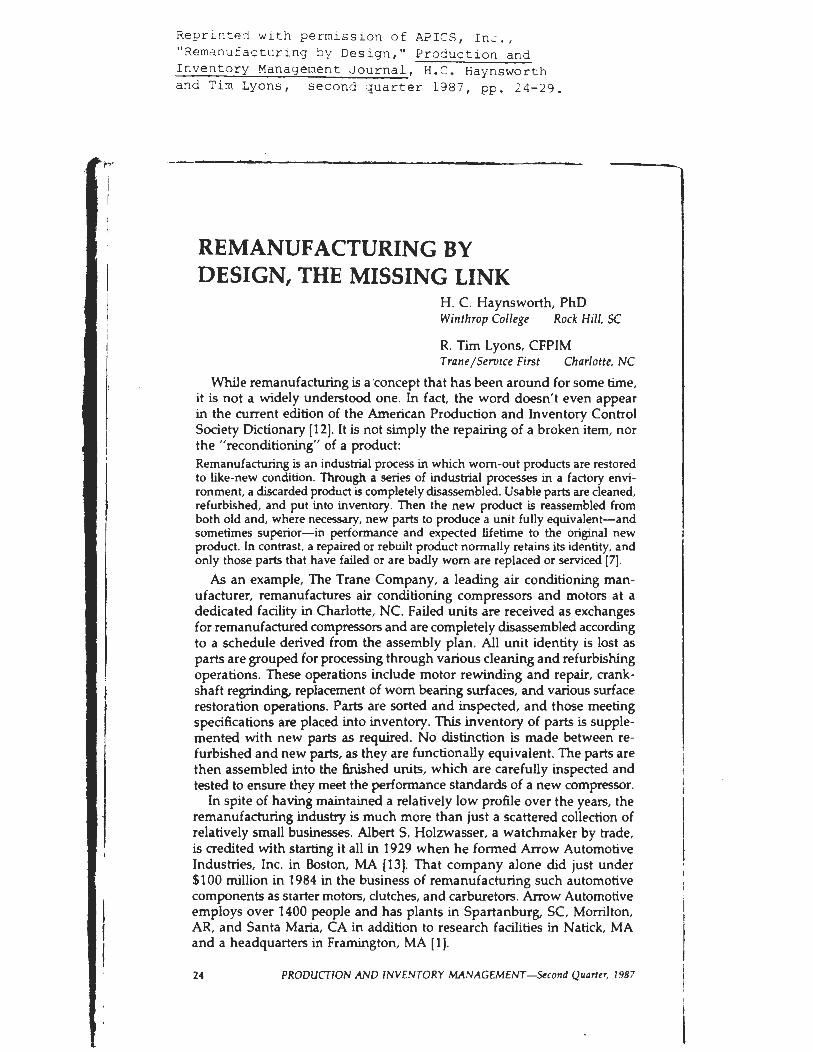
R e p r ~ n t e d w i t h p e r m i s s i o n of APICS, I n < . , " R e m a n u f a c t u r i n g by D e s i g n , " P r o d u c t i o n a n d I n v e n t o r y Management J o u r n a l , H.C. t i aynswor th a n d Tin Lyons , s e c o n d q u a r t e r 1987, pp. 24-29.
REMANUFACTURING BY DESIGN, THE MISSING LINK
H. C. Haynsworth, PhD Winthrop College Rock Hill, SC
R. Tim Lyons, CFPIM Trane/Service First Charlotte, NC
While remanufacturing is atoncept that has been around for some time, it is not a widely understood one. In fact, the word doesn't even appear in the current edition of the American Production and Inventory Control Society Dictionary [12]. It is not simply the repairing of a broken item, nor the "reconditioning" of a product: Remanufacturing is an industrial process in which worn-out products are restored to like-new condition. Through a series of industrial processes in a factory envi- ronment, a discarded produa is completely disassembled. Usable parts are cleaned, refurbished, and put into inventory. Then the new produa is reassembled from both old and, where necessary, new parts to produce a unit fully equivalent-and sometimes superior-in performance and expected Lifetime to the original new product. In contrast, a repaired or rebuilt product normally retains its identity, and only those parts that have failed or are badly worn are replaced or serviced [7].
As an example, The Trane Company, a leading air conditioning man- ufacturer, remanufactures air conditioning compressors and motors at a dedicated facility in Charlotte, NC. Failed units are received as exchanges for remanufactured compressors and are completely disassembled according to a schedule derived from the assembly plan. All unit identity is lost as parts are grouped for processing through various cleaning and refurbishing operations. These operations include motor rewinding and repair, crank- shaft regrinding, replacement of worn bearing surfaces, and various surface restoration operations. Parts are sorted and inspected, and those meeting specifications are placed into inventory. This inventory of parts is supple- mented with new parts as required. No distinction is made between re- furbished and new parts, as they are functionally equivalent. The parts are then assembled into the finished units, which are carefully inspected and tested to ensure they meet the performance standards of a new compressor.
In spite of having maintained a relatively low profile over the years, the remanufacturing industry is much more than just a scattered collection of relatively small businesses. Albert S. Holzwasser, a watchmaker by trade, is credited with starting it all in 1929 when he formed Arrow Automotive Industries, Inc. in Boston, MA (13). That company alone did just under $100 million in 1984 in the business of remanufacturing such automotive components as starter motors, clutches, and carburetors. Arrow Automotive employs over 1400 people and has plants in Spartanburg, SC, Morrilton, AR, and Santa Maria, CA in addition to research facilities in Natick, MA and a headquarters in Framington, MA [I].
2 4 PRODUCTION AND INVENTORY MANAGEMENT-Second Quartcr, 1987
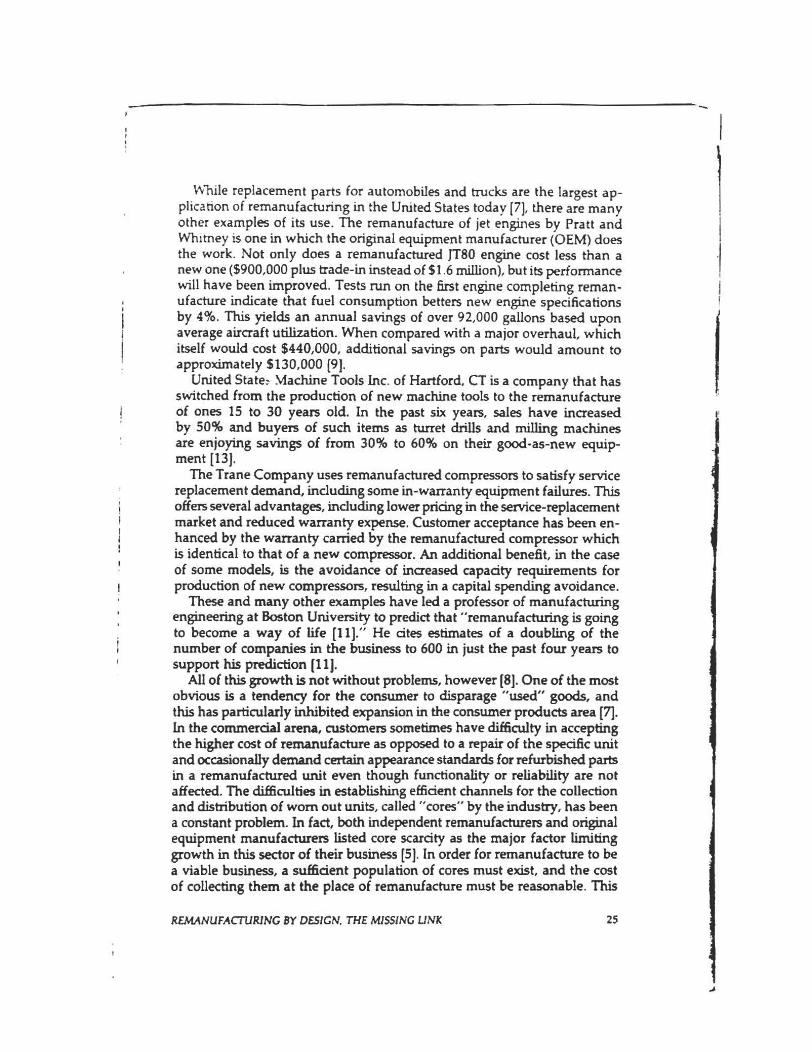
h l i l e replacement parts for automobiles and trucks are the largest ap- plication of remanufacturing in the United States today [7], there are many other examples of its use. The remanufacture of jet engines by Pratt and Whitney is one in which the orignal equipment manufachlrer (OEM) does the work. Not only does a remanufactured JT80 e n p e cost less than a new one ($900,000 plus trade-in instead of 51.6 million), but its performance will have been improved. Tests mn on the h t engine completing reman-
4 ufacture indicate that fuel consumption betters new engme speufications
i by 4%. This yields an annual savings of over 92,000 gallons based upon average aircraft utilization. When compared with a major overhaul, whch itself would cost $440,000, additional savings on pa* would amount to approximately 1130,000 1.1.
United State: Machine Tools hc. of Hartford. CT is a company that has switched from the production of new machine tools to the remanufacture
i of ones 15 to 30 years old. In the past six years, sales have increased by 50% and buyers of such items as turret drills and milling machines are enjoying savings of from 30% to 60% on their good-as-new equip- ment [13].
The Trane Company uses remanufactured compressors to satisfy service replacement demand, including some in-warranty equipment failures. Thrs offers several advantages, including lower pricing m the service-replacement
I market and reduced warranty expense. Customer acceptance has h en- I 1 hanced by the warranty carried by the remanufactured compressor which ! is identical to that of a new compressor. An additional benefit, in the case I of some models, is the avoidance of increased capacity requirements for I production of new compressors, resulting in a capital spending avoidance.
These and many other examples have led a professor of manufacturing I engineering at Boston University to predict that "remanufachdng is going ,
to become a way of life [I 11." He at- estimates of a doubling of the I number of companies in the business to 600 in just the past four years to I support his pmdction [Il l .
AII of this growth is not without problems, however (81. One of the most obvious is a tendency for the consumer to disparage "used" goods, and this has particularly inhibited expansion in the consumer products area [7j. In the commercial arena, customers sometimes have difficulty in accepting the higher cost of remanufacture as opposed to a repair of the s p e a k unit and occasionally demand cerhin appearance standards for refurbished parts in a remanufactured unit even though functionality or reliability are not affected. The difficulties in establishmg effiaent channels for the collection and distribution of worn out units, called "cores" by the industry, has been a constant problem. In fact, both independent remanufacturers and original equipment manufacturers listed core scarcity as the major factor limiting growth in this sector of their business [5]. In order for remanufacture to be a viable business, a &dent population of cores must exist, and the cost of collecting them at the place of remanufacture must be reasonabIe. This
REMANUFACTURING BY DESIGN. T H E MISSING UlVK 25

cost includes both transportation costs and the price required to induce the holders of the cores to sell them to the remanufacturer. Remanufacture of a relatively new product is usually difficult to establish b e c a w of the Iack of available cores. Since "the design of the original product can be a sig- nificant determinant of the products' 'remanufacntrability' [5]," a lack of effort on the part of OEM designers to faditate remanufacturing has not only been not helpful [8] to the industry, but has, at times, been intentionally obstructionist 1131. Even for established products, a remanufacturing pro- gram can be stopped by design changes to the product. This can result from extensive component redesigns, which can make "new" parts non- interchangeable with "old" parts and the "oId" parts no longer avdabte. It can also result f romsipikant improvement in the new unit failure rate, whch reduces the availability of cores.
There are a variety of reasons for OEMs to change their attitudes toward remanufacturing [6] . hi the k t place, i€ there is any si@cant price elas- ticity for the product in question, the sale of the lower priced remanufac- tured item can signrficantly expand the total market for the product and thereby expand the OEM's total market share. Secondly, by faditating remanufacture, the trade-in value of an inoperative unit is enhanced, which encourages customer loyalky and r epa t purchases. A third reason is that by establishing, or encouraging the establishment of, remanufacturing op- erations, another opportunity for the collection of produd failure data is created, which can lead to improved design for future new unit prduction.
There are sodeta1 benefits from extensive remanufacturing as well [6] . By reusing a large proportion of the parts that make up the p d u c t , there are savings in both energy use and raw material consumption. Reduced costs for durable goods makes for greater consumer choice and higher standards of living. Since remanufacturing is relatively labor intensive, employment opporhmities are created, especially for low and moderately skilled workers. Because many components from the original p r d u a be- come parts of the remanufactured one, the n e d for waste disposal or Ian& is teducd.
Once the "enlightened" OEM sees remanufacture, either in-house or in coordination with an independent remanufacturer, as something that he can use to his economic advantage, there are a number of things that he can do to fadtitate the process. Remanufactured items can be included as part of the total marketing effort. Cansumer attitudes towards his particular "used," but remanufactured, product can be turned from either bad or indifferent to positive by advertising their lower cost and by offering ' W e new" warranties. Sales of new products can be increased by offering higher trade-ins on older models of the product that, because of remanufacturing, now have greater value to the OEM.
The new product distribution system used by the OEM can be converted to a " bo-wa y street" for the collection and return of the cores needed to feed the remanufacturing system. The marginal cost of such a plan might
26 PRODUCTION AM3 INVENTORY MANAGEMENT-Stcond Quartrr. 1987
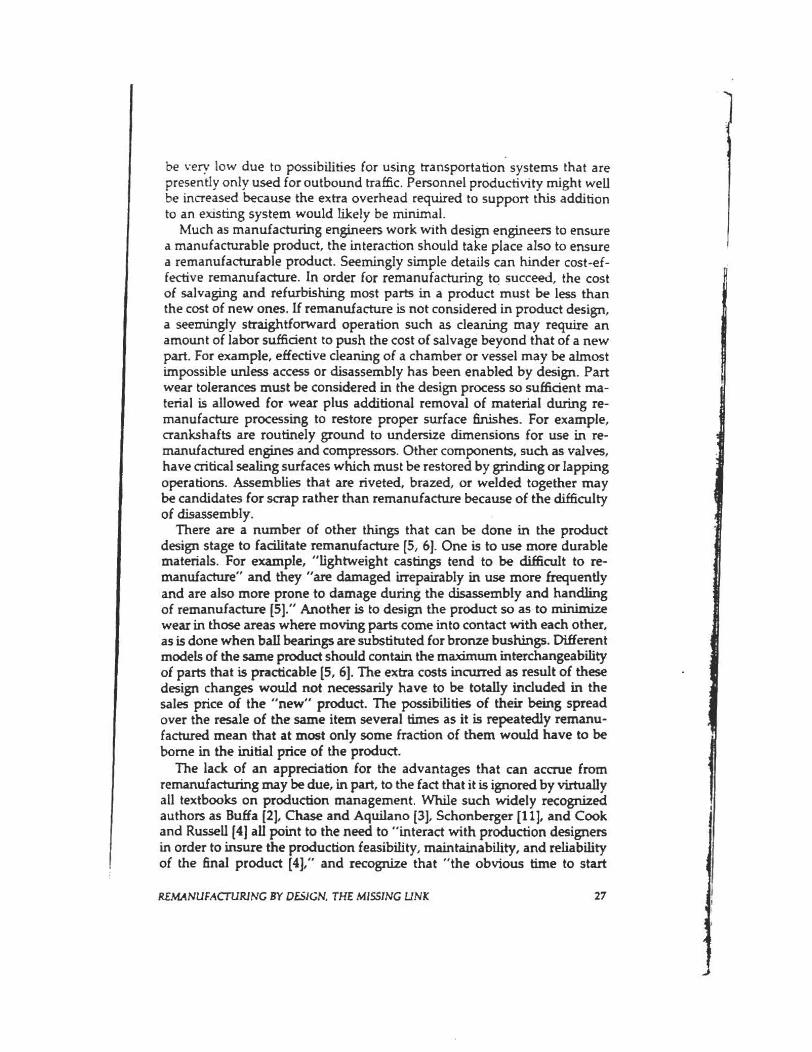
be very low due to possibilities for using transportation systems that are presentIy only used for outbound traffic. Personnel productivity might well be increased because the extra overhead required to support this addition to an exsting system would likely be minimal.
Much as manufacturing engineers work with design engineers to ensure a manufacturable product. the interaction should take place also to ensure a rernanufacturable product. Seemingly simple details can hinder cost-ef- fective remanufacture. In order for remanufacturing to succeed, the cost of salvaging and refurbishing most parts in a product must be less than the cost of new ones. Lf remanufacture is not considered in product design, a segmingtv smightforward operation such as cleaning may require an amount of labor s ~ a e n t to push the cost of salvage beyond that of a new part. For example, effective deaning of a chamber or vessel may be almost impossible unless access or disassembly has been enabled by design. Part wear tolerrmc~ must be considered in the design process so sufficient ma- terial is allowed for wear pIus additional removal of material during re- manufacture processing to restore proper surface fhkhes. For example, crankshafts are routinely ground to undersize dimensions for use in re- manufachued engines and compressors. Other components, such as valves, have aitical sealing surfaces which must be restored by grinding or lapping operations. Assemblies that are riveted, brazed, or welded together may be candidates for scrap rather than remanufacture because of the dif6cuIt-y of dkassembIy.
There are a number of other things that can be done in the product design stage to facilitate remanufacture [5, 61. One is to use more durable materials. For example, "lightweight castings tend to be difficult to re- manufacture" and they "are damaged irrepairably in use more frequently and are also more prone to damage during the disassembly and handling of remanufacture [5]." Another is to design the p d u c t so as to mininzize wear in those areas where moving parts come into contact with each other, as is done when ball bearings are substituted tor brzmze bushings. Different models of the same product should contain the m a u r n mterchangeabihty of parts that is practicable [5, 61. The exha costs incurred as result of these design changes would not necessarily have to be totally included in the sales price of the "new" p d u c t . The possibilities of their being spread over the resale of the same item several times as it is repeatedly remanu- factured mean that at most only some fraction of them would have to be borne in the initial price of the product. The lack of an &predationfcr the advantages that can accrue from
remanufacturing may be due, in part, to the fact that it is ignored by virtually all textbooks on prbduction management. While such widely recognized authors as Buffa 121, Chase and Aquilano [3]. Schonberger [11 J, and Cook and Russell (4) a11 point to the need to "interact with production designers in order to insure the production feasibility, maintainability, and reliability of the h a 1 product [4]," and recognize that "the obvious time to start
REMANUFACTURING BY DSlCN, THE MlSSlNG LINK 27
thinlung about basic modes of production for products is while they are sd l in the design stage [2]," they make no mention of similar requirements for remanufacture. In fact, remanufacture is not addressed in any context at all by most authors. The time has come for American industry to expand its notion of the
product life cycle to include remanufacturing. Instead of simply offering the consumer a process that goes from raw material to product to user to scrap, the concept should include the remanufacture of the product as an alternative to disposal when it becomes inoperable kyordsimple repair;' The r :.anufacturers could be the OEM or an indtppndmt ccqMtoKv Regarcsless of who performs the function, however, its eristence should W "by design."
REFERENCES 1. Annual Report. Arrow Automotive Lndushies. Framinghuh MA (30 June, 1984). 2. Buffa. E ! w d 5.. Modem Ptodu~on/Oprrations Managtmmf, John Wiley t Scns, NY
(1983). 3. Chase. Richard 8. and Aquilano, Nicholas J. , Roducthn and @warions ~ a n ~ n n r n t .
Richard D. h. Inc., Homewood. IL (1985). 4. Cook. Thomas M. and R u s e l l . Robcrt A.. Contonprmrry O p m t i a n s M ~ n n g n n r n t , Prentice-
Hall. Englewd CWs. NJ (1980). 5. Kutta, Richard M. and Lund. Robert T., Rmmnuf&uring: A Preliminary A*wrrmcnt, Center
for Policy Alternatives, MIT. Cmbridv, MA (l970). 6. Lund. Robert T, JZrmnnufac!unng, United States ~ t r i r n c e a n d Impluations~or Dmcloping
Natzons. The World Bank, Washgton, DC (1983). 7. - , "R~manufachtnng," Technology Rrnim (February/March 1984). pp. 19-29. 8. Lund Robert T. and h e y , W. Michael. "Extending Product Life: Time to Remanu-
facture?'' Mnnagcmcnt Rcrrirw (March I978), pp. 21-26. 9. North, David M., "Pratt & Whihrey Studie~ M o t e Remannfachxing" Avintion We& 6
Space Tcchnolugy (November 12. 19841, pp. 129-133. 10. Schonkrger, Richard I., Operations Management, Bushes Pub l ieah , hc., Piano, TX
(1985). 11. Schulfim, Roger and Sabin, Mqamt, '"A Gmwing b w Affair W~th the Saap Heap,"
Bus~nem Week (Apnl 29, 198S), pp. 69-72- 12. Wallact!, Thomas F., Editor, APIG Dictiunary; Fifih Edith, Amrrican M u t i o n and
lnventq Conml Swety; Falls Church, VA (1984). 13. Waters, Craig R., "On Semnd Thought," 1NC ( A u p t 1984). pp. 5661.
Robert Z. K r a f t . " I n c o r p o r a t e ~ n v i r o n m e n t a i Reviews I n t o ~ a c i l i t ~ ,
~ e s i q n . I' Chemical Ens inee r inu P rogres s 88 (August 1992) : 46-52.
ed w i t h pemdkssign af thL Arne r f f Chamical '4a,.-
0 1992 AIC~E.'
Environmental Reviews into Facility Design Use this 10-step procedure and these checklists to identifi and
analyze all environmental
issues and pollution
prevention opportu d i e s
during the plant design process.
Robert L Knft E I , du Pont de N m u r s
and Co.
A s a result of increased environ- mental awareness and regula- tions in the 1960s, "end-of- pipe" treatment became the
chief method of pollution control and waste management in the 1970s. While this method reduced (often effectively) the environmental impact of emissions and dis- charges to the environment, it became apparent that i t was an expensive way to manage waste. la the 1980s. the emphasis shifted from end-of-pipe treatment to the reduction of wastes at the-source andlor the reuse of wastes as more cost-effective waste management methods. .i
This approaeh has been used successful- ly in many existing facilities. ~n fd r tuna t e~~ . it is not always possible to minimize waste at the source or reuse it in an existing facili- ty to the extent that would Gdesirable. The physical structure of an existing facility is already in place, and this inherently limits the flexibility and options available to reduce or reuse wastes.
During the early stages of new facility design, however, ample opportunity exists to implement design modifications that reduce the need for waste treatment via source reduction or reuse. This article details a 10-step procedure. summarized in Table I . for use during the early design phases of a new project. Completing these steps will ensure that all environmental issues are addressed and that all opportuni- ties to reduce waste have been effectively defined and analyzed. Furthermore, suc- cessful implementation of this procedure often results in a combination of environ- mental benefits and positive economic returns. For example, when we applied this technique to the design of a grassroots plant. the moditications identified reduced
organic air emissions by 99% and carbon dioxide emissions by 22%. while providing an internal rate of return of 45% and a net present value of $6.4 million for a capital investment of $3.5 million. Economic returns will vary, but most projects can be expected to improve environmental perfor- mance with attractive economics.
1. Perform the initial assessments The first step in the environmental
review procedure i s to conduct an initial screening of the project to see if there are any environmental issues and to perform two predesign assessments, an environ- mental site assessment and an evaluation of environmental baseline information.
The initial screening can be accomplished by answering the following questions:
Does the project involve the use of chemical ingredients?
Does the project involve eyipment containing fuels, lubricants, or greases'?
Does the potential exist for reducing or eliminating wastes, internally recycling materials. or reusing byproducts?
Are there potential problems with exist- ing site conditions, such as the presence of contaminated soil and/or groundwater?
Does the project have the potential to contaminate or impair groundwater or soil?
Does the project involve the storage and transport of secondary waster?
If the responses to all of the above ques- tions are negative, then the responses are documented and no further environmental reviews are required. I f , however. the answer to any or all of these questions is yes, then environmental leadership respon- sibility for the project is assigned (Step 2 ) and the remaining steps are followed.
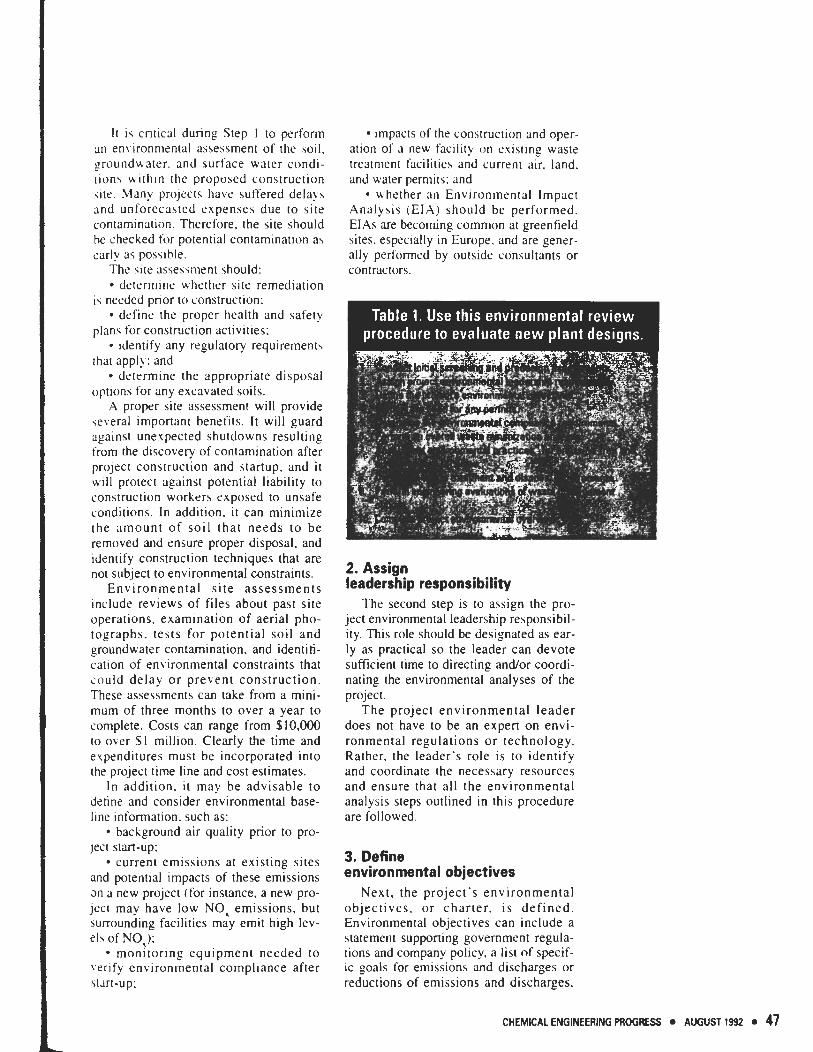
I t i \ crit~cal during Step I to perform an en\ ironnlenral assessment of the soil, grounduater. and surface water condi- [Ion, u ~ t h ~ n the proposed construction ,i t r l . Many projects have suffered delay\ and unforecasted expenses due to sire contaminat~on. Therefore, the site should he checked for potential contamination as early as pos,~hle.
The \ite asseswent should: determine whether site remediation
is needed pnor to construction: define the proper health and safety
plans for construction activities: identify any regulatory requirements
that appl) : and determine the appropriate disposal
options for any excavated soils. A proper site assessment will provide
several important benefits. I t will guard against unerpected shutdowns resulting from the diwovery of contamination after project consrruction and startup, and it will protect against potential liability to construction workers exposed to unsafe conditions. In addition, i t can minimize the amoun t of soil that needs to be removed and ensure proper disposal, and idenrify construction techniques that are not subject lo environmental constraints.
Env i ronmenta l s i te a s sessmen t s include reviews of files about past site operations. examination of aerial pho- tographs. tests for porential soil and groundwater contamination. and identiti- cation of environmental constraints that could delay o r prevent const ruct ion. These assessments can take from a mini- mum of three months to over a year to complete. Costs can range from $10.000 to over SI million. Clearly the time and expenditures must be incorporated into the project time line and cost estimates.
In addition, i t may be advisable to detine and consider environmental base- l ~ n e information. such as:
background air quality prior to pro- ject stan-up:
current emissions at existing sites and potential impacts of these emissions an a new project (for instance, a new pro- ject may have low NO, emissions, but surrounding facilities may emit high lev- els of NO,);
monitoring equipment needed to \.erify environmental compliance after 5t.m-up:
impacts of [he construction and oper- ation of a new fac~iity on e ~ i s t i n g waste treatment facilities and current air, land. and water permits: and
whether an Environmental Impact Analysis (EIA) should be performed. ElAs are becoming common at greenfield sites. especially in Europe. and are gener- ally performed by outside consultants or contractors.
2. Assign leadership responsibility
The second step is to assign the pro- ject environmental leadership responsibil- ity. This role should be designated as ear- ly as practical so the leader can devote sufficient time to directing and/or coordi- nating [he environmental analyses of the project.
The project environmenta l l eade r does not have to be an expen on envi- ronmental regulations o r technology. Rather. the leader's role is to identify and coordinate the necessary resources and ensure that all the environmental analysis steps outlined in this procedure are followed.
3. Define environmental objectives
Next, the project 's environmenta l objec t ives , o r char ter . i s d e f i n e d . Environmental objectives can include a statement supponing government regula- tions and company policy. a list of specif- ic goals for emissions and discharges or reductions of emissions and discharges,
CHEMKAL ENGINEERING P R O G W AUGUST 1392 47
E N V I R O N M E N T A L PROTECTION
and other project-specific objectives. These objectives focus preferentially on source reducrion and recycling n h e r than waste treatment. They con- sider continuous process emissions and d ischqcs based on a prioritized list. as well as noncontinuous or non- prucess emissions such as lubricants. fuels. spent oils. packaging materid. stormwater runoff. and the like.
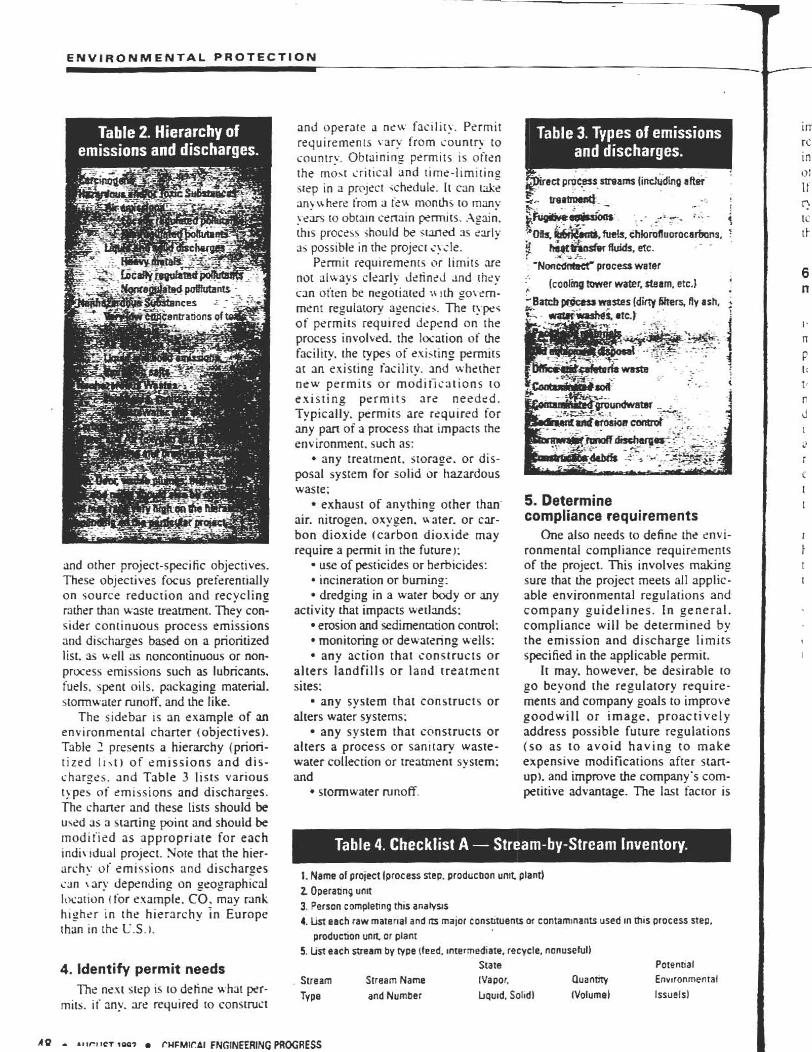
The sidebar is an example of an environmental charter (objectives). Table 2 presents a hierarchy (priori- tized I r s t ) of emissions and dis- charges. and Table 3 lists various types of tm~ss ions and discharges. The chanzr and these lists should be used as a sraning point and should be modiiird as appropriate for each indit dual project. Note that the hirr- arch! of emissions and discharges <an depending on geographical locaion (for example. CO. may rank hlghrr in rhr hierarchy in Europe than in the L.S.1.
4. Identify permit needs The next step is to define what per-
mirs. if any. are required r o construct
and operate rt new facility. Permit requirements \-XI; from country to country. Obtaining permits is often the mo>t i r i t i ~ r t l and rime-limiring step i n a pr~jcct ichedulc. 11 can u e anyu here from a ku months to many ym ro obrarn crnain pmnjts. .Again. th~s process ihould k zrmed ar rwly r t i possible in rhc projecr q de.
Permit rrquiremenrs or limits we nor du-ays clearly Jetincd dnd they can oitrn be nrotiated :\ i rh = ao\ ern- mcnt regularo~ azenclei. The typttc of permits required depend on [he process involved. the Iwation of h e fxility. the types of exicting permits at an existing facility, and whether new permits or rnodiiications to existing permits arc needed. Typically. permits are required for any pan of a pmcess that impacts the environment. such as:
any treatment. storage. or dis- posal system for solid or hazardous waste:
+ exhaust of anythinp other than' air. nitrogen. oxygen. uater. or car- bon dioxide (carbon die-xide may require a permit in the future):
use of pesticides or herbicides: incineration or burning: dredging in a water W y or any
activity h a t impacts wetlands: erosion and sedimenntion control: monitoring or dewarcring wells: any action that ionstructs or
alters landfills or land treatment sites:
any system that construcrs or alters water systems:
any system that constructs or alters a process or sanitav wasre- water collection or treament system: and
stormwater runoff.
5. Determine compliance requirements
One also needs to define the cnvi- ronrnen tal compliance requirements of the project. This involves making sure that the project meets all applic- able environmental regulations and company guidelines. In general. compliance will be determined by the emission and discharge limits specified in the applicable permit.
It may. however. be desirable ro go beyond the regulatory require- ments and company goals to improve goodwill or image, proactively address possible future regulations ( S O as to avoid having to make expensive modifications after start- up). and improve the company's com- petitive advancage. The last factor is
I . Name of prolecf lprocesr nep. producbon unit planll Z Operaang unlr 3. Person compterinq this a n a b s 4. bst each raw mater~al and m major consments u contarmnants used In m ~ s process step,
production lmlt or plan1 5. Lin each stream by type (feed. ~ntermediate, recycle. nunuseful)
State Potennal
Stream Stream Name IVawr. Ouannty Env~ronmental
T V P ~ and Number Lqu~d. Solrd) (Volumel lssuefsl
:nvi- writs k i n g iplic- . and
- cral, :d by I i mils :t. d e to uire- >rove ~ v e l y ations -nake St3I-t-
com- tor is
M -.
=tsR
. -*;
e n d -
. .
imponam because 3 c~mpmy's envi- ronnienrat performance has increas- ingly become 2 morr .rigniticm pan cjt ihe public'.; purchamg decis~ons. If one Jec~ Je\ rcr $0 be! onci rcgulato- p requiremrnh. i t I.; morr dtiinble IO do 3i) rl;l u ~ s [ t rrclucnon or reuse (hm u ' w e ventrnrnt.
6. Analyze waste minimization overall
The silrth step of the procedure is to perform an overall waste mini- mization analysis of the entire process. Note that new or exotic technology i s usually not required 10 minimize waste - waste mini- mization is more likely to be hin- dered by attitudes based on limited information and experience than on a lack of effective technology. The means to reduce waste are imbed- ded in all aspects of production - there is no discrete "waste reduc- tion technology."
In order to obtain meaningful waste minimization results. it is important to have a fairly accurate flow sheet iden- tifyin_e all major process streams and their composition.
First, classify all the process streams into one of four categories - nonuscful (waste). feed. interme- diate. and recycle - and note poten- tial environmental issues. Checklist A (Table 4) should be used for this anaIysis.
While the waste minimization analyses focus primarily on nonuse- ful streams. the feed. intermediate. and recycle streams should not be overlooked for opportunities to reduce waste at the source. Generally. impurities in the feed srreams produce byproducts that can be eliminated by purifying the feed stream or purchasing a higher-purity raw material. Intermediate and recy- cle streams should also be analyzed. to see if rhey should be altered or modified before funher processing.
N e x t . focus on the nonuseful streams. Checklist B (Table 5 ) should be completed for each nonuseful stream. This checklist srimulates rhinking abut options for e l iminat ing or minimizing the arnmrnt of waste that is generated
Environmental Chafler T 0 Design facilities to operate as close to emissionldischarge-free as technically and economically feasible I IN A WAY THAT -
Complies wtfr existing and anticipated reghations as well as the estab- lished standards, policies, and company practices. Emission- and dts- charge-reductian priormes wdl be based on a hterarchy of emissions and discharges (see Table 2) mctwill include various types of emissrons and drscharges Fable 3). . .
Develops investment opti& to reducs and/or eliminatiall liqhd, gaseous, and solid discharges based on bast environmental practices. These options will be implemented if they yield returns greater than capi- tal costs. Failing to meet this standard, options may sill be implemented subject to noitobjection of the business, production, and research and development function/
~onsrders waste-management options in the follwving priority order. 1. ~roc'ess madificatiocls tn prevent waste generation
-' Z Process modfications so as to be able to a. Recyc te, b. SeR as copmduct w c. Aeturn to vendor for nchmation or reuse. Where rnatniafs are -
sold or returned to the vendor, the project team should ensure that customers and vendors win operate in an environmentafly accaptablemamez <:<-= -
3. Treatment to generate i j h r i a l widr m, impact on UMJ amirment Considers all potential c o n f h m s mtf fuai t i i dissioks in ttae basic
design date as well as aWmc#rtinUOUS events such a8 mainten&nce arrd ;lean-out, ftPThlp, and rwrtine w *mcy shutdowns. A t l m no hazardous wastes tD b-anenttt. retained on-site u n b
,
fie site has a regulated b c d w ~ s IandFat. - . 1 Documgnts all e m i s s i o n m m a d after waste minimization efforts.
Interacts with ottrar irrtsrnat m extemd processes or facititiet to geneF- 9te a combined net reductiocl@ mission+. Interaction that lei!& ts r nst fecrease in emissions win be & m i d e d in\ compfiande wRh giiS aa&r, while that leading to a net increase in emissions will be considered not in :omphancs. I Where decisions are made to delay the *mllat ion of emission reduction acilities or to not eliminate spfjcific emissions, considers providing for the future addition d suchfacirnier.rt minimal coot and opersling disruption. .lists, where possible, specific goals foc wnhsionr and discharges or
and discharge reductfern- 8spdaRy with ragad tu hazerdous and toxic substances. . =-I.* - - - --
E N V I R O N M E N T A L P R O T E C T I O N -
and. therefore, must be ueatcd. Each nonuseful stream should be analyzed as follows:
I . Can i t be eliminated or mini- mized at the source? If not.
2 . Can the need for wa5te treat- ment be avoided or minimized \-ia reuse. recycle, or coproduct sale? I f not.
3 . The stream will ha \ c to be treated to render i t nonhazardous to the environment. (Waste treatment is discussed in Step 8 . )
The first two routes often result in attractive economic returns in addi- tion to environmental benefits. Treatment. while having environ- mental benefits. seldom has an eco- nomic return. For example. it mlght be advantageous to separate a gaseous raw material from a reactor purge stream prior to waste treatment and recycle or reuse it. In this mm- ner. burning r treating) the material and the resultant combustion prod- ucrs would be avoided, while the raw-material cost savings may more than pay for the investment to per- l'orm the separation.
Finally. evaluate rhe opemting con- ditions (e.g.. remprrature. pressure) and procedures. equipment selecrion and design. and process control \themes. While one of the yeatest opportunities ro minimize u.bte may be dur~np the fundamental research that led to the process chemisp fs .g.
raw materials, catalysts). minor alter- ations to operating conditions and/or equipment design and prccess control may also afford a significant opponu- nlties to minimize waste generation at the source.
7- Apply "best environmental practices"
Next one should review the entire process ro minimize or eliminate unplanned releases. spills, and fugi- tive emissions. This includes a review ol'all equipment pieces. seals. operating procedures. and so on.
When reviewing the project for
ways to eliminate or minimize fugi- tive emissions. the following hierar- chy should be used:
I . Prevent or minimize leaks at the source by eliminating equipment pieces or connections u here possible and by upgrading equipment or replacing standard equipment pieces with equipment thar leaks less or does not leak at all.
2. Capture and recycle or reuse so as to prevent or min~mize rhe need for abarement.
3. Abate emissions so as to have no impact on the environment.
Checklist C (Table 6 , will assist in this analysis.
-- - - - - - - - - --
Waste treatment is utilized only as a necessary last resort after all options to eliminate waste at the source
or reuse wastes have been exhausted.
I
!l-
lr-
il t nt Ie 3r eb or
>o ed
ve
ist - ce
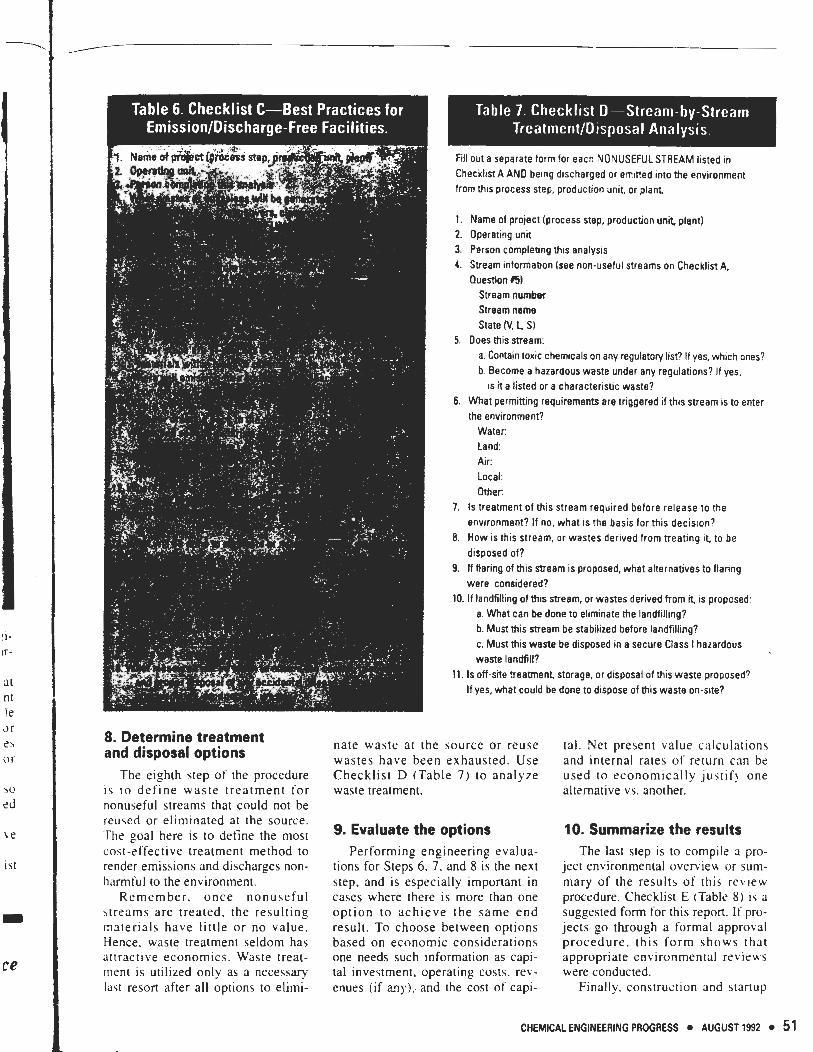
Fill out a separate form for each NONUSEFUL STREAM listed in Checklist A AND bemg discharged or em~tted into the environment from th~s process step, production unit, or plant
1. Name of project (process step, production unit, plant] 2. Operating unit 3. Person completing this analysis 4. Stream information (see non-useful streams on Checklist A,
Question 6) Stream number Stream name
State (V. L Sl 5. Does this stream:
a. Contain toxic chemicals on any regulatoly list? If yes, which ones? b. Become a hazardous waste under any regulat~ons? If yes,
IS it a listed or a characteristic waste? 6. What permitting requirements are triggered if this stream is to enter
the environment? Water: Land: Air: Local: Other:
7. Is treatment of this stream required before release to the environment? If no, what is the basis for this decis~on?
8. How is this stream, or wastes derived from treating it to be disposed of?
9. If flaring of this *earn is proposed, whet alternatives to flaring were considered?
10. If landfilling of this stream, or wastes derived from it, IS proposed: a. What can be done to eliminate the landfilling? b. Must this stream be stabilized before landfilling? c. Must this waste be disposed in a secure Class I hazardous waste landfill?
11. Is off-site treatment storage, or disposal of this waste proposed? If yes, what could be done to dispose of this waste on-s~te?
8. Determine treatment and disposal options
The eighth step of the procedure i \ to define waste treatment for nonuseful streams that could not be reused or eliminated at the source. The goal here is to define the most cost-effective treatment method to render emissions and discharges non- harmful to the environment.
Remember. once nonuseful btreams are treated. the resulting materials have little or no value. Hence, waste treatment seldom has attractive economics. Waste treat- ment is utilized only as a necessary last resort after all options to elimi-
nate waste at the source or reuse wastes have been exhausted. Use Checklist D (Table 7 ) to analyze waste treatment.
9. Evaluate the options Performing engineering evalua-
tions for Steps 6 . 7. and 8 is the next step. and is especially important in cases where there is more than one option to achieve the same end result. To choose between options based on economic considerations one needs such information as capi- tal investment. operating costs. rev- enues (if my), . and the cost of capi-
tal. Net present value calculations and internal rates of return can be used to economically justif! one alternative vs. another.
10. Summarize the results The last step is to compile a pro-
ject environmental overvien or sum- mary of the results of this review procedure. Checklist E (Table 8) is n suggested form for this report. If pro- jects go through a formal approval procedure, this form shows that appropriate environmental reviews were conducted.
Finally. construction and stanup
ENVIRONMENTAL PROTECTION
An application . -
This 10-step $ocedurt was recently applied to a major g r a s m t s chemical facility. Of most interest are the efforts and results from Steps 6, 7. 8. and 9. A rotal of 1.500 person- nel hours were devoted to meeting prepararion. the meetings them- selves. md meeting follow-up. at an estimated cost of 5150.000 (2% of the pre-project design cost).
Three major design modifications resulred:
feed purification: recovery of one of the raw mate-
rials from the reactor purge gas: and special pump seals and valve
modifications to minimize fugitive emissions.
Note that none of the projects involved waste trealment. but ratfier source reduction and reuse.
Each design modification had a return on investment grearer than the cost of capital. The combined environ- mental benefit of the three projects was a 99% (430.000-lblyr) reduction in organic air emissions and a 21% t 116-million-lblyr) reduction in carbon dioxide emissions. The combined pro- jects had an internal n t e of return of 45% and a net present value of $6.3 million based on a capital investment of 53.5 million.
The combination of environmental
benefits and attractive economic returns is not uncommon when the procedure outlined here is applied early in the design phase of a new facility with a focus on source reduc- [ion and reuse rather than waste treat rnent. rn
I
ACKNOWLEDGMENTS
52 AUGUST 1992 CHEMICALENGINEERING PROGRESS