Embed Size (px)
Citation preview

TPA Horwath Horodko Audit Sp. z o.o. Member of Crowe Horwath International
Selected Implications of the Investment Freeze in the Onshore Wind Power Sector
Polish Wind Energy Association
May 2016

TPA Horwath Horodko Audit Sp. z o.o.
Audit and Business Advisory Member of Crowe Horwath International
District Court in Poznań, Nowe Miasto and Wilda, VIII Economic Department,
KRS 0000245198, NIP 778-143-20-33, REGON 300184858, Share capital PLN 225,000.00
ul. Murawa 12-18, 61-655 Poznań, Phone: +48/61/ 63 00 500 Fax: +48 61 63 00 502
ul. Przyokopowa 33, 01-208 Warszawa, Phone: +48/22/ 647 97 00 Fax: +48 22 647 97 01 al. Korfantego 141 B, 40-154 Katowice, Phone: +48 32 73 20 222 Fax: +48 32 73 20 002
E-Mail: [email protected] Internet: www.tpa-horwath.pl
Warsaw, 20 May 2016
To: Wojciech Cetnarski Polish Wind Energy Association 1/12-13 Księcia Bogusława X str., 70-440 Szczecin
Dear Sir,
On behalf of TPA Horwath Horodko Audit Sp. z o.o. please find below the report summarizing our analysis of the selected results of the upcoming legislative changes affecting the wind power sector.
We hope that this report will meet your expectations and provide useful information. In case of any questions or comments please do not hesitate to contact us.
Best regards,
Krzysztof Horodko Managing Partner
Wojciech Sztuba Managing Partner

Selected Implications of the Investment Freeze in the Onshore Wind Power Sector 3 April 2016
Table of Contents
TABLE OF CONTENTS 3
1. INTRODUCTION 4
2. SUMMARY 5
3. SIGNIFICANCE OF WIND POWER IN CURRENT & FUTURE ENERGY MIX 7
Requirements for RES energy production 7
Current RES energy Production 7
Requirements for RES energy production under the new support system 8
4. REPLACEMENT OF FUTURE WIND FARMS WITH OTHER RES TECHNOLOGIES 10
Replacement costs of the currently operating installations 12
5. MUNICIPALITY REVENUES 16
Receipts from real estate tax 16
Municipality revenues from income taxes 19
6. EMPLOYMENT IN THE SECTOR 22

Selected Implications of the Investment Freeze in the Onshore Wind Power Sector 4 April 2016
1. Introduction
Polish Wind Energy Association has asked TPA Horwath to analyze the results of the investment freeze (pertaining to investments currently under construction, those not yet covered by building permits and upgrade & replacement projects) in onshore wind energy on capacity installed in this sector, and consequently, on the electricity produced from renewable energy sources.
Our analysis has been based on the draft act presented to the Polish Parliament on 19 February 2016 and eventually adopted on 20 May 2016, introducing regulatory changes (informally called Distance Act - “ustawa odległo ściowa” ) related to construction of new wind farms, including in particular restrictions on the distance from the nearest residential (or partly residential) buildings
Below please find the results of our analysis.

Selected Implications of the Investment Freeze in the Onshore Wind Power Sector 5 April 2016
2. Summary
Below is a summary of this report, with a description of the key assertions, assumptions and conclusions made in our analysis.
WIND POWER SIGNIFICANCE IN THE CURRENT & FUTURE ENERGY MIX
• After a period of quick growth, capacity installed in the onshore wind energy as at the end of 2015 reached 4 978 MW, whereas the electricity produced is estimated at 10 702 GWh annually, representing 47.6% of total electricity production from renewable sources.
• Total estimated capacity rose by 497 MW in 2016 year-to-date, a result of construction work started in 2015. We have assumed that there is no significant pipeline left currently under construction. This is because renewables producers entering electricity into the grid after 30 June 2016 will not receive certificates of origin. Therefore, we do not expect new construction to start before the conclusion of the first auction organized on the basis of the Act of 20 February 2015 (that is, until the second half of 2016). Thus, it is reasonable to assume that no new capacity will be added to the system before the second half of 2017.
• To achieve the EU-mandated target share of RES in gross final energy consumption equal to 15%, Poland must, according to the estimates contained in the National Action Plan (KPD), to produce 32.4 TWh of electricity from RES in 2020. This implies a necessity to increase production by 10.0 TWh in the years 2016-2020.
• According to our estimates, assuming that auction budgets mimic the plans drawn up in preparation for the 2016 auctions, up to 6.0 TWh out of the assumed 11.2 TWh could be provided by industrial-scale wind power plants.
CHANGES PROPOSED IN THE DRAFT
• From the point of view of the wind industry the most important changes introduced by the draft include:
1) restriction on the distance of newly built wind power plants from the nearest residential and partially residential buildings,
2) real estate tax base increase (value of the entire wind power plant instead of only foundation and the tower) through an amendment to the Construction Act in the section containing the definition of a structure,
3) introduction of a requirement for the wind energy producers to obtain a decision of the Office of Technical Inspection (UDT) at least every two years after each upgrade or repair of the power plant, permitting further service, along with payment of a “UDT activities fee” in an amount dictated by the minister of the economy, reaching a maximum 1% of total capital expenditures.
• In this report we purport to estimate the financial consequences of the wind farm construction freeze (both in terms of new investments and investments replacing existing farms from approx. 2025 to 2030) due to the potential implementation of the proposal to ban issuing building permits for wind farms located less than ten times the height of the turbine from residential or partially residential buildings.
• The analysis is based on the assumption that such a strict criterion would make any of the potential locations for onshore wind power plants unattractive from the investment perspective, and so that the investments in the industrial-scale wind power (larger than micro-installations) would be de facto suspended as of 2017. Despite the large number of construction permits issued before the Act came in force (according to PWEA estimates, approx. 2 000 MW in terms of capacity), on the basis of which projects could be submitted for auctions, it appears that some of the Act’s provisions would block the construction of new power plants. In almost every case some fairly unpredictable modifications of the original design of a wind farm are required. These can be formally approved through the issuance of a so-called substitute building permit. The draft does not provide this possibility in respect of facilities that do not meet the distance criterion. Therefore, obtaining financing for such projects would be extremely difficult.

Selected Implications of the Investment Freeze in the Onshore Wind Power Sector 6 April 2016
REPLACEMENT OF FUTURE WIND FARMS WITH OTHER TECHNOL OGIES
• Wind energy is the cheapest source of RES electricity. However, if investments in the wind power have to give way to other RES sources, the costs of energy production would increase, affecting both consumers and business. Potential wind energy production (above mentioned 6.0 TWh) would have to be substituted by biomass energy production (5.1 TWh, including 1.2 TWh of energy from coal plants adapted to biomass co-firing), biogas (0.6 TWh) and solar power (0.3 TWh). Consequently, LCOE (average long-term cost of electricity) of industrial installations set up between 2017 and 2020 will be approx. PLN 60 per MWh higher that it would be using wind power plants (average price increase 340 PLN/MWh up to 400 PLN/MWh ).
• In addition, it should be assumed that after 2020 the production of electricity from renewable sources should not fall (moreover, based on CO2 emission goals, it should continue to grow quickly). As a result, wind power plants built by the end of the first half of 2016 would have to be replaced by new installations after they reach limits of their technical sustainability. In the report we estimate the cost of replacing the installations that are going to be scrapped after 2025. Taking into consideration a high level of uncertainty about the LCOE of installations completed in 2030 and afterwards, it is difficult to accurately estimate how much it would cost to replace currently operating wind power plants with new capacities in other RES technologies. Nonetheless our estimates indicate that the expense could reach almost PLN 2.6 billion annually in the year 2042.
MUNICIPALITY FINANCE
• The wind power plants investment freeze will hit municipality budgets. This impact will involve loss of revenue from real estate tax and share in income taxes (PIT and CIT) payable to the local governments by potential new installations operators.
• This means real estate tax-related revenue shortage in the years 2018-2020 in the total amount of PLN 204 million and since the year 2020 – PLN 97 million annually.
• The estimated loss of revenue from CIT and PIT by municipalities is estimated at PLN 33 million in the years 2018-2020.
• We have also been able to assess the impact of the lack of replacement investments since 2030 on the budgets of local governments. Expressed in 2015 prices, the overall loss of real estate tax revenue will amount to PLN 240 million annually (since 2041), and PLN 39 million annually (in 2041) in forgone income taxes.
EMPLOYMENT IN THE SECTOR
• Construction, operations and maintenance of wind farms creates jobs. In the years 2017-2020 the of investment freeze in new wind farm capacity will result in a loss of approx. 12.7 thousand temporary jobs and 1.1 thousand permanent jobs. In the years 2021-2029 still 1.1 thousand will be missing as a result of the past lack of investments.
• Without the replacement investments anticipated to take place since 2030, over 10.0 thousand jobs connected to the wind farm construction will not be created (in 2037), and 2.7 thousand permanent jobs will be lost until 2041 (including the largest amount of 650 jobs in 2041).

Selected Implications of the Investment Freeze in the Onshore Wind Power Sector 7 April 2016
3. Significance of Wind Power in Current & Future Energy Mix
REQUIREMENTS FOR RES ENERGY PRODUCTION
Due to the EU 2020 climate objectives Poland is obliged to achieve a 15% share of RES in its total gross energy consumption. This objective is apportioned as follows:
� electricity – 19.13%;
� heating and cooling – 17.05%;
� transport – 10.14%.
According to KPD1, to meet the RES objective Poland should be able to produce 32.4 TWh of green energy per year.
On the other hand, the document Conclusions from the analysis of forecasting the needs of the Polish Energy Policy until 2050 (PEP 2050, “Wnioski z analiz prognostycznych na potrzeby Polityki Energetycznej Polski do 2050 r.”2) assumes that the target RES share will be met at the production level of 34.0 TWh.
CURRENT RES ENERGY PRODUCTION
Data on historic production of electricity from renewable energy sources is presented in the table below. The data for the years 2010-2014 is derived from the analysis in “Energia ze źródeł odnawialnych w 2014 r.” published by the Central Statistical Office (GUS)3. Data on 2015 is derived from Energy Market Agency S.A. studies.
Table 1 Energy produced from renewable sources
RES production Unit 2010 2011 2012 2013 2014 2015P 20 16F
Water GWh 2 920 2 331 2 037 2 439 2 182 1 828 2 382 Wind GWh 1 664 3 205 4 747 6 004 7 676 10 702 12 600
Solid biofuels GWh 5 905 7 148 9 529 7 932 9 160 9 044 6 564 only co-firing GWh 5 593 6 389 7 239 3 929 4 510 4 480 2 000 Biogas GWh 398 451 565 690 816 842 842
Bioliquids GWh 1 1 - 1 - - - Solar power GWh - - 1 1 7 57 71
Total GWh 10 888 13 136 16 879 17 067 19 841 22 472 22 459 Source: GUS, Energy Regulatory Office (URE), TPA Horwath
*Data by Polskie Sieci Elektroenergetyczne S.A. (PSE)
Estimates for the years 2015 and 2016 have been prepared under the following assumptions:
� Water – production in 2016 at the 2010-2014 average (2015 was omitted because output was unrepresentative due to unfavorable weather conditions),
� Wind – production in 2016 – TPA Horwath calculations based on data provided by URE and PSE,
� Biomass – production in 2016 assumed at the 2015 level, less output from biomass co-firing (for that purpose we have assumed that the production from co-firing will reach 2 000 MWh as a result of changes in the support system. In January 2016 co-firing production decreased by 55%, to 179 GWh – we have assumed that the annual production will be slightly less than twelve times this value),
� Biogas – production in 2016 assumed at the 2015 level,
1 Krajowy Plan Działania w zakresie energii ze źródeł odnawialnych (National Action Plan).
2 Projekt Polityki Energetycznej Polski do 2050 roku – Załącznik nr 2 - Wnioski z analiz prognostycznych na potrzeby Polityki energetycznej Polski do 2050 roku, www.bip.me.gov.pl 3 Energia ze źródeł odnawialnych w 2014 r. – Główny Urząd Statystyczny Departament Produkcji, Agencji Rynku Energii S.A., Warszawa 2015

Selected Implications of the Investment Freeze in the Onshore Wind Power Sector 8 April 2016
� Solar power – production in 2016 based on capacity installed at the end of 2015 with an assumed average productivity of 1 000 MWh/MW per year.
We expect that that these assumptions will not be materially different from the actual RES energy production in 2016, taking into account the investment freeze associated with the uncertainty about the first RES auction.
Chart 1 Forecasted electricity production from rene wable sources in 2016
Source: GUS, URE, PSE, TPA Horwath
REQUIREMENTS FOR RES ENERGY PRODUCTION UNDER THE NEW SUPPORT SYSTEM
As stated before, according to the National Action Plan (KPD) for energy from renewable sources, to meet the RES objective, Poland should be able to produce 32.4 TWh of green energy per year.
Assuming that the production of electricity in 2016 will amount to 22.4 TWh, fulfilment of the obligation would require to sell at least 10 TWh of additional energy per year under the auction system (11.6 TWh if we were to assume that PEP 2050 is binding).
We also assume (as at the response to Query no. 33620 on the amount of support for each RES technology, representing the intentions of the RES Act designers) that the annual volume of sold energy will be as follows:
Table 2 Increase in energy output necessary to meet EU objectives Unit 2016 2017 2018 Total
Water energy: GWh 20 34 14 68 <1 MW GWh 20 34 14 68 Wind energy: GWh 2 040 3 400 1 360 6 800 Onshore GWh 1 800 3 000 1 200 6 000 Offshore GWh 0 0 0 0 Small wind power plants GWh 240 400 160 800 Biomass: GWh 1 303 2 171 869 4 343 Biogas GWh 463 771 309 1 543 Solid, including: GWh 840 1 400 560 2 800
Co-firing GWh 0 0 0 0 dedicated GWh 840 1 400 560 2 800
Total GWh 3 363 5 606 2 242 11 211
Source: sejm.gov.pl
11%
56%
29%
4% 0%
Water
Wind
Solid Biofuels
Biogas
Solar energy

Selected Implications of the Investment Freeze in the Onshore Wind Power Sector 9 April 2016
If the entire volume predicted for auctions is sold and leads to new capacity, this should allow for the RES target described in the KPD to be met. If the required volume is higher (e.g. as at PEP 2050), we have assumed that the difference will be covered by the production in micro-installations.
The presumed volume of electricity sold at auctions is possible to reach only in the event of a significant increase in the volume proposed for auctions in 2017.
Considering the fact that the wind energy production is currently the cheapest RES in terms of LCOE, and taking into account the reduction of purchased energy volume planned in the 2016 budget (for RES projects with productivity of less than 4 000 MWh/MW annually), we have assumed that the wind sources can provide production specified in the response to the query, that is, 6 000 GWh.
We also assume that the average productivity of wind farms operating under the auction system would reach 2 700 MWh/MW annually, and as a result, in the years 2016-2018, new wind power capabilities should amount to 756 MW, 1 259 MW and 504 MW respectively.
The increase in energy output necessary to meet EU objectives is presented in the table below.
Table 3 Increase in energy output necessary to meet EU objectives
Unit 2018 2019 2020 2021 … 2041
RES electricity output from the 2016 auctions GWh 3 363 3 363 3 363 3 363 … 3 363 RES electricity output from the 2017 auctions GWh 5 606 5 606 5 606 … 5 606 RES electricity output from the 2018 auctions GWh 2 242 2 242 … 2 242 Total output in the auction system GWh 3 363 8 969 11 211 11 211 … 11 211 Source: TPA Horwath

Selected Implications of the Investment Freeze in the Onshore Wind Power Sector 10 April 2016
4. Replacement of Future Wind Farms with Other RES Technologies
The cost of replacing wind power with other RES technologies has been estimated under the assumption that the new regulations introduced by the distance act will completely block new investments in industrial-scale wind power.
In this case, production from RES that would have been originally generated by wind farms is going to be replaced by other renewable sources. In our opinion the replacement of this production could be achieved primarily by biomass production (including co-firing in coal boilers), biogas and photovoltaic installations.
We have performed the comparison of the replacement costs by using the LCOE. The following table presents the average LCOE levels for the technologies mentioned before, as well as weights assigned to each of them in the overall process of pushing wind power out. The weights are derived from the current RES production mix, the dynamics of the growth of each technology in recent years as well as the relative importance according to the KPD. The weights are as follows:
� biomass alone – 65%,
� biomass co-fired with coal in dedicated co-firing installations – 20%,
� biogas – 10%,
� solar power – 5%.
A detailed breakdown of the long-term LCOE changes for wind and other renewable energy sources is presented below. Baseline LCOE levels for 2015 were established on the basis of the opinion of the Institute of Renewable Energy on the draft of Ordinance of the Minister of Economy on reference prices for renewable energy. LCOE indexation levels for each RES technology are assumed as follows:
� wind -1.0%,
� biomass 1.0%,
� co-firing 1.0%,
� biogas 0.5%,
� solar energy -2.0%.
We have assumed that the cost of production in installations that do not require fuel (e.g. wind and photovoltaic sources) will decline with continuing technical progress. We anticipate that the decline in the cost of photovoltaic panels will be bigger that this for the wind turbines. On the other hand, in regard to the installations with higher share of variable component in the overall costs (primarily fuel) we have assumed a moderate LCOE growth.
.

Selected Implications of the Investment Freeze in the Onshore Wind Power Sector 11 April 2016
Chart 2 LCOE of technologies replacing wind
Source: TPA Horwath
The average cost of production replacing wind power rises from approx. 389 PLN/MWh in 2015 to approx. 473 PLN/MWh in 2041. The total cost of replacing this capacity by new installations is presented in the table below.
200
300
400
500
600
700
800
2016 2017 2018 2019 2020 2021 2022 2023 2024 2025 2026 2027 2028 2029 2030 2031 2032 2033 2034 2035 2036 2037 2038 2039 2040 2041
PLN
/MW
h
LCOE wind LCOE biomass LCOE co-firing LCOE biogas LCOE solar energy LCOE wind replacement

Selected Implications of the Investment Freeze in the Onshore Wind Power Sector 12 April 2016
Table 4 Total replacement costs of new installation s (constant prices as at 2015)
Unit 2015 2016 2017 2018 2019 2020 2021 … 2041 Replacement costs kPLN 98 432 281 223 361 846 361 846 … 361 846
Wind energy output from the 2016 auction GWh 1 800 1 800 1 800 1 800 … 1 575 Wind energy output from the 2017 auction GWh 0 3 000 3 000 3 000 … 1 575 Wind energy output from the 2018 auction GWh 0 0 1 200 1 200 … 1 575
LCOE wind PLN/MWh 353 349 346 343 339 336
LCOE replacement PLN/MWh 389 392 394 397 400 403
Source: TPA Horwath
The annual cost of replacing wind installations that are to be created within the auction system was calculated as the product of the difference between wind LCOE and replacement LCOE times the volume sold on a given auction.
REPLACEMENT COSTS OF THE CURRENTLY OPERATING INSTALLATIONS
The introduction of new regulations will result in an investment freeze, which will mean the inability to replace currently operating wind farms with new capacity under the same technology at the end of their operational lifetimes. When the currently operating wind farms will be shut down, substituting the supply will require replacing the dismantled turbines with new RES energy capabilities (unless there is a significant oversupply of electricity from renewable energy sources, what is not unlikely considering the ambitious objectives related to the reduction of CO2 emissions by 2050).
We assume that currently installed wind power would have been (in the event of abandoning the new regulations) replaced by new installations after 22 years of operational lifetime for installations built in the period 2005-2010 and 25 years for those built since 2011.
Decrease in the installed wind power capacity associated with termination of operational period of the current installations is shown in the chart below.

Selected Implications of the Investment Freeze in the Onshore Wind Power Sector 13 April 2016
Chart 3 Installed wind power capacity (assuming no new investments)
Source: TPA Horwath
We also assume that the replacing installations would have had the average productivity of 2 700 MWh/PLN annually. Output of the wind farms replacing currently operating installations is presented in the table below.
0
1 000
2 000
3 000
4 000
5 000
6 000
MW

Selected Implications of the Investment Freeze in the Onshore Wind Power Sector 14 April 2016
Table 5 Output of the wind farms replacing currentl y operating installations
Unit 2027 2028 2029 2030 2031 2032 2033 2034 2035 2036 2037 2038 2039 2040 2041
2030 GWh 56 112 112 112 112 112 112 112 112 112 112 112 112 112 112
2031 GWh 0 103 206 206 206 206 206 206 206 206 206 206 206 206 206
2032 GWh 0 0 138 276 276 276 276 276 276 276 276 276 276 276 276
2033 GWh 0 0 0 201 403 403 403 403 403 403 403 403 403 403 403
2034 GWh 0 0 0 0 295 590 590 590 590 590 590 590 590 590 590
2035 GWh 0 0 0 0 0 463 925 925 925 925 925 925 925 925 925
2036 GWh 0 0 0 0 0 0 0 0 0 661 1 322 1 322 1 322 1 322 1 322
2037 GWh 0 0 0 0 0 0 0 0 0 0 1 180 2 360 2 360 2 360 2 360
2038 GWh 0 0 0 0 0 0 0 0 0 0 0 961 1 922 1 922 1 922
2039 GWh 0 0 0 0 0 0 0 0 0 0 0 0 835 1 670 1 670
2040 GWh 0 0 0 0 0 0 0 0 0 0 0 0 0 741 1 482
2041 GWh 0 0 0 0 0 0 0 0 0 0 0 0 0 0 1 757
Total GWh 56 215 457 796 1 293 2 050 2 513 2 513 2 513 3 174 5 015 7 156 8 952 10 528 13 026 Source: TPA Horwath
Below is a calculation of the difference between the cost of replacing the “maturing” wind power with new capacity and replacing it with other RES technologies
Table 6 Costs of replacing wind power with other RE S technologies
2027 2028 2029 2030 2031 2032 2033 2034
Costs kPLN 6 256 24 624 53 866 97 254 163 845 270 397 336 616 336 616 Production replacing currently operating farms
GWh 56 215 457 796 1 293 2 050 2 513 2 513
LCOE wind PLN/MWh 313 310 307 304 301 298 295 292 LCOE replacement PLN/MWh 424 427 431 434 437 441 444 448
Source: TPA Horwath
2035 2036 2037 2038 2039 2040 2041 2042
Costs kPLN 336 616 448 256 766 894 1 148 659 1 480 765 1 782 562 2 281 002 2 634 985
Production replacing currently operating farms GWh 2 513 3 174 5 015 7 156 8 952 10 528 13 026 14 783
LCOE wind PLN/MWh 289 286 283 280 277 275 272 269
LCOE replacement PLN/MWh 451 455 458 462 466 470 473 477
Source: TPA Horwath
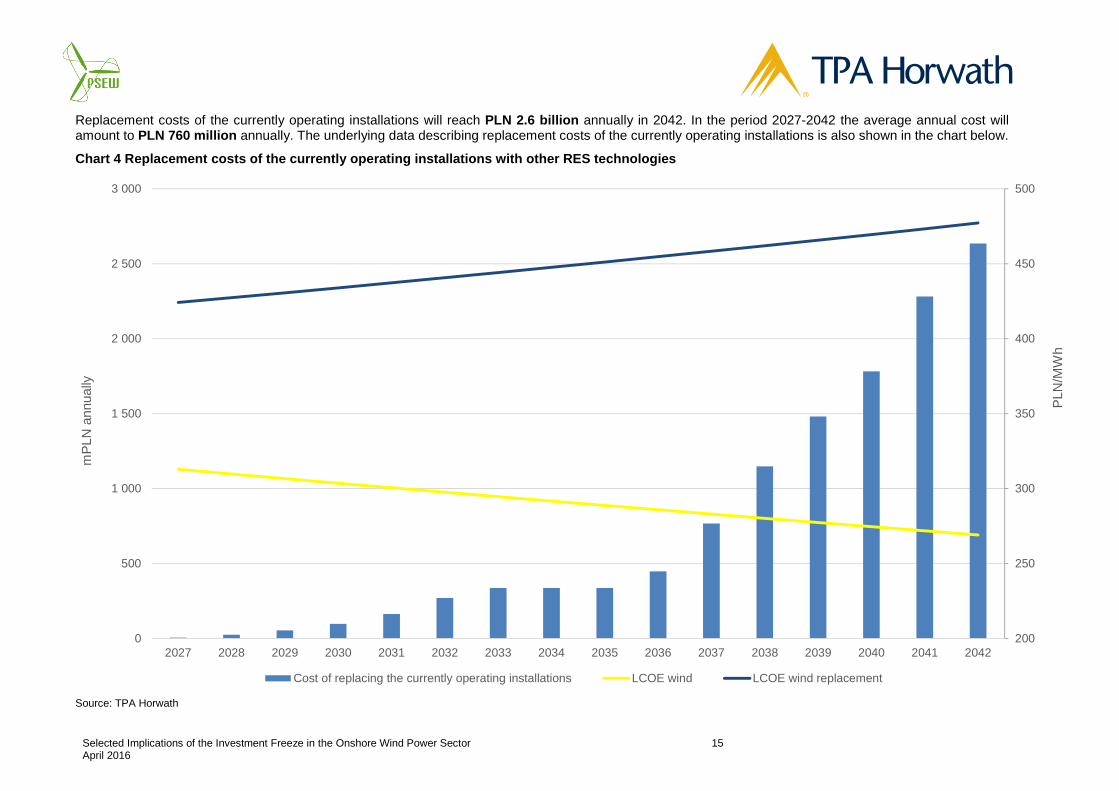
Selected Implications of the Investment Freeze in the Onshore Wind Power Sector 15 April 2016
Replacement costs of the currently operating installations will reach PLN 2.6 billion annually in 2042. In the period 2027-2042 the average annual cost will amount to PLN 760 million annually. The underlying data describing replacement costs of the currently operating installations is also shown in the chart below.
Chart 4 Replacement costs of the currently operatin g installations with other RES technologies
Source: TPA Horwath
200
250
300
350
400
450
500
0
500
1 000
1 500
2 000
2 500
3 000
2027 2028 2029 2030 2031 2032 2033 2034 2035 2036 2037 2038 2039 2040 2041 2042
PLN
/MW
h
mP
LN a
nnua
lly
Cost of replacing the currently operating installations LCOE wind LCOE wind replacement

Selected Implications of the Investment Freeze in the Onshore Wind Power Sector 16 April 2016
5. Municipality Revenues
Wind farms construction has a strong positive impact on revenues of the municipalities in which the facilities are located. In our analysis we have described the effects of the investment freeze on the tax receipts obtained from three sources – real estate tax (RET), personal income tax (PIT) and corporate income tax (CIT). We have also looked into the influence of the proposed changes on the labor market.
RECEIPTS FROM REAL ESTATE TAX
Real estate tax is local in character and as a result, revenues obtained from it are wholly allocated to municipalities budgets. According to our calculations, assuming that average total CapEx per MW is kPLN 7 310 (mEUR 1.7 x 4.3 EUR/PLN) and 30% of that amount is classified as tax base for the real estate tax, average revenues amount to kPLN 43.9 annually per 1 MW of installed capacity.
Taking into account the assumptions affiliated with the opportunity cost of new wind power for the period 2017-2019 calculated in the previous chapter, and estimated amount of revenue per 1 MW derived from the real estate tax, below we present the loss expected to be incurred by municipalities as a result of the investment freeze.
Table 7 Lost Receipts connected with real estate ta x [kPLN] on new wind farms build under the auction system
Production launch year Total annual energy output growth Capex/MW [kPLN] RET/MW
[kPLN] 2018 2019 2020 … 2041
2016 0 7 310 43.9 0 0 0 … 0 2017 0 7 310 43.9 0 0 0 … 0 2018 667 7 310 43.9 29 240 29 240 29 240 … 29 240 2019 1 111 7 310 43.9 0 48 733 48 733 … 48 733 2020 444 7 310 43.9 0 0 19 493 … 19 493
Lost revenue 29 240 77 973 97 467 … 97 467
Source: TPA Horwath The total amount of real estate tax lost in connection with investment freeze in new wind farms could reach almost PLN 1.7 billion in the period 2018 - 2041. Real estate tax receipt loss would be much more noticeable from 2030 onwards, due to the lack of replacement of the currently operating wind farms. Calculations of potential losses are shown in the table below.

Selected Implications of the Investment Freeze in the Onshore Wind Power Sector 17 April 2016
Table 8 Potential income from real estate tax deriv ed from the replacement of currently operating wind farms [kPLN] (constant prices as at 2015)
Production launch year Average power growth
Capex/MW [kPLN]
RET/MW [kPLN] 2027 2028 2029 2030 2031 2032 2033 2034
2030 42 7 310 43,9 1 827 1 827 1 827 1 827 1 827 1 827 1 827 1 827 2031 76 7 310 43,9 3 346 3 346 3 346 3 346 3 346 3 346 3 346 2032 102 7 310 43,9 4 489 4 489 4 489 4 489 4 489 4 489 2033 149 7 310 43,9 6 545 6 545 6 545 6 545 6 545 2034 219 7 310 43,9 9 583 9 583 9 583 9 583 2035 343 7 310 43,9 15 030 15 030 15 030 2036 490 7 310 43,9 2037 874 7 310 43,9 2038 712 7 310 43,9 2039 619 7 310 43,9 2040 549 7 310 43,9 2041 1 301 7 310 43,9 Lost revenue 1 827 5 172 9 661 16 206 25 790 40 820 40 820 40 820
Production launch year Average power growth
Capex/MW [kPLN]
RET/MW [kPLN] 2035 2036 2037 2038 2039 2040 2041
2030 42 7 310 43,9 1 827 1 827 1 827 1 827 1 827 1 827 1 827 2031 76 7 310 43,9 3 346 3 346 3 346 3 346 3 346 3 346 3 346 2032 102 7 310 43,9 4 489 4 489 4 489 4 489 4 489 4 489 4 489 2033 149 7 310 43,9 6 545 6 545 6 545 6 545 6 545 6 545 6 545 2034 219 7 310 43,9 9 583 9 583 9 583 9 583 9 583 9 583 9 583 2035 343 7 310 43,9 15 030 15 030 15 030 15 030 15 030 15 030 15 030 2036 490 7 310 43,9 21 474 21 474 21 474 21 474 21 474 21 474 2037 874 7 310 43,9 38 344 38 344 38 344 38 344 38 344 2038 712 7 310 43,9 31 216 31 216 31 216 31 216 2039 619 7 310 43,9 27 131 27 131 27 131 2040 549 7 310 43,9 24 074 24 074 2041 1 301 7 310 43,9 57 073 Lost revenue 40 820 62 294 100 638 131 855 158 986 183 061 240 134
Source: TPA Horwath
The annual amount of the potentially lost tax revenue is estimated to reach PLN 240 million in 2040.
The combined effects (the lack of new investments and not replacing the old ones) are shown in the chart below.

Selected Implications of the Investment Freeze in the Onshore Wind Power Sector 18 April 2016
Chart 5 Total loss of receipts of municipalities du e to the lower real estate tax paid as a result of the investment freeze Source: TPA Horwath
0
50 000
100 000
150 000
200 000
250 000
300 000
350 000
2017 2018 2019 2020 2021 2022 2023 2024 2025 2026 2027 2028 2029 2030 2031 2032 2033 2034 2035 2036 2037 2038 2039 2040 2041
kPLN
ann
ually
Property tax loss related to projects unrealized under the auction system Potential revenues from property tax after the replacement of current installations
Selected Implications of the Investment Freeze in the Onshore Wind Power Sector 19 April 2016
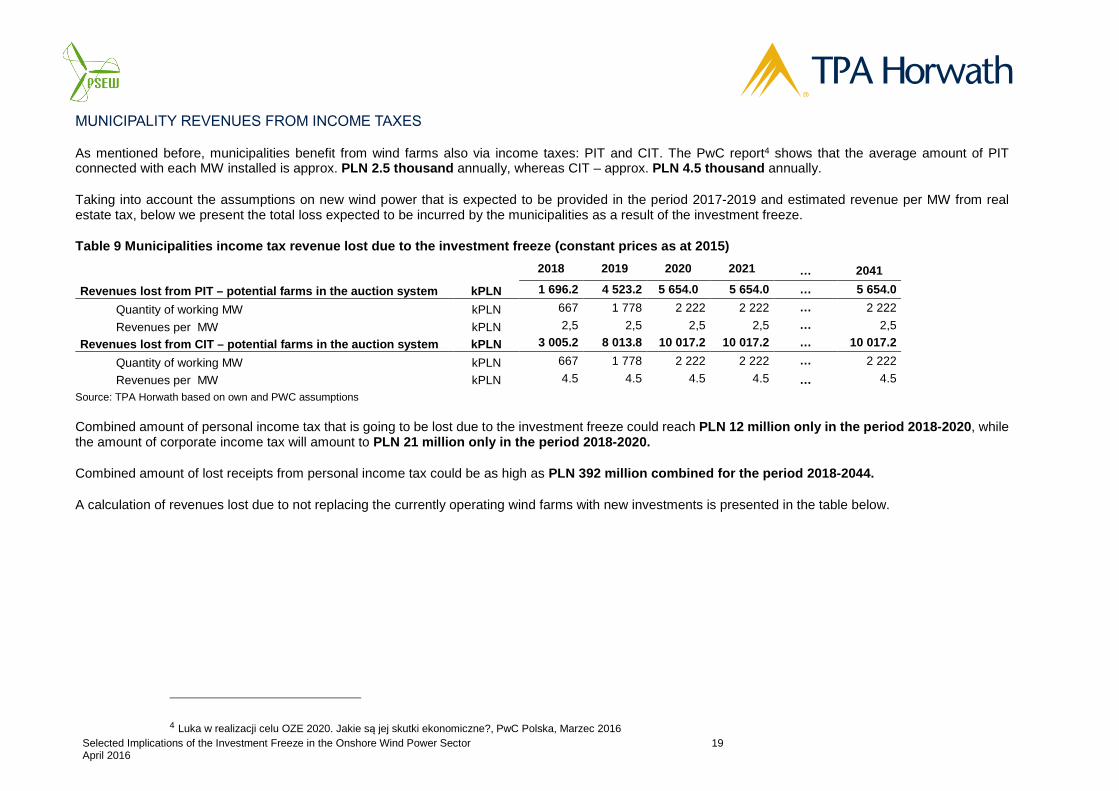
MUNICIPALITY REVENUES FROM INCOME TAXES
As mentioned before, municipalities benefit from wind farms also via income taxes: PIT and CIT. The PwC report4 shows that the average amount of PIT connected with each MW installed is approx. PLN 2.5 thousand annually, whereas CIT – approx. PLN 4.5 thousand annually.
Taking into account the assumptions on new wind power that is expected to be provided in the period 2017-2019 and estimated revenue per MW from real estate tax, below we present the total loss expected to be incurred by the municipalities as a result of the investment freeze.
Table 9 Municipalities income tax revenue lost due to the investment freeze (constant prices as at 201 5)
2018 2019 2020 2021 … 2041
Revenues lost from PIT – potential farms in the auc tion system kPLN 1 696.2 4 523.2 5 654.0 5 654.0 … 5 654.0
Quantity of working MW kPLN 667 1 778 2 222 2 222 … 2 222
Revenues per MW kPLN 2,5 2,5 2,5 2,5 … 2,5
Revenues lost from CIT – potential farms in the auc tion system kPLN 3 005.2 8 013.8 10 017.2 10 017.2 … 10 017.2
Quantity of working MW kPLN 667 1 778 2 222 2 222 … 2 222
Revenues per MW kPLN 4.5 4.5 4.5 4.5 … 4.5
Source: TPA Horwath based on own and PWC assumptions
Combined amount of personal income tax that is going to be lost due to the investment freeze could reach PLN 12 million only in the period 2018-2020 , while the amount of corporate income tax will amount to PLN 21 million only in the period 2018-2020.
Combined amount of lost receipts from personal income tax could be as high as PLN 392 million combined for the period 2018-2044.
A calculation of revenues lost due to not replacing the currently operating wind farms with new investments is presented in the table below.
4 Luka w realizacji celu OZE 2020. Jakie są jej skutki ekonomiczne?, PwC Polska, Marzec 2016

Selected Implications of the Investment Freeze in the Onshore Wind Power Sector 20 April 2016
Table 10 Municipality receipts lost due to not repl acing the currently operating wind farms
2027 2028 2029 2030 2031 2032 2033 2034 2035 2036 2037 2038 2039 2040 2041 Wind farm power launched in 2030 [MW] 42 42 42 42 42 42 42 42 42 42 42 42 42 42 42 Wind farm power launched in 2031 [MW] 0 76 76 76 76 76 76 76 76 76 76 76 76 76 76 Wind farm power launched in 2032 [MW] 0 0 102 102 102 102 102 102 102 102 102 102 102 102 102 Wind farm power launched in 2033 [MW] 0 0 0 149 149 149 149 149 149 149 149 149 149 149 149 Wind farm power launched in 2034 [MW] 0 0 0 0 219 219 219 219 219 219 219 219 219 219 219 Wind farm power launched in 2035 [MW] 0 0 0 0 0 343 343 343 343 343 343 343 343 343 343 Wind farm power launched in 2036 [MW] 0 0 0 0 0 0 0 0 0 490 490 490 490 490 490 Wind farm power launched in 2037 [MW] 0 0 0 0 0 0 0 0 0 0 874 874 874 874 874 Wind farm power launched in 2038 [MW] 0 0 0 0 0 0 0 0 0 0 0 712 712 712 712 Wind farm power launched in 2039 [MW] 0 0 0 0 0 0 0 0 0 0 0 0 619 619 619 Wind farm power launched in 2040 [MW] 0 0 0 0 0 0 0 0 0 0 0 0 0 549 549 Wind farm power launched in 2041 [MW] 0 0 0 0 0 0 0 0 0 0 0 0 0 0 1 301 Total installed capacity 42 118 220 370 588 931 931 931 931 1 420 2 295 3 006 3 625 4 174 5 475
PIT income on MW [PLN] 2.5 2.5 2.5 2.5 2.5 2.5 2.5 2.5 2.5 2.5 2.5 2.5 2.5 2.5 2.5 PIT income loss [kPLN] 106.0 300.0 560.5 940.1 1 496.0 2 367.9 2 367.9 2 367.9 2 367.9 3 613.6 5 838.0 7 648.8 9 222.7 10 619.3 13 930.0
CIT income on MW [PLN] 4.5 4.5 4.5 4.5 4.5 4.5 4.5 4.5 4.5 4.5 4.5 4.5 4.5 4.5 4.5 CIT income loss [kPLN] 187.7 531.6 993.0 1 665.6 2 650.6 4 195.3 4 195.3 4 195.3 4 195.3 6 402.3 10 343.2 13 551.5 16 339.9 18 814.2 24 679.9 Total income loss [kPLN] 293.7 831.6 1 553.4 2 605.7 4 146.6 6 563.2 6 563.2 6 563.2 6 563.2 10 015.9 16 181.2 21 200.3 25 562.6 29 433.4 38 609.9
Source: TPA Horwath based on own and PWC assumptions
Municipality tax receipt losses from PIT and CIT in 2015 constant prices could amount to, respectively, approx. PLN 14 million and PLN 25 million annually since 2041.
The summary of income tax losses is presented in the chart below.
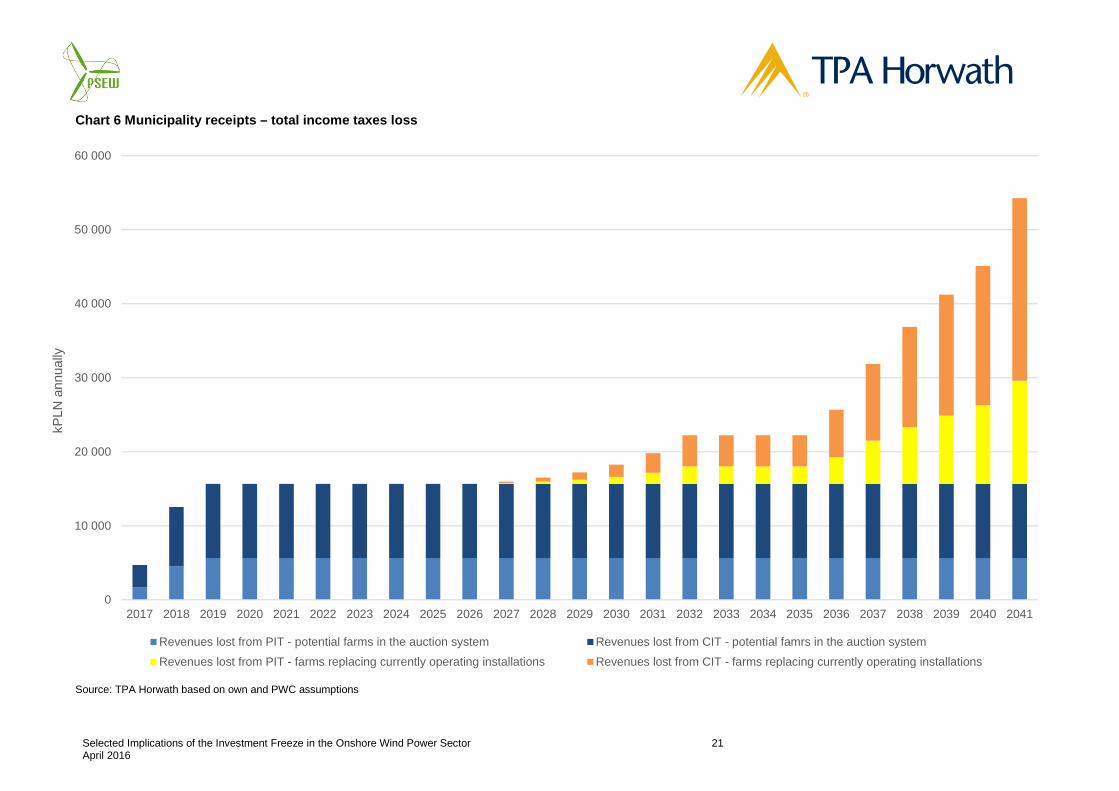
Selected Implications of the Investment Freeze in the Onshore Wind Power Sector 21 April 2016
Chart 6 Municipality receipts – total income taxes loss
Source: TPA Horwath based on own and PWC assumptions
0
10 000
20 000
30 000
40 000
50 000
60 000
2017 2018 2019 2020 2021 2022 2023 2024 2025 2026 2027 2028 2029 2030 2031 2032 2033 2034 2035 2036 2037 2038 2039 2040 2041
kPLN
ann
ually
Revenues lost from PIT - potential farms in the auction system Revenues lost from CIT - potential famrs in the auction system
Revenues lost from PIT - farms replacing currently operating installations Revenues lost from CIT - farms replacing currently operating installations

Selected Implications of the Investment Freeze in the Onshore Wind Power Sector 22 April 2016
6. Employment in the Sector
The below estimates of the impact of the investment freeze in the wind energy sector in Poland are based on the analysis by the Warsaw Institute of Economic Studies – “Wind power sector impact on the Polish labor market”5. As is estimated in the report, construction of every new 10 MW of wind power requires creating 39 directly affiliated jobs (114 jobs in total), whereas each 10 MW of operating wind farms requires 2 directly affiliated jobs (5 in total).
Based on this research, below we present our assessment of the impact of the investment freeze on the jobs that could have been created as a result of constructing and operating new wind farms under the auction system.
Table 11 Jobs not created due to the investment fre eze in the auction system
2018 2019 2020 2021 … 2041
Related to construction 7 600 12 667 5 067 0 … 0 Directly 2 600 4 333 1 733 0 … 0
per MW 4 4 4 4 … 4 Quantity of constructed MW 667 1 111 444 0 … 0
Indirectly 5 000 8 333 3 333 0 … 0 per MW 8 8 8 8 … 8 Quantity of constructed MW 667 1 111 444 0 … 0
After the construction period 333 889 1 111 1 111 … 1 111 Directly 133 356 444 444 … 444
per MW 0 0 0 0 … 0 Quantity of operating MW 667 1 778 2 222 2 222 … 2 222
Indirectly 200 533 667 667 … 667 per MW 0 0 0 0 … 0 Quantity of operating MW 667 1 778 2 222 2 222 … 2 222
Total 7 933 13 556 6 178 1 111 … 1 111 Source: TPA Horwath based on own and WISE assumptions
The above table presents temporary jobs associated with wind farm construction, amounting to over 12.7 thousand during the construction period, as well as permanent jobs (both technical and administrative) tied with operations of almost 1 100.
5 Wpływ energetyki wiatrowej na polski rynek pracy, Warszawski Instytut Studiów Ekonomicznych

Selected Implications of the Investment Freeze in the Onshore Wind Power Sector 23 April 2016
The analysis should also consider job loss that would occur as a result of the lack of future replacement of currently operating wind farms. Calculations of the overall amount of temporary jobs that are expected to be affected by this process are presented in the table below.
Table 12 Temporary jobs lost due to the lack of replacement of currently operating wind farms
2027 2028 2029 2030 2031 2032 2033 2034 2035 2036 2037 2038 2039 2040 2041
Directly 162 297 399 582 852 1 336 0 0 0 1 909 3 410 2 776 2 413 2 141 5 075 per MW 4 4 4 4 4 4 4 4 4 4 4 4 4 4 4 Quantity of constructed MW 42 76 102 149 219 343 0 0 0 490 874 712 619 549 1 301
Indirectly 312 572 768 1 119 1 639 2 570 0 0 0 3 672 6 557 5 338 4 639 4 117 9 759 per MW 8 8 8 8 8 8 8 8 8 8 8 8 8 8 8 Quantity of constructed MW 42 76 102 149 219 343 0 0 0 490 874 712 619 549 1 301
Total 475 870 1 167 1 701 2 491 3 907 0 0 0 5 581 9 966 8 114 7 052 6 257 14 834 Source: TPA Horwath based on own and WISE assumptions
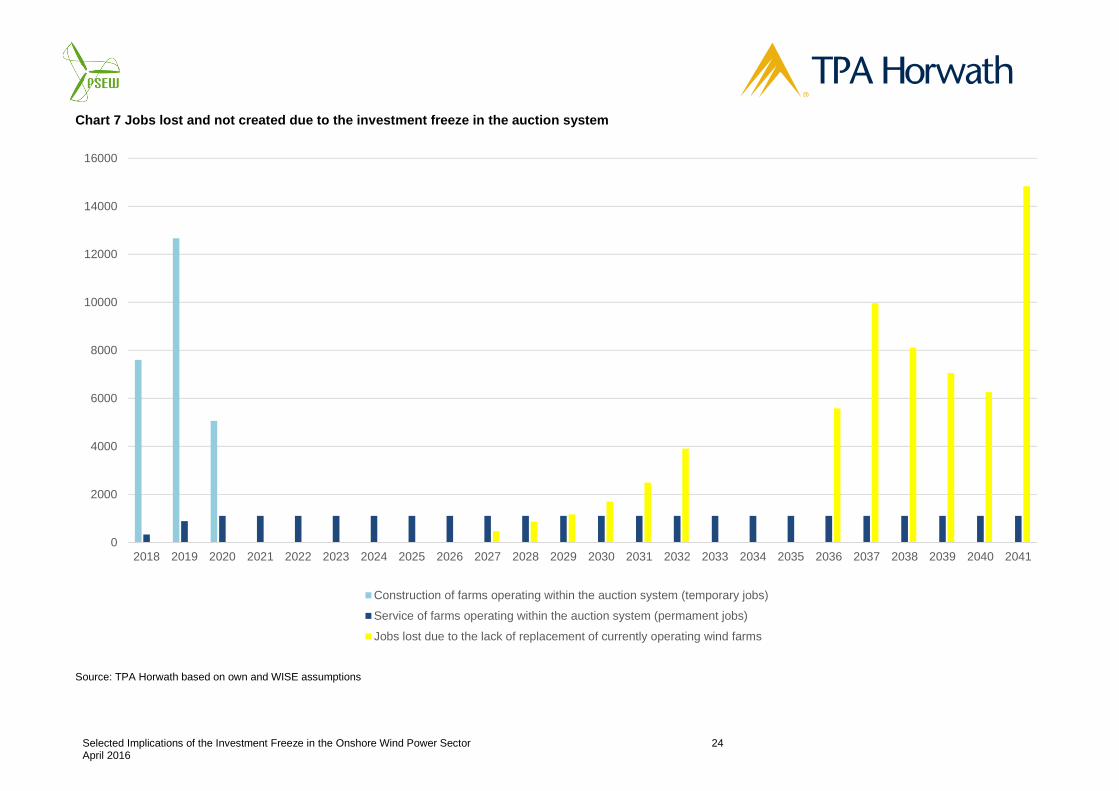
The number of temporary jobs lost due to the lack of replacement of currently operating wind farms could amount to almost 15 thousand in the year 2041. This process has been visualized in the chart below.
Selected Implications of the Investment Freeze in the Onshore Wind Power Sector 24 April 2016
Chart 7 Jobs lost and not created due to the invest ment freeze in the auction system
Source: TPA Horwath based on own and WISE assumptions
0
2000
4000
6000
8000
10000
12000
14000
16000
2018 2019 2020 2021 2022 2023 2024 2025 2026 2027 2028 2029 2030 2031 2032 2033 2034 2035 2036 2037 2038 2039 2040 2041
Construction of farms operating within the auction system (temporary jobs)
Service of farms operating within the auction system (permament jobs)
Jobs lost due to the lack of replacement of currently operating wind farms

Selected Implications of the Investment Freeze in the Onshore Wind Power Sector 25 April 2016
The last category associated with employment in the wind energy sector are people working permanently at the currently operating wind farm companies, who would lose their jobs due to the lack of replacement of currently operating installations. A calculation of the estimated scale of the process is presented below.

Selected Implications of the Investment Freeze in the Onshore Wind Power Sector 26 April 2016
Table 13 Permanent jobs lost due to the lack of replacement of currently operating wind farms (annually)
2027 2028 2029 2030 2031 2032 2033 2034 2035 2036 2037 2038 2039 2040 2041
Directly -8 -15 -20 -30 -44 -69 0 0 0 -98 -175 -142 -124 -110 -260 per MW 0 0 0 0 0 0 0 0 0 0 0 0 0 0 0 Deactivated farms (MW) -42 -76 -102 -149 -219 -343 0 0 0 -490 -874 -712 -619 -549 -1 301
Indirectly -12 -23 -31 -45 -66 -103 0 0 0 -147 -262 -214 -186 -165 -390 per MW 0 0 0 0 0 0 0 0 0 0 0 0 0 0 0 Deactivated farms (MW) -42 -76 -102 -149 -219 -343 0 0 0 -490 -874 -712 -619 -549 -1 301
Total -21 -38 -51 -75 -109 -171 0 0 0 -245 -437 -356 -309 -274 -651
Source: TPA Horwath based on own and WISE assumptions
The cumulative number of jobs expected to be eliminated in the period 2030-2041 is presented in the table below.
Table 14 Permanent jobs lost due to the lack of replacement of currently operating wind farms farm (accumulated ) 2027 2028 2029 2030 2031 2032 2033 2034 2035 2036 2037 2038 2039 2040 2041
Directly accumulated -9 -24 -44 -74 -118 -186 -186 -186 -186 -284 -459 -601 -725 -835 -1 095 Indirectly accumulated -12 -35 -66 -111 -176 -279 -279 -279 -279 -426 -688 -902 -1 087 -1 252 -1 643 Total jobs accumulated -21 -59 -110 -185 -294 -465 -465 -465 -465 -710 -1 147 -1 503 -1 812 -2 087 -2 738
Source: TPA Horwath based on own and WISE assumptions
According to our estimates, one can expect over 2700 permanent jobs to be eliminated during the analyzed period as a result of the investment freeze. The exact pace of the process is also shown in the chart below.

Selected Implications of the Investment Freeze in the Onshore Wind Power Sector 27 April 2016
Chart 8 Permanent jobs lost or not created due to t he investment freeze in the wind energy sector
Source: TPA Horwath based on own and WISE assumptions
0
200
400
600
800
1 000
1 200
1 400
1 600
1 800
2027 2028 2029 2030 2031 2032 2033 2034 2035 2036 2037 2038 2039 2040 2041
Jobs lost indirectly (annually) Jobs lost indirectly (annually) Jobs lost indirectly (accumulated) Jobs lost directly (accumulated)