Embed Size (px)
Citation preview

Bryanston Resources AG * Bahnhofsplatz * 6300 Zug * Switzerland
Selected future demand trends as stimulation to mining investments MINEX Astana conference
March 2015
Draft – For discussion only

1 Copyright: Bryanston
Draft – For discussion only
China is a key player in global demand for major Kazakhstan commodities
Export of Kazakhstan commodities
15,6
18,9
21,3
44,7
29,0
Aluminium
Iron ore
Thermal coal incl. lignite
Zinc
Ferroalloys 136,9
Refined copper and copper alloys 169,0
Copper ore
Top positions of Kazakhstan commodities export (metals & minerals), Dec 2014, Mio. USD
Structure of the global demand
Source: Custom statistics Kazakhstan, Department of Industry and Science Australia, US Geological survey, Bryanston research
48%
66%
44%
49%
66%
72%
46%
34%
28%
54%
52%
51%
34%
56%
China Rest of the world
2014, estimation

2 Copyright: Bryanston
Draft – For discussion only
Traditional China commodity demand challenged by growth slowdown and industry restructuring
Recent trends in the China economy Internal issues in Chinese heavy industries
7,3
7,3
7,57,47,7
13,3
16,817,7
13,517,6
4,0
7,9
17,3
20,3
12,3
-0,8
3,9
7,3
20
10
25
5
15
0
4Q 2014 1Q 2014 2Q 2014 4Q 2013 3Q 2014
1,6
Real GDP Fixed assets investments
Real estate, dwellings Cement production Profits
Utilization
Pollution
Energy demand
GDP growth rate is stable and relatively high, but investments and construction (with related
industries, i.e. cement) decelerated recently
Growth rate,%, year-to-year
Traditional resource consuming industries, such as steel production, coal generation, etc. are under restructuring
& consolidation now
Source: Australian Government, Department of Industry and Science, International steel Association, Bryanston research
• >40% steel plants are making losses • Average steel companies having up to
70% debt ratio
• Utilization rate in steel industry is ~4% lower than global
• ~180-240 Mt of idled steel capacities
• More than 70% of steel plants’ sewage facilities in North China do not meet the national standard
• Energy consumption gap between advanced and outdated capacity, is up to 300 kg/t equalized standard coal
Steel industry examples

3 Copyright: Bryanston
Draft – For discussion only
As a result, China raw materials consumption will shift to more sophisticated “China 2.0“ commodities
Construction Machinery Automotive Aviation High tech industrial
• Iron ore
• Coal
• Chrome
• Titan
• Tungsten
• Nickel
• Aluminum
• Titan
• Gallium
• Germanium
• REE1
1. REE – Rare Earth Elements Source: Bryanston
• Iron ore
• Aluminum
• Platinum
Driving sector
Com-modities
Stages of China
economy develop-
ment

4 Copyright: Bryanston
Draft – For discussion only
Commodity Food/ packaging
Steel/ Construction
Other processing/ Electricity
High tech industrial
Electronics/ other high
tech
Mercury
PGM
Beryllium
Molybden
Vanadium
Indium
Tungsten
Lead
Tin
Cobalt
Germanium
Gallium
Arsenic
REE
Commodity Food/ packaging
Steel/ Construction
Other processing/ Electricity
High tech industrial
Electronics/ other high
tech
Alumina
Iron ore
Magnesium
Zinc
Coal
Silicon
Manganese
Chrome
Copper
Nickel
Uranium
Titanium
Bismuth
Silver
Source: Bryanston Research
Main application in “1.0 industries”
China 1.0 China 2.0 China 1.0 China 2.0
Deep industry demand analysis can discern “China 1.0” and “China 2.0” commodities
Secondary application in “1.0 industries”
Main application in “2.0 industries”
Secondary application in “2.0 industries”
Special steels production: wear-
resistant, stainless, etc.
Aviation and space industry consumption
Indicative
Significant resource base in Kazakhstan

5 Copyright: Bryanston
Draft – For discussion only
Kazakhstan holds significant resources of chrome, copper, and other commodities with “China 2.0” implications
Commodity Global supply/demand forecast Kazakhstan resources,
Mt ore
Share in world resources, %1
Chrome • Demand is to grow together with
global stainless steel demand, oversupply is to move into balance by 2018
369 10%
Copper • China is the biggest consumer of
copper, surplus on the market now with deficit re-emerging from 2016
38 5%
Manganese • Demand is to grow driven by both
ordinary and special steels production in China, oversupply is to move into balance by 2019
688 5%
Tungsten • Demand is to grow driven by China • Supply scarcity due to China limits
on export (~60% of world reserves) 2 ~0.5%
Titanium • Titan demand is forecasted to grow
faster than supply with China/Pacific markets being the main drivers
24 ~0.2%
Tin • Demand is to grow fuelled by
growth in electronics • Supply is to decrease from 2017
0.07 <0.01%
1) Share of Kazakhstan in pure metal content Source: State mining exploration program of Kazakhstan Republic for 2015-2019, US Geological Survey, Bryanston Research
Ti Cr
Mn Mn Cu Cu
W
W W
Cu
Ti
W Tungsten
Ti Titanium
Mn Manganese
Cu Copper
Chrome
“China 2.0” on Kazakhstan map
Cr
Tin
Indicative
Cu
Cu Cu
Sn
Sn
Cr
Cr
6 Copyright: Bryanston
Draft – For discussion only
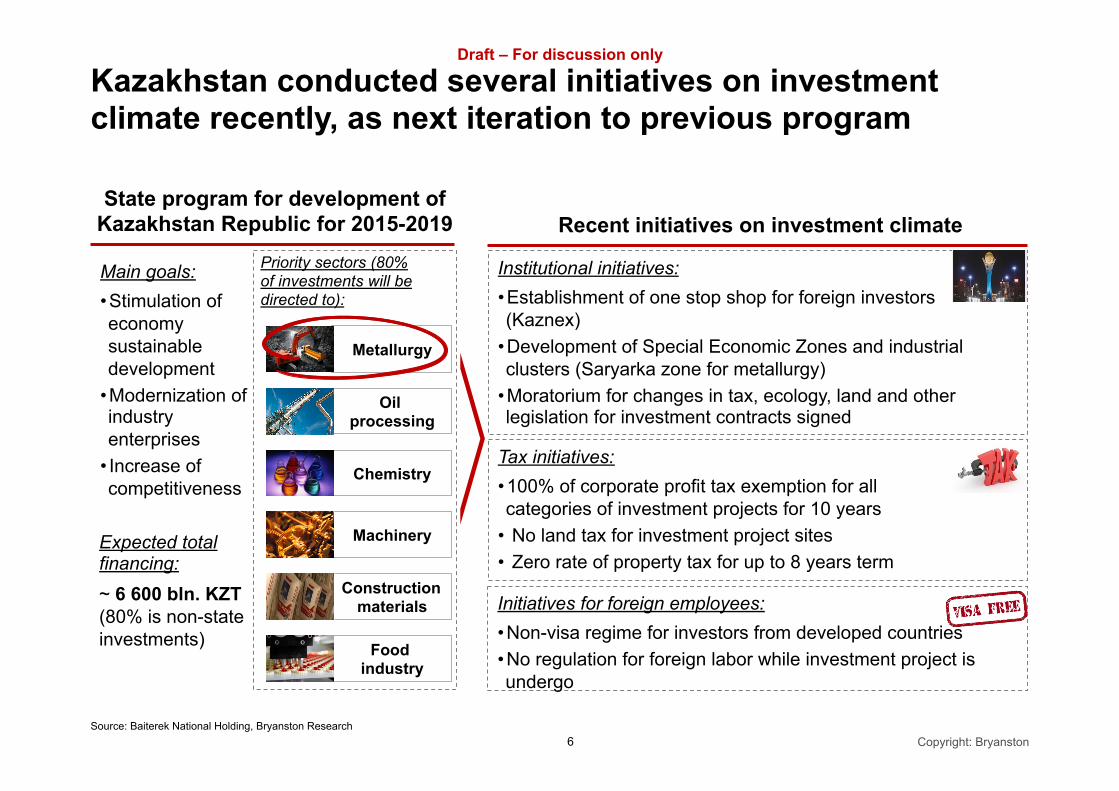
Kazakhstan conducted several initiatives on investment climate recently, as next iteration to previous program
State program for development of Kazakhstan Republic for 2015-2019 Recent initiatives on investment climate
Tax initiatives: • 100% of corporate profit tax exemption for all categories of investment projects for 10 years
• No land tax for investment project sites • Zero rate of property tax for up to 8 years term
Institutional initiatives: • Establishment of one stop shop for foreign investors (Kaznex)
• Development of Special Economic Zones and industrial clusters (Saryarka zone for metallurgy)
• Moratorium for changes in tax, ecology, land and other legislation for investment contracts signed
Initiatives for foreign employees: • Non-visa regime for investors from developed countries • No regulation for foreign labor while investment project is undergo
Priority sectors (80% of investments will be directed to):
Main goals: • Stimulation of economy sustainable development
• Modernization of industry enterprises
• Increase of competitiveness
Expected total financing: ~ 6 600 bln. KZT (80% is non-state investments)
Construction materials
Metallurgy
Food industry
Machinery
Chemistry
Oil processing
Source: Baiterek National Holding, Bryanston Research

7 Copyright: Bryanston
Draft – For discussion only
Bryanston is active in principal investments, advisory and consulting in natural resources
Source: Bryanston
Bryanston Capital
Bryanston Advisory
Bryanston Consulting
Ø Principal investments in raw materials
Ø Principal investments in mining tech-nology / services
Ø Active portfolio management
Ø Fund management
Ø Opportunity origination and due diligence
Ø Financial Advisory / fund raising
Ø Value-in use and commercial excellence
Ø Strategy and operations
Ø Transformation & turnaround
Ferrous Coal Minerals Agriculture Non –
ferrous
BRYANSTON HOLDING
Oil & Gas

8 Copyright: Bryanston
Draft – For discussion only
We have a global presence and can draw on international experience and best practice benchmarks
Bryanston is the fastest growing firm in its space – app. 100 employees are serving clients globally
Opening 2015 Recent projects
Existing offices
Western Africa
North America
South America
Southern Africa
ANZ
South East Asia
Europe
Asia
London
Zug
Tel Aviv
Lagos
Johannesburg
Shanghai
Moscow
Rio de Janeiro
New Delhi
Perth
Munich
Singapore
Toronto
Harare

9 Copyright: Bryanston
Draft – For discussion only
… Coking Coal Steel
We regularly conduct bottom-up market balance, trade flow as well as price & cost analyses for key commodities
Ø Seaborne price forecast in 5 years
Ø Regional price forecast in 5 years given the transport cost
Ø Supply-demand impact on price
Ø Key cost components in operations
Ø Cash cost curves analytics
Ø Comparison with cash cost curves for new projects
Ø Global supply-demand ba-lance development in 5 years
Ø Key global & regional trends in the selected countries
Ø New projects in supply and demand
Ø Overview of key exporting and importing countries
Ø Analysis of exported and imported volumes
Ø Supply-demand balance impact on trade flows
Trade flows Price forecast
Bryanston global commodity competence
center
Cost analysis
Thermal Coal
Supply-demand + + +
36Copyright: Bryanston
China supply & demand balance: China imports will further increase driven by demand from the regions
Thermal coal demand and change of shares
2018e2017e2016e2015e2014e2013e
Local demandLocal supply
Thermal coal supply and demand balance
Supply & demand difference
- x - x - x - x - x
x
- x
In Mt
Source: SXcoal; WorldBank; Bryanston Research; JP Morgan report 2012
Demand potential for Russian TC import exists in coastal provinces and northeast China
In Mt
2013 2018e2015e 2017e2014e 2016e
ChemicalCementPower
MetallurgicalCivil useTransportation
Industrial BoilerOthers
.
40Copyright: Bryanston
Country profile: Germany Total coal-fired PPs capacity reach X GW
Sources: Bundesnetzagentur; Bryanston Research, Bryanston global thermal coal production and consumption data base
Capacities are split between lignite and steam coal almost equally, each accounting for X GW
PPs are usually situated near local coal deposits to leverage the local supply
# Plant Capacity [GW]1 Niederaußem2 KW Jänschwalde3 Boxberg4 Neurath5 Scholven6 GKM 7 Schwarze Pumpe8 Frimmersdorf9 KW Voerde10 Staudinger11 BoA 312 BoA 213 Heilbronn14 Schkopau15 Lippendorf-116 Lippendorf-217 Heyden18 KW Herne
Other on steam coalOther on lignite
Major coal-fired power plants in Germany
5
2
311
8
6
7
12
1
10
9
18
Ruhr deposit
13
14 15
16
17
4
Steam coal PP
Lignite PP
Hard
Brown
GW
34Copyright: Bryanston
Increase in capacity, driven by Turkey, will lead to increase of import of thermal coal in Europe
New
2012
Phase-out
- X %
2018
Retirements outweigh new capacities in EU, but is balanced by Turkey race for power Coal demand supply balance in 2012–18
Thermal coal-fired PPs capacity changes (2012-2018) [GW]
• Turkey has x GW pipeline for new coal-fired PPs that may be challenged by regulation if country adopts EU environmental regulations
• Poland will undergo replacement program building more efficient PPs, while largely phasing-out old ones
• Germany will import more steam coal, since most new PPs are efficient steam-coal ones
• Industrial Emissions Directive is likely to trigger retirements of some coal-fired power plants, especially in the leading coal-consuming countries
Thermal coal demand-supply forecast in OECD EU [Mt.]
Source: IEA; Annual reports of European utilities companies; Bryanston global thermal coal production and consumption data base and research
2012 2018
34Copyright: Bryanston
China Import: China became a net importer in 2009 and will approach pure import status in the future
OthersColombiaCanada
MongoliaUSA
RussiaS. Africa
IndonesiaAustralia
1009
38
+ x %
131211
51
Imports of thermal coal in China by source [Mt]
Source: SXCoal, National bureau of statistics, Bryanston Research
Note: Lignite is not included in the thermal coal imports
Major importing provinces in China (>1Mt in 2012)
OthersTaiwanS.KoreaJapan
- x %
1312111009
Exports of thermal coal in China by destination [Mt]
TC Import routes TC Export routes
10 Copyright: Bryanston
Draft – For discussion only
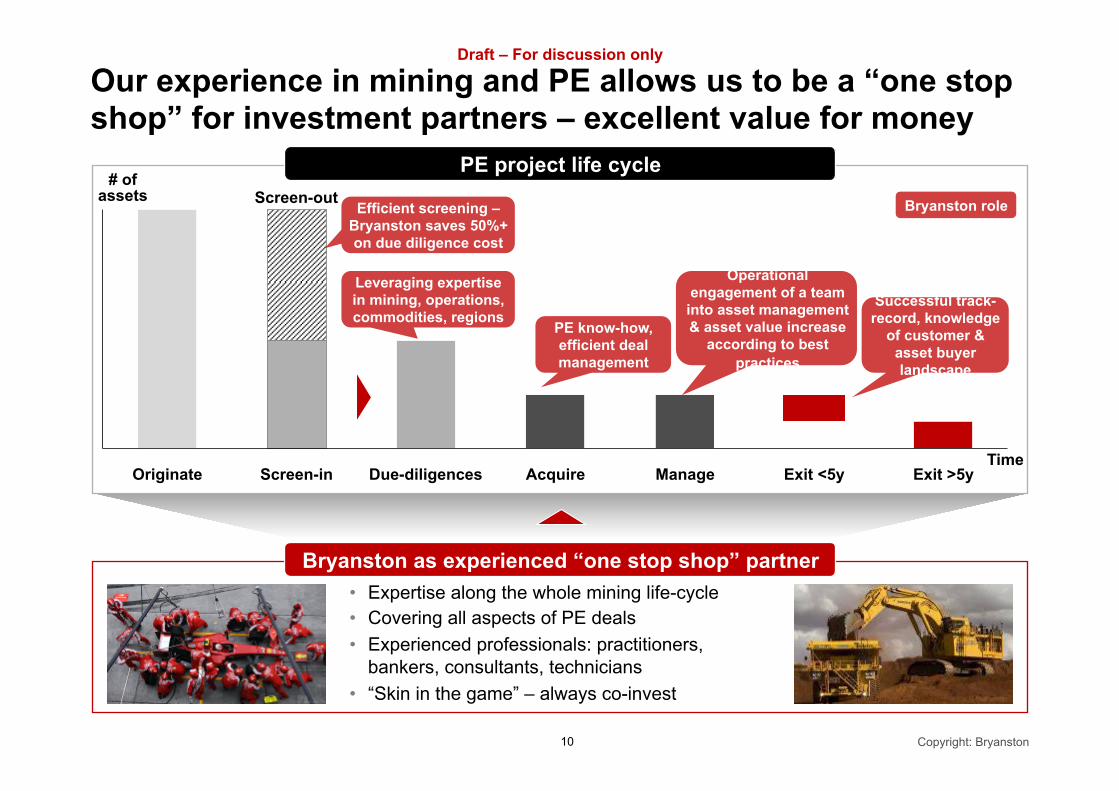
Our experience in mining and PE allows us to be a “one stop shop” for investment partners – excellent value for money
• Expertise along the whole mining life-cycle • Covering all aspects of PE deals • Experienced professionals: practitioners,
bankers, consultants, technicians • “Skin in the game” – always co-invest
PE project life cycle
Exit >5y Manage Exit <5y Acquire Due-diligences Screen-in
Screen-out
Originate
# of assets
Bryanston as experienced “one stop shop” partner
Time
Leveraging expertise in mining, operations, commodities, regions
PE know-how, efficient deal management
Efficient screening – Bryanston saves 50%+ on due diligence cost
Successful track-record, knowledge
of customer & asset buyer landscape
Operational engagement of a team
into asset management & asset value increase
according to best practices
Bryanston role