Embed Size (px)
Citation preview
Selected Financial Informationunder Japanese GAAP
For the Fiscal Year Ended March 31, 2004
Mitsubishi Tokyo Financial Group, Inc.
1 Consolidated Financial Highlights under Japanese GAAP for the Fiscal Year Ended March 31, 2004
1.Financial Results [Consolidated] 12. Valuation Differences on Securities [Consolidated] , [Trust] 23. Risk-Adjusted Capital Ratio Based on the Standards of the BIS [Consolidated] 34. Return on Equity [Consolidated] 3
2 Loan Portfolio and Other
1. Risk-Monitored Loans [Consolidated] , [Trust] 4 [Consolidated and Trust]
2. Classification of Risk-Monitored Loans [Consolidated] , [Trust] 53. Allowance for Loan Losses [Consolidated] , [Trust] 64. Coverage Ratio against Risk-Monitored Loans [Consolidated] 65. Disclosed Claims under the Financial Reconstruction Law (the ”FRL”) [Total of the 2 Banks*] 76. Status of Secured Coverage on Disclosed Claims under the FRL [Total of the 2 Banks*] 77. Progress in the Disposal of Problem Assets [Total of the 2 Banks*] 88. Classification of Loans by Type of Industry [Total of the 2 Banks*] 12
[Trust]
9. Foreign Loans [Total of the 2 Banks*] 1410. Loans and Deposits [Total of the 2 Banks*] 1511. Domestic Deposits [Total of the 2 Banks*] 1512. Number of Employees [Total of the 2 Banks*] 1513. Number of Offices [Total of the 2 Banks*] 1514. Status of Deferred Tax Assets [Total of the 2 Banks*] 1615. Employees' Retirement Benefits [Consolidated] 1816. Earning Projections for the Fiscal Year Ending March 31, 2005 [Consolidated] 19
[Non-Consolidated]
Note: * "Total of the 2 Banks" stands for the aggregated non-consolidated figures of The Bank of Tokyo-Mitsubishi, Ltd. and The Mitsubishi Trust and Banking Corporation.
[Contents]
Mitsubishi Tokyo Financial Group, Inc.
1 Consolidated Financial Highlights under Japanese GAAP for the Fiscal Year Ended March 31, 2004
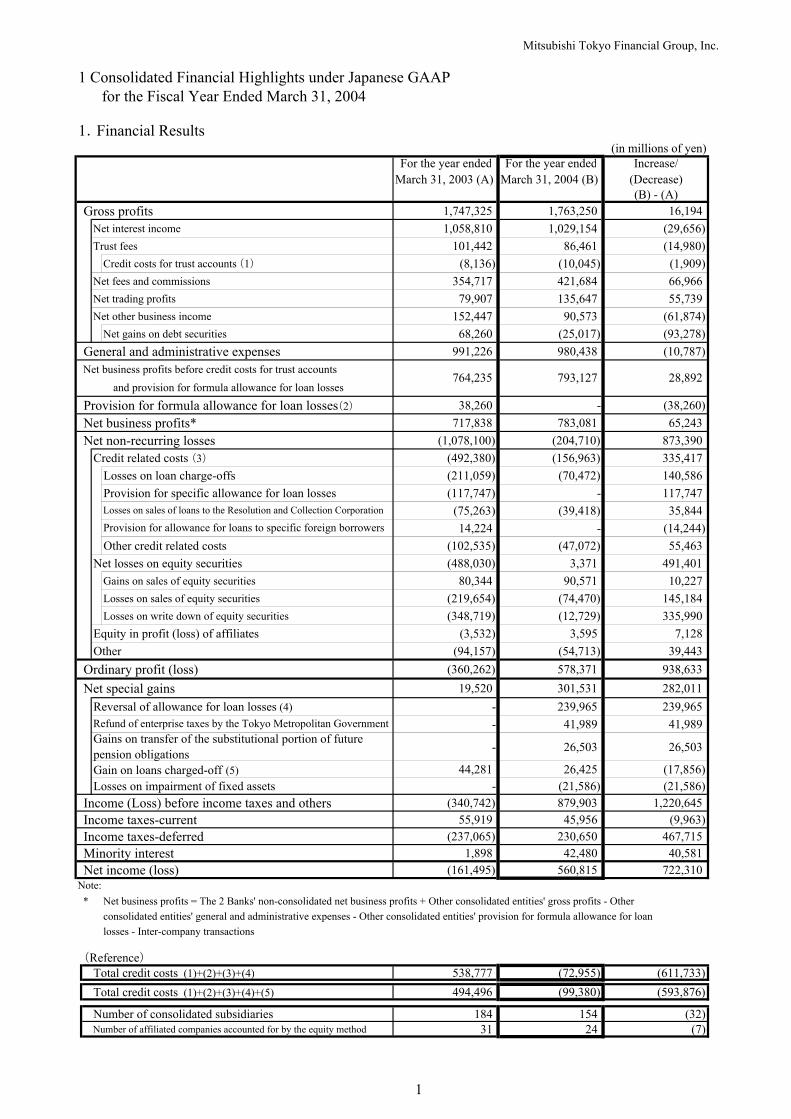
1.Financial Results(in millions of yen)
For the year ended For the year ended Increase/March 31, 2003 (A) March 31, 2004 (B) (Decrease)
(B) - (A)Gross profits 1,747,325 1,763,250 16,194
Net interest income 1,058,810 1,029,154 (29,656)Trust fees 101,442 86,461 (14,980)
Credit costs for trust accounts (1) (8,136) (10,045) (1,909)Net fees and commissions 354,717 421,684 66,966 Net trading profits 79,907 135,647 55,739 Net other business income 152,447 90,573 (61,874)
Net gains on debt securities 68,260 (25,017) (93,278)General and administrative expenses 991,226 980,438 (10,787)Net business profits before credit costs for trust accounts
and provision for formula allowance for loan losses
Provision for formula allowance for loan losses(2) 38,260 - (38,260)Net business profits* 717,838 783,081 65,243 Net non-recurring losses (1,078,100) (204,710) 873,390
Credit related costs (3) (492,380) (156,963) 335,417 Losses on loan charge-offs (211,059) (70,472) 140,586 Provision for specific allowance for loan losses (117,747) - 117,747
(75,263) (39,418) 35,844 14,224 - (14,244)
Other credit related costs (102,535) (47,072) 55,463 Net losses on equity securities (488,030) 3,371 491,401
Gains on sales of equity securities 80,344 90,571 10,227 Losses on sales of equity securities (219,654) (74,470) 145,184 Losses on write down of equity securities (348,719) (12,729) 335,990
Equity in profit (loss) of affiliates (3,532) 3,595 7,128 Other (94,157) (54,713) 39,443
Ordinary profit (loss) (360,262) 578,371 938,633 Net special gains 19,520 301,531 282,011
Reversal of allowance for loan losses (4) - 239,965 239,965 - 41,989 41,989
- 26,503 26,503
Gain on loans charged-off (5) 44,281 26,425 (17,856)Losses on impairment of fixed assets - (21,586) (21,586)
Income (Loss) before income taxes and others (340,742) 879,903 1,220,645 Income taxes-current 55,919 45,956 (9,963)Income taxes-deferred (237,065) 230,650 467,715 Minority interest 1,898 42,480 40,581 Net income (loss) (161,495) 560,815 722,310
* Net business profits = The 2 Banks' non-consolidated net business profits + Other consolidated entities' gross profits - Other consolidated entities' general and administrative expenses - Other consolidated entities' provision for formula allowance for loanlosses - Inter-company transactions
(Reference)Total credit costs (1)+(2)+(3)+(4) 538,777 (72,955) (611,733)Total credit costs (1)+(2)+(3)+(4)+(5) 494,496 (99,380) (593,876)
Number of consolidated subsidiaries 184 154 (32)Number of affiliated companies accounted for by the equity method 31 24 (7)
764,235 28,892
Note:
Losses on sales of loans to the Resolution and Collection Corporation
793,127
Provision for allowance for loans to specific foreign borrowers
Refund of enterprise taxes by the Tokyo Metropolitan GovernmentGains on transfer of the substitutional portion of futurepension obligations
1
Mitsubishi Tokyo Financial Group, Inc.
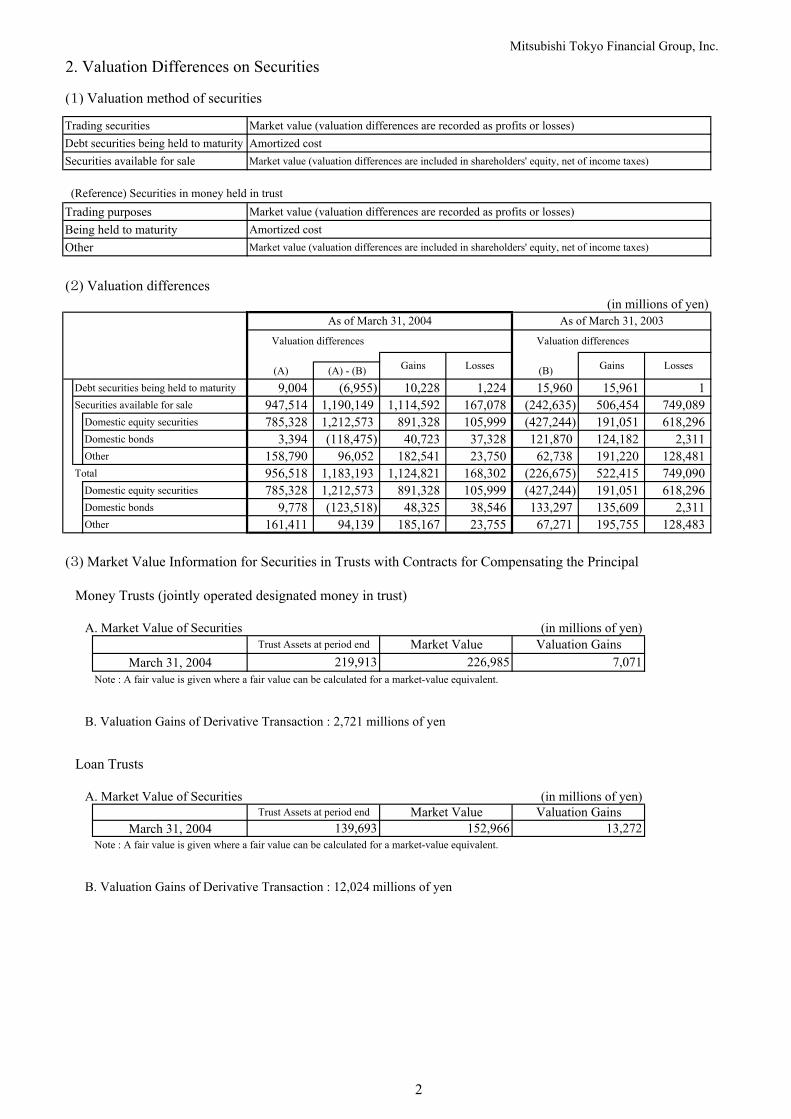
2. Valuation Differences on Securities
(1) Valuation method of securities
Trading securities Market value (valuation differences are recorded as profits or losses)Debt securities being held to maturity Amortized costSecurities available for sale Market value (valuation differences are included in shareholders' equity, net of income taxes)
(Reference) Securities in money held in trustTrading purposes Market value (valuation differences are recorded as profits or losses)Being held to maturity Amortized costOther Market value (valuation differences are included in shareholders' equity, net of income taxes)
(2) Valuation differences(in millions of yen)
(A) (A) - (B) (B)Debt securities being held to maturity 9,004 (6,955) 10,228 1,224 15,960 15,961 1 Securities available for sale 947,514 1,190,149 1,114,592 167,078 (242,635) 506,454 749,089
Domestic equity securities 785,328 1,212,573 891,328 105,999 (427,244) 191,051 618,296 Domestic bonds 3,394 (118,475) 40,723 37,328 121,870 124,182 2,311 Other 158,790 96,052 182,541 23,750 62,738 191,220 128,481
Total 956,518 1,183,193 1,124,821 168,302 (226,675) 522,415 749,090 Domestic equity securities 785,328 1,212,573 891,328 105,999 (427,244) 191,051 618,296 Domestic bonds 9,778 (123,518) 48,325 38,546 133,297 135,609 2,311 Other 161,411 94,139 185,167 23,755 67,271 195,755 128,483
(3) Market Value Information for Securities in Trusts with Contracts for Compensating the Principal
Money Trusts (jointly operated designated money in trust)
A. Market Value of Securities (in millions of yen)
March 31, 2004Note : A fair value is given where a fair value can be calculated for a market-value equivalent.
B. Valuation Gains of Derivative Transaction : 2,721 millions of yen
Loan Trusts
A. Market Value of Securities (in millions of yen)
March 31, 2004Note : A fair value is given where a fair value can be calculated for a market-value equivalent.
B. Valuation Gains of Derivative Transaction : 12,024 millions of yen
Trust Assets at period end
Valuation differences
Losses
As of March 31, 2003
Gains Gains
Valuation differences
Losses
As of March 31, 2004
139,693
219,913
Trust Assets at period end Market Value Valuation Gains152,966 13,272
Market Value Valuation Gains226,985 7,071
2
Mitsubishi Tokyo Financial Group, Inc.
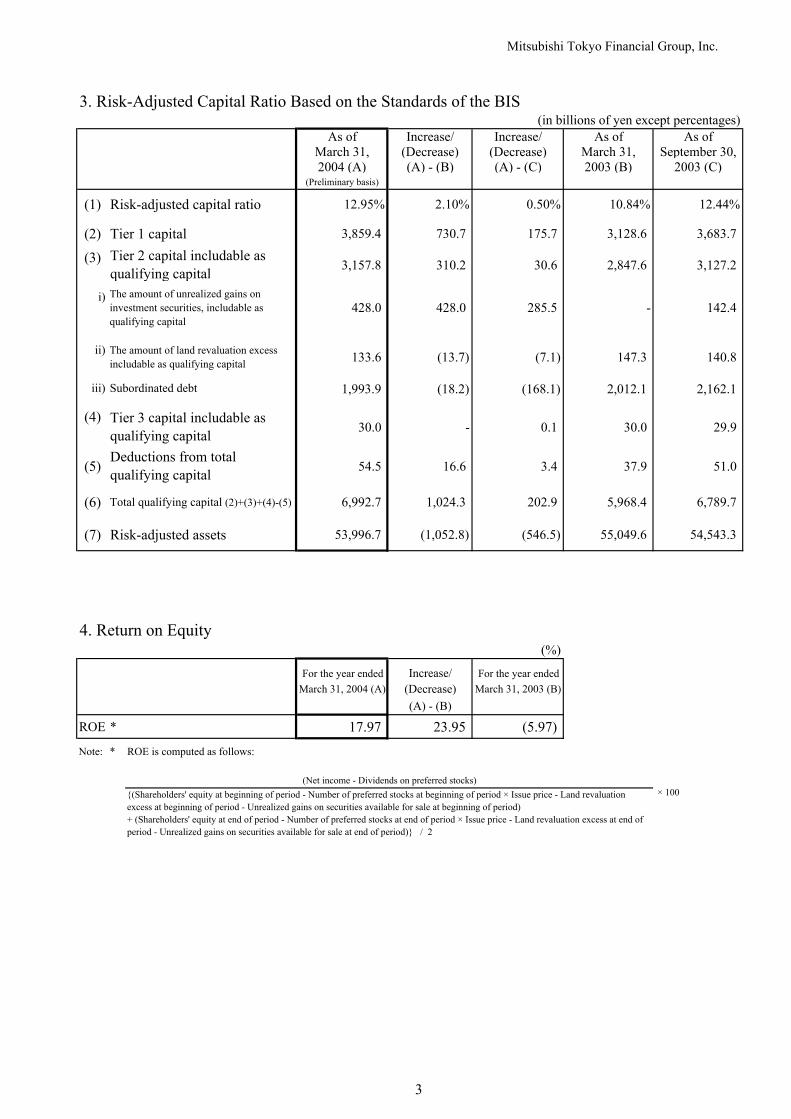
3. Risk-Adjusted Capital Ratio Based on the Standards of the BIS(in billions of yen except percentages)
As of Increase/ Increase/ As of As ofMarch 31, (Decrease) (Decrease) March 31, September 30,2004 (A) (A) - (B) (A) - (C) 2003 (B) 2003 (C)
(Preliminary basis)
(1) Risk-adjusted capital ratio 12.95% 2.10% 0.50% 10.84% 12.44%
(2) Tier 1 capital 3,859.4 730.7 175.7 3,128.6 3,683.7
(3) 3,157.8 310.2 30.6 2,847.6 3,127.2
i)
ii)
iii) Subordinated debt 1,993.9 (18.2) (168.1) 2,012.1 2,162.1
(4)30.0 - 0.1 30.0 29.9
(5) 54.5 16.6 3.4 37.9 51.0
(6) Total qualifying capital (2)+(3)+(4)-(5) 6,992.7 1,024.3 202.9 5,968.4 6,789.7
(7) Risk-adjusted assets 53,996.7 (1,052.8) (546.5) 55,049.6 54,543.3
4. Return on Equity(%)
For the year ended Increase/ For the year endedMarch 31, 2004 (A) (Decrease) March 31, 2003 (B)
(A) - (B)
ROE * 17.97 23.95 (5.97) Note: * ROE is computed as follows:
× 100(Net income - Dividends on preferred stocks)
{(Shareholders' equity at beginning of period - Number of preferred stocks at beginning of period × Issue price - Land revaluationexcess at beginning of period - Unrealized gains on securities available for sale at beginning of period)+ (Shareholders' equity at end of period - Number of preferred stocks at end of period × Issue price - Land revaluation excess at end ofperiod - Unrealized gains on securities available for sale at end of period)} / 2
428.0 428.0 285.5 The amount of unrealized gains oninvestment securities, includable asqualifying capital
The amount of land revaluation excessincludable as qualifying capital
- 142.4
Tier 2 capital includable asqualifying capital
Deductions from totalqualifying capital
140.8 133.6 (13.7) (7.1) 147.3
Tier 3 capital includable asqualifying capital
3
Mitsubishi Tokyo Financial Group, Inc.
2 Loan Portfolio and Other
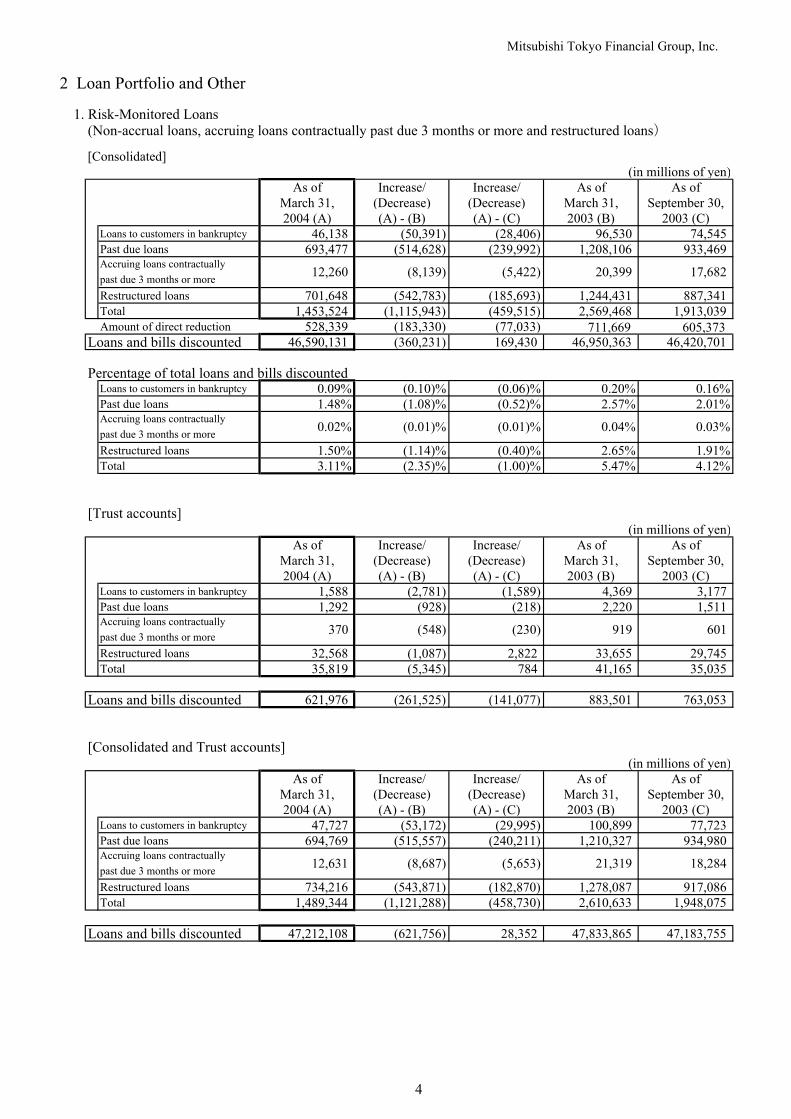
1. Risk-Monitored Loans(Non-accrual loans, accruing loans contractually past due 3 months or more and restructured loans)
[Consolidated](in millions of yen)
As of Increase/ Increase/ As of As ofMarch 31, (Decrease) (Decrease) March 31, September 30,2004 (A) (A) - (B) (A) - (C) 2003 (B) 2003 (C)
Loans to customers in bankruptcy 46,138 (50,391) (28,406) 96,530 74,545 Past due loans 693,477 (514,628) (239,992) 1,208,106 933,469
past due 3 months or moreRestructured loans 701,648 (542,783) (185,693) 1,244,431 887,341 Total 1,453,524 (1,115,943) (459,515) 2,569,468 1,913,039 Amount of direct reduction 528,339 (183,330) (77,033) 711,669 605,373
Loans and bills discounted 46,590,131 (360,231) 169,430 46,950,363 46,420,701
Percentage of total loans and bills discountedLoans to customers in bankruptcy 0.09% (0.10)% (0.06)% 0.20% 0.16%Past due loans 1.48% (1.08)% (0.52)% 2.57% 2.01%
past due 3 months or moreRestructured loans 1.50% (1.14)% (0.40)% 2.65% 1.91%Total 3.11% (2.35)% (1.00)% 5.47% 4.12%
[Trust accounts](in millions of yen)
As of Increase/ Increase/ As of As ofMarch 31, (Decrease) (Decrease) March 31, September 30,2004 (A) (A) - (B) (A) - (C) 2003 (B) 2003 (C)
Loans to customers in bankruptcy 1,588 (2,781) (1,589) 4,369 3,177 Past due loans 1,292 (928) (218) 2,220 1,511
past due 3 months or moreRestructured loans 32,568 (1,087) 2,822 33,655 29,745 Total 35,819 (5,345) 784 41,165 35,035
Loans and bills discounted 621,976 (261,525) (141,077) 883,501 763,053
[Consolidated and Trust accounts](in millions of yen)
As of Increase/ Increase/ As of As ofMarch 31, (Decrease) (Decrease) March 31, September 30,2004 (A) (A) - (B) (A) - (C) 2003 (B) 2003 (C)
Loans to customers in bankruptcy 47,727 (53,172) (29,995) 100,899 77,723 Past due loans 694,769 (515,557) (240,211) 1,210,327 934,980
past due 3 months or moreRestructured loans 734,216 (543,871) (182,870) 1,278,087 917,086 Total 1,489,344 (1,121,288) (458,730) 2,610,633 1,948,075
Loans and bills discounted 47,212,108 (621,756) 28,352 47,833,865 47,183,755
(230) 919 601 Accruing loans contractually
370 (548)
Accruing loans contractually12,260
Accruing loans contractually0.02%
(8,139) (5,422) 20,399 17,682
(0.01)% (0.01)% 0.04% 0.03%
(5,653) 21,319 18,284 Accruing loans contractually
12,631 (8,687)
4

Mitsubishi Tokyo Financial Group, Inc.
2. Classification of risk-monitored Loans
Classification by geographic area[Consolidated] (in millions of yen)
As of Increase/ Increase/ As of As ofMarch 31, (Decrease) (Decrease) March 31, September 30,2004 (A) (A) - (B) (A) - (C) 2003 (B) 2003 (C)
1,126,078 (1,037,337) (505,266) 2,163,416 1,631,345 327,446 (78,605) 45,751 406,051 281,694
Asia 26,656 (40,010) (9,983) 66,666 36,639 Indonesia 4,578 (9,770) (5,848) 14,348 10,426 Thailand 10,562 (3,032) 1,903 13,595 8,659 Hong Kong 4,717 (11,821) (2,557) 16,539 7,274 Other 6,798 (15,385) (3,480) 22,183 10,279
United States of America 230,520 17,741 67,765 212,778 162,754 Other 70,269 (56,337) (12,030) 126,606 82,299
Total 1,453,524 (1,115,943) (459,515) 2,569,468 1,913,039 Note:* "Domestic" and "Overseas" are classified by domicile of borrowers.
[Trust accounts] (in millions of yen)As of Increase/ Increase/ As of As of
March 31, (Decrease) (Decrease) March 31, September 30,2004 (A) (A) - (B) (A) - (C) 2003 (B) 2003 (C)
35,819 (5,345) 784 41,165 35,035
Classification by type of industry of borrowers[Consolidated] (in millions of yen)
As of Increase/ Increase/ As of As ofMarch 31, (Decrease) (Decrease) March 31, September 30,2004 (A) (A) - (B) (A) - (C) 2003 (B) 2003 (C)
Domestic* 1,126,078 (1,037,337) (505,266) 2,163,416 1,631,345 Manufacturing 187,410 (116,522) 3,229 303,932 184,181 Construction 82,520 (174,853) (132,618) 257,374 215,138 Wholesale and Retail 229,195 (246,175) (115,080) 475,371 344,275 Banks and other financial institutions 21,523 (3,419) 9,096 24,942 12,426 Real estate 312,973 (202,738) (72,661) 515,712 385,634 Services 147,493 (102,331) (35,061) 249,824 182,554 Other industries 54,793 (48,286) (24,454) 103,079 79,247 Consumer 90,168 (143,010) (137,716) 233,178 227,885
Overseas* 327,446 (78,605) 45,751 406,051 281,694 83,728 77,605 81,641 6,122 2,087
Commercial and industrial 210,576 (168,661) (62,809) 379,238 273,385 Other 33,141 12,449 26,919 20,691 6,221
Total 1,453,524 (1,115,943) (459,515) 2,569,468 1,913,039 Note:* "Domestic" and "Overseas" are classified by domicile of borrowers.
[Trust accounts] (in millions of yen)As of Increase/ Increase/ As of As of
March 31, (Decrease) (Decrease) March 31, September 30,2004 (A) (A) - (B) (A) - (C) 2003 (B) 2003 (C)
Domestic 35,819 (5,345) 784 41,165 35,035 Manufacturing 4,465 459 2,719 4,005 1,746 Construction 63 (1,653) (1,171) 1,717 1,235 Wholesale and Retail 2,197 (302) 163 2,500 2,033 Banks and other financial institutions - - - - -Real estate 5,894 (725) 145 6,619 5,748 Services 1,057 (676) (237) 1,733 1,294 Other industries 16,972 (1,237) (1,104) 18,210 18,076 Consumer 5,168 (1,209) 269 6,377 4,899
Total 35,819 (5,345) 784 41,165 35,035
Banks and other financial institutions
Domestic*Overseas*
Domestic
5
Mitsubishi Tokyo Financial Group, Inc.
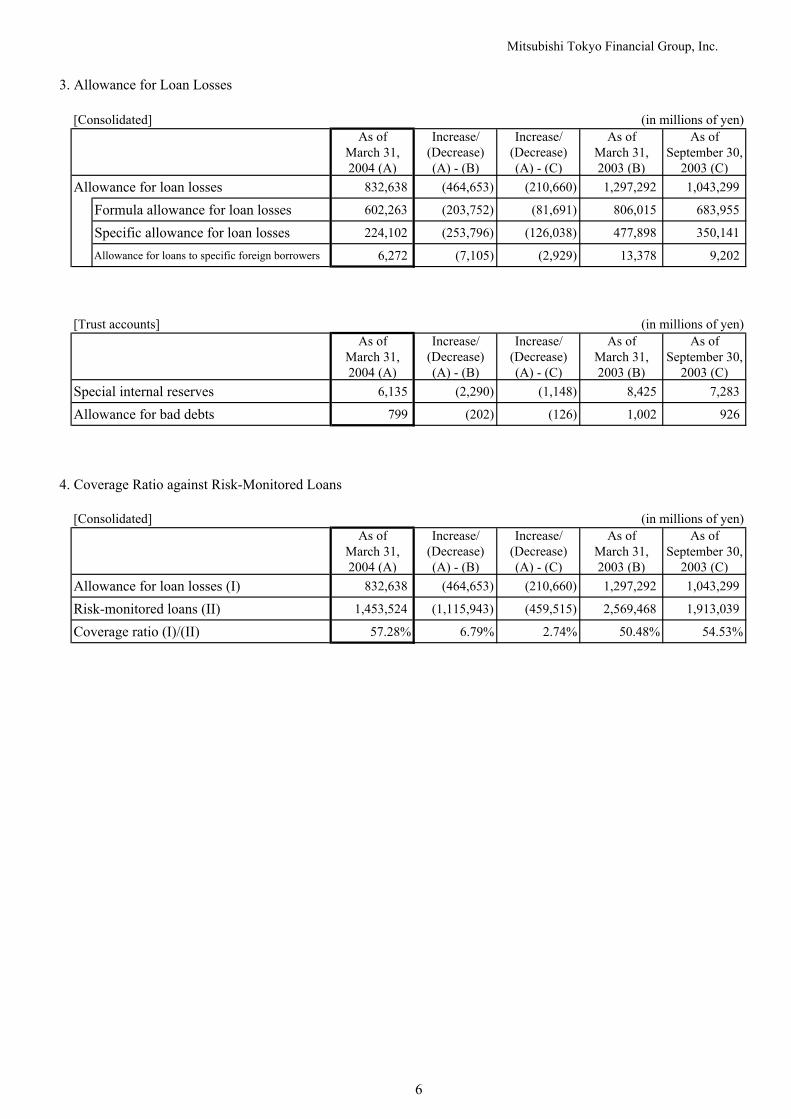
3. Allowance for Loan Losses
[Consolidated] (in millions of yen)As of Increase/ Increase/ As of As of
March 31, (Decrease) (Decrease) March 31, September 30,2004 (A) (A) - (B) (A) - (C) 2003 (B) 2003 (C)
Allowance for loan losses 832,638 (464,653) (210,660) 1,297,292 1,043,299
Formula allowance for loan losses 602,263 (203,752) (81,691) 806,015 683,955
Specific allowance for loan losses 224,102 (253,796) (126,038) 477,898 350,141
Allowance for loans to specific foreign borrowers 6,272 (7,105) (2,929) 13,378 9,202
[Trust accounts] (in millions of yen)As of Increase/ Increase/ As of As of
March 31, (Decrease) (Decrease) March 31, September 30,2004 (A) (A) - (B) (A) - (C) 2003 (B) 2003 (C)
Special internal reserves 6,135 (2,290) (1,148) 8,425 7,283
Allowance for bad debts 799 (202) (126) 1,002 926
4. Coverage Ratio against Risk-Monitored Loans
[Consolidated] (in millions of yen)As of Increase/ Increase/ As of As of
March 31, (Decrease) (Decrease) March 31, September 30,2004 (A) (A) - (B) (A) - (C) 2003 (B) 2003 (C)
Allowance for loan losses (I) 832,638 (464,653) (210,660) 1,297,292 1,043,299
Risk-monitored loans (II) 1,453,524 (1,115,943) (459,515) 2,569,468 1,913,039
Coverage ratio (I)/(II) 57.28% 6.79% 2.74% 50.48% 54.53%
6
Mitsubishi Tokyo Financial Group, Inc.
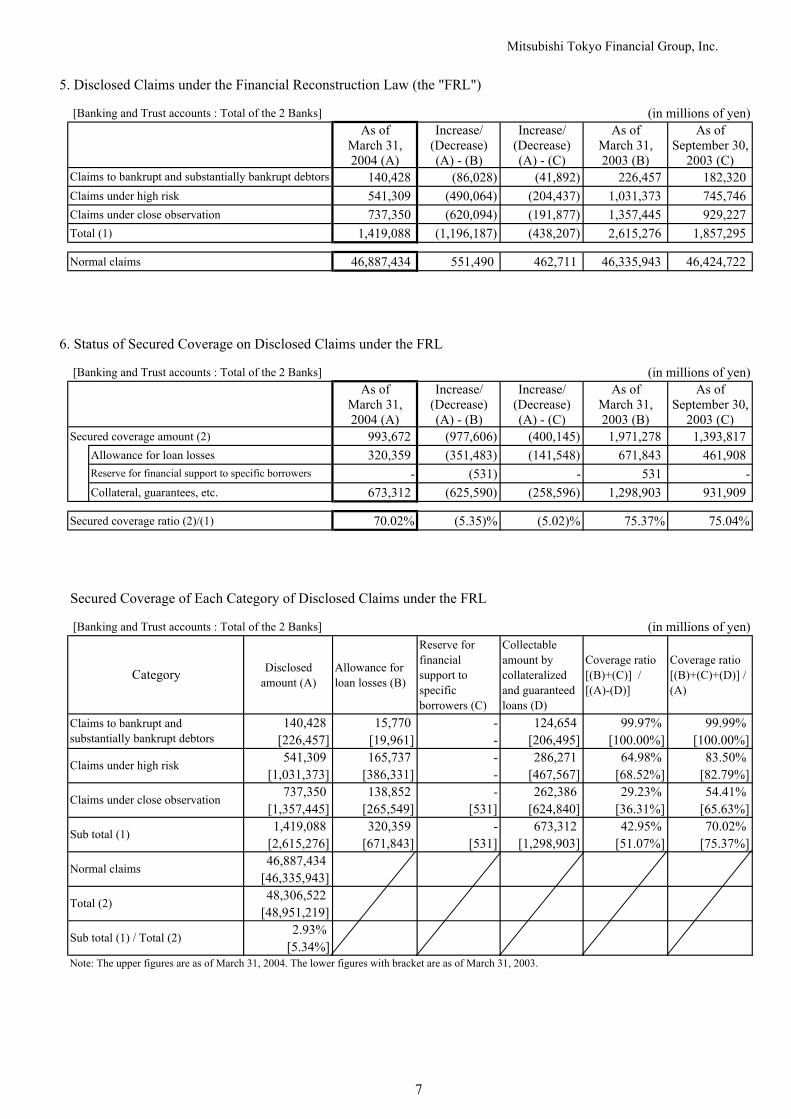
5. Disclosed Claims under the Financial Reconstruction Law (the "FRL")
[Banking and Trust accounts : Total of the 2 Banks] (in millions of yen)As of Increase/ Increase/ As of As of
March 31, (Decrease) (Decrease) March 31, September 30,2004 (A) (A) - (B) (A) - (C) 2003 (B) 2003 (C)
140,428 (86,028) (41,892) 226,457 182,320 Claims under high risk 541,309 (490,064) (204,437) 1,031,373 745,746 Claims under close observation 737,350 (620,094) (191,877) 1,357,445 929,227 Total (1) 1,419,088 (1,196,187) (438,207) 2,615,276 1,857,295
Normal claims 46,887,434 551,490 462,711 46,335,943 46,424,722
6. Status of Secured Coverage on Disclosed Claims under the FRL
[Banking and Trust accounts : Total of the 2 Banks] (in millions of yen)As of Increase/ Increase/ As of As of
March 31, (Decrease) (Decrease) March 31, September 30,2004 (A) (A) - (B) (A) - (C) 2003 (B) 2003 (C)
Secured coverage amount (2) 993,672 (977,606) (400,145) 1,971,278 1,393,817 Allowance for loan losses 320,359 (351,483) (141,548) 671,843 461,908
- (531) - 531 -Collateral, guarantees, etc. 673,312 (625,590) (258,596) 1,298,903 931,909
Secured coverage ratio (2)/(1) 70.02% (5.35)% (5.02)% 75.37% 75.04%
Secured Coverage of Each Category of Disclosed Claims under the FRL
[Banking and Trust accounts : Total of the 2 Banks] (in millions of yen)
Disclosedamount (A)
Allowance forloan losses (B)
Reserve forfinancialsupport tospecificborrowers (C)
Collectableamount bycollateralizedand guaranteedloans (D)
Coverage ratio[(B)+(C)] /[(A)-(D)]
Coverage ratio[(B)+(C)+(D)] /(A)
140,428 15,770 - 124,654 99.97% 99.99% [226,457] [19,961] - [206,495] [100.00%] [100.00%]541,309 165,737 - 286,271 64.98% 83.50%
[1,031,373] [386,331] - [467,567] [68.52%] [82.79%]737,350 138,852 - 262,386 29.23% 54.41%
[1,357,445] [265,549] [531] [624,840] [36.31%] [65.63%]1,419,088 320,359 - 673,312 42.95% 70.02%
[2,615,276] [671,843] [531] [1,298,903] [51.07%] [75.37%]46,887,434
[46,335,943]48,306,522
[48,951,219]2.93%
[5.34%]
Claims under high risk
Sub total (1) / Total (2)
Claims under close observation
Sub total (1)
Normal claims
Total (2)
Note: The upper figures are as of March 31, 2004. The lower figures with bracket are as of March 31, 2003.
Claims to bankrupt and substantially bankrupt debtors
Reserve for financial support to specific borrowers
Category
Claims to bankrupt andsubstantially bankrupt debtors
7
Mitsubishi Tokyo Financial Group, Inc.
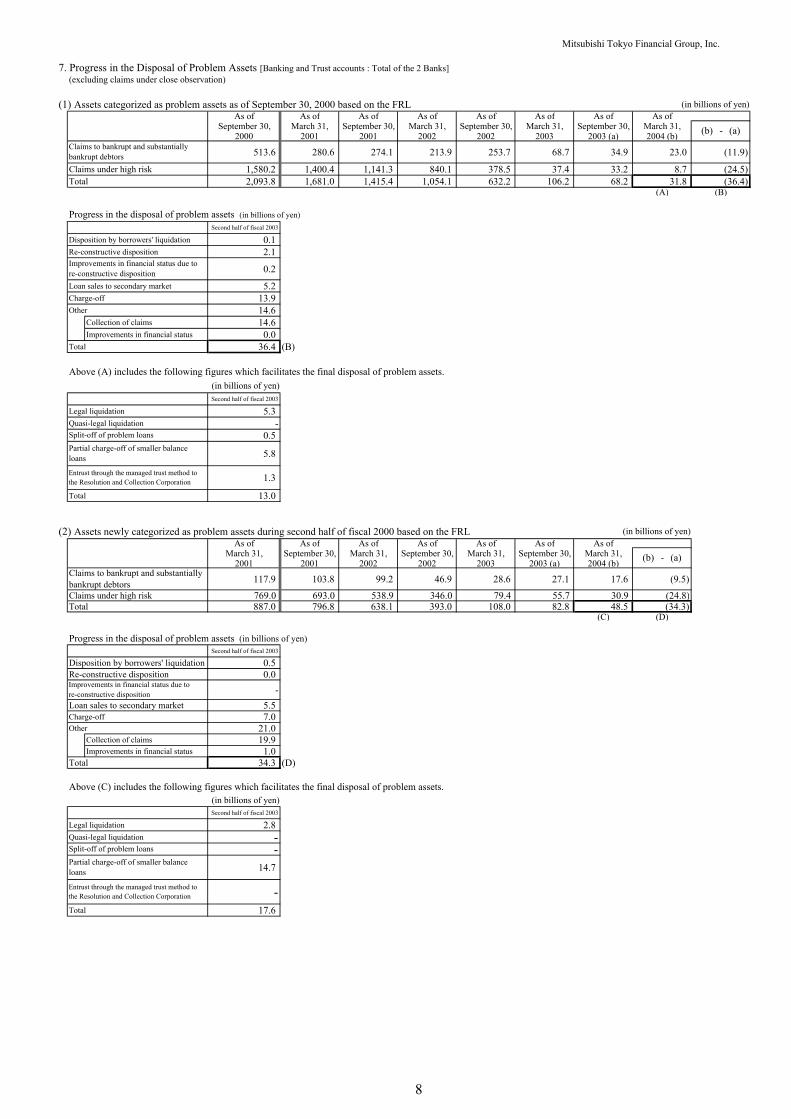
7. Progress in the Disposal of Problem Assets [Banking and Trust accounts : Total of the 2 Banks](excluding claims under close observation)
(1) Assets categorized as problem assets as of September 30, 2000 based on the FRL (in billions of yen)As of As of As of As of As of As of As of As of
September 30, March 31, September 30, March 31, September 30, March 31, September 30, March 31,2000 2001 2001 2002 2002 2003 2003 (a) 2004 (b)
513.6 280.6 274.1 213.9 253.7 68.7 34.9 23.0 (11.9)
Claims under high risk 1,580.2 1,400.4 1,141.3 840.1 378.5 37.4 33.2 8.7 (24.5)Total 2,093.8 1,681.0 1,415.4 1,054.1 632.2 106.2 68.2 31.8 (36.4)
(A) (B)
Progress in the disposal of problem assets (in billions of yen)Second half of fiscal 2003
Disposition by borrowers' liquidation 0.1 Re-constructive disposition 2.1
0.2
Loan sales to secondary market 5.2 Charge-off 13.9 Other 14.6
Collection of claims 14.6 Improvements in financial status 0.0
Total 36.4 (B)
Above (A) includes the following figures which facilitates the final disposal of problem assets. (in billions of yen)Second half of fiscal 2003
Legal liquidation 5.3 Quasi-legal liquidation -
0.5
5.8
1.3
Total 13.0
(2) Assets newly categorized as problem assets during second half of fiscal 2000 based on the FRL (in billions of yen)As of As of As of As of As of As of As of
March 31, September 30, March 31, September 30, March 31, September 30, March 31,2001 2001 2002 2002 2003 2003 (a) 2004 (b)
117.9 103.8 99.2 46.9 28.6 27.1 17.6 (9.5)Claims under high risk 769.0 693.0 538.9 346.0 79.4 55.7 30.9 (24.8)Total 887.0 796.8 638.1 393.0 108.0 82.8 48.5 (34.3)
(C) (D)
Progress in the disposal of problem assets (in billions of yen)Second half of fiscal 2003
Disposition by borrowers' liquidation 0.5 Re-constructive disposition 0.0
-Loan sales to secondary market 5.5 Charge-off 7.0 Other 21.0
Collection of claims 19.9 Improvements in financial status 1.0
Total 34.3 (D)
Above (C) includes the following figures which facilitates the final disposal of problem assets. (in billions of yen)Second half of fiscal 2003
Legal liquidation 2.8 Quasi-legal liquidation -
-14.7
-Total 17.6
(b) - (a)
Improvements in financial status due tore-constructive disposition
Claims to bankrupt and substantially bankrupt debtors
(b) - (a)Claims to bankrupt and substantiallybankrupt debtors
Improvements in financial status due tore-constructive disposition
Partial charge-off of smaller balanceloans
Entrust through the managed trust method to the Resolution and Collection Corporation
Split-off of problem loansPartial charge-off of smaller balanceloans
Entrust through the managed trust method to the Resolution and Collection Corporation
Split-off of problem loans
8
Mitsubishi Tokyo Financial Group, Inc.
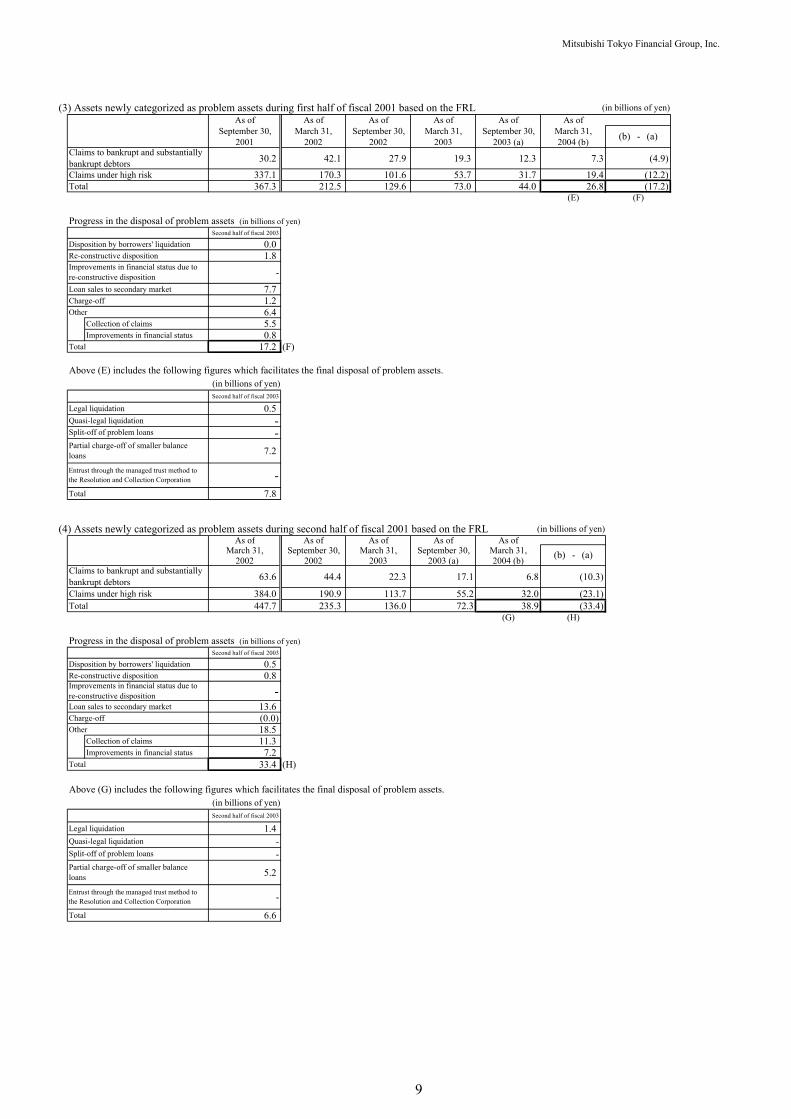
(3) Assets newly categorized as problem assets during first half of fiscal 2001 based on the FRL (in billions of yen)As of As of As of As of As of As of
September 30, March 31, September 30, March 31, September 30, March 31,2001 2002 2002 2003 2003 (a) 2004 (b)
30.2 42.1 27.9 19.3 12.3 7.3 (4.9)Claims under high risk 337.1 170.3 101.6 53.7 31.7 19.4 (12.2)Total 367.3 212.5 129.6 73.0 44.0 26.8 (17.2)
(E) (F)
Progress in the disposal of problem assets (in billions of yen)Second half of fiscal 2003
Disposition by borrowers' liquidation 0.0 Re-constructive disposition 1.8
-Loan sales to secondary market 7.7 Charge-off 1.2 Other 6.4
Collection of claims 5.5 Improvements in financial status 0.8
Total 17.2 (F)
Above (E) includes the following figures which facilitates the final disposal of problem assets. (in billions of yen)Second half of fiscal 2003
Legal liquidation 0.5 Quasi-legal liquidation -
-7.2
-Total 7.8
(4) Assets newly categorized as problem assets during second half of fiscal 2001 based on the FRL (in billions of yen)As of As of As of As of As of
March 31, September 30, March 31, September 30, March 31,2002 2002 2003 2003 (a) 2004 (b)
63.6 44.4 22.3 17.1 6.8 (10.3)
Claims under high risk 384.0 190.9 113.7 55.2 32.0 (23.1)Total 447.7 235.3 136.0 72.3 38.9 (33.4)
(G) (H)
Progress in the disposal of problem assets (in billions of yen)Second half of fiscal 2003
Disposition by borrowers' liquidation 0.5 Re-constructive disposition 0.8
-Loan sales to secondary market 13.6 Charge-off (0.0)Other 18.5
Collection of claims 11.3 Improvements in financial status 7.2
Total 33.4 (H)
Above (G) includes the following figures which facilitates the final disposal of problem assets. (in billions of yen)Second half of fiscal 2003
Legal liquidation 1.4 Quasi-legal liquidation -
-
5.2
-
Total 6.6
(b) - (a)
Split-off of problem loansPartial charge-off of smaller balanceloans
Entrust through the managed trust method to the Resolution and Collection Corporation
(b) - (a)
Entrust through the managed trust method to the Resolution and Collection Corporation
Claims to bankrupt and substantiallybankrupt debtors
Improvements in financial status due tore-constructive disposition
Partial charge-off of smaller balanceloans
Improvements in financial status due tore-constructive disposition
Claims to bankrupt and substantiallybankrupt debtors
Split-off of problem loans
9
Mitsubishi Tokyo Financial Group, Inc.
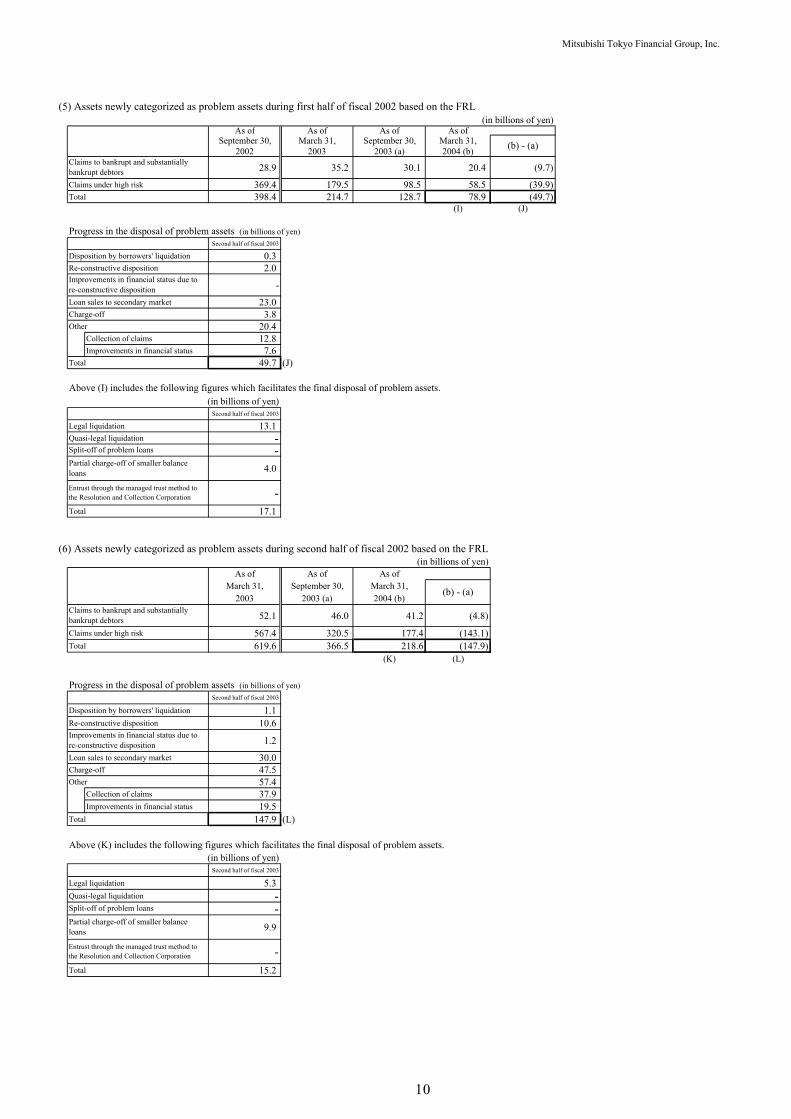
(5) Assets newly categorized as problem assets during first half of fiscal 2002 based on the FRL(in billions of yen)
As of As of As of As ofSeptember 30, March 31, September 30, March 31,
2002 2003 2003 (a) 2004 (b)
28.9 35.2 30.1 20.4 (9.7)
Claims under high risk 369.4 179.5 98.5 58.5 (39.9)Total 398.4 214.7 128.7 78.9 (49.7)
(I) (J)
Progress in the disposal of problem assets (in billions of yen)Second half of fiscal 2003
Disposition by borrowers' liquidation 0.3 Re-constructive disposition 2.0
-
Loan sales to secondary market 23.0 Charge-off 3.8 Other 20.4
Collection of claims 12.8 Improvements in financial status 7.6
Total 49.7 (J)
Above (I) includes the following figures which facilitates the final disposal of problem assets. (in billions of yen)
Second half of fiscal 2003
Legal liquidation 13.1 Quasi-legal liquidation -
-4.0
-Total 17.1
(6) Assets newly categorized as problem assets during second half of fiscal 2002 based on the FRL(in billions of yen)
As of As of As ofMarch 31, September 30, March 31,
2003 2003 (a) 2004 (b)
52.1 46.0 41.2 (4.8)
Claims under high risk 567.4 320.5 177.4 (143.1)Total 619.6 366.5 218.6 (147.9)
(K) (L)
Progress in the disposal of problem assets (in billions of yen)Second half of fiscal 2003
Disposition by borrowers' liquidation 1.1 Re-constructive disposition 10.6
1.2
Loan sales to secondary market 30.0 Charge-off 47.5 Other 57.4
Collection of claims 37.9 Improvements in financial status 19.5
Total 147.9 (L)
Above (K) includes the following figures which facilitates the final disposal of problem assets. (in billions of yen)
Second half of fiscal 2003
Legal liquidation 5.3 Quasi-legal liquidation -
-9.9
-Total 15.2
(b) - (a)
Split-off of problem loansPartial charge-off of smaller balanceloans
Improvements in financial status due tore-constructive disposition
(b) - (a)
Claims to bankrupt and substantiallybankrupt debtors
Claims to bankrupt and substantiallybankrupt debtors
Entrust through the managed trust method to the Resolution and Collection Corporation
Improvements in financial status due tore-constructive disposition
Split-off of problem loans
Partial charge-off of smaller balanceloans
Entrust through the managed trust method to the Resolution and Collection Corporation
10
Mitsubishi Tokyo Financial Group, Inc.
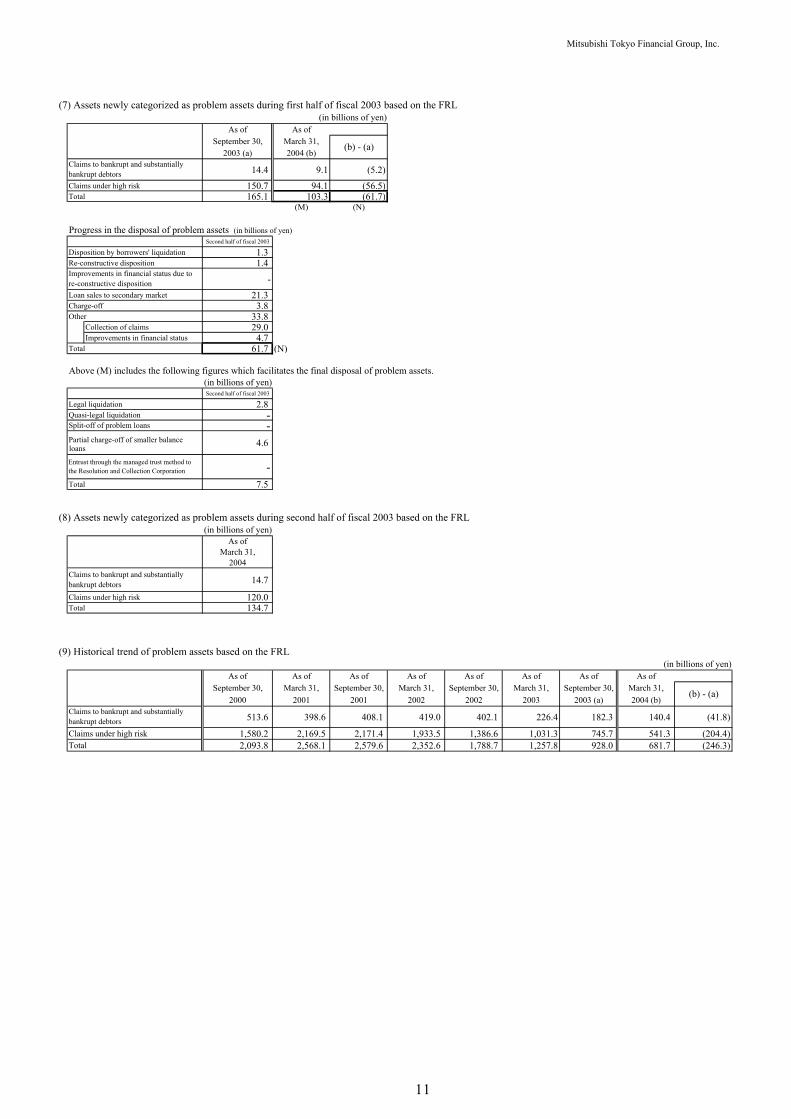
(7) Assets newly categorized as problem assets during first half of fiscal 2003 based on the FRL(in billions of yen)
As of As ofSeptember 30, March 31,
2003 (a) 2004 (b)
14.4 9.1 (5.2)Claims under high risk 150.7 94.1 (56.5)Total 165.1 103.3 (61.7)
(M) (N)
Progress in the disposal of problem assets (in billions of yen)Second half of fiscal 2003
Disposition by borrowers' liquidation 1.3 Re-constructive disposition 1.4
-Loan sales to secondary market 21.3 Charge-off 3.8 Other 33.8
Collection of claims 29.0 Improvements in financial status 4.7
Total 61.7 (N)
Above (M) includes the following figures which facilitates the final disposal of problem assets. (in billions of yen)
Second half of fiscal 2003
Legal liquidation 2.8 Quasi-legal liquidation -
-4.6
-Total 7.5
(8) Assets newly categorized as problem assets during second half of fiscal 2003 based on the FRL(in billions of yen)
As ofMarch 31,
2004
14.7
Claims under high risk 120.0 Total 134.7
(9) Historical trend of problem assets based on the FRL(in billions of yen)
As of As of As of As of As of As of As of As ofSeptember 30, March 31, September 30, March 31, September 30, March 31, September 30, March 31,
2000 2001 2001 2002 2002 2003 2003 (a) 2004 (b)
513.6 398.6 408.1 419.0 402.1 226.4 182.3 140.4 (41.8)
Claims under high risk 1,580.2 2,169.5 2,171.4 1,933.5 1,386.6 1,031.3 745.7 541.3 (204.4)Total 2,093.8 2,568.1 2,579.6 2,352.6 1,788.7 1,257.8 928.0 681.7 (246.3)
(b) - (a)
Claims to bankrupt and substantiallybankrupt debtors
(b) - (a)
Claims to bankrupt and substantiallybankrupt debtors
Improvements in financial status due tore-constructive disposition
Split-off of problem loans
Partial charge-off of smaller balance
Entrust through the managed trust method tothe Resolution and Collection Corporation
Claims to bankrupt and substantiallybankrupt debtors
loans
11
Mitsubishi Tokyo Financial Group, Inc.
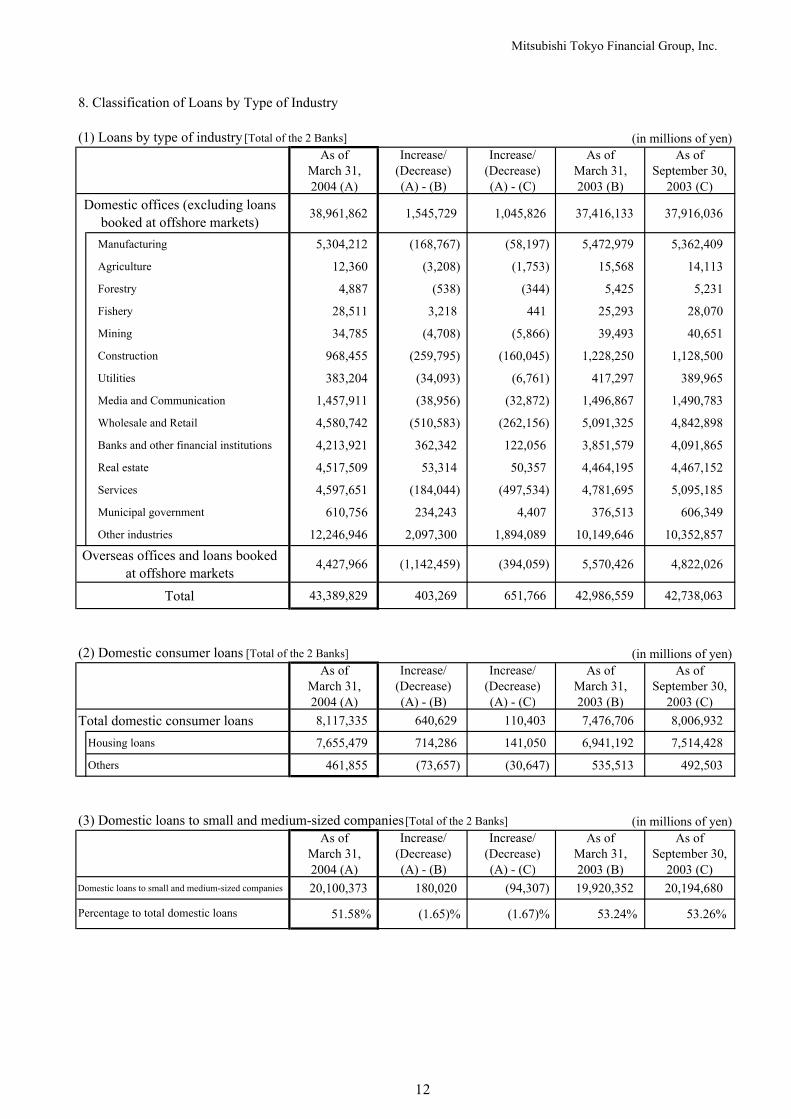
8. Classification of Loans by Type of Industry
(1) Loans by type of industry [Total of the 2 Banks] (in millions of yen)As of Increase/ Increase/ As of As of
March 31, (Decrease) (Decrease) March 31, September 30,2004 (A) (A) - (B) (A) - (C) 2003 (B) 2003 (C)
Domestic offices (excluding loansbooked at offshore markets)
38,961,862 1,545,729 1,045,826 37,416,133 37,916,036
Manufacturing 5,304,212 (168,767) (58,197) 5,472,979 5,362,409
Agriculture 12,360 (3,208) (1,753) 15,568 14,113
Forestry 4,887 (538) (344) 5,425 5,231
Fishery 28,511 3,218 441 25,293 28,070
Mining 34,785 (4,708) (5,866) 39,493 40,651
Construction 968,455 (259,795) (160,045) 1,228,250 1,128,500
Utilities 383,204 (34,093) (6,761) 417,297 389,965
Media and Communication 1,457,911 (38,956) (32,872) 1,496,867 1,490,783
Wholesale and Retail 4,580,742 (510,583) (262,156) 5,091,325 4,842,898
Banks and other financial institutions 4,213,921 362,342 122,056 3,851,579 4,091,865
Real estate 4,517,509 53,314 50,357 4,464,195 4,467,152
Services 4,597,651 (184,044) (497,534) 4,781,695 5,095,185
Municipal government 610,756 234,243 4,407 376,513 606,349
Other industries 12,246,946 2,097,300 1,894,089 10,149,646 10,352,857
Overseas offices and loans bookedat offshore markets
4,427,966 (1,142,459) (394,059) 5,570,426 4,822,026
Total 43,389,829 403,269 651,766 42,986,559 42,738,063
(2) Domestic consumer loans [Total of the 2 Banks] (in millions of yen)As of Increase/ Increase/ As of As of
March 31, (Decrease) (Decrease) March 31, September 30,2004 (A) (A) - (B) (A) - (C) 2003 (B) 2003 (C)
Total domestic consumer loans 8,117,335 640,629 110,403 7,476,706 8,006,932
Housing loans 7,655,479 714,286 141,050 6,941,192 7,514,428
Others 461,855 (73,657) (30,647) 535,513 492,503
(3) Domestic loans to small and medium-sized companies [Total of the 2 Banks] (in millions of yen)As of Increase/ Increase/ As of As of
March 31, (Decrease) (Decrease) March 31, September 30,2004 (A) (A) - (B) (A) - (C) 2003 (B) 2003 (C)
Domestic loans to small and medium-sized companies 20,100,373 180,020 (94,307) 19,920,352 20,194,680
51.58% (1.65)% (1.67)% 53.24% 53.26%Percentage to total domestic loans
12
Mitsubishi Tokyo Financial Group, Inc.
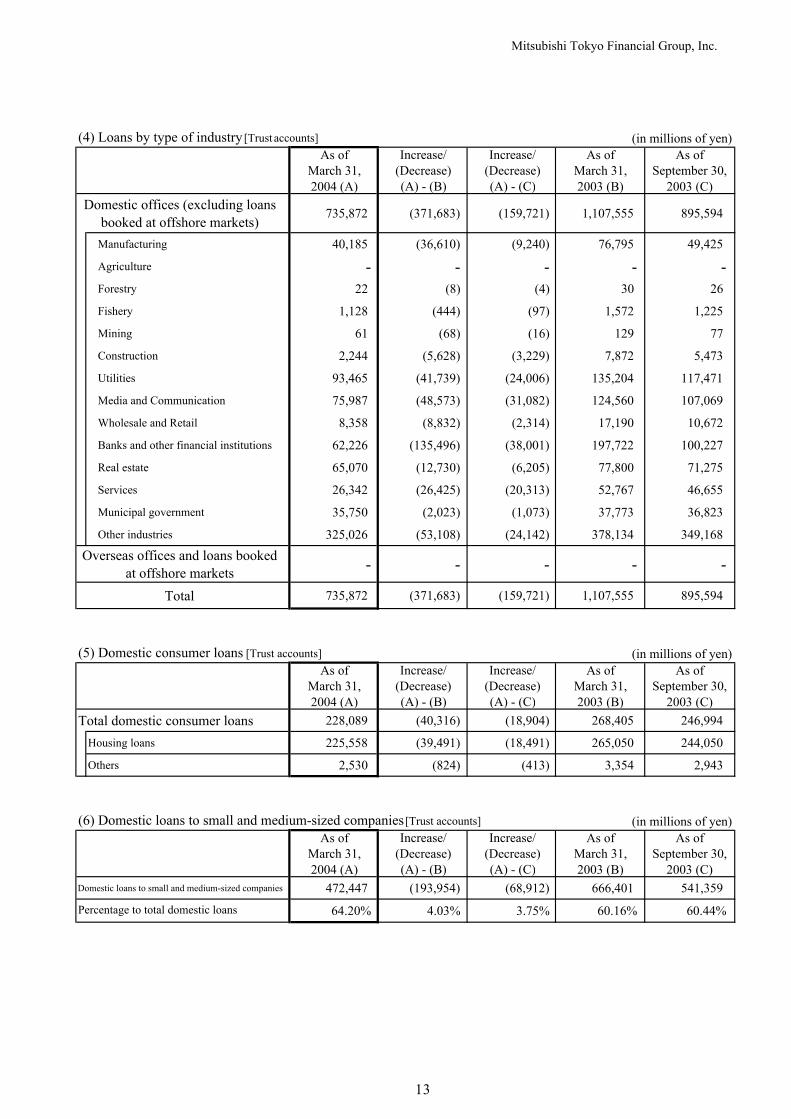
(4) Loans by type of industry [Trust accounts] (in millions of yen)As of Increase/ Increase/ As of As of
March 31, (Decrease) (Decrease) March 31, September 30,2004 (A) (A) - (B) (A) - (C) 2003 (B) 2003 (C)
Domestic offices (excluding loansbooked at offshore markets)
735,872 (371,683) (159,721) 1,107,555 895,594
Manufacturing 40,185 (36,610) (9,240) 76,795 49,425
Agriculture - - - - -Forestry 22 (8) (4) 30 26
Fishery 1,128 (444) (97) 1,572 1,225
Mining 61 (68) (16) 129 77
Construction 2,244 (5,628) (3,229) 7,872 5,473
Utilities 93,465 (41,739) (24,006) 135,204 117,471
Media and Communication 75,987 (48,573) (31,082) 124,560 107,069
Wholesale and Retail 8,358 (8,832) (2,314) 17,190 10,672
Banks and other financial institutions 62,226 (135,496) (38,001) 197,722 100,227
Real estate 65,070 (12,730) (6,205) 77,800 71,275
Services 26,342 (26,425) (20,313) 52,767 46,655
Municipal government 35,750 (2,023) (1,073) 37,773 36,823
Other industries 325,026 (53,108) (24,142) 378,134 349,168
Overseas offices and loans bookedat offshore markets - - - - -
Total 735,872 (371,683) (159,721) 1,107,555 895,594
(5) Domestic consumer loans [Trust accounts] (in millions of yen)As of Increase/ Increase/ As of As of
March 31, (Decrease) (Decrease) March 31, September 30,2004 (A) (A) - (B) (A) - (C) 2003 (B) 2003 (C)
Total domestic consumer loans 228,089 (40,316) (18,904) 268,405 246,994
Housing loans 225,558 (39,491) (18,491) 265,050 244,050
Others 2,530 (824) (413) 3,354 2,943
(6) Domestic loans to small and medium-sized companies [Trust accounts] (in millions of yen)As of Increase/ Increase/ As of As of
March 31, (Decrease) (Decrease) March 31, September 30,2004 (A) (A) - (B) (A) - (C) 2003 (B) 2003 (C)
Domestic loans to small and medium-sized companies 472,447 (193,954) (68,912) 666,401 541,359
64.20% 4.03% 3.75% 60.16% 60.44%Percentage to total domestic loans
13
Mitsubishi Tokyo Financial Group,Inc.
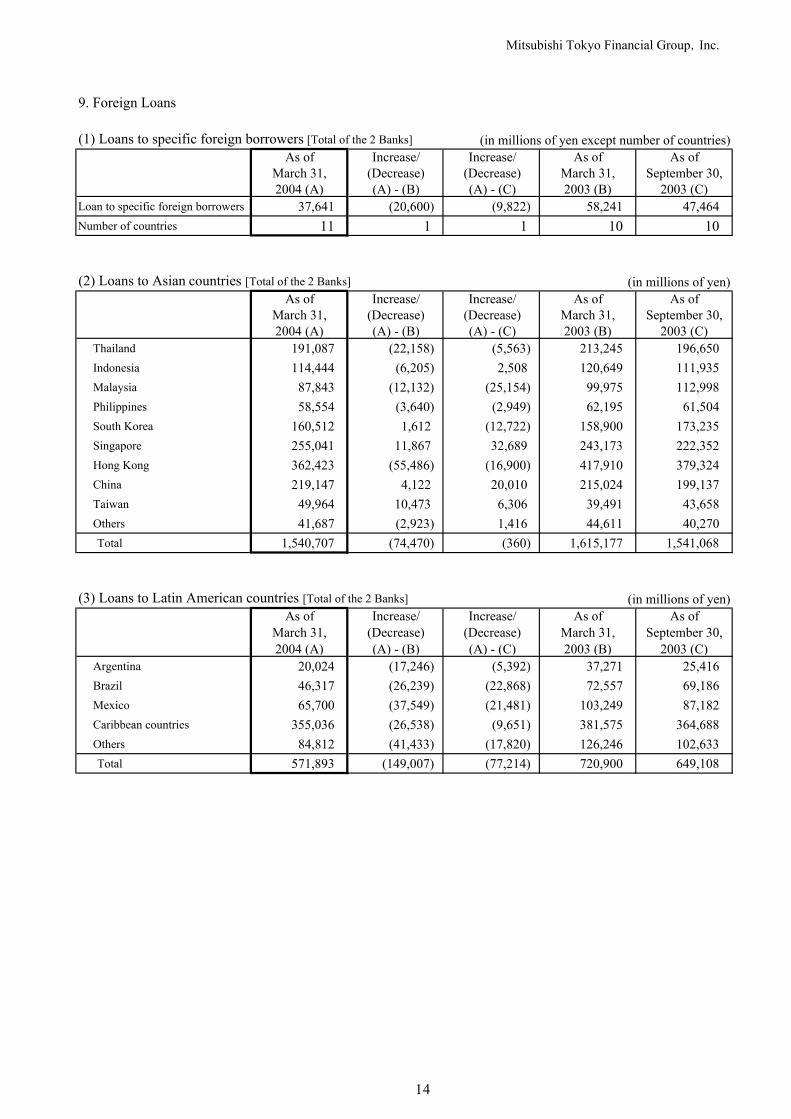
(1) Loans to specific foreign borrowers [Total of the 2 Banks] (in millions of yen except number of countries)As of Increase/ Increase/ As of As of
March 31, (Decrease) (Decrease) March 31, September 30,2004 (A) (A) - (B) (A) - (C) 2003 (B) 2003 (C)
Loan to specific foreign borrowers 37,641 (20,600) (9,822) 58,241 47,464 Number of countries 11 1 1 10 10
(2) Loans to Asian countries [Total of the 2 Banks] (in millions of yen)As of Increase/ Increase/ As of As of
March 31, (Decrease) (Decrease) March 31, September 30,2004 (A) (A) - (B) (A) - (C) 2003 (B) 2003 (C)
Thailand 191,087 (22,158) (5,563) 213,245 196,650 Indonesia 114,444 (6,205) 2,508 120,649 111,935 Malaysia 87,843 (12,132) (25,154) 99,975 112,998 Philippines 58,554 (3,640) (2,949) 62,195 61,504 South Korea 160,512 1,612 (12,722) 158,900 173,235 Singapore 255,041 11,867 32,689 243,173 222,352 Hong Kong 362,423 (55,486) (16,900) 417,910 379,324 China 219,147 4,122 20,010 215,024 199,137 Taiwan 49,964 10,473 6,306 39,491 43,658 Others 41,687 (2,923) 1,416 44,611 40,270 Total 1,540,707 (74,470) (360) 1,615,177 1,541,068
(3) Loans to Latin American countries [Total of the 2 Banks] (in millions of yen)As of Increase/ Increase/ As of As of
March 31, (Decrease) (Decrease) March 31, September 30,2004 (A) (A) - (B) (A) - (C) 2003 (B) 2003 (C)
Argentina 20,024 (17,246) (5,392) 37,271 25,416 Brazil 46,317 (26,239) (22,868) 72,557 69,186 Mexico 65,700 (37,549) (21,481) 103,249 87,182 Caribbean countries 355,036 (26,538) (9,651) 381,575 364,688 Others 84,812 (41,433) (17,820) 126,246 102,633 Total 571,893 (149,007) (77,214) 720,900 649,108
9. Foreign Loans
14

Mitsubishi Tokyo Financial Group, Inc.
10. Loans and Deposits [Total of the 2 Banks]
(in millions of yen)As of Increase/ Increase/ As of As of
March 31, (Decrease) (Decrease) March 31, September 30,2004 (A) (A) - (B) (A) - (C) 2003 (B) 2003 (C)
Deposits (ending balance) 62,664,147 3,693,361 1,754,755 58,970,786 60,909,391
Deposits (average balance) 60,253,507 2,826,123 381,639 57,427,383 59,871,867
Loans (ending balance) 43,389,829 403,269 651,766 42,986,559 42,738,063
Loans (average balance) 43,012,635 (664,886) 430,363 43,677,521 42,582,272
11. Domestic Deposits [Total of the 2 Banks]
(in millions of yen)As of Increase/ Increase/ As of As of
March 31, (Decrease) (Decrease) March 31, September 30,2004 (A) (A) - (B) (A) - (C) 2003 (B) 2003 (C)
Individuals 33,402,365 1,237,924 435,764 32,164,441 32,966,600
Corporations and others 20,575,149 671,328 (335,708) 19,903,820 20,910,857
Domestic deposits 53,977,514 1,909,253 100,056 52,068,261 53,877,458
Note: Amounts do not include negotiable certificates of deposit, deposits of overseas offices and JOM accounts.
12. Number of Employees [Total of the 2 Banks]
As of Increase/ Increase/ As of As ofMarch 31, (Decrease) (Decrease) March 31, September 30,2004 (A) (A) - (B) (A) - (C) 2003 (B) 2003 (C)
Number of employees 20,323 (1,044) (831) 21,367 21,154
13. Number of Offices [Total of the 2 Banks]
As of Increase/ Increase/ As of As ofMarch 31, (Decrease) (Decrease) March 31, September 30,2004 (A) (A) - (B) (A) - (C) 2003 (B) 2003 (C)
Domestic 315 (20) (8) 335 323
Head office and Branches 296 (13) (6) 309 302
Sub-branches and Agencies 19 (7) (2) 26 21
Overseas 81 1 - 80 81
Branches 48 1 1 47 47
Sub-branches 14 1 - 13 14
Representative offices 19 (1) (1) 20 20
Total 396 (19) (8) 415 404
15
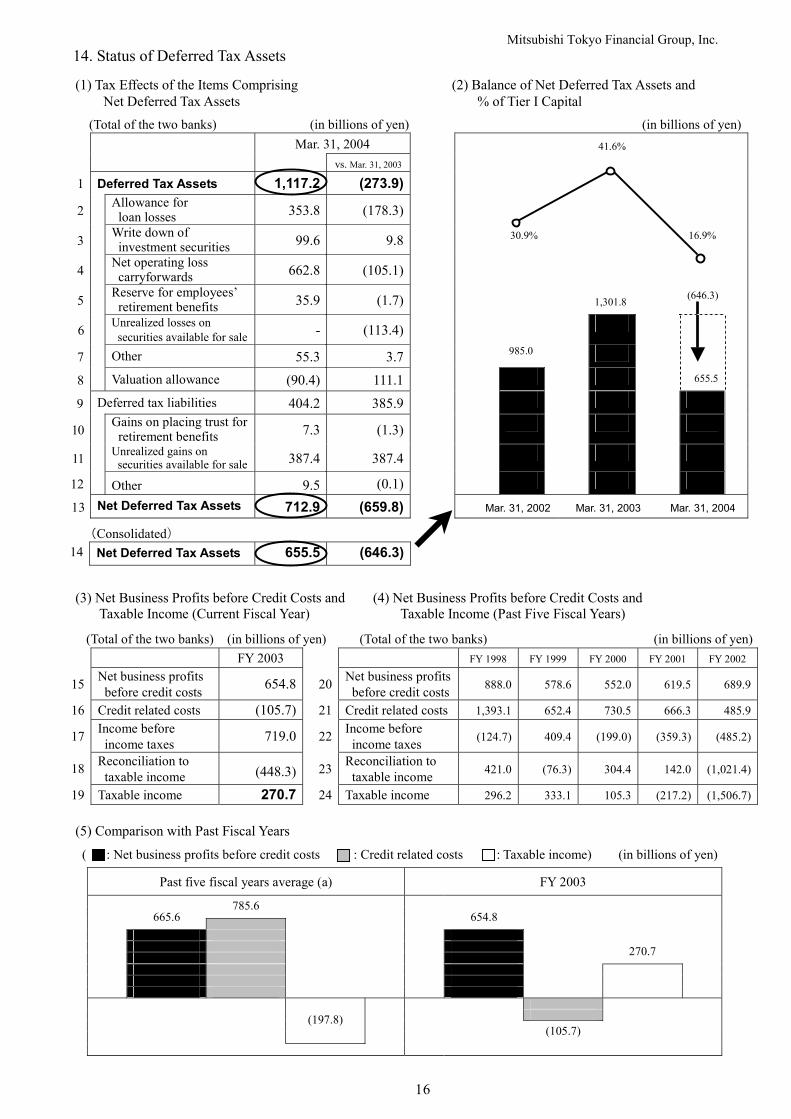
(1) Tax Effects of the Items Comprising (2) Balance of Net Deferred Tax Assets and Net Deferred Tax Assets % of Tier I Capital
(Total of the two banks) (in billions of yen) (in billions of yen) Mar. 31, 2004
3
Write down of investment securities 99.6
FY 1998 FY 1999
9.8
7
FY 2000 FY 2001
Past five fiscal years average (a) FY 2003
41.6%
vs. Mar. 31, 2003
1 Deferred Tax Assets 1,117.2 (273.9)
2 Allowance for loan losses 353.8 (178.3)
30.9% 16.9%
4 Net operating loss carryforwards 662.8 (105.1)
5 Reserve for employees’ retirement benefits 35.9 (1.7) (646.3)
6 Unrealized losses on securities available for sale
Other 55.3 3.7
8 Valuation allowance (90.4) 111.1 655.5
9 Deferred tax liabilities 404.2 385.9
11 Unrealized gains on securities available for sale 387.4 387.4
12 Other 9.5 (0.1)
13 Net Deferred Tax Assets 712.9 (659.8) Mar. 31, 2002 Mar. 31, 2003 Mar. 31, 2004
(Consolidated)
FY 2002
15 Net business profits before credit costs 654.8 20 Net business profits
before credit costs 888.0 578.6 552.0 619.5 689.9
16 Credit related costs (105.7) 21 Credit related costs 1,393.1 652.4 730.5 666.3 485.9
17 Income before income taxes 719.0 22 Income before
income taxes (124.7) 409.4 (199.0) (359.3) (485.2)
18 Reconciliation to taxable income (448.3) 23 Reconciliation to
taxable income 421.0 (76.3) 304.4 142.0 (1,021.4)
19
(5) Comparison with Past Fiscal Years
( : Net business profits before credit costs : Credit related costs : Taxable income) (in billions of yen)
785.6 665.6 654.8
(105.7)
14. Status of Deferred Tax Assets
1,301.8
985.0
- (113.4)
10 Gains on placing trust for retirement benefits
14 Net Deferred Tax Assets 655.5 (646.3)
Taxable income 270.7 24 Taxable income
(197.8)
7.3 (1.3)
(3) Net Business Profits before Credit Costs and (4) Net Business Profits before Credit Costs and Taxable Income (Current Fiscal Year) Taxable Income (Past Five Fiscal Years)
(Total of the two banks) (in billions of yen) (Total of the two banks) (in billions of yen)
296.2 333.1 105.3
270.7
FY 2003
(217.2) (1,506.7)
Mitsubishi Tokyo Financial Group, Inc.
16
Mitsubishi Tokyo Financial Group, Inc.
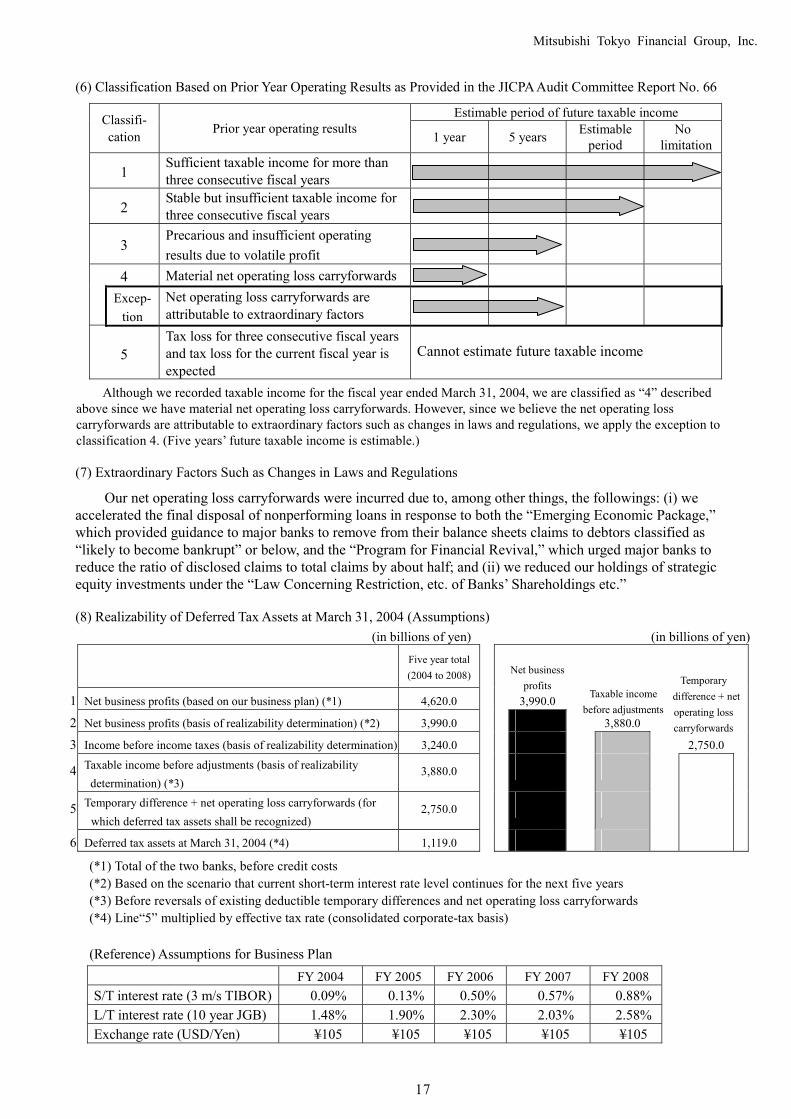
(6) Classification Based on Prior Year Operating Results as Provided in the JICPA Audit Committee Report No. 66
Estimable period of future taxable income Classifi- cation Prior year operating results 1 year 5 years Estimable
period No
limitation
1 Sufficient taxable income for more than three consecutive fiscal years
3 Precarious and insufficient operating results due to volatile profit
4 Material net operating loss carryforwards
Excep-
tion Net operating loss carryforwards are attributable to extraordinary factors
5 Tax loss for three consecutive fiscal years and tax loss for the current fiscal year is expected
Cannot estimate future taxable income
Although we recorded taxable income for the fiscal year ended March 31, 2004, we are classified as “4” described above since we have material net operating loss carryforwards. However, since we believe the net operating loss carryforwards are attributable to extraordinary factors such as changes in laws and regulations, we apply the exception to classification 4. (Five years’ future taxable income is estimable.)
(7) Extraordinary Factors Such as Changes in Laws and Regulations
Our net operating loss carryforwards were incurred due to, among other things, the followings: (i) we accelerated the final disposal of nonperforming loans in response to both the “Emerging Economic Package,” which provided guidance to major banks to remove from their balance sheets claims to debtors classified as “likely to become bankrupt” or below, and the “Program for Financial Revival,” which urged major banks to reduce the ratio of disclosed claims to total claims by about half; and (ii) we reduced our holdings of strategic equity investments under the “Law Concerning Restriction, etc. of Banks’ Shareholdings etc.”
(8) Realizability of Deferred Tax Assets at March 31, 2004 (Assumptions) (in billions of yen) (in billions of yen)
Five year total(2004 to 2008)
1 Net business profits (based on our business plan) (*1) 4,620.0 3,990.0
3,990.0 3,880.0
3 Income before income taxes (basis of realizability determination) 3,240.0 2,750.0
4 Taxable income before adjustments (basis of realizability determination) (*3)
3,880.0
5 Temporary difference + net operating loss carryforwards (for which deferred tax assets shall be recognized)
2,750.0
(*1) Total of the two banks, before credit costs (*2) Based on the scenario that current short-term interest rate level continues for the next five years (*3) Before reversals of existing deductible temporary differences and net operating loss carryforwards (*4) Line“5” multiplied by effective tax rate (consolidated corporate-tax basis)
(Reference) Assumptions for Business Plan
FY 2004 FY 2005 FY 2006 FY 2007 FY 2008 S/T interest rate (3 m/s TIBOR) 0.09% 0.13% 0.50% 0.57% 0.88% L/T interest rate (10 year JGB) 1.48% 1.90% 2.30% 2.03% 2.58% Exchange rate (USD/Yen) ¥105 ¥105 ¥105 ¥105 ¥105
Net business profits
Taxable income before adjustments
Temporary difference + net
operating loss carryforwards
6 Deferred tax assets at March 31, 2004 (*4)
2 Stable but insufficient taxable income for three consecutive fiscal years
1,119.0
2 Net business profits (basis of realizability determination) (*2)
17

Mitsubishi Tokyo Financial Group, Inc.
15. Employees' Retirement Benefits
(1) Benefit obligation [Consolidated] (in millions of yen)
Projected benefits obligation (A) 997,243
Fair value of plan assets (B) 958,308
Prepaid pension cost (C) 189,249
Reserve for employees' retirement benefits (D) 34,932
Unrecognized plan assets (E) 57,822
Total amount unrecognized (A-B+C-D+E) 251,074
Unrecognized net obligation by the change of accounting policy 16,322
Unrecognized prior service cost (37,753)
Unrecognized net actuarial loss 272,505
(2) Net periodic pension cost [Consolidated] (in millions of yen)
Net periodic cost of the employees' retirement benefits 92,730
Service cost 29,849
Interest cost 24,592
Expected return on plan assets (28,586)
Amortization of net obligation by the change of accounting policy 16,543
Amortization of prior service cost (3,205)
Amortization of net actuarial loss 41,124
Other 12,412
For the year ended March 31, 2004
As ofMarch 31, 2004
Discount rates: Domestic subsidiaries : 1.1% to 2.2%, Overseas subsidiaries : 5.4% to 6.25%
Note Discount rate : The Bank of Tokyo-Mitsubishi, Ltd. 2.1%, The Mitsubishi Trust and Banking Corporation 2.2%.
18
Mitsubishi Tokyo Financial Group, Inc.
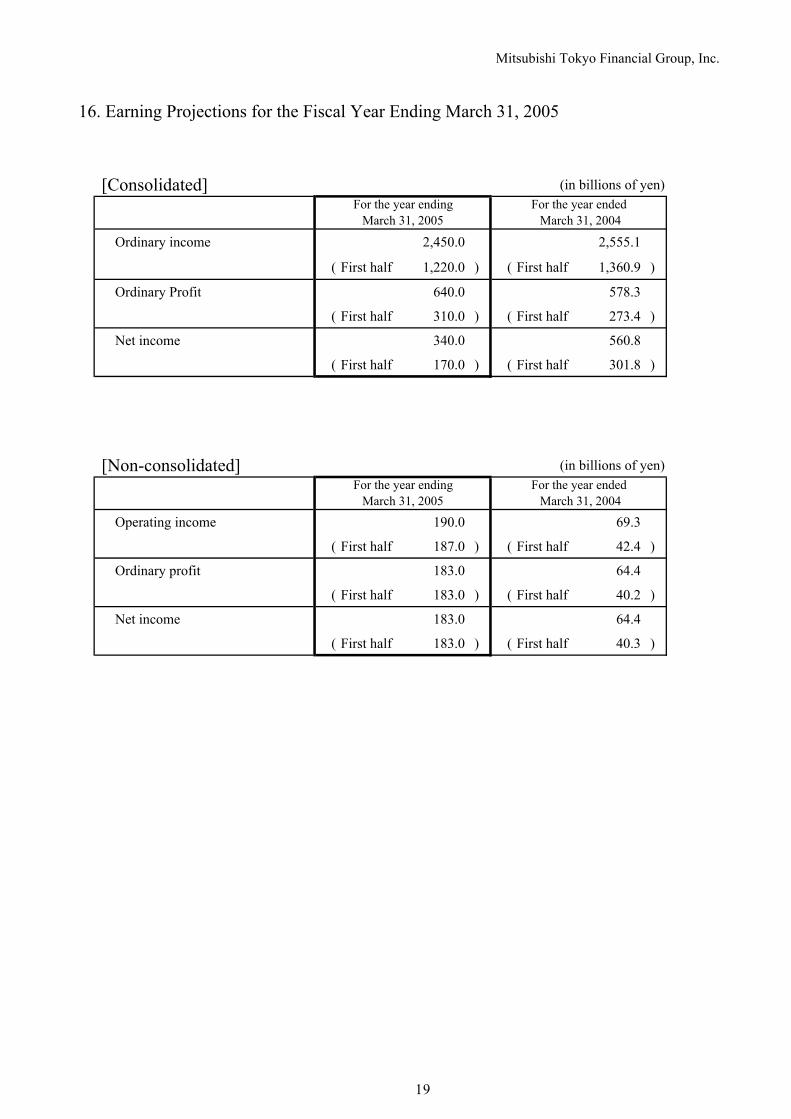
[Consolidated] (in billions of yen)
Ordinary income 2,450.0 2,555.1
( First half 1,220.0 ) ( First half 1,360.9 )
Ordinary Profit 640.0 578.3
( First half 310.0 ) ( First half 273.4 )
Net income 340.0 560.8
( First half 170.0 ) ( First half 301.8 )
[Non-consolidated] (in billions of yen)
Operating income 190.0 69.3
( First half 187.0 ) ( First half 42.4 )
Ordinary profit 183.0 64.4
( First half 183.0 ) ( First half 40.2 )
Net income 183.0 64.4
( First half 183.0 ) ( First half 40.3 )
For the year endingMarch 31, 2005
For the year ended March 31, 2004
16. Earning Projections for the Fiscal Year Ending March 31, 2005
For the year endingMarch 31, 2005
For the year ended March 31, 2004
19


![Consolidated Financial Statements for the Third …...Consolidated Financial Statements for the Third Quarter of the Fiscal Year Ending December 31, 2017 [Japanese GAAP] November 14,](https://img.pdfslide.us/doc/110x75/5f04573d7e708231d40d7fa5/consolidated-financial-statements-for-the-third-consolidated-financial-statements.jpg)


![FLASH REPORT [JAPANESE GAAP] (CONSOLIDATED BASIS… · 1 April 28, 2017 FLASH REPORT [JAPANESE GAAP] (CONSOLIDATED BASIS) Company name: West Japan Railway Company Stock listings:](https://img.pdfslide.us/doc/110x75/5acf72677f8b9a56098d16c9/flash-report-japanese-gaap-consolidated-basis-april-28-2017-flash-report.jpg)

![Flash Report [Japanese GAAP] (Consolidated Basis) · 1 May 12, 2016 Flash Report [Japanese GAAP] (Consolidated Basis) Results for the fiscal year ended March 31, 2016 Company name:](https://img.pdfslide.us/doc/110x75/5acad21d7f8b9a5d718e6a72/flash-report-japanese-gaap-consolidated-basis-may-12-2016-flash-report-japanese.jpg)