Embed Size (px)
Citation preview
Selected Financial Data(dollars in millions, except per share amounts)
2016 2015 2014 2013 2012
Results of Operations
Operating revenues $ 125,980 $ 131,620 $ 127,079 $ 120,550 $ 115,846
Operating income 27,059 33,060 19,599 31,968 13,160
Net income attributable to Verizon 13,127 17,879 9,625 11,497 875
Per common share — basic 3.22 4.38 2.42 4.01 .31
Per common share — diluted 3.21 4.37 2.42 4.00 .31
Cash dividends declared per common share 2.285 2.230 2.160 2.090 2.030
Net income attributable to noncontrolling interests 481 496 2,331 12,050 9,682
Financial Position
Total assets $ 244,180 $ 244,175 $ 232,109 $ 273,184 $ 222,720
Debt maturing within one year 2,645 6,489 2,735 3,933 4,369
Long-term debt 105,433 103,240 110,029 89,188 47,428
Employee benefit obligations 26,166 29,957 33,280 27,682 34,346
Noncontrolling interests 1,508 1,414 1,378 56,580 52,376
Equity attributable to Verizon 22,524 16,428 12,298 38,836 33,157
• Significant events affecting our historical earnings trends in 2014 through 2016 are described in “Other Items” in the “Management’s Discussion and Analysis of Financial Condition and Results of Operations” section.
• 2013 data includes severance, pension and benefit charges, gain on spectrum license transactions and wireless transaction costs. 2012 data includes severance, pension and benefit charges, early debt redemption costs and litigation settlement charges.
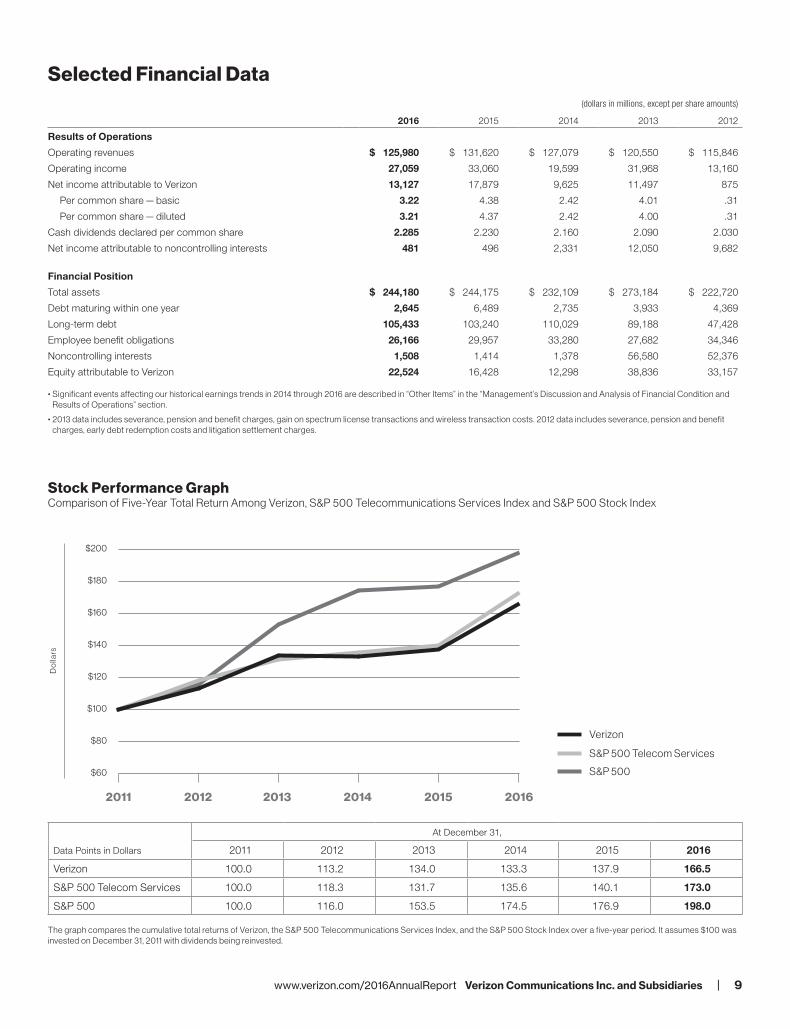
Stock Performance GraphComparison of Five-Year Total Return Among Verizon, S&P 500 Telecommunications Services Index and S&P 500 Stock Index
Data Points in Dollars
At December 31,
2011 2012 2013 2014 2015 2016
Verizon 100.0 113.2 134.0 133.3 137.9 166.5
S&P 500 Telecom Services 100.0 118.3 131.7 135.6 140.1 173.0
S&P 500 100.0 116.0 153.5 174.5 176.9 198.0
The graph compares the cumulative total returns of Verizon, the S&P 500 Telecommunications Services Index, and the S&P 500 Stock Index over a five-year period. It assumes $100 was invested on December 31, 2011 with dividends being reinvested.
2011 2012 2013 2014 2015 2016
Verizon
S&P 500 Telecom Services
S&P 500$60
$80
$100
$120
$140
$160
$180
$200
Do
llars
www.verizon.com/2016AnnualReport Verizon Communications Inc. and Subsidiaries | 9
Management’s Discussion and Analysis of Financial Condition and Results of Operations
OverviewVerizon Communications Inc. (Verizon, or the Company) is a holding company that, acting through its subsidiaries, is one of the world’s leading providers of communications, information and entertainment products and services to consumers, businesses and governmental agencies. With a presence around the world, we offer voice, data and video services and solutions on our wireless and wireline networks that are designed to meet customers’ demand for mobility, reliable network connectivity, security and control. We have two reportable segments, Wireless and Wireline. Our wireless business, operating as Verizon Wireless, provides voice and data services and equipment sales across the United States (U.S.) using one of the most extensive and reliable wireless networks. Our wireline business provides consumer, business and government customers with communications products and enhanced services, including broadband data and video, corporate networking solutions, data center and cloud services, security and managed network services and local and long distance voice services, and also owns and operates one of the most expansive end-to-end Global Internet Protocol (IP) networks. We have a highly skilled, diverse and dedicated workforce of approximately 160,900 employees as of December 31, 2016.
To compete effectively in today’s dynamic marketplace, we are focused on transforming around the capabilities of our high- performing networks with a goal of future growth based on delivering what customers want and need in the new digital world. Our three tier strategy is to lead at the network connectivity level in the markets we serve, develop new business models through global platforms in video and the Internet of Things (IoT) and create certain opportunities in applications and content for incremental monetization. Our strategy requires significant capital investments primarily to acquire wireless spectrum, put the spectrum into service, provide additional capacity for growth in our networks, invest in the fiber-optic network that supports our businesses, maintain our networks and develop and maintain significant advanced informa-tion technology systems and data system capabilities. We believe that steady and consistent investments in our networks and platforms will drive innovative products and services and fuel our growth. In addition, protecting the privacy of our customers’ information and the security of our systems and networks will continue to be a priority at Verizon. Our network leadership will continue to be the hallmark of our brand, and provide the fundamental strength at the connectivity, platform and solutions layers upon which we build our competitive advantage.
Strategic TransactionsDigital Media and Interactive EntertainmentWe have been investing in technology that taps into the market shift to digital content and advertising. During 2015, we entered into an Agreement and Plan of Merger (the Merger Agreement) with AOL Inc. (AOL) pursuant to which we completed a tender offer to acquire all of the outstanding shares of common stock of AOL at a price of $50.00 per share, net to the seller in cash, without interest and less any applicable withholding taxes. The aggregate cash consideration paid by Verizon at the closing of these transactions was approximately $3.8 billion. AOL is a leader in the digital content and advertising platform space. AOL’s business model aligns with this approach, and we believe that its combination of owned and operated content prop-erties plus a digital advertising platform enhances our ability to further develop future revenue streams.
On July 23, 2016, Verizon entered into a stock purchase agreement (the Purchase Agreement) with Yahoo! Inc. (Yahoo). Pursuant to the Purchase Agreement, upon the terms and subject to the conditions thereof, we agreed to acquire the stock of one or more subsidiaries of Yahoo holding all of Yahoo's operating business, for approximately $4.83 billion in cash, subject to certain adjustments (the Transaction). On February 20, 2017, Verizon and Yahoo entered into an amendment to the Purchase Agreement, pursuant to which the Transaction purchase price will be reduced by $350 million to approximately $4.48 billion in cash, subject to certain adjustments. Subject to certain exceptions, the parties also agreed that certain user security and data breaches incurred by Yahoo (and the losses arising therefrom) will be disregarded (1) for purposes of specified conditions to Verizon’s obligations to close the Transaction and (2) in determining whether a “Business Material Adverse Effect” under the Purchase Agreement has occurred.
Concurrently with the amendment of the Purchase Agreement, Yahoo and Yahoo Holdings, Inc., a wholly owned subsidiary of Yahoo that Verizon has agreed to purchase pursuant to the Transaction, also entered into an amendment to a related reorganization agreement, pursuant to which Yahoo (which has announced that it intends to change its name to Altaba Inc. following the closing of the Transaction) will retain 50% of certain post-closing liabilities arising out of govern-mental or third party investigations, litigations or other claims related to certain user security and data breaches incurred by Yahoo. In accor-dance with the original Transaction agreements, Yahoo will continue to retain 100% of any liabilities arising out of any shareholder lawsuits (including derivative claims) and investigations and actions by the Securities and Exchange Commission (SEC).
The Transaction remains subject to customary closing conditions, including the approval of Yahoo's stockholders, and is expected to close in the second quarter of 2017.
We believe that our acquisition of Yahoo's operating business will help us become a scaled distributor in mobile media. Yahoo's operations are expected to provide us with a valuable portfolio of online content, mobile applications and viewers. Additionally, our acquisition of Yahoo's operating business is expected to expand our analytics and ad tech capabilities which we expect will enhance both our compet-itive position in the mobile media marketplace and value proposition to advertisers (see Note 2 to the consolidated financial statements for additional details).
IoT and TelematicsWe are also building our growth capabilities in the emerging IoT market by developing business models to monetize usage on our network at the connectivity and platform layers. On July 30, 2016, we entered into a definitive agreement to acquire Fleetmatics Group PLC (Fleetmatics), a leading global provider of fleet and mobile workforce management solutions. Pursuant to the terms of the agreement, we acquired Fleetmatics for $60.00 per ordinary share in cash. The aggregate merger consideration was approximately $2.5 billion, including cash acquired of $0.1 billion. We completed the acquisition on November 7, 2016. In July 2016, we also closed on the acquisition of Telogis, Inc. (Telogis), a global cloud-based mobile enterprise management software business, for $0.9 billion of cash consideration. For the year ended December 31, 2016, we recognized IoT revenues, including revenues from businesses acquired during 2016, of approximately $1.0 billion, a 39% increase compared to the prior year period.
10 | Verizon Communications Inc. and Subsidiaries www.verizon.com/2016AnnualReport
Network EvolutionWe are reinventing our network architecture around a common fiber platform that will support both our wireless and wireline technologies. We expect that this new “One Fiber” architecture will improve our 4G LTE coverage, speed the deployment of fifth-generation (5G) tech-nology, deliver high-speed Fios broadband to homes and businesses and create new opportunities in the small and medium business market. In April 2016, we announced our One Fiber strategy for the city of Boston. We launched One Fiber for consumer and business services to customers in Boston late in 2016. We expect to have further opportunities for expansion with our acquisition of XO Holdings’ wireline business, which owns and operates one of the largest fiber-based IP and Ethernet networks, for approximately $1.8 billion, subject to adjustment. We completed this acquisition on February 1, 2017.
Data Center SaleOn December 6, 2016, we entered into a definitive agreement with Equinix, Inc. (Equinix) pursuant to which Verizon will sell 24 customer- facing data center sites in the United States and Latin America, for approximately $3.6 billion, subject to certain adjustments. The sale does not affect Verizon’s data center services delivered from 27 sites in Europe, Asia- Pacific and Canada, or its managed hosting and cloud offerings. The transaction is subject to customary regulatory approvals and closing conditions, and is expected to close during the first half of 2017.
Access Line SaleOn February 5, 2015, we entered into a definitive agreement with Frontier Communications Corporation (Frontier) pursuant to which Verizon agreed to sell its local exchange business and related landline activities in California, Florida and Texas, including Fios Internet and video customers, switched and special access lines and high-speed Internet service and long distance voice accounts in these three states, for approximately $10.5 billion (approximately $7.3 billion net of income taxes), subject to certain adjustments and including the assumption of $0.6 billion of indebtedness from Verizon by Frontier (Access Line Sale). The transaction, which included the acquisition by Frontier of the equity interests of Verizon’s incumbent local exchange carriers (ILECs) in California, Florida and Texas, did not involve any assets or liabilities of Verizon Wireless. The transaction closed on April 1, 2016.
The transaction resulted in Frontier acquiring approximately 3.3 million voice connections, 1.6 million Fios Internet subscribers, 1.2 million Fios video subscribers and the related ILEC businesses from Verizon. Approximately 9,300 Verizon employees who served customers in California, Florida and Texas continued employment with Frontier. The operating results of these businesses, collectively, are excluded from our Wireline segment for all periods presented to reflect comparable segment operating results consistent with the information regularly reviewed by our chief operating decision maker.
Business OverviewIn the sections that follow, we provide information about the important aspects of our operations and investments, both at the consolidated and segment levels, and discuss our results of operations, financial position and sources and uses of cash. We have two reportable segments, Wireless and Wireline, which we operate and manage as strategic business units and organize by products and services.
WirelessOur Wireless segment, doing business as Verizon Wireless, provides wireless communications services and products across one of the most extensive wireless networks in the United States. We provide these services and equipment sales to consumer, business and government customers in the United States on a postpaid and prepaid basis. Postpaid connections represent individual lines of service for which a customer is billed in advance a monthly access charge in return for a monthly network service allowance, and usage beyond the allowance is billed monthly in arrears. Our prepaid service enables individuals to obtain wireless services without credit verification by paying for all services in advance.
We offer various postpaid account service plans, including shared data plans, single connection plans and other plans tailored to the needs of our customers. Our shared data plans typically feature domestic unlimited voice minutes, unlimited domestic and international text, video and picture messaging, and a single data allowance that can be shared among the wireless devices on a customer’s account. These allowances will vary from time to time as part of promotional offers or in response to market circumstances. On February 12, 2017, we announced an introductory plan, our new Verizon Unlimited plan, available to our consumer and small business customers, which offers among other things, unlimited domestic voice, data and texting. Both our shared data plans and the Verizon Unlimited plan include our HD (High Definition) Voice, Video Calling and Mobile Hotspot services on compatible devices.
Under the Verizon device payment program, our eligible wireless customers purchase wireless devices under a device payment plan agreement. Customers that activate service on devices purchased under the device payment program, or on a compatible device that they already own, pay lower service fees (unsubsidized service pricing) as compared to those under fixed-term service plans.
We are focusing our wireless capital spending on adding capacity and density to our fourth- generation (4G) Long-Term Evolution (LTE) network, which is available to over 98% of the U.S. population in more than 500 markets covering approximately 314 million people, including those in areas served by our LTE in Rural America partners. Approximately 96% of our total data traffic in December 2016 was carried on our 4G LTE network. We are investing in the densification of our network by utilizing small cell technology, in- building solutions and distributed antenna systems. Densification enables us to add capacity to manage mobile video consumption and demand for IoT, as well as position us for future 5G technology. We are committed to developing and deploying 5G wireless technology. We are working with key partners to ensure the aggressive pace of innovation, standards development and appropriate requirements for this next generation of wireless technology. Based on the outcome of our ongoing pre- commercial trials, we intend to be the first company to deploy a 5G fixed wireless broadband network in the United States. We expect to launch a fixed commercial wireless service supported by this network in 2018.
WirelineOur Wireline segment provides voice, data and video communications products and enhanced services, including broadband video and data, corporate networking solutions, data center and cloud services, security and managed network services and local and long distance voice services. We provide these products and services to consumers in the United States, as well as to carriers, businesses and government customers both in the United States and around the world.
www.verizon.com/2016AnnualReport Verizon Communications Inc. and Subsidiaries | 11
Management’s Discussion and Analysis of Financial Condition and Results of Operations continued
In our Wireline business, to compensate for the shrinking market for tra-ditional voice service, we continue to build our Wireline segment around data, video and advanced business services — areas where demand for reliable high-speed connections is growing. We expect our One Fiber initiative in Wireline will allow us to densify our 4G LTE wireless network as well as position us for future 5G technology. We also continue to seek ways to increase revenue and further realize operating and capital efficiencies as well as maximize profitability for our Fios services.
Corporate and OtherCorporate and other includes the results of our digital media, including AOL, telematics and other businesses, investments in unconsolidated businesses, unallocated corporate expenses, pension and other employee benefit related costs and lease financing. Corporate and other also includes the historical results of divested operations and other adjustments and gains and losses that are not allocated in assessing segment performance due to their non- operational nature. Although such transactions are excluded from the business segment results, they are included in reported consolidated earnings. Gains and losses that are not individually significant are included in all segment results as these items are included in the chief operating decision maker’s assessment of segment performance.
On April 1, 2016, we completed the Access Line Sale. On July 1, 2014, our Wireline segment sold a non- strategic business. See “Acquisitions and Divestitures”. The results of operations for these divestitures are included within Corporate and other for all periods presented to reflect comparable segment operating results consistent with the information regularly reviewed by our chief operating decision maker (See “Impact of Divested Operations”).
In addition, Corporate and other includes the results of our telematics businesses for all periods presented, which were reclassified from our Wireline segment effective April 1, 2016. The impact of this reclassifi-cation was not material to our consolidated financial statements or our segment results of operations.
Capital Expenditures and InvestmentsWe continue to invest in our wireless network, high-speed fiber and other advanced technologies to position ourselves at the center of growth trends for the future. During 2016, these investments included $17.1 billion for capital expenditures. See “Cash Flows Used in Investing Activities” and “Operating Environment and Trends” for additional informa-tion. We believe that our investments aimed at expanding our portfolio of products and services will provide our customers with an efficient, reliable infrastructure for competing in the information economy.
Consolidated Results of OperationsIn this section, we discuss our overall results of operations and highlight items of a non- operational nature that are not included in our segment results. In “Segment Results of Operations,” we review the performance of our two reportable segments in more detail.
Consolidated Revenues(dollars in millions)
Increase/(Decrease)Years Ended December 31, 2016 2015 2014 2016 vs. 2015 2015 vs. 2014Wireless $ 89,186 $ 91,680 $ 87,646 $ (2,494) (2.7)% $ 4,034 4.6%Wireline 31,345 32,094 32,793 (749) (2.3) (699) (2.1)Corporate and other 6,943 9,018 7,731 (2,075) (23.0) 1,287 16.6Eliminations (1,494) (1,172) (1,091) (322) 27.5 (81) 7.4Consolidated Revenues $ 125,980 $ 131,620 $ 127,079 $ (5,640) (4.3) $ 4,541 3.6
2016 Compared to 2015The decrease in consolidated revenues during 2016 was primarily due to a decline in revenues at our segments, Wireless and Wireline, as well as a decline in revenues within Corporate and other.
Wireless’ revenues decreased $2.5 billion, or 2.7%, during 2016 primarily as a result of a decline in service revenue driven by customer migration to plans with unsubsidized service pricing, including our new price plans launched during 2016. This decline was partially offset by an increase in other revenue, primarily due to financing revenues from the Verizon device payment program, and an increase in equipment revenue due to an increase in device sales, primarily smartphones, under the Verizon device payment program.
Wireline’s revenues decreased $0.7 billion, or 2.3%, during 2016 primarily as a result of declines in Global Enterprise and Global Wholesale. Wireline’s revenues were also partially impacted by a reduction in Fios marketing activities during the union work stoppage that commenced on April 13, 2016 and ended on June 1, 2016.
Revenues for our segments are discussed separately below under the heading “Segment Results of Operations”.
Corporate and other revenues decreased $2.1 billion, or 23.0%, during 2016 as a result of the Access Line Sale that was completed on April 1, 2016. The results of operations related to these divestitures included within Corporate and other are discussed separately below under the heading “Impact of Divested Operations”. During 2016, our digital media business represented approximately 46% of revenues in Corporate and other, comprised primarily of revenues from AOL, which we aquired on June 23, 2015. Corporate and other also includes revenues from new businesses acquired during 2016 of approximately $0.1 billion.
12 | Verizon Communications Inc. and Subsidiaries www.verizon.com/2016AnnualReport
Management’s Discussion and Analysis of Financial Condition and Results of Operations continued
2015 Compared to 2014The increase in consolidated revenues during 2015 was primarily due to higher equipment revenues in our Wireless segment, higher revenues as a result of the acquisition of AOL and higher Mass Markets revenues driven by Fios services at our Wireline segment. Partially offsetting these increases were lower service revenues at our Wireless segment and lower Global Enterprise revenues at our Wireline segment.
Wireless’ revenues increased $4.0 billion, or 4.6%, during 2015 primarily as a result of growth in equipment revenue. Equipment revenue increased as a result of an increase in device sales, primarily smartphones, under the Verizon device payment program, partially offset by a decline in device sales under traditional fixed-term service plans. Service revenue decreased during 2015 primarily driven by an increase in the activation of devices purchased under the Verizon device payment program on plans with unsubsidized service pricing.
Wireline’s revenues decreased $0.7 billion, or 2.1%, during 2015 primarily as a result of declines in Global Enterprise, partially offset by higher Mass Markets revenues driven by Fios services.
Revenues for our segments are discussed separately below under the heading “Segment Results of Operations”.
Corporate and other revenues increased $1.3 billion, or 16.6%, during 2015 primarily as a result of the acquisition of AOL, which was completed on June 23, 2015. Corporate and other revenues include the results of our local exchange business and related landline activities in California, Florida and Texas that was sold on April 1, 2016. The results of operations related to these divestitures included within Corporate and other are discussed separately below under the heading “Impact of Divested Operations”.
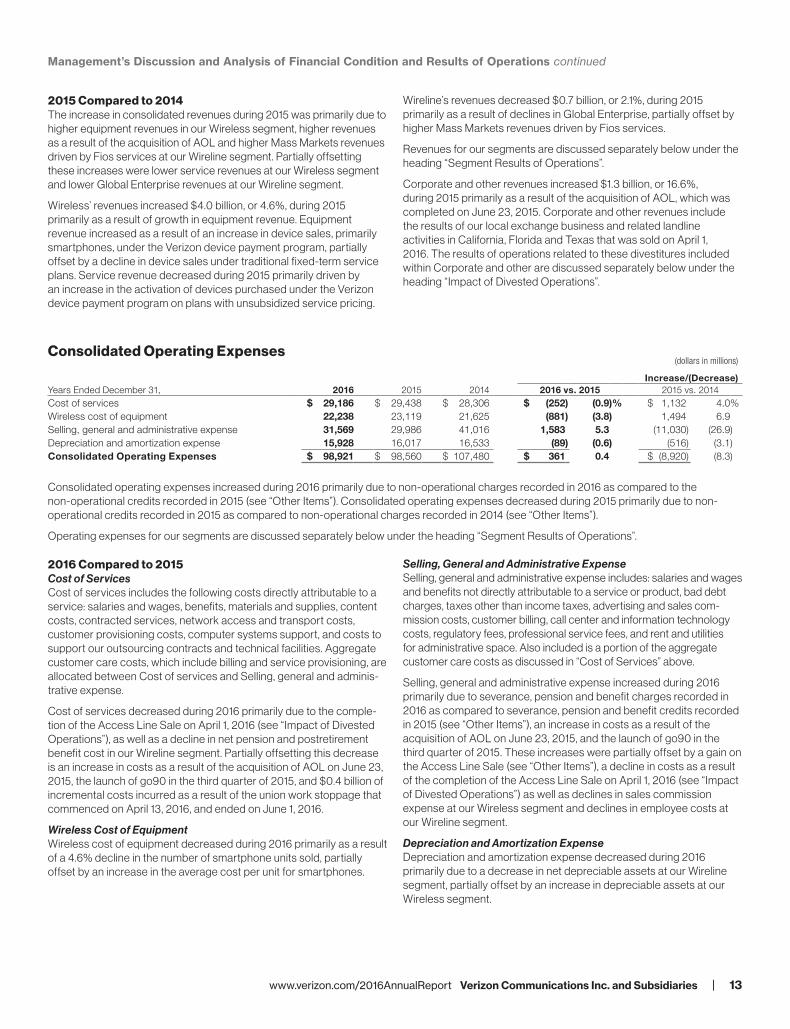
Consolidated Operating Expenses(dollars in millions)
Increase/(Decrease)Years Ended December 31, 2016 2015 2014 2016 vs. 2015 2015 vs. 2014Cost of services $ 29,186 $ 29,438 $ 28,306 $ (252) (0.9)% $ 1,132 4.0%Wireless cost of equipment 22,238 23,119 21,625 (881) (3.8) 1,494 6.9Selling, general and administrative expense 31,569 29,986 41,016 1,583 5.3 (11,030) (26.9)Depreciation and amortization expense 15,928 16,017 16,533 (89) (0.6) (516) (3.1)Consolidated Operating Expenses $ 98,921 $ 98,560 $ 107,480 $ 361 0.4 $ (8,920) (8.3)
Consolidated operating expenses increased during 2016 primarily due to non- operational charges recorded in 2016 as compared to the non- operational credits recorded in 2015 (see “Other Items”). Consolidated operating expenses decreased during 2015 primarily due to non- operational credits recorded in 2015 as compared to non- operational charges recorded in 2014 (see “Other Items”).
Operating expenses for our segments are discussed separately below under the heading “Segment Results of Operations”.
2016 Compared to 2015Cost of ServicesCost of services includes the following costs directly attributable to a service: salaries and wages, benefits, materials and supplies, content costs, contracted services, network access and transport costs, customer provisioning costs, computer systems support, and costs to support our outsourcing contracts and technical facilities. Aggregate customer care costs, which include billing and service provisioning, are allocated between Cost of services and Selling, general and adminis-trative expense.
Cost of services decreased during 2016 primarily due to the comple-tion of the Access Line Sale on April 1, 2016 (see “Impact of Divested Operations”), as well as a decline in net pension and postretirement benefit cost in our Wireline segment. Partially offsetting this decrease is an increase in costs as a result of the acquisition of AOL on June 23, 2015, the launch of go90 in the third quarter of 2015, and $0.4 billion of incremental costs incurred as a result of the union work stoppage that commenced on April 13, 2016, and ended on June 1, 2016.
Wireless Cost of EquipmentWireless cost of equipment decreased during 2016 primarily as a result of a 4.6% decline in the number of smartphone units sold, partially offset by an increase in the average cost per unit for smartphones.
Selling, General and Administrative ExpenseSelling, general and administrative expense includes: salaries and wages and benefits not directly attributable to a service or product, bad debt charges, taxes other than income taxes, advertising and sales com-mission costs, customer billing, call center and information technology costs, regulatory fees, professional service fees, and rent and utilities for administrative space. Also included is a portion of the aggregate customer care costs as discussed in “Cost of Services” above.
Selling, general and administrative expense increased during 2016 primarily due to severance, pension and benefit charges recorded in 2016 as compared to severance, pension and benefit credits recorded in 2015 (see “Other Items”), an increase in costs as a result of the acquisition of AOL on June 23, 2015, and the launch of go90 in the third quarter of 2015. These increases were partially offset by a gain on the Access Line Sale (see “Other Items”), a decline in costs as a result of the completion of the Access Line Sale on April 1, 2016 (see “Impact of Divested Operations”) as well as declines in sales commission expense at our Wireless segment and declines in employee costs at our Wireline segment.
Depreciation and Amortization ExpenseDepreciation and amortization expense decreased during 2016 primarily due to a decrease in net depreciable assets at our Wireline segment, partially offset by an increase in depreciable assets at our Wireless segment.
www.verizon.com/2016AnnualReport Verizon Communications Inc. and Subsidiaries | 13
Management’s Discussion and Analysis of Financial Condition and Results of Operations continued
2015 Compared to 2014Cost of ServicesCost of services increased during 2015 primarily due to an increase in costs as a result of the acquisition of AOL, higher rent expense as a result of an increase in wireless macro and small cell sites, higher wireless network costs from an increase in fiber facilities supporting network capacity expansion and densification, including the deployment of small cell technology, a volume- driven increase in costs related to the wireless device protection package offered to our customers as well as a $0.4 billion increase in content costs at our Wireline segment. Partially offsetting these increases were a $0.4 billion decline in employee costs and a $0.3 billion decline in access costs at our Wireline segment. Also offsetting the increase was a decrease in Cost of services reflected in the results of operations related to a non- strategic Wireline business that was divested on July 1, 2014.
Wireless Cost of EquipmentWireless cost of equipment increased during 2015 primarily as a result of an increase in the average cost per unit, driven by a shift to higher priced units in the mix of devices sold, partially offset by a decline in the number of units sold.
Selling, General and Administrative ExpenseSelling, general and administrative expense decreased during 2015 primarily due to non- operational credits, primarily severance, pension and benefit credits, recorded in 2015 as compared to non- operational charges, primarily severance, pension and benefit charges, recorded in 2014 (see “Other Items”). Also contributing to this decrease was a decline in sales commission expense at our Wireless segment, which was driven by an increase in activations under the Verizon device payment program. The decrease is partially offset by an increase in bad debt expense at our Wireless segment. The increase in bad debt expense was primarily driven by a volume increase in our installment receivables, as the credit quality of our customers remained consistent throughout the periods presented.
Depreciation and Amortization ExpenseDepreciation and amortization expense decreased during 2015 primarily due to $0.9 billion of depreciation and amortization expense not being recorded on our depreciable Wireline assets in California, Florida and Texas which were classified as held for sale as of February 5, 2015, partially offset by an increase in depreciable assets at our Wireless segment.
We did not record depreciation and amortization expense on our depreciable Wireline assets in California, Florida and Texas through the closing of the Access Line Sale, which closed on April 1, 2016.
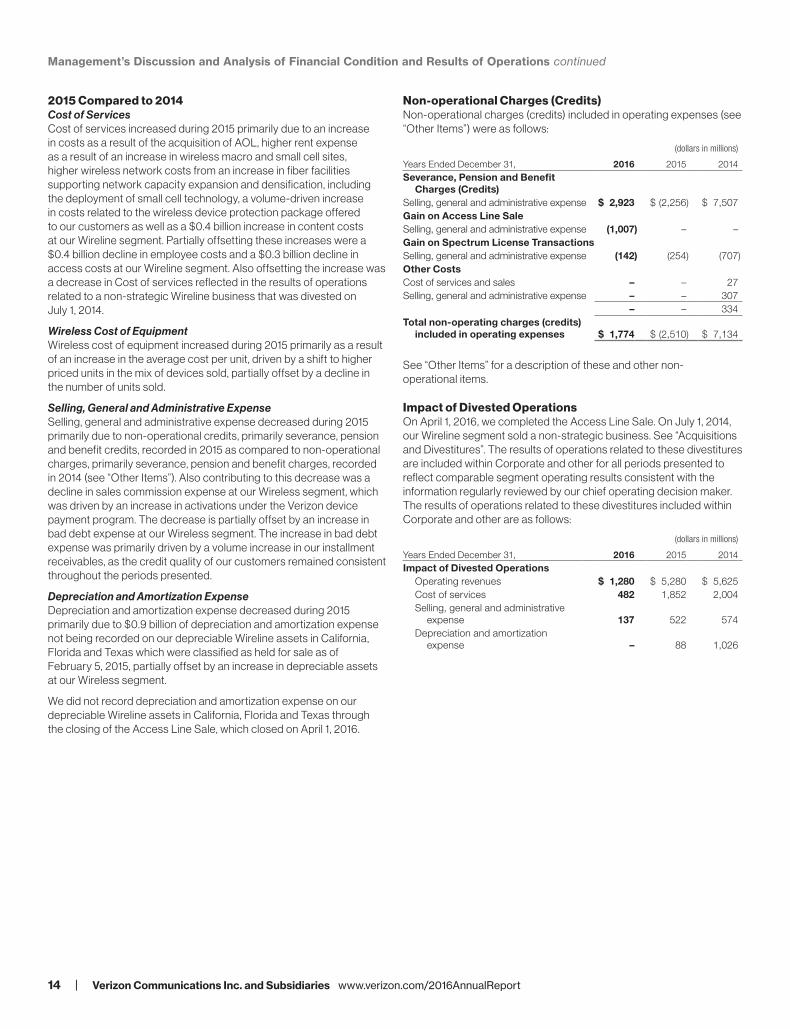
Non- operational Charges (Credits)Non- operational charges (credits) included in operating expenses (see “Other Items”) were as follows:
(dollars in millions)
Years Ended December 31, 2016 2015 2014Severance, Pension and Benefit
Charges (Credits)Selling, general and administrative expense $ 2,923 $ (2,256) $ 7,507Gain on Access Line SaleSelling, general and administrative expense (1,007) – –Gain on Spectrum License TransactionsSelling, general and administrative expense (142) (254) (707)Other CostsCost of services and sales – – 27Selling, general and administrative expense – – 307
– – 334Total non- operating charges (credits)
included in operating expenses $ 1,774 $ (2,510) $ 7,134
See “Other Items” for a description of these and other non- operational items.
Impact of Divested OperationsOn April 1, 2016, we completed the Access Line Sale. On July 1, 2014, our Wireline segment sold a non- strategic business. See “Acquisitions and Divestitures”. The results of operations related to these divestitures are included within Corporate and other for all periods presented to reflect comparable segment operating results consistent with the information regularly reviewed by our chief operating decision maker. The results of operations related to these divestitures included within Corporate and other are as follows:
(dollars in millions)
Years Ended December 31, 2016 2015 2014Impact of Divested Operations
Operating revenues $ 1,280 $ 5,280 $ 5,625Cost of services 482 1,852 2,004Selling, general and administrative
expense 137 522 574Depreciation and amortization
expense – 88 1,026
14 | Verizon Communications Inc. and Subsidiaries www.verizon.com/2016AnnualReport
Management’s Discussion and Analysis of Financial Condition and Results of Operations continued
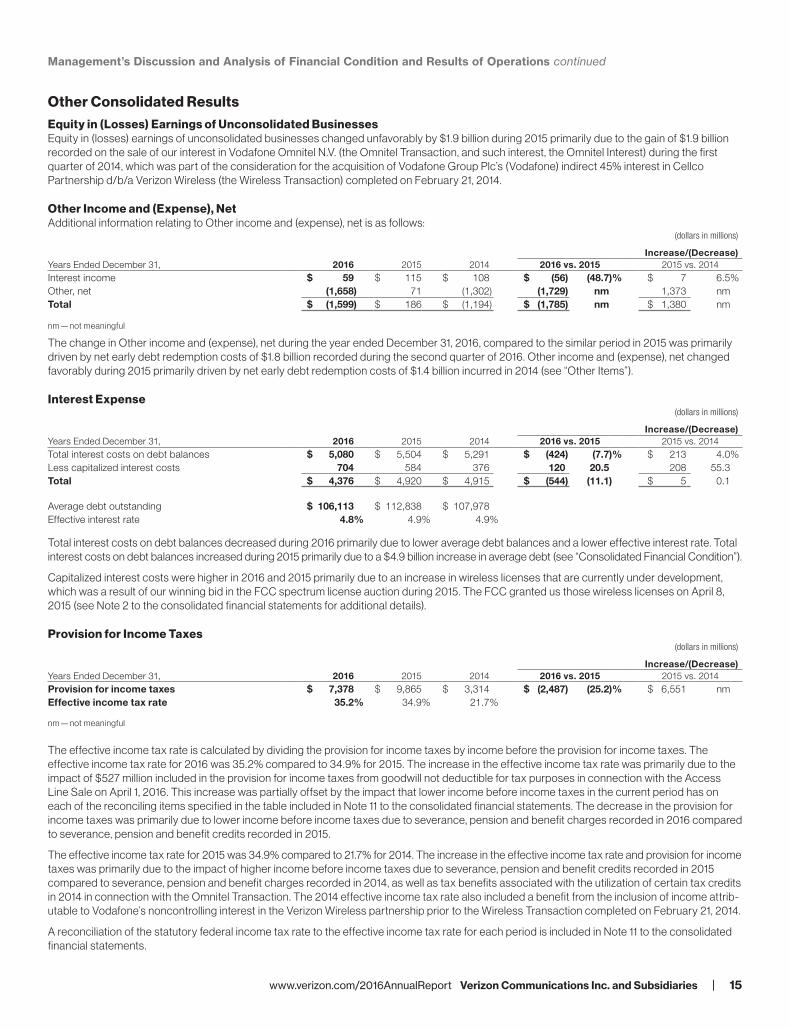
Other Consolidated ResultsEquity in (Losses) Earnings of Unconsolidated BusinessesEquity in (losses) earnings of unconsolidated businesses changed unfavorably by $1.9 billion during 2015 primarily due to the gain of $1.9 billion recorded on the sale of our interest in Vodafone Omnitel N.V. (the Omnitel Transaction, and such interest, the Omnitel Interest) during the first quarter of 2014, which was part of the consideration for the acquisition of Vodafone Group Plc’s (Vodafone) indirect 45% interest in Cellco Partnership d/b/a Verizon Wireless (the Wireless Transaction) completed on February 21, 2014.
Other Income and (Expense), NetAdditional information relating to Other income and (expense), net is as follows:
(dollars in millions)
Increase/(Decrease)Years Ended December 31, 2016 2015 2014 2016 vs. 2015 2015 vs. 2014Interest income $ 59 $ 115 $ 108 $ (56) (48.7)% $ 7 6.5%Other, net (1,658) 71 (1,302) (1,729) nm 1,373 nmTotal $ (1,599) $ 186 $ (1,194) $ (1,785) nm $ 1,380 nm
nm — not meaningful
The change in Other income and (expense), net during the year ended December 31, 2016, compared to the similar period in 2015 was primarily driven by net early debt redemption costs of $1.8 billion recorded during the second quarter of 2016. Other income and (expense), net changed favorably during 2015 primarily driven by net early debt redemption costs of $1.4 billion incurred in 2014 (see “Other Items”).
Interest Expense(dollars in millions)
Increase/(Decrease)Years Ended December 31, 2016 2015 2014 2016 vs. 2015 2015 vs. 2014Total interest costs on debt balances $ 5,080 $ 5,504 $ 5,291 $ (424) (7.7)% $ 213 4.0%Less capitalized interest costs 704 584 376 120 20.5 208 55.3Total $ 4,376 $ 4,920 $ 4,915 $ (544) (11.1) $ 5 0.1
Average debt outstanding $ 106,113 $ 112,838 $ 107,978Effective interest rate 4.8% 4.9% 4.9%
Total interest costs on debt balances decreased during 2016 primarily due to lower average debt balances and a lower effective interest rate. Total interest costs on debt balances increased during 2015 primarily due to a $4.9 billion increase in average debt (see “Consolidated Financial Condition”).
Capitalized interest costs were higher in 2016 and 2015 primarily due to an increase in wireless licenses that are currently under development, which was a result of our winning bid in the FCC spectrum license auction during 2015. The FCC granted us those wireless licenses on April 8, 2015 (see Note 2 to the consolidated financial statements for additional details).
Provision for Income Taxes(dollars in millions)
Increase/(Decrease)Years Ended December 31, 2016 2015 2014 2016 vs. 2015 2015 vs. 2014Provision for income taxes $ 7,378 $ 9,865 $ 3,314 $ (2,487) (25.2)% $ 6,551 nmEffective income tax rate 35.2% 34.9% 21.7%
nm — not meaningful
The effective income tax rate is calculated by dividing the provision for income taxes by income before the provision for income taxes. The effective income tax rate for 2016 was 35.2% compared to 34.9% for 2015. The increase in the effective income tax rate was primarily due to the impact of $527 million included in the provision for income taxes from goodwill not deductible for tax purposes in connection with the Access Line Sale on April 1, 2016. This increase was partially offset by the impact that lower income before income taxes in the current period has on each of the reconciling items specified in the table included in Note 11 to the consolidated financial statements. The decrease in the provision for income taxes was primarily due to lower income before income taxes due to severance, pension and benefit charges recorded in 2016 compared to severance, pension and benefit credits recorded in 2015.
The effective income tax rate for 2015 was 34.9% compared to 21.7% for 2014. The increase in the effective income tax rate and provision for income taxes was primarily due to the impact of higher income before income taxes due to severance, pension and benefit credits recorded in 2015 compared to severance, pension and benefit charges recorded in 2014, as well as tax benefits associated with the utilization of certain tax credits in 2014 in connection with the Omnitel Transaction. The 2014 effective income tax rate also included a benefit from the inclusion of income attrib-utable to Vodafone’s noncontrolling interest in the Verizon Wireless partnership prior to the Wireless Transaction completed on February 21, 2014.
A reconciliation of the statutory federal income tax rate to the effective income tax rate for each period is included in Note 11 to the consolidated financial statements.
www.verizon.com/2016AnnualReport Verizon Communications Inc. and Subsidiaries | 15
Management’s Discussion and Analysis of Financial Condition and Results of Operations continued
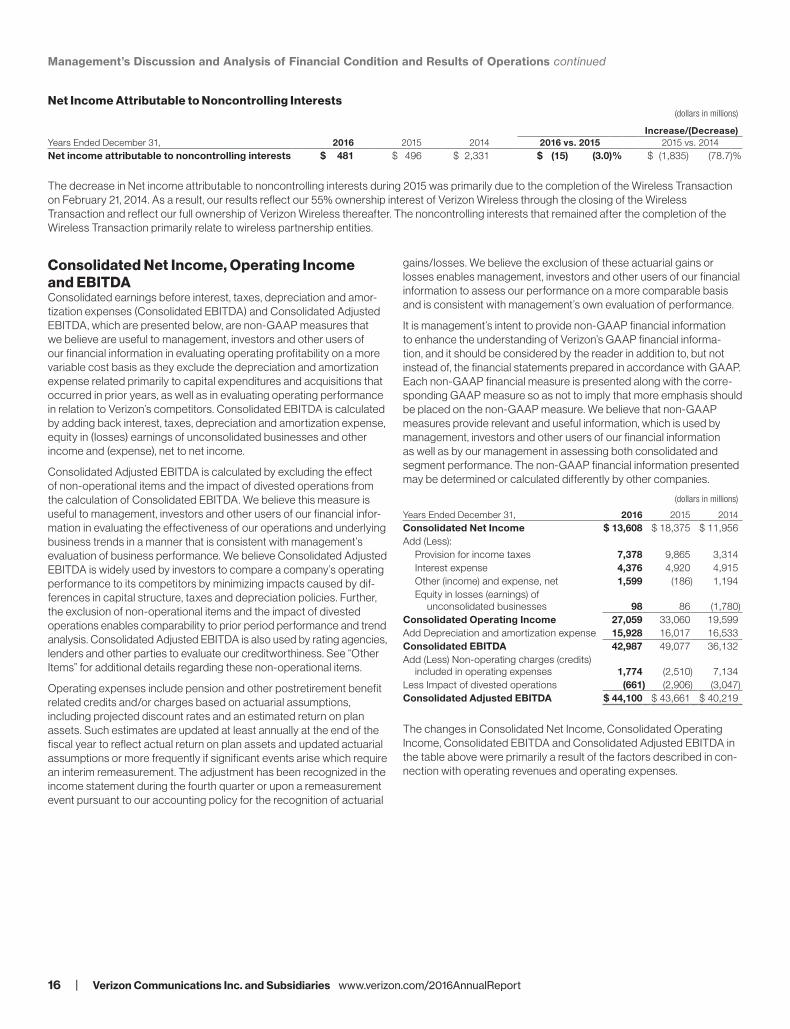
Net Income Attributable to Noncontrolling Interests(dollars in millions)
Increase/(Decrease)Years Ended December 31, 2016 2015 2014 2016 vs. 2015 2015 vs. 2014Net income attributable to noncontrolling interests $ 481 $ 496 $ 2,331 $ (15) (3.0)% $ (1,835) (78.7)%
The decrease in Net income attributable to noncontrolling interests during 2015 was primarily due to the completion of the Wireless Transaction on February 21, 2014. As a result, our results reflect our 55% ownership interest of Verizon Wireless through the closing of the Wireless Transaction and reflect our full ownership of Verizon Wireless thereafter. The noncontrolling interests that remained after the completion of the Wireless Transaction primarily relate to wireless partnership entities.
Consolidated Net Income, Operating Income and EBITDAConsolidated earnings before interest, taxes, depreciation and amor-tization expenses (Consolidated EBITDA) and Consolidated Adjusted EBITDA, which are presented below, are non-GAAP measures that we believe are useful to management, investors and other users of our financial information in evaluating operating profitability on a more variable cost basis as they exclude the depreciation and amortization expense related primarily to capital expenditures and acquisitions that occurred in prior years, as well as in evaluating operating performance in relation to Verizon’s competitors. Consolidated EBITDA is calculated by adding back interest, taxes, depreciation and amortization expense, equity in (losses) earnings of unconsolidated businesses and other income and (expense), net to net income.
Consolidated Adjusted EBITDA is calculated by excluding the effect of non- operational items and the impact of divested operations from the calculation of Consolidated EBITDA. We believe this measure is useful to management, investors and other users of our financial infor-mation in evaluating the effectiveness of our operations and underlying business trends in a manner that is consistent with management’s evaluation of business performance. We believe Consolidated Adjusted EBITDA is widely used by investors to compare a company’s operating performance to its competitors by minimizing impacts caused by dif-ferences in capital structure, taxes and depreciation policies. Further, the exclusion of non- operational items and the impact of divested operations enables comparability to prior period performance and trend analysis. Consolidated Adjusted EBITDA is also used by rating agencies, lenders and other parties to evaluate our creditworthiness. See “Other Items” for additional details regarding these non- operational items.
Operating expenses include pension and other postretirement benefit related credits and/or charges based on actuarial assumptions, including projected discount rates and an estimated return on plan assets. Such estimates are updated at least annually at the end of the fiscal year to reflect actual return on plan assets and updated actuarial assumptions or more frequently if significant events arise which require an interim remeasurement. The adjustment has been recognized in the income statement during the fourth quarter or upon a remeasurement event pursuant to our accounting policy for the recognition of actuarial
gains/losses. We believe the exclusion of these actuarial gains or losses enables management, investors and other users of our financial information to assess our performance on a more comparable basis and is consistent with management’s own evaluation of performance.
It is management’s intent to provide non-GAAP financial information to enhance the understanding of Verizon’s GAAP financial informa-tion, and it should be considered by the reader in addition to, but not instead of, the financial statements prepared in accordance with GAAP. Each non-GAAP financial measure is presented along with the corre-sponding GAAP measure so as not to imply that more emphasis should be placed on the non-GAAP measure. We believe that non-GAAP measures provide relevant and useful information, which is used by management, investors and other users of our financial information as well as by our management in assessing both consolidated and segment performance. The non-GAAP financial information presented may be determined or calculated differently by other companies.
(dollars in millions)
Years Ended December 31, 2016 2015 2014Consolidated Net Income $ 13,608 $ 18,375 $ 11,956Add (Less):
Provision for income taxes 7,378 9,865 3,314Interest expense 4,376 4,920 4,915Other (income) and expense, net 1,599 (186) 1,194Equity in losses (earnings) of
unconsolidated businesses 98 86 (1,780)Consolidated Operating Income 27,059 33,060 19,599Add Depreciation and amortization expense 15,928 16,017 16,533Consolidated EBITDA 42,987 49,077 36,132Add (Less) Non- operating charges (credits)
included in operating expenses 1,774 (2,510) 7,134Less Impact of divested operations (661) (2,906) (3,047)Consolidated Adjusted EBITDA $ 44,100 $ 43,661 $ 40,219
The changes in Consolidated Net Income, Consolidated Operating Income, Consolidated EBITDA and Consolidated Adjusted EBITDA in the table above were primarily a result of the factors described in con-nection with operating revenues and operating expenses.
16 | Verizon Communications Inc. and Subsidiaries www.verizon.com/2016AnnualReport
Management’s Discussion and Analysis of Financial Condition and Results of Operations continued
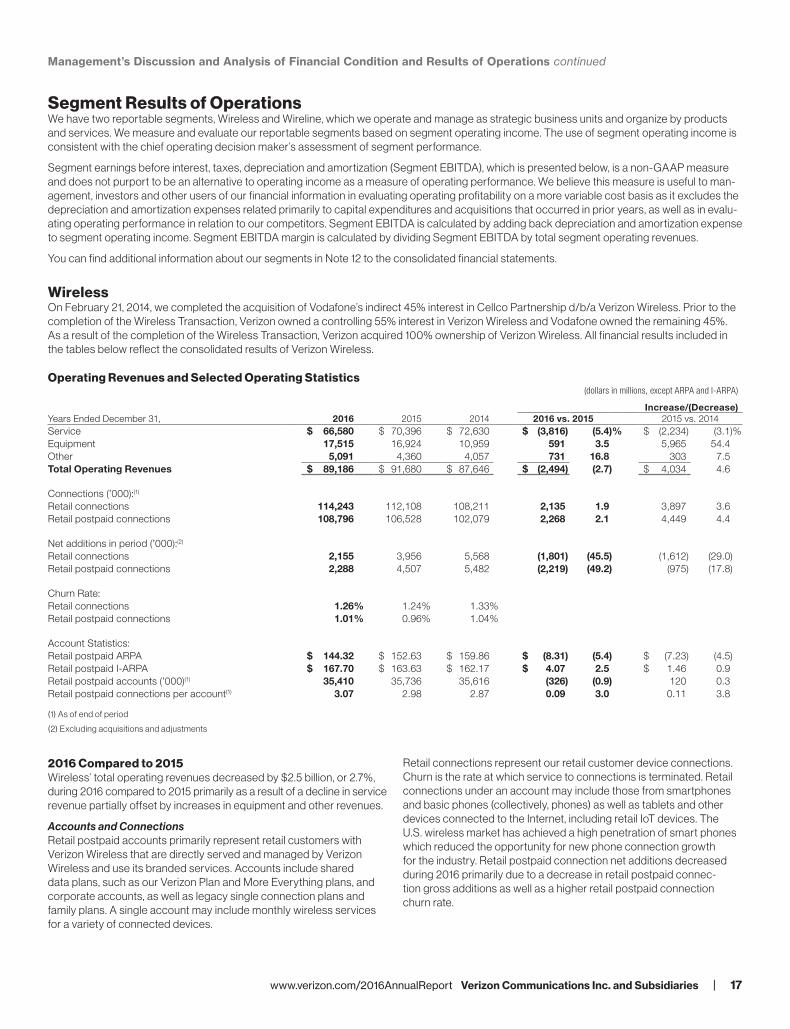
Segment Results of OperationsWe have two reportable segments, Wireless and Wireline, which we operate and manage as strategic business units and organize by products and services. We measure and evaluate our reportable segments based on segment operating income. The use of segment operating income is consistent with the chief operating decision maker’s assessment of segment performance.
Segment earnings before interest, taxes, depreciation and amortization (Segment EBITDA), which is presented below, is a non-GAAP measure and does not purport to be an alternative to operating income as a measure of operating performance. We believe this measure is useful to man-agement, investors and other users of our financial information in evaluating operating profitability on a more variable cost basis as it excludes the depreciation and amortization expenses related primarily to capital expenditures and acquisitions that occurred in prior years, as well as in evalu-ating operating performance in relation to our competitors. Segment EBITDA is calculated by adding back depreciation and amortization expense to segment operating income. Segment EBITDA margin is calculated by dividing Segment EBITDA by total segment operating revenues.
You can find additional information about our segments in Note 12 to the consolidated financial statements.
WirelessOn February 21, 2014, we completed the acquisition of Vodafone’s indirect 45% interest in Cellco Partnership d/b/a Verizon Wireless. Prior to the completion of the Wireless Transaction, Verizon owned a controlling 55% interest in Verizon Wireless and Vodafone owned the remaining 45%. As a result of the completion of the Wireless Transaction, Verizon acquired 100% ownership of Verizon Wireless. All financial results included in the tables below reflect the consolidated results of Verizon Wireless.
Operating Revenues and Selected Operating Statistics(dollars in millions, except ARPA and I-ARPA)
Increase/(Decrease)Years Ended December 31, 2016 2015 2014 2016 vs. 2015 2015 vs. 2014Service $ 66,580 $ 70,396 $ 72,630 $ (3,816) (5.4)% $ (2,234) (3.1)%Equipment 17,515 16,924 10,959 591 3.5 5,965 54.4Other 5,091 4,360 4,057 731 16.8 303 7.5Total Operating Revenues $ 89,186 $ 91,680 $ 87,646 $ (2,494) (2.7) $ 4,034 4.6
Connections (’000):(1)
Retail connections 114,243 112,108 108,211 2,135 1.9 3,897 3.6Retail postpaid connections 108,796 106,528 102,079 2,268 2.1 4,449 4.4
Net additions in period (’000):(2)
Retail connections 2,155 3,956 5,568 (1,801) (45.5) (1,612) (29.0)Retail postpaid connections 2,288 4,507 5,482 (2,219) (49.2) (975) (17.8)
Churn Rate:Retail connections 1.26% 1.24% 1.33%Retail postpaid connections 1.01% 0.96% 1.04%
Account Statistics:Retail postpaid ARPA $ 144.32 $ 152.63 $ 159.86 $ (8.31) (5.4) $ (7.23) (4.5)Retail postpaid I-ARPA $ 167.70 $ 163.63 $ 162.17 $ 4.07 2.5 $ 1.46 0.9Retail postpaid accounts (’000)(1) 35,410 35,736 35,616 (326) (0.9) 120 0.3Retail postpaid connections per account(1) 3.07 2.98 2.87 0.09 3.0 0.11 3.8
(1) As of end of period
(2) Excluding acquisitions and adjustments
2016 Compared to 2015Wireless’ total operating revenues decreased by $2.5 billion, or 2.7%, during 2016 compared to 2015 primarily as a result of a decline in service revenue partially offset by increases in equipment and other revenues.
Accounts and ConnectionsRetail postpaid accounts primarily represent retail customers with Verizon Wireless that are directly served and managed by Verizon Wireless and use its branded services. Accounts include shared data plans, such as our Verizon Plan and More Everything plans, and corporate accounts, as well as legacy single connection plans and family plans. A single account may include monthly wireless services for a variety of connected devices.
Retail connections represent our retail customer device connections. Churn is the rate at which service to connections is terminated. Retail connections under an account may include those from smartphones and basic phones (collectively, phones) as well as tablets and other devices connected to the Internet, including retail IoT devices. The U.S. wireless market has achieved a high penetration of smart phones which reduced the opportunity for new phone connection growth for the industry. Retail postpaid connection net additions decreased during 2016 primarily due to a decrease in retail postpaid connec-tion gross additions as well as a higher retail postpaid connection churn rate.
www.verizon.com/2016AnnualReport Verizon Communications Inc. and Subsidiaries | 17
Management’s Discussion and Analysis of Financial Condition and Results of Operations continued
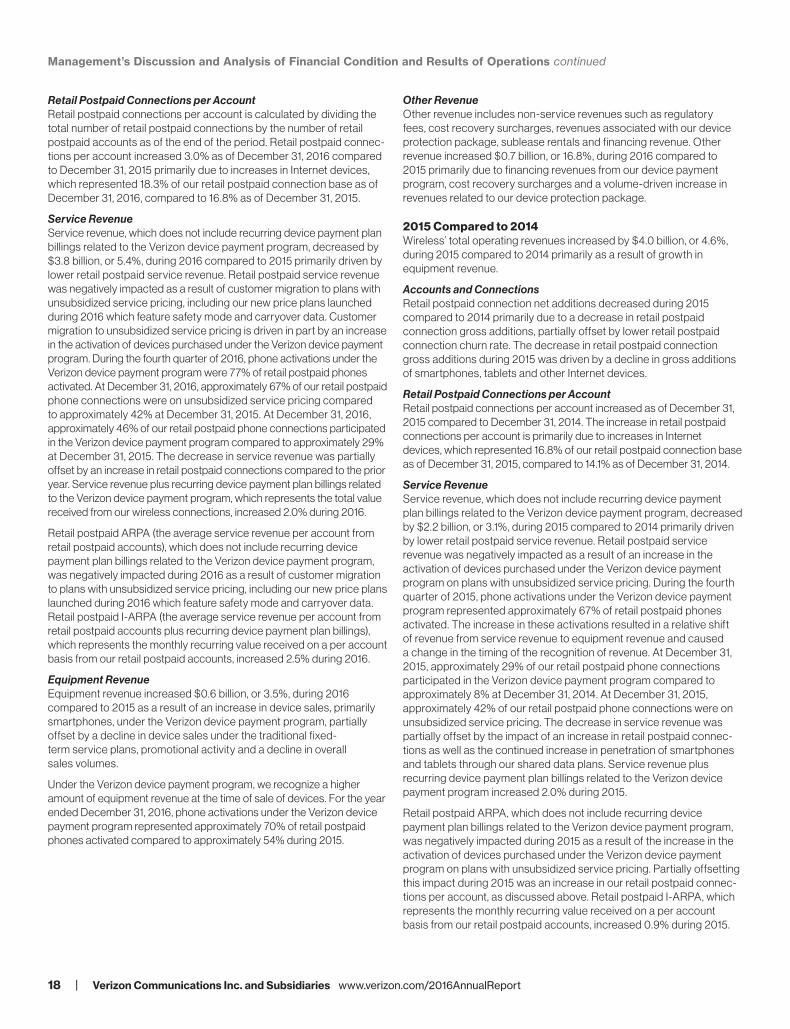
Retail Postpaid Connections per AccountRetail postpaid connections per account is calculated by dividing the total number of retail postpaid connections by the number of retail postpaid accounts as of the end of the period. Retail postpaid connec-tions per account increased 3.0% as of December 31, 2016 compared to December 31, 2015 primarily due to increases in Internet devices, which represented 18.3% of our retail postpaid connection base as of December 31, 2016, compared to 16.8% as of December 31, 2015.
Service RevenueService revenue, which does not include recurring device payment plan billings related to the Verizon device payment program, decreased by $3.8 billion, or 5.4%, during 2016 compared to 2015 primarily driven by lower retail postpaid service revenue. Retail postpaid service revenue was negatively impacted as a result of customer migration to plans with unsubsidized service pricing, including our new price plans launched during 2016 which feature safety mode and carryover data. Customer migration to unsubsidized service pricing is driven in part by an increase in the activation of devices purchased under the Verizon device payment program. During the fourth quarter of 2016, phone activations under the Verizon device payment program were 77% of retail postpaid phones activated. At December 31, 2016, approximately 67% of our retail postpaid phone connections were on unsubsidized service pricing compared to approximately 42% at December 31, 2015. At December 31, 2016, approximately 46% of our retail postpaid phone connections participated in the Verizon device payment program compared to approximately 29% at December 31, 2015. The decrease in service revenue was partially offset by an increase in retail postpaid connections compared to the prior year. Service revenue plus recurring device payment plan billings related to the Verizon device payment program, which represents the total value received from our wireless connections, increased 2.0% during 2016.
Retail postpaid ARPA (the average service revenue per account from retail postpaid accounts), which does not include recurring device payment plan billings related to the Verizon device payment program, was negatively impacted during 2016 as a result of customer migration to plans with unsubsidized service pricing, including our new price plans launched during 2016 which feature safety mode and carryover data. Retail postpaid I-ARPA (the average service revenue per account from retail postpaid accounts plus recurring device payment plan billings), which represents the monthly recurring value received on a per account basis from our retail postpaid accounts, increased 2.5% during 2016.
Equipment RevenueEquipment revenue increased $0.6 billion, or 3.5%, during 2016 compared to 2015 as a result of an increase in device sales, primarily smartphones, under the Verizon device payment program, partially offset by a decline in device sales under the traditional fixed-term service plans, promotional activity and a decline in overall sales volumes.
Under the Verizon device payment program, we recognize a higher amount of equipment revenue at the time of sale of devices. For the year ended December 31, 2016, phone activations under the Verizon device payment program represented approximately 70% of retail postpaid phones activated compared to approximately 54% during 2015.
Other RevenueOther revenue includes non- service revenues such as regulatory fees, cost recovery surcharges, revenues associated with our device protection package, sublease rentals and financing revenue. Other revenue increased $0.7 billion, or 16.8%, during 2016 compared to 2015 primarily due to financing revenues from our device payment program, cost recovery surcharges and a volume- driven increase in revenues related to our device protection package.
2015 Compared to 2014Wireless’ total operating revenues increased by $4.0 billion, or 4.6%, during 2015 compared to 2014 primarily as a result of growth in equipment revenue.
Accounts and ConnectionsRetail postpaid connection net additions decreased during 2015 compared to 2014 primarily due to a decrease in retail postpaid connection gross additions, partially offset by lower retail postpaid connection churn rate. The decrease in retail postpaid connection gross additions during 2015 was driven by a decline in gross additions of smartphones, tablets and other Internet devices.
Retail Postpaid Connections per AccountRetail postpaid connections per account increased as of December 31, 2015 compared to December 31, 2014. The increase in retail postpaid connections per account is primarily due to increases in Internet devices, which represented 16.8% of our retail postpaid connection base as of December 31, 2015, compared to 14.1% as of December 31, 2014.
Service RevenueService revenue, which does not include recurring device payment plan billings related to the Verizon device payment program, decreased by $2.2 billion, or 3.1%, during 2015 compared to 2014 primarily driven by lower retail postpaid service revenue. Retail postpaid service revenue was negatively impacted as a result of an increase in the activation of devices purchased under the Verizon device payment program on plans with unsubsidized service pricing. During the fourth quarter of 2015, phone activations under the Verizon device payment program represented approximately 67% of retail postpaid phones activated. The increase in these activations resulted in a relative shift of revenue from service revenue to equipment revenue and caused a change in the timing of the recognition of revenue. At December 31, 2015, approximately 29% of our retail postpaid phone connections participated in the Verizon device payment program compared to approximately 8% at December 31, 2014. At December 31, 2015, approximately 42% of our retail postpaid phone connections were on unsubsidized service pricing. The decrease in service revenue was partially offset by the impact of an increase in retail postpaid connec-tions as well as the continued increase in penetration of smartphones and tablets through our shared data plans. Service revenue plus recurring device payment plan billings related to the Verizon device payment program increased 2.0% during 2015.
Retail postpaid ARPA, which does not include recurring device payment plan billings related to the Verizon device payment program, was negatively impacted during 2015 as a result of the increase in the activation of devices purchased under the Verizon device payment program on plans with unsubsidized service pricing. Partially offsetting this impact during 2015 was an increase in our retail postpaid connec-tions per account, as discussed above. Retail postpaid I-ARPA, which represents the monthly recurring value received on a per account basis from our retail postpaid accounts, increased 0.9% during 2015.
18 | Verizon Communications Inc. and Subsidiaries www.verizon.com/2016AnnualReport
Management’s Discussion and Analysis of Financial Condition and Results of Operations continued
Equipment RevenueEquipment revenue increased by $6.0 billion, or 54.4%, during 2015 compared to 2014 as a result of an increase in device sales, primarily smartphones, under the Verizon device payment program, partially offset by a decline in device sales under traditional fixed-term service plans. For the year ended December 31, 2015, phone activations under the Verizon device payment program represented approximately 54% of retail postpaid phones activated compared to approximately 18% during 2014. The increase in these activations resulted in a relative shift
of revenue from service revenue to equipment revenue and caused a change in the timing of the recognition of revenue. This shift in revenue was the result of recognizing a higher amount of equipment revenue at the time of sale of devices under the device payment program.
Other RevenueOther revenue increased $0.3 billion, or 7.5%, during 2015 compared to 2014 primarily due to a volume- driven increase in revenues related to our device protection package.
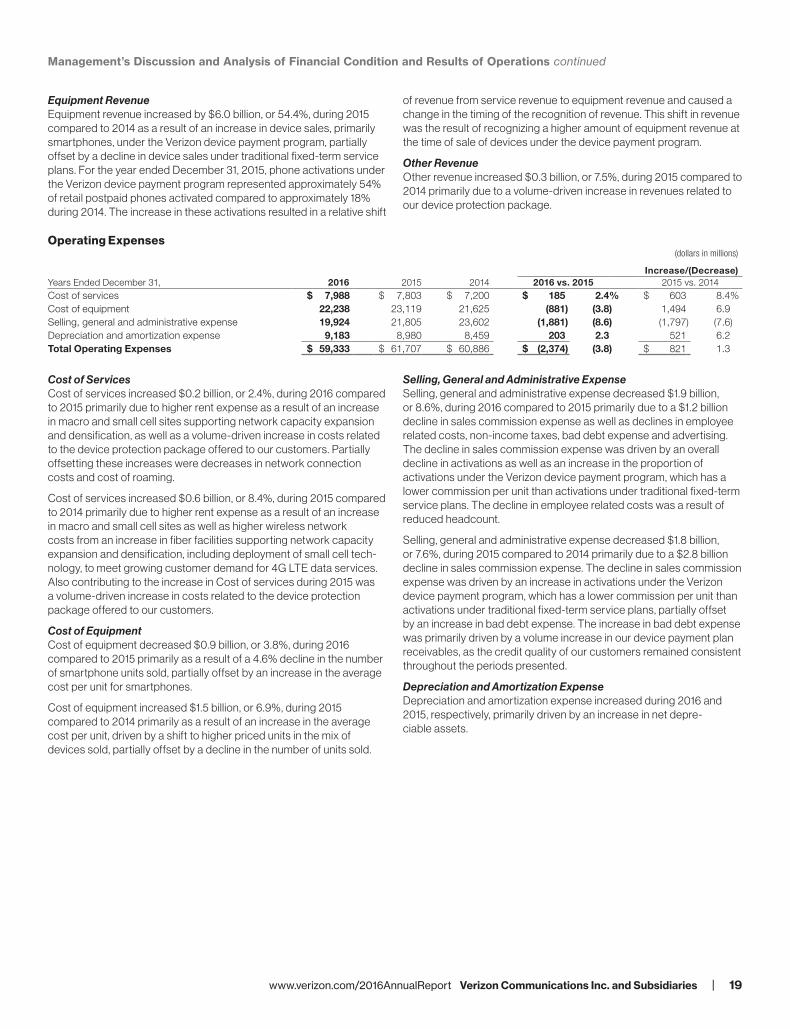
Operating Expenses(dollars in millions)
Increase/(Decrease)Years Ended December 31, 2016 2015 2014 2016 vs. 2015 2015 vs. 2014Cost of services $ 7,988 $ 7,803 $ 7,200 $ 185 2.4% $ 603 8.4%Cost of equipment 22,238 23,119 21,625 (881) (3.8) 1,494 6.9Selling, general and administrative expense 19,924 21,805 23,602 (1,881) (8.6) (1,797) (7.6)Depreciation and amortization expense 9,183 8,980 8,459 203 2.3 521 6.2Total Operating Expenses $ 59,333 $ 61,707 $ 60,886 $ (2,374) (3.8) $ 821 1.3
Cost of ServicesCost of services increased $0.2 billion, or 2.4%, during 2016 compared to 2015 primarily due to higher rent expense as a result of an increase in macro and small cell sites supporting network capacity expansion and densification, as well as a volume- driven increase in costs related to the device protection package offered to our customers. Partially offsetting these increases were decreases in network connection costs and cost of roaming.
Cost of services increased $0.6 billion, or 8.4%, during 2015 compared to 2014 primarily due to higher rent expense as a result of an increase in macro and small cell sites as well as higher wireless network costs from an increase in fiber facilities supporting network capacity expansion and densification, including deployment of small cell tech-nology, to meet growing customer demand for 4G LTE data services. Also contributing to the increase in Cost of services during 2015 was a volume- driven increase in costs related to the device protection package offered to our customers.
Cost of EquipmentCost of equipment decreased $0.9 billion, or 3.8%, during 2016 compared to 2015 primarily as a result of a 4.6% decline in the number of smartphone units sold, partially offset by an increase in the average cost per unit for smartphones.
Cost of equipment increased $1.5 billion, or 6.9%, during 2015 compared to 2014 primarily as a result of an increase in the average cost per unit, driven by a shift to higher priced units in the mix of devices sold, partially offset by a decline in the number of units sold.
Selling, General and Administrative ExpenseSelling, general and administrative expense decreased $1.9 billion, or 8.6%, during 2016 compared to 2015 primarily due to a $1.2 billion decline in sales commission expense as well as declines in employee related costs, non- income taxes, bad debt expense and advertising. The decline in sales commission expense was driven by an overall decline in activations as well as an increase in the proportion of activations under the Verizon device payment program, which has a lower commission per unit than activations under traditional fixed-term service plans. The decline in employee related costs was a result of reduced headcount.
Selling, general and administrative expense decreased $1.8 billion, or 7.6%, during 2015 compared to 2014 primarily due to a $2.8 billion decline in sales commission expense. The decline in sales commission expense was driven by an increase in activations under the Verizon device payment program, which has a lower commission per unit than activations under traditional fixed-term service plans, partially offset by an increase in bad debt expense. The increase in bad debt expense was primarily driven by a volume increase in our device payment plan receivables, as the credit quality of our customers remained consistent throughout the periods presented.
Depreciation and Amortization ExpenseDepreciation and amortization expense increased during 2016 and 2015, respectively, primarily driven by an increase in net depre-ciable assets.
www.verizon.com/2016AnnualReport Verizon Communications Inc. and Subsidiaries | 19
Management’s Discussion and Analysis of Financial Condition and Results of Operations continued
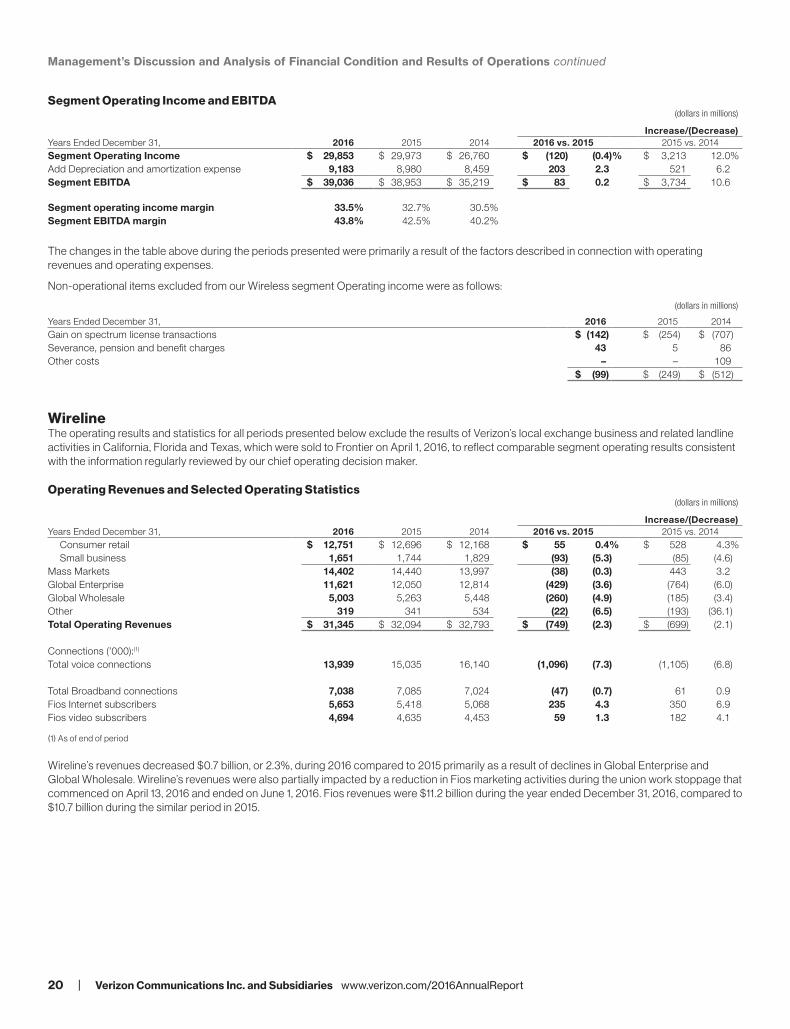
Segment Operating Income and EBITDA(dollars in millions)
Increase/(Decrease)Years Ended December 31, 2016 2015 2014 2016 vs. 2015 2015 vs. 2014Segment Operating Income $ 29,853 $ 29,973 $ 26,760 $ (120) (0.4)% $ 3,213 12.0%Add Depreciation and amortization expense 9,183 8,980 8,459 203 2.3 521 6.2Segment EBITDA $ 39,036 $ 38,953 $ 35,219 $ 83 0.2 $ 3,734 10.6
Segment operating income margin 33.5% 32.7% 30.5%Segment EBITDA margin 43.8% 42.5% 40.2%
The changes in the table above during the periods presented were primarily a result of the factors described in connection with operating revenues and operating expenses.
Non- operational items excluded from our Wireless segment Operating income were as follows:
(dollars in millions)
Years Ended December 31, 2016 2015 2014Gain on spectrum license transactions $ (142) $ (254) $ (707)Severance, pension and benefit charges 43 5 86Other costs – – 109
$ (99) $ (249) $ (512)
WirelineThe operating results and statistics for all periods presented below exclude the results of Verizon’s local exchange business and related landline activities in California, Florida and Texas, which were sold to Frontier on April 1, 2016, to reflect comparable segment operating results consistent with the information regularly reviewed by our chief operating decision maker.
Operating Revenues and Selected Operating Statistics(dollars in millions)
Increase/(Decrease)Years Ended December 31, 2016 2015 2014 2016 vs. 2015 2015 vs. 2014
Consumer retail $ 12,751 $ 12,696 $ 12,168 $ 55 0.4% $ 528 4.3%Small business 1,651 1,744 1,829 (93) (5.3) (85) (4.6)
Mass Markets 14,402 14,440 13,997 (38) (0.3) 443 3.2Global Enterprise 11,621 12,050 12,814 (429) (3.6) (764) (6.0)Global Wholesale 5,003 5,263 5,448 (260) (4.9) (185) (3.4)Other 319 341 534 (22) (6.5) (193) (36.1)Total Operating Revenues $ 31,345 $ 32,094 $ 32,793 $ (749) (2.3) $ (699) (2.1)
Connections (’000):(1)
Total voice connections 13,939 15,035 16,140 (1,096) (7.3) (1,105) (6.8)
Total Broadband connections 7,038 7,085 7,024 (47) (0.7) 61 0.9Fios Internet subscribers 5,653 5,418 5,068 235 4.3 350 6.9Fios video subscribers 4,694 4,635 4,453 59 1.3 182 4.1
(1) As of end of period
Wireline’s revenues decreased $0.7 billion, or 2.3%, during 2016 compared to 2015 primarily as a result of declines in Global Enterprise and Global Wholesale. Wireline’s revenues were also partially impacted by a reduction in Fios marketing activities during the union work stoppage that commenced on April 13, 2016 and ended on June 1, 2016. Fios revenues were $11.2 billion during the year ended December 31, 2016, compared to $10.7 billion during the similar period in 2015.
20 | Verizon Communications Inc. and Subsidiaries www.verizon.com/2016AnnualReport
Management’s Discussion and Analysis of Financial Condition and Results of Operations continued
Mass MarketsMass Markets operations provide broadband Internet and video services (including high-speed Internet, Fios Internet and Fios video services) and local exchange (basic service and end-user access) and long distance (including regional toll) voice services to residential and small business subscribers.
2016 Compared to 2015Mass Markets revenues decreased 0.3%, during 2016 compared to 2015 as the continued decline of local exchange revenues was partially offset by increases in Fios revenues due to subscriber growth for Fios services (Internet, video and voice).
The decline of local exchange revenues was primarily due to a 7.5% decline in Consumer retail voice connections resulting primarily from competition and technology substitution with wireless and competing voice over Internet Protocol (VoIP) and cable telephony services. Total voice connections include traditional switched access lines in service as well as Fios digital voice connections. There was also an 8.0% decline in Small business retail voice connections, reflecting compe-tition and a shift to both IP and high-speed circuits, primarily in areas outside of our Fios footprint.
During 2016, we grew our subscriber base by 0.2 million Fios Internet subscribers and 0.1 million Fios video subscribers, while also improving penetration rates within our Fios service areas for Fios Internet. As of December 31, 2016, we achieved a penetration rate of 40.4% for Fios Internet compared to a penetration rate of 40.2% for Fios Internet as of December 31, 2015. Our Fios connection growth for 2016 was impacted by a reduction in Fios marketing activities during the union work stoppage that commenced on April 13, 2016 and ended on June 1, 2016. Consumer Fios revenues increased $0.4 billion, or 4.3%. Fios represented approximately 82% of Consumer retail revenue during 2016 compared to approximately 79% during 2015.
2015 Compared to 2014Mass Markets revenues increased $0.4 billion, or 3.2%, during 2015 compared to 2014 primarily due to the expansion of Fios services (voice, Internet and video), including our Fios Quantum offerings, as well as changes in our pricing strategies, partially offset by the continued decline of local exchange revenues.
During 2015, we grew our subscriber base by 0.4 million Fios Internet subscribers and by 0.2 million Fios video subscribers, while also improving the penetration rate within our Fios service areas for Fios Internet. As of December 31, 2015, we achieved a penetration rate of 40.2% for Fios Internet compared to a penetration rate of 39.5% for Fios Internet as of December 31, 2014. During 2015, Consumer Fios revenue increased $0.9 billion, or 9.5%. Fios represented approx-imately 79% of Consumer retail revenue during 2015 compared to approximately 75% during 2014.
The decline of local exchange revenues was primarily due to a 6.2% decline in Consumer retail voice connections resulting primarily from competition and technology substitution with wireless, competing VoIP and cable telephony services. Total voice connections include traditional switched access lines in service as well as Fios digital voice connections. There was also a 7.1% decline in Small business retail voice connections, reflecting competition and a shift to both IP and high-speed circuits, primarily in areas outside of our Fios footprint.
Global EnterpriseGlobal Enterprise offers advanced information and communication technology services and other traditional communications services to medium and large business customers, multinational corporations and state and federal government customers.
2016 Compared to 2015Global Enterprise revenues decreased $0.4 billion, or 3.6%, during 2016 compared to 2015 due to declines in traditional data and advanced networking solutions, cloud and IT services and voice communications services. Also contributing to the decrease was the negative impact of foreign exchange rates. Our traditional data net-working services, which consist of traditional circuit-based services such as frame relay, private line and legacy data networking services, our advanced networking solutions, which include Private IP, Public Internet, Ethernet and optical network services, and our cloud and IT services declined as a result of competitive price pressures.
2015 Compared to 2014Global Enterprise revenues decreased $0.8 billion, or 6.0%, during 2015 compared to 2014 primarily due to a decline in core voice services and data networking revenues, which consist of traditional circuit-based services such as frame relay, private line and legacy voice and data services. These core services declined as a result of secular declines. Also contributing to the decrease were lower net-working solutions revenues, a decline in customer premise equipment revenues and the negative impact of foreign exchange rates. Networking solutions, which include Private IP, Public Internet, Ethernet and optical network services, declined as a result of competitive price compression.
Global WholesaleGlobal Wholesale provides communications services, including data, voice and local dial tone and broadband services primarily to local, long distance and other carriers that use our facilities to provide services to their customers.
2016 Compared to 2015Global Wholesale revenues decreased $0.3 billion, or 4.9%, during 2016 compared to 2015 primarily due to declines in data revenues and traditional voice revenues driven by the effect of technology substitution as well as continuing contraction of market rates due to competition. As a result of technology substitution, the number of core data circuits at December 31, 2016 decreased 16.3% compared to December 31, 2015. The decline in traditional voice revenue is driven by a 5.8% decline in domestic wholesale connections at December 31, 2016, compared to December 31, 2015.
2015 Compared to 2014Global Wholesale revenues decreased $0.2 billion, or 3.4%, during 2015 compared to 2014 primarily due to declines in traditional voice revenues and data revenues driven by the effect of technology substitution as well as continuing contraction of market rates due to competition. The decline in traditional voice revenue was also due to a decrease in minutes of use. We experienced a 7.3% decline in domestic wholesale connections between December 31, 2015 and December 31, 2014. As a result of technology substitution, the number of core data circuits at December 31, 2015 decreased 14.7% compared to December 31, 2014.
www.verizon.com/2016AnnualReport Verizon Communications Inc. and Subsidiaries | 21
Management’s Discussion and Analysis of Financial Condition and Results of Operations continued
Operating Expenses(dollars in millions)
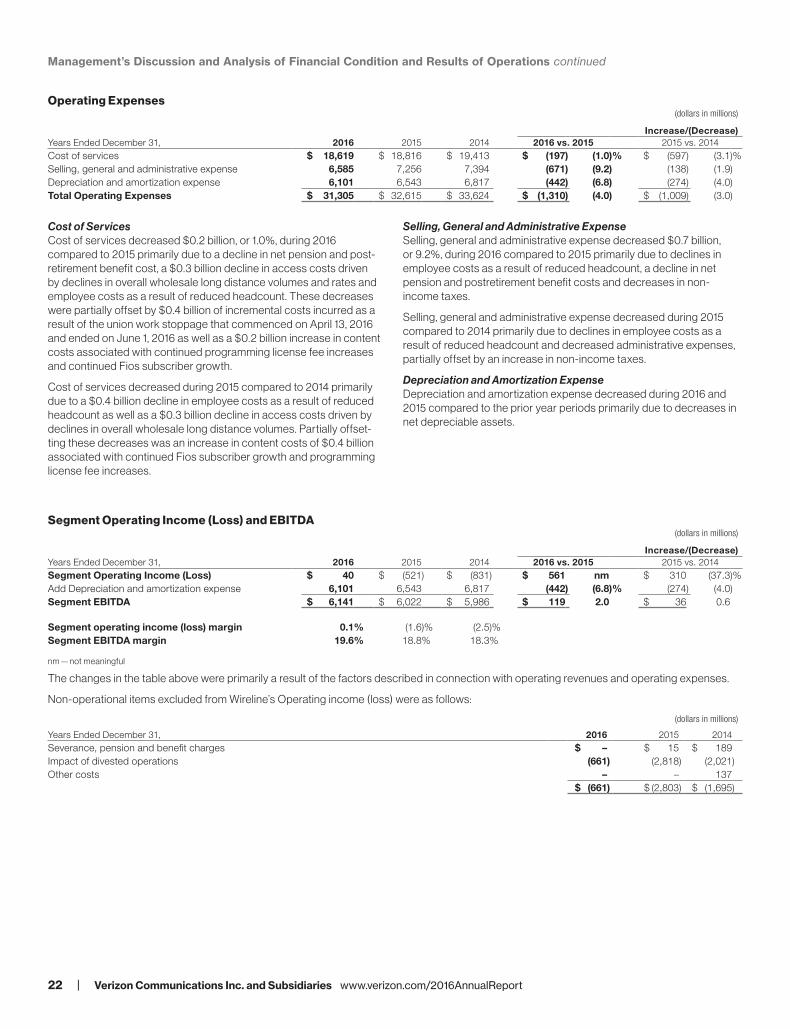
Increase/(Decrease)Years Ended December 31, 2016 2015 2014 2016 vs. 2015 2015 vs. 2014Cost of services $ 18,619 $ 18,816 $ 19,413 $ (197) (1.0)% $ (597) (3.1)%Selling, general and administrative expense 6,585 7,256 7,394 (671) (9.2) (138) (1.9)Depreciation and amortization expense 6,101 6,543 6,817 (442) (6.8) (274) (4.0)Total Operating Expenses $ 31,305 $ 32,615 $ 33,624 $ (1,310) (4.0) $ (1,009) (3.0)
Cost of ServicesCost of services decreased $0.2 billion, or 1.0%, during 2016 compared to 2015 primarily due to a decline in net pension and post-retirement benefit cost, a $0.3 billion decline in access costs driven by declines in overall wholesale long distance volumes and rates and employee costs as a result of reduced headcount. These decreases were partially offset by $0.4 billion of incremental costs incurred as a result of the union work stoppage that commenced on April 13, 2016 and ended on June 1, 2016 as well as a $0.2 billion increase in content costs associated with continued programming license fee increases and continued Fios subscriber growth.
Cost of services decreased during 2015 compared to 2014 primarily due to a $0.4 billion decline in employee costs as a result of reduced headcount as well as a $0.3 billion decline in access costs driven by declines in overall wholesale long distance volumes. Partially offset-ting these decreases was an increase in content costs of $0.4 billion associated with continued Fios subscriber growth and programming license fee increases.
Selling, General and Administrative ExpenseSelling, general and administrative expense decreased $0.7 billion, or 9.2%, during 2016 compared to 2015 primarily due to declines in employee costs as a result of reduced headcount, a decline in net pension and postretirement benefit costs and decreases in non- income taxes.
Selling, general and administrative expense decreased during 2015 compared to 2014 primarily due to declines in employee costs as a result of reduced headcount and decreased administrative expenses, partially offset by an increase in non- income taxes.
Depreciation and Amortization ExpenseDepreciation and amortization expense decreased during 2016 and 2015 compared to the prior year periods primarily due to decreases in net depreciable assets.
Segment Operating Income (Loss) and EBITDA(dollars in millions)
Increase/(Decrease)Years Ended December 31, 2016 2015 2014 2016 vs. 2015 2015 vs. 2014Segment Operating Income (Loss) $ 40 $ (521) $ (831) $ 561 nm $ 310 (37.3)%Add Depreciation and amortization expense 6,101 6,543 6,817 (442) (6.8)% (274) (4.0)Segment EBITDA $ 6,141 $ 6,022 $ 5,986 $ 119 2.0 $ 36 0.6
Segment operating income (loss) margin 0.1% (1.6)% (2.5)%Segment EBITDA margin 19.6% 18.8% 18.3%
nm — not meaningful
The changes in the table above were primarily a result of the factors described in connection with operating revenues and operating expenses.
Non- operational items excluded from Wireline’s Operating income (loss) were as follows:
(dollars in millions)
Years Ended December 31, 2016 2015 2014Severance, pension and benefit charges $ – $ 15 $ 189Impact of divested operations (661) (2,818) (2,021)Other costs – – 137
$ (661) $ (2,803) $ (1,695)
22 | Verizon Communications Inc. and Subsidiaries www.verizon.com/2016AnnualReport
Management’s Discussion and Analysis of Financial Condition and Results of Operations continued
Other Items
Severance, Pension and Benefit Charges (Credits)During 2016, we recorded net pre-tax severance, pension and benefit charges of $2.9 billion in accordance with our accounting policy to recognize actuarial gains and losses in the period in which they occur. The pension and benefit remeasurement charges of $2.5 billion were primarily driven by a decrease in our discount rate assumption used to determine the current year liabilities of our pension and other postretirement benefit plans from a weighted- average of 4.6% at December 31, 2015 to a weighted- average of 4.2% at December 31, 2016 ($2.1 billion), updated health care trend cost assumptions ($0.9 billion), the difference between our estimated return on assets of 7.0% and our actual return on assets of 6.0% ($0.2 billion) and other assumption adjustments ($0.3 billion). These charges were partially offset by a change in mortality assumptions primarily driven by the use of updated actuarial tables (MP-2016) issued by the Society of Actuaries ($0.5 billion) and lower negotiated prescription drug pricing ($0.5 billion). As part of these charges, we also recorded severance costs of $0.4 billion under our existing separation plans.
The net pre-tax severance, pension and benefit charges during 2016 were comprised of a net pre-tax pension remeasurement charge of $0.2 billion measured as of March 31, 2016 related to settlements for employees who received lump-sum distributions in one of our defined benefit pension plans, a net pre-tax pension and benefit remeasure-ment charge of $0.8 billion measured as of April 1, 2016 related to curtailments in three of our defined benefit pension and one of our other postretirement plans, a net pre-tax pension and benefit remea-surement charge of $2.7 billion measured as of May 31, 2016 in two defined benefit pension plans and three other postretirement benefit plans as a result of our accounting for the contractual healthcare caps and bargained for changes, a net pre-tax pension remeasurement charge of $0.1 billion measured as of May 31, 2016 related to settle-ments for employees who received lump-sum distributions in three of our defined benefit pension plans, a net pre-tax pension remeasure-ment charge of $0.6 billion measured as of August 31, 2016 related to settlements for employees who received lump-sum distributions in five of our defined benefit pension plans, and a net pre-tax pension and benefit credit of $1.9 billion as a result of our fourth quarter remea-surement of our pension and other postretirement assets and liabilities based on updated actuarial assumptions.
During 2015, we recorded net pre-tax severance, pension and benefit credits of approximately $2.3 billion primarily for our pension and post-retirement plans in accordance with our accounting policy to recognize actuarial gains and losses in the year in which they occur. The credits were primarily driven by an increase in our discount rate assumption used to determine the current year liabilities from a weighted- average of 4.2% at December 31, 2014 to a weighted- average of 4.6% at December 31, 2015 ($2.5 billion), the execution of a new prescription drug contract during 2015 ($1.0 billion) and a change in mortality assumptions primarily driven by the use of updated actuarial tables (MP-2015) issued by the Society of Actuaries ($0.9 billion), partially offset by the differ-ence between our estimated return on assets of 7.25% at December 31, 2014 and our actual return on assets of 0.7% at December 31, 2015 ($1.2 billion), severance costs recorded under our existing separation plans ($0.6 billion) and other assumption adjustments ($0.3 billion).
During 2014, we recorded net pre-tax severance, pension and benefit charges of approximately $7.5 billion primarily for our pension and post-retirement plans in accordance with our accounting policy to recognize actuarial gains and losses in the year in which they occur. The charges
were primarily driven by a decrease in our discount rate assumption used to determine the current year liabilities from a weighted- average of 5.0% at December 31, 2013 to a weighted- average of 4.2% at December 31, 2014 ($5.2 billion), a change in mortality assumptions primarily driven by the use of updated actuarial tables (RP-2014 and MP-2014) issued by the Society of Actuaries in October 2014 ($1.8 billion) and revisions to the retirement assumptions for participants and other assumption adjustments, partially offset by the difference between our estimated return on assets of 7.25% and our actual return on assets of 10.5% ($0.6 billion). As part of this charge, we recorded severance costs of $0.5 billion under our existing separation plans.
The Consolidated Adjusted EBITDA non-GAAP measure presented in the Consolidated Net Income, Operating Income and EBITDA discussion (see “Consolidated Results of Operations”) excludes the severance, pension and benefit charges (credits) presented above.
Early Debt Redemption and Other CostsDuring 2016, we recorded net debt redemption costs of $1.8 billion in connection with the early redemption of $2.2 billion aggregate principal amount of Verizon Communications notes called and redeemed in whole, as well as the early redemption pursuant to three concurrent, but separate, tender offers of the following: $3.0 billion aggregate principal amount of Verizon Communications notes included in the Group 1 Any and All Offer; $1.2 billion aggregate principal amount of debentures of our operating telephone company subsidiaries included in the Group 2 Any and All Offer; $3.8 billion aggregate principal amount of Verizon Communications notes, $0.2 billion aggregate principal amount of Alltel Corporation debentures and $0.3 billion aggregate principal amount of GTE Corporation debentures included in the Group 3 Offer. See Note 6 to the consolidated financial state-ments for additional details related to our early debt redemptions.
During 2014, we recorded net debt redemption costs of $1.4 billion in connection with the early redemption of $4.5 billion aggregate principal amount of Verizon Communications notes, $1.7 billion aggregate principal amount of Cellco Partnership and Verizon Wireless Capital LLC notes and $0.1 billion aggregate principal amount of Alltel Corporation debentures as well as the purchase of the following pursuant to a tender offer: $3.2 billion aggregate principal amount of Verizon Communications notes, $0.6 billion aggregate principal amount of Cellco Partnership and Verizon Wireless Capital LLC notes, $0.3 billion aggregate principal amount of GTE Corporation deben-tures and $0.2 billion aggregate principal amount of Alltel Corporation debentures. We also recorded $0.3 billion of other costs.
We recognize early debt redemption costs in Other income and (expense), net on our consolidated statements of income.
www.verizon.com/2016AnnualReport Verizon Communications Inc. and Subsidiaries | 23
Management’s Discussion and Analysis of Financial Condition and Results of Operations continued
Gain on Access Line SaleDuring the second quarter of 2016, we completed the Access Line Sale. As a result of this transaction, we recorded a pre-tax gain of approximately $1.0 billion in Selling, general and administrative expense on our consolidated statement of income for the year ended December 31, 2016. The pre-tax gain included a $0.5 billion pension and postretirement benefit curtailment gain due to the elimination of the accrual of pension and other postretirement benefits for some or all future services of a significant number of employees covered in three of our defined benefit pension plans and one of our other post-retirement benefit plans.
The Consolidated Adjusted EBITDA non-GAAP measure presented in the Consolidated Net Income, Operating Income and EBITDA discus-sion (see “Consolidated Results of Operations”) excludes the gain on the access line sale described above.
Gain on Spectrum License TransactionsDuring the first quarter of 2016, we completed a license exchange transaction with affiliates of AT&T Inc. (AT&T) to exchange certain Advanced Wireless Services (AWS) and Personal Communication Services (PCS) spectrum licenses. As a result of this non-cash exchange, we received $0.4 billion of AWS and PCS spectrum licenses at fair value and we recorded a pre-tax gain of approximately $0.1 billion in Selling, general and administrative expense on our con-solidated statement of income for the year ended December 31, 2016.
During the fourth quarter of 2015, we completed a license exchange transaction with an affiliate of T- Mobile USA Inc. (T- Mobile USA) to exchange certain AWS and PCS licenses. As a result of this non-cash exchange, we received $0.4 billion of AWS and PCS spectrum licenses at fair value and we recorded a pre-tax gain of approximately $0.3 billion in Selling, general and administrative expense on our con-solidated statement of income for the year ended December 31, 2015.
During the second quarter of 2014, we completed license exchange transactions with T- Mobile USA to exchange certain AWS and PCS licenses. The exchange included a number of swaps that we expect will result in more efficient use of the AWS and PCS bands. As a result of these exchanges, we received $0.9 billion of AWS and PCS spectrum licenses at fair value and we recorded an immaterial gain.
During the second quarter of 2014, we completed transactions pursuant to two additional agreements with T- Mobile USA with respect to our remaining 700 MHz A block spectrum licenses. Under one agreement, we sold certain of these licenses to T- Mobile USA in exchange for cash consideration of approximately $2.4 billion, and under the second agreement we exchanged the remainder of our 700 MHz A block spectrum licenses as well as AWS and PCS spectrum licenses for AWS and PCS spectrum licenses. As a result, we received $1.6 billion of AWS and PCS spectrum licenses at fair value and we recorded a pre-tax gain of approximately $0.7 billion in Selling, general and administrative expense on our consolidated statement of income for the year ended December 31, 2014.
The Consolidated Adjusted EBITDA non-GAAP measure presented in the Consolidated Net Income, Operating Income and EBITDA discus-sion (see “Consolidated Results of Operations”) excludes the gains on the spectrum license transactions described above.
Wireless Transaction CostsAs a result of the third-party indebtedness incurred to finance the Wireless Transaction, we incurred interest expense of $0.4 billion during 2014 (see “Consolidated Financial Condition”). This amount represents the interest expense incurred prior to the closing of the Wireless Transaction.
Gain on Sale of Omnitel InterestAs a result of the sale of the Omnitel Interest on February 21, 2014, which was part of the consideration for the Wireless Transaction, we recorded a gain of $1.9 billion in Equity in (losses) earnings of unconsolidated businesses on our consolidated statement of income during 2014.
Impact of Divested OperationsOn April 1, 2016, we completed the Access Line Sale to Frontier.
On July 1, 2014, we sold a non- strategic Wireline business that provides communications solutions to a variety of government agencies.
The Consolidated Adjusted EBITDA non-GAAP measure presented in the Consolidated Net Income, Operating Income and EBITDA discus-sion (see “Consolidated Results of Operations”) excludes the historical financial results of the divested operations described above.
Operating Environment and TrendsThe industries that we operate in are highly competitive, which we expect to continue particularly as traditional, non- traditional and emerging service providers seek increased market share. We believe that our high- quality customer base and superior networks differ-entiate us from our competitors and give us the ability to plan and manage through changing economic and competitive conditions. We remain focused on executing on the fundamentals of the business: maintaining a high- quality customer base, delivering strong financial and operating results and generating strong free cash flows. We will continue to invest for growth, which we believe is the key to creating value for our shareowners. We are investing in innovative technology, such as 5G and high-speed fiber, as well as the platforms that will position us to capture incremental profitable growth in new areas, like mobile video and IoT, to position ourselves at the center of growth trends of the future.
The U.S. wireless market has achieved a high penetration of smart-phones which reduces the opportunity for new phone connection growth for the industry. We expect future revenue growth in the industry to be driven by monetization of usage through new ecosys-tems, and penetration increases in other connected devices including tablets and IoT devices. Current and potential competitors in the U.S. wireless market include other national wireless service providers, various regional wireless service providers, wireless resellers as well as other communications and technology companies providing wireless products and services.
24 | Verizon Communications Inc. and Subsidiaries www.verizon.com/2016AnnualReport
Management’s Discussion and Analysis of Financial Condition and Results of Operations continued
Service and equipment pricing continue to play an important role in the wireless competitive landscape. We compete in this area by offering our customers services and devices that we believe they will regard as the best available value for the price. As the demand for wireless data services continues to grow, we and other wireless service providers are offering service plans at competitive prices that include a specific amount of data access in varying megabyte or gigabyte sizes or, in some cases, unlimited data usage subject to certain restrictions. These allowances will vary from time to time as part of promotional offers or in response to market circumstances. We and many other wireless service providers allow customers to carry over unused data allowances to the next billing period or provide access to specific data content free of data charges to the customer. We expect future service growth opportunities to arise following the migration of customers to unsubsidized pricing and will be dependent on expanding the pen-etration of our services and increasing the number of ways that our customers can connect with our network and services.
Many wireless service providers, as well as equipment manufacturers, offer device payment options that distinguish service pricing from equipment pricing and blur the traditional boundary between prepaid and postpaid plans. These payment options include device payment plans, which provide customers with the ability to pay for their device over a period of time, and device leasing arrangements. Historically, wireless service providers offered customers wireless plans whereby, in exchange for the customer entering into a fixed-term service agreement, the wireless service providers significantly, and in some cases fully, subsidized the customer’s device purchase. Wireless providers recovered those subsidies through higher service fees as compared to those paid by customers on device installment plans. We and many other wireless providers have limited or discontinued this form of device subsidy. As a result, we have experienced significant growth in the percentage of activations on device payment plans and the number of customers on plans with unsubsidized service pricing. The increase in activations on device payment plans results in a relative shift of revenue from service revenue to equipment revenue and causes a change in the timing of the recognition of revenue. This shift in revenue is the result of recognizing a higher amount of equipment revenue at the time of sale of devices under the device payment program, while recognizing a lower amount of monthly service revenue with unsubsidized service pricing.
Current and potential competitors to our Wireline businesses include cable companies, wireless service providers, other domestic and foreign telecommunications providers, satellite television companies, Internet service providers and other companies that offer network services and managed enterprise solutions.
In addition, companies with a global presence increasingly compete with our Wireline businesses. A relatively small number of telecom-munications and integrated service providers with global operations serve customers in the global enterprise and, to a lesser extent, the global wholesale markets. We compete with these full or near-full service providers for large contracts to provide integrated services to global enterprises. Many of these companies have strong market presence, brand recognition, and existing customer relationships, all of which contribute to intensifying competition that may affect our future revenue growth.
Despite this challenging environment, we expect that we will be able to grow key aspects of our Wireline segment by providing network reliability, offering product bundles that include broadband Internet access, digital television and local and long distance voice services, offering more robust IP products and services, and accelerating our
IoT strategies. We will also continue to focus on cost efficiencies to attempt to offset adverse impacts from unfavorable economic condi-tions and competitive pressures.
2017 Connection TrendsIn our Wireless segment, we expect to continue to attract and maintain the loyalty of high- quality retail postpaid customers, capitalizing on demand for data services and bringing our customers new ways of using wireless services in their daily lives. We expect that future connection growth will be driven by smartphones, tablets and other connected devices. We believe these devices will attract and retain higher value retail postpaid connections, contribute to continued increases in the penetration of data services and help us remain competitive with other wireless carriers. We expect to manage churn by providing a consistent, reliable experience on our wireless network and focusing on improving the customer experience through simplified pricing and better execution in our distribution channels.
In our Wireline segment, we have experienced continuing access line losses as customers have disconnected both primary and secondary lines and switched to alternative technologies such as wireless, VoIP and cable for voice and data services. We expect to continue to expe-rience access line losses as customers continue to switch to alternate technologies. As we seek to increase our penetration rates within our Fios service areas and expand our existing business through initiatives such as One Fiber, we expect to continue to grow our Fios Internet and video connections.
2017 Operating Revenue TrendsIn our Wireless segment, we expect to continue to experience declines in service revenue as a result of our customer base migration to unsub-sidized service pricing, the introduction of new pricing structures in 2016 and early 2017 and the use of promotions. Equipment revenues are largely dependent on wireless device sales volumes, the mix of devices, promotions and upgrade cycles, which are subject to device lifecycles, iconic device launches and competition within the wireless industry.
We expect growth in our Fios broadband and video subscriber base to positively impact our Consumer retail revenue. We also expect a continuing decline in Consumer retail revenue related to retail voice and legacy broadband connection losses. We expect a continued decline in revenues for our legacy wholesale and enterprise markets. However, we expect the acquisition of XO Holdings’ wireline business to mitigate these declines. In Global Enterprise, we also expect additional revenues from application services, such as our cloud, security and other solutions-based services, and continued customer migration of their services to Private IP and other strategic networking services to partially mitigate these pressures.
We expect initiatives to develop platforms, content and applications in the mobile video and IoT space will have a long-term positive impact on revenues, drive usage on our network and monetize our investments.
2017 Operating Cost and Expense TrendsWe expect our consolidated operating income margin and adjusted EBITDA margin to remain strong as we continue to undertake initia-tives to reduce our overall cost structure by improving productivity and gaining efficiency in our operations throughout the business in 2017 and beyond. Expenses related to new products and services, such as mobile video, and expenses related to newly acquired businesses will apply offsetting pressure to our margins.
www.verizon.com/2016AnnualReport Verizon Communications Inc. and Subsidiaries | 25
Management’s Discussion and Analysis of Financial Condition and Results of Operations continued
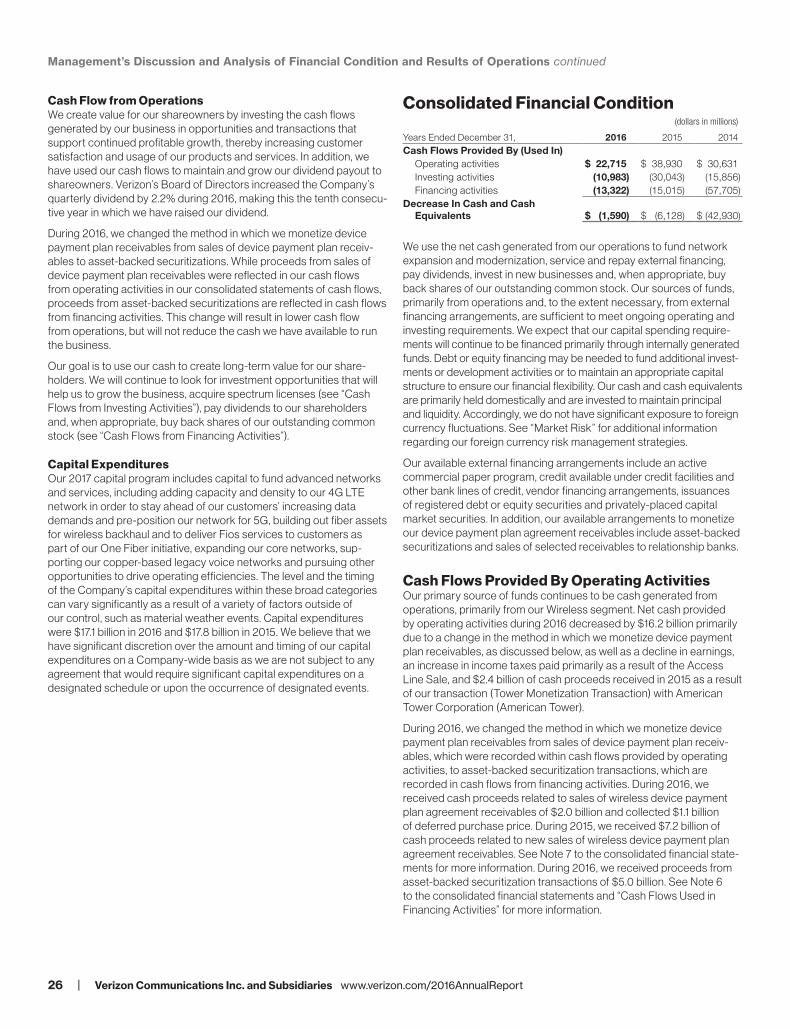
Cash Flow from OperationsWe create value for our shareowners by investing the cash flows generated by our business in opportunities and transactions that support continued profitable growth, thereby increasing customer satisfaction and usage of our products and services. In addition, we have used our cash flows to maintain and grow our dividend payout to shareowners. Verizon’s Board of Directors increased the Company’s quarterly dividend by 2.2% during 2016, making this the tenth consecu-tive year in which we have raised our dividend.
During 2016, we changed the method in which we monetize device payment plan receivables from sales of device payment plan receiv-ables to asset- backed securitizations. While proceeds from sales of device payment plan receivables were reflected in our cash flows from operating activities in our consolidated statements of cash flows, proceeds from asset- backed securitizations are reflected in cash flows from financing activities. This change will result in lower cash flow from operations, but will not reduce the cash we have available to run the business.
Our goal is to use our cash to create long-term value for our share-holders. We will continue to look for investment opportunities that will help us to grow the business, acquire spectrum licenses (see “Cash Flows from Investing Activities”), pay dividends to our shareholders and, when appropriate, buy back shares of our outstanding common stock (see “Cash Flows from Financing Activities”).
Capital ExpendituresOur 2017 capital program includes capital to fund advanced networks and services, including adding capacity and density to our 4G LTE network in order to stay ahead of our customers’ increasing data demands and pre- position our network for 5G, building out fiber assets for wireless backhaul and to deliver Fios services to customers as part of our One Fiber initiative, expanding our core networks, sup-porting our copper-based legacy voice networks and pursuing other opportunities to drive operating efficiencies. The level and the timing of the Company’s capital expenditures within these broad categories can vary significantly as a result of a variety of factors outside of our control, such as material weather events. Capital expenditures were $17.1 billion in 2016 and $17.8 billion in 2015. We believe that we have significant discretion over the amount and timing of our capital expenditures on a Company-wide basis as we are not subject to any agreement that would require significant capital expenditures on a designated schedule or upon the occurrence of designated events.
Consolidated Financial Condition(dollars in millions)
Years Ended December 31, 2016 2015 2014Cash Flows Provided By (Used In)
Operating activities $ 22,715 $ 38,930 $ 30,631Investing activities (10,983) (30,043) (15,856)Financing activities (13,322) (15,015) (57,705)
Decrease In Cash and Cash Equivalents $ (1,590) $ (6,128) $ (42,930)
We use the net cash generated from our operations to fund network expansion and modernization, service and repay external financing, pay dividends, invest in new businesses and, when appropriate, buy back shares of our outstanding common stock. Our sources of funds, primarily from operations and, to the extent necessary, from external financing arrangements, are sufficient to meet ongoing operating and investing requirements. We expect that our capital spending require-ments will continue to be financed primarily through internally generated funds. Debt or equity financing may be needed to fund additional invest-ments or development activities or to maintain an appropriate capital structure to ensure our financial flexibility. Our cash and cash equivalents are primarily held domestically and are invested to maintain principal and liquidity. Accordingly, we do not have significant exposure to foreign currency fluctuations. See “Market Risk” for additional information regarding our foreign currency risk management strategies.
Our available external financing arrangements include an active commercial paper program, credit available under credit facilities and other bank lines of credit, vendor financing arrangements, issuances of registered debt or equity securities and privately- placed capital market securities. In addition, our available arrangements to monetize our device payment plan agreement receivables include asset- backed securitizations and sales of selected receivables to relationship banks.
Cash Flows Provided By Operating ActivitiesOur primary source of funds continues to be cash generated from operations, primarily from our Wireless segment. Net cash provided by operating activities during 2016 decreased by $16.2 billion primarily due to a change in the method in which we monetize device payment plan receivables, as discussed below, as well as a decline in earnings, an increase in income taxes paid primarily as a result of the Access Line Sale, and $2.4 billion of cash proceeds received in 2015 as a result of our transaction (Tower Monetization Transaction) with American Tower Corporation (American Tower).
During 2016, we changed the method in which we monetize device payment plan receivables from sales of device payment plan receiv-ables, which were recorded within cash flows provided by operating activities, to asset- backed securitization transactions, which are recorded in cash flows from financing activities. During 2016, we received cash proceeds related to sales of wireless device payment plan agreement receivables of $2.0 billion and collected $1.1 billion of deferred purchase price. During 2015, we received $7.2 billion of cash proceeds related to new sales of wireless device payment plan agreement receivables. See Note 7 to the consolidated financial state-ments for more information. During 2016, we received proceeds from asset- backed securitization transactions of $5.0 billion. See Note 6 to the consolidated financial statements and “Cash Flows Used in Financing Activities” for more information.
26 | Verizon Communications Inc. and Subsidiaries www.verizon.com/2016AnnualReport
Management’s Discussion and Analysis of Financial Condition and Results of Operations continued
Net cash provided by operating activities during 2015 increased by $8.3 billion primarily due to $5.9 billion of cash proceeds, net of remit-tances, related to the sale of wireless device payment plan agreement receivables as well as $2.4 billion of cash proceeds received as a result of the Tower Monetization Transaction.
We completed the Tower Monetization Transaction in March 2015, pursuant to which American Tower acquired the exclusive rights to lease and operate approximately 11,300 of our wireless towers for an upfront payment of $5.0 billion, of which $2.4 billion related to a portion of the towers for which the right-of-use has passed to the tower operator. See Note 2 to the consolidated financial statements for more information.
Cash Flows Used In Investing ActivitiesCapital ExpendituresCapital expenditures continue to relate primarily to the use of capital resources to facilitate the introduction of new products and services, enhance responsiveness to competitive challenges and increase the operating efficiency and productivity of our networks.
Capital expenditures, including capitalized software, were as follows:
(dollars in millions)
Years Ended December 31, 2016 2015 2014Wireless $ 11,240 $ 11,725 $ 10,515Wireline 4,504 5,049 5,750Other 1,315 1,001 926
$ 17,059 $ 17,775 $ 17,191Total as a percentage of revenue 13.5% 13.5% 13.5%
Capital expenditures decreased at Wireless in 2016 primarily due to the timing of investments to increase the capacity of our 4G LTE network. Capital expenditures increased at Wireless in 2015 in order to increase the capacity of our 4G LTE network. Capital expendi-tures declined at Wireline in 2016 as a result of capital expenditures related to the local exchange business and related landline activities in California, Florida and Texas that were sold to Frontier on April 1, 2016 and reduced capital spending during the work stoppage that commenced April 13, 2016 and ended June 1, 2016. Capital expen-ditures declined at Wireline in 2015 as a result of decreased legacy spending requirements as well as decreased Fios spending require-ments in 2015.
AcquisitionsDuring 2016, 2015 and 2014, we invested $0.5 billion, $9.9 billion and $0.4 billion, respectively, in acquisitions of wireless licenses. During 2016, 2015 and 2014, we also invested $3.8 billion, $3.5 billion and $0.2 billion, respectively, in acquisitions of businesses, net of cash acquired.
In July 2016, we acquired Telogis, a global cloud-based mobile enter-prise management business, for $0.9 billion of cash consideration.
In November 2016, we acquired Fleetmatics, a leading global provider of fleet and mobile workforce management solutions, for $60.00 per ordinary share in cash. The aggregate merger consideration was approximately $2.5 billion, including cash acquired of $0.1 billion.
On January 29, 2015, the FCC completed an auction of 65 MHz of spectrum, which it identified as the AWS-3 band. Verizon participated in that auction, and was the high bidder on 181 spectrum licenses, for which we paid cash of approximately $10.4 billion. During the fourth quarter of 2014, we made a deposit of $0.9 billion related to our participation in this auction, which is classified within Other, net
investing activities on our consolidated statement of cash flows for the year ended December 31, 2014. During the first quarter of 2015, we submitted an application to the FCC and paid $9.5 billion to the FCC to complete payment for these licenses. The cash payment of $9.5 billion is classified within Acquisitions of wireless licenses on our consoli-dated statement of cash flows for the year ended December 31, 2015. On April 8, 2015, the FCC granted us these spectrum licenses.
On May 12, 2015, we entered into the Merger Agreement with AOL pursuant to which we commenced a tender offer to acquire all of the outstanding shares of common stock of AOL at a price of $50.00 per share, net to the seller in cash, without interest and less any applicable withholding taxes. On June 23, 2015, we completed the tender offer and merger, and AOL became a wholly-owned subsidiary of Verizon. The aggregate cash consideration paid by Verizon at the closing of these transactions was approximately $3.8 billion, net of cash acquired of $0.5 billion. Holders of approximately 6.6 million shares exercised appraisal rights under Delaware law. If they had not exercised these rights, Verizon would have paid an additional $330 million for such shares at closing.
During 2016, 2015 and 2014, we acquired various other businesses and investments for cash consideration that was not significant.
See “Acquisitions and Divestitures” for additional information on our acquisitions.
DispositionsDuring 2016, we received cash proceeds of $9.9 billion in connection with the completion of the Access Line Sale on April 1, 2016.
During 2014, we received proceeds of $2.4 billion related to spectrum license transactions and $0.1 billion related to the disposition of a non- strategic Wireline business.
See “Acquisitions and Divestitures” for additional information on our dispositions.
Other, netOn May 19, 2015, we consummated a sale- leaseback transaction with a financial services firm for the buildings and real estate at our Basking Ridge, New Jersey location. We received total gross proceeds of $0.7 billion resulting in a deferred gain of $0.4 billion, which will be amortized over the initial leaseback term of twenty years. The leaseback of the buildings and real estate is accounted for as an operating lease. The proceeds received as a result of this transaction have been classified within Other, net investing activities for the year ended December 31, 2015. Also in 2015, we received proceeds of $0.2 billion related to a sale of real estate.
www.verizon.com/2016AnnualReport Verizon Communications Inc. and Subsidiaries | 27
Management’s Discussion and Analysis of Financial Condition and Results of Operations continued
Cash Flows Used In Financing ActivitiesWe seek to maintain a mix of fixed and variable rate debt to lower borrowing costs within reasonable risk parameters. During 2016, 2015 and 2014, net cash used in financing activities was $13.3 billion, $15.0 billion and $57.7 billion, respectively.
2016During 2016, our net cash used in financing activities of $13.3 billion was primarily driven by:
• $19.2 billion used for repayments of long-term borrowings and capital lease obligations; and
• $9.3 billion used for dividend payments.
These uses of cash were partially offset by proceeds from long-term borrowings of $18.0 billion, which included $5.0 billion of proceeds from our asset- backed debt transactions.
Proceeds from and Repayments of Long-Term BorrowingsAt December 31, 2016, our total debt decreased to $108.1 billion as compared to $109.7 billion at December 31, 2015. Our effective interest rate was 4.8% and 4.9% during the years ended December 31, 2016 and 2015, respectively. The substantial majority of our total debt portfolio consists of fixed rate indebtedness, therefore, changes in interest rates do not have a material effect on our interest payments. See also “Market Risk” and Note 6 to the consolidated financial state-ments for additional details.
At December 31, 2016, approximately $11.6 billion or 10.7% of the aggregate principal amount of our total debt portfolio consisted of foreign denominated debt, primarily the Euro and British Pound Sterling. We have entered into cross currency swaps on a majority of our foreign denominated debt in order to fix our future interest and principal payments in U.S. dollars and mitigate the impact of foreign currency transaction gains or losses. See “Market Risk” for additional information.
Verizon may continue to acquire debt securities issued by Verizon and its affiliates in the future through open market purchases, privately negotiated transactions, tender offers, exchange offers, or otherwise, upon such terms and at such prices as Verizon may from time to time determine for cash or other consideration.
Other, netOther, net financing activities during 2016, includes net early debt redemption costs of $1.8 billion. See “Other Items” for additional infor-mation related to the early debt redemption costs incurred during the year ended December 31, 2016.
DividendsThe Verizon Board of Directors assesses the level of our dividend payments on a periodic basis taking into account such factors as long-term growth opportunities, internal cash requirements and the expectations of our shareholders. During the third quarter of 2016, the Board increased our quarterly dividend payment 2.2% to $0.5775 from $0.565 per share in the prior period. This is the tenth consecu-tive year that Verizon’s Board of Directors has approved a quarterly dividend increase.
As in prior periods, dividend payments were a significant use of capital resources. During 2016, we paid $9.3 billion in dividends.
2015During 2015, our net cash used in financing activities of $15.0 billion was primarily driven by:
• $9.3 billion used for repayments of long-term borrowings and capital lease obligations, including the repayment of $6.5 billion of borrow-ings under a term loan agreement;
• $8.5 billion used for dividend payments; and
• $5.0 billion payment for our accelerated share repurchase agreement.
These uses of cash were partially offset by proceeds from long-term borrowings of $6.7 billion, which included $6.5 billion of borrowings under a term loan agreement which was used for general corporate purposes, including the acquisition of spectrum licenses, as well as $2.7 billion of cash proceeds received related to the Tower Monetization Transaction attributable to the portion of the towers that we continue to occupy and use for network operations.
Proceeds from and Repayments of Long-Term BorrowingsAt December 31, 2015, our total debt decreased to $109.7 billion as compared to $112.8 billion at December 31, 2014. The substantial majority of our total debt portfolio consists of fixed rate indebtedness, therefore, changes in interest rates do not have a material effect on our interest payments. See Note 6 to the consolidated financial statements for additional details regarding our debt activity.
At December 31, 2015, approximately $8.2 billion or 7.5% of the aggregate principal amount of our total debt portfolio consisted of foreign denominated debt, primarily the Euro and British Pound Sterling. We have entered into cross currency swaps in order to fix our future interest and principal payments in U.S. dollars and mitigate the impact of foreign currency transaction gains or losses. See “Market Risk” for additional information.
Other, netOther, net financing activities during 2015 included $2.7 billion of cash proceeds received related to the Tower Monetization Transaction, which relates to the portion of the towers that we continue to occupy and use for network operations partially offset by the settlement of derivatives upon maturity for $0.4 billion.
DividendsDuring the third quarter of 2015, the Board increased our quarterly dividend payment 2.7% to $0.565 per share from $0.550 per share in the same prior period.
As in prior periods, dividend payments were a significant use of capital resources. During 2015, we paid $8.5 billion in dividends.
2014During 2014, our net cash used in financing activities of $57.7 billion was primarily driven by:
• $58.9 billion used to partially fund the Wireless Transaction (see Note 2 to the consolidated financial statements);
• $17.7 billion used for repayments of long-term borrowings and capital lease obligations; and
• $7.8 billion used for dividend payments.
These uses of cash were partially offset by proceeds from long-term borrowings of $31.0 billion.
28 | Verizon Communications Inc. and Subsidiaries www.verizon.com/2016AnnualReport
Management’s Discussion and Analysis of Financial Condition and Results of Operations continued
Proceeds from and Repayments of Long-Term BorrowingsAt December 31, 2014, our total debt increased to $112.8 billion as compared to $93.1 billion at December 31, 2013 primarily as a result of additional debt issued to finance the Wireless Transaction. Since the substantial majority of our total debt portfolio consists of fixed rate indebtedness, changes in interest rates do not have a material effect on our interest payments. Throughout 2014, we accessed the capital markets to optimize the maturity schedule of our debt portfolio and take advantage of lower interest rates, thereby reducing our effective interest rate to 4.9% from 5.2% in 2013. See Note 6 to the consolidated financial statements for additional details regarding our debt activity.
At December 31, 2014, approximately $9.6 billion or 8.5% of the aggregate principal amount of our total debt portfolio consisted of foreign denominated debt, primarily the Euro and British Pound Sterling. We have entered into cross currency swaps in order to fix our future interest and principal payments in U.S. dollars and mitigate the impact of foreign currency transaction gains or losses. See “Market Risk” for additional information.
See “Other Items” for additional information related to the early debt redemption costs incurred in 2014.
DividendsDuring the third quarter of 2014, the Board increased our quarterly dividend payment 3.8% to $0.550 per share from $0.530 per share in the same period of 2013. As in prior periods, dividend payments were a significant use of capital resources. During 2014, we paid $7.8 billion in dividends.
Asset- Backed DebtAs of December 31, 2016, the carrying value of our asset- backed debt was $5.0 billion. Our asset- backed debt includes notes (the Asset- Backed Notes) issued to third-party investors (Investors) and loans (ABS Financing Facility) received from banks and their conduit facilities (collectively, the Banks). Our consolidated asset- backed securitization bankruptcy remote legal entities (each, an ABS Entity or collectively, the ABS Entities) issue the debt or are otherwise party to the transaction documentation in connection with our asset- backed debt transactions. Under the terms of our asset- backed debt, we transfer device payment plan agreement receivables from Cellco Partnership and certain other affiliates of Verizon (collectively, the Originators) to one of the ABS Entities, which in turn transfer such receivables to another ABS Entity that issues the debt. Verizon entities retain the equity interests in the ABS Entities, which represent the rights to all funds not needed to make required payments on the asset- backed debt and other related payments and expenses.
Our asset- backed debt is secured by the transferred device payment plan agreement receivables and future collections on such receiv-ables. The device payment plan agreement receivables transferred to the ABS Entities and related assets, consisting primarily of restricted cash, will only be available for payment of asset- backed debt and expenses related thereto, payments to the Originators in respect of additional transfers of device payment plan agreement receivables, and other obligations arising from our asset- backed debt transactions, and will not be available to pay other obligations or claims of Verizon’s creditors until the associated asset- backed debt and other obligations are satisfied. The Investors or Banks, as applicable, which hold our asset- backed debt have legal recourse to the assets securing the debt, but do not have any recourse to Verizon with respect to the payment of principal and interest on the debt. Under a parent support agreement, Verizon has agreed to guarantee certain of the payment obligations of Cellco Partnership and the Originators to the ABS Entities.
Cash collections on the device payment plan agreement receivables are required at certain specified times to be placed into segregated accounts. Deposits to the segregated accounts are considered restricted cash and are included in Prepaid expenses and other and Other assets on our consolidated balance sheets.
Proceeds from our asset- backed debt transactions, deposits to the segregated accounts and payments to the Originators in respect of additional transfers of device payment plan agreement receivables, are reflected in Cash flows from financing activities in our consolidated statements of cash flows. Repayments of our asset- backed debt and related interest payments made from the segregated accounts are non-cash activities and therefore are not reflected within Cash flows from financing activities in our consolidated statements of cash flows. The asset- backed debt issued and the assets securing this debt are included on our consolidated balance sheets.
Although the ABS Financing Facility is fully drawn as of December 31, 2016, we have the right to prepay all or a portion thereof at any time. If we choose to prepay, the amount prepaid shall be available for further drawdowns until September 2018, except in certain circumstances.
Credit FacilitiesOn September 23, 2016, we amended our $8.0 billion credit facility to increase the availability to $9.0 billion and extend the maturity to September 23, 2020. As of December 31, 2016, the unused borrowing capacity under our $9.0 billion credit facility was approximately $8.9 billion. The credit facility does not require us to comply with financial covenants or maintain specified credit ratings, and it permits us to borrow even if our business has incurred a material adverse change. We use the credit facility for the issuance of letters of credit and for general corporate purposes.
In March 2016, we entered into an equipment credit facility insured by Eksportkreditnamnden Stockholm, Sweden (EKN), the Swedish export credit agency, with the ability to borrow up to $1 billion to finance locally- sourced network equipment- related purchases. The facility has borrowings available through June 2017, contingent upon the amount of equipment- related purchases made by Verizon. As of December 31, 2016 we had drawn $0.5 billion on the facility and the unused borrowing capacity was $0.5 billion.
Common StockCommon stock has been used from time to time to satisfy some of the funding requirements of employee and shareholder plans, including 3.5 million, 22.6 million and 18.2 million common shares issued from Treasury stock during 2016, 2015 and 2014, respectively, which had aggregate values of an immaterial amount, $0.9 billion and $0.7 billion, respectively.
In February 2015, the Verizon Board of Directors authorized Verizon to enter into an accelerated share repurchase (ASR) agreement to repur-chase $5.0 billion of the Company’s common stock. On February 10, 2015, in exchange for an upfront payment totaling $5.0 billion, Verizon received an initial delivery of 86.2 million shares having a value of approximately $4.25 billion. On June 5, 2015, Verizon received an addi-tional 15.4 million shares as final settlement of the transaction under the ASR agreement. In total, 101.6 million shares were delivered under the ASR at an average repurchase price of $49.21.
www.verizon.com/2016AnnualReport Verizon Communications Inc. and Subsidiaries | 29
Management’s Discussion and Analysis of Financial Condition and Results of Operations continued
On March 7, 2014, the Verizon Board of Directors approved a share buyback program, which authorizes the repurchase of up to 100 million shares of Verizon common stock terminating no later than the close of business on February 28, 2017. The program permits Verizon to repurchase shares over time, with the amount and timing of repur-chases depending on market conditions and corporate needs. The Board also determined that no additional shares were to be purchased under the prior program. There were no repurchases of common stock during 2016 and 2014. During 2015, we repurchased $0.1 billion of our common stock as part of our share buyback program.
As a result of the Wireless Transaction, in February 2014, Verizon issued approximately 1.27 billion shares of common stock.
Credit RatingsVerizon’s credit ratings did not change in 2016, 2015 or 2014.
Securities ratings assigned by rating organizations are expressions of opinion and are not recommendations to buy, sell or hold securities. A securities rating is subject to revision or withdrawal at any time by the assigning rating organization. Each rating should be evaluated inde-pendently of any other rating.
CovenantsOur credit agreements contain covenants that are typical for large, investment grade companies. These covenants include requirements to pay interest and principal in a timely fashion, pay taxes, maintain insurance with responsible and reputable insurance companies, preserve our corporate existence, keep appropriate books and records of financial transactions, maintain our properties, provide financial and other reports to our lenders, limit pledging and disposition of assets and mergers and consolidations, and other similar covenants. Additionally, our term loan credit agreements require us to maintain a leverage ratio (as such term is defined in those agreements) not in excess of 3.50:1.00 until our credit ratings are equal to or higher than A3 and A-.
We and our consolidated subsidiaries are in compliance with all of our financial and restrictive covenants.
2017 Term Loan AgreementDuring January 2017, we entered into a term loan credit agreement with a syndicate of major financial institutions, pursuant to which we can borrow up to $5.5 billion for (i) the acquisition of Yahoo and (ii) general corporate purposes. Borrowings under the term loan credit agreement mature 18 months following the funding date, with a partial mandatory prepayment required within six months following the funding date. The term loan agreement contains certain negative covenants, including a negative pledge covenant, a merger or similar transaction covenant and an accounting changes covenant, affirmative covenants and events of default that are customary for companies maintaining an investment grade credit rating. In addition, the term loan credit agreement requires us to maintain a leverage ratio (as defined in the term loan credit agreement) not in excess of 3.50:1.00, until our credit ratings are equal to or higher than A3 and A- at Moody’s Investor Service and S&P Global Ratings, respectively. To date, we have not drawn on this term loan.
Change In Cash and Cash EquivalentsOur Cash and cash equivalents at December 31, 2016 totaled $2.9 billion, a $1.6 billion decrease compared to Cash and cash equivalents at December 31, 2015 primarily as a result of the factors discussed above. Our Cash and cash equivalents at December 31, 2015 totaled $4.5 billion, a $6.1 billion decrease compared to Cash and cash equivalents at December 31, 2014 primarily as a result of the factors discussed above.
Free Cash FlowFree cash flow is a non-GAAP financial measure that reflects an addi-tional way of viewing our liquidity that, when viewed with our GAAP results, provides a more complete understanding of factors and trends affecting our cash flows. We believe it is a more conservative measure of cash flow since purchases of fixed assets are necessary for ongoing operations. Free cash flow has limitations due to the fact that it does not represent the residual cash flow available for discretionary expen-ditures. For example, free cash flow does not incorporate payments made on capital lease obligations or cash payments for business acquisitions. Therefore, we believe it is important to view free cash flow as a complement to our entire consolidated statements of cash flows. Free cash flow is calculated by subtracting capital expenditures from net cash provided by operating activities.
The following table reconciles net cash provided by operating activities to Free cash flow:
(dollars in millions)
Years Ended December 31, 2016 2015 2014Net cash provided by operating
activities $ 22,715 $ 38,930 $ 30,631Less Capital expenditures
(including capitalized software) 17,059 17,775 17,191Free cash flow $ 5,656 $ 21,155 $ 13,440
The changes in free cash flow during 2016, 2015 and 2014 were a result of the factors described in connection with net cash provided by operating activities and capital expenditures. The change in free cash flow during 2016 was primarily due to a change in the method in which we monetize device payment plan receivables, as discussed below, as well as a decline in earnings, an increase in income taxes paid primarily as a result of the Access Line Sale, and $2.4 billion of cash proceeds received in 2015 related to the Tower Monetization Transaction with American Tower.
During 2016, we changed the method in which we monetize device payment plan receivables from sales of device payment plan receiv-ables, which were recorded within cash flows provided by operating activities, to asset- backed securitization transactions, which are recorded in cash flows from financing activities. During 2016, we received cash proceeds related to new sales of wireless device payment plan agreement receivables of $2.0 billion and collected $1.1 billion of deferred purchase price. During 2015, we received $7.2 billion of cash proceeds related to new sales of wireless device payment plan agreement receivables. See Note 7 to the consolidated financial statements for more information. During 2016, we received proceeds from asset- backed securitization transactions of $5.0 billion. See Note 6 to the consolidated financial statements and “Cash Flows Used in Financing Activities” for more information.
During 2015, we received $5.9 billion of cash proceeds, net of remit-tances, related to the sale of wireless device payment plan receivables as well as $2.4 billion of cash proceeds received related to the Tower Monetization Transaction.
30 | Verizon Communications Inc. and Subsidiaries www.verizon.com/2016AnnualReport
Management’s Discussion and Analysis of Financial Condition and Results of Operations continued
Employee Benefit Plan Funded Status and ContributionsEmployer ContributionsWe operate numerous qualified and nonqualified pension plans and other postretirement benefit plans. These plans primarily relate to our domestic business units. During 2016, 2015 and 2014, contribu-tions to our qualified pension plans were $0.8 billion, $0.7 billion and $1.5 billion, respectively. We also contributed $0.1 billion to our non-qualified pension plans each year in 2016, 2015 and 2014.
In an effort to reduce the risk of our portfolio strategy and better align assets with liabilities, we have adopted a liability driven pension strategy that seeks to better match cash flows from investments with projected benefit payments. We expect that the strategy will reduce the likelihood that assets will decline at a time when liabilities
increase (referred to as liability hedging), with the goal to reduce the risk of underfunding to the plan and its participants and beneficia-ries; however, we also expect the strategy to result in lower asset returns. Based on this strategy and the funded status of the plans at December 31, 2016, we expect the minimum required qualified pension plan contribution in 2017 to be $0.6 billion. Nonqualified pension contri-butions are estimated to be approximately $0.1 billion in 2017.
Contributions to our other postretirement benefit plans generally relate to payments for benefits on an as- incurred basis since these other postretirement benefit plans do not have funding requirements similar to the pension plans. We contributed $1.1 billion, $0.9 billion and $0.7 billion to our other postretirement benefit plans in 2016, 2015 and 2014, respectively. Contributions to our other postretirement benefit plans are estimated to be approximately $0.8 billion in 2017.
Leasing ArrangementsSee Note 5 to the consolidated financial statements for a discussion of leasing arrangements.
Off Balance Sheet Arrangements and Contractual ObligationsContractual Obligations and Commercial CommitmentsThe following table provides a summary of our contractual obligations and commercial commitments at December 31, 2016. Additional detail about these items is included in the notes to the consolidated financial statements.
(dollars in millions)
Payments Due By Period
Contractual Obligations TotalLess than
1 year 1–3 years 3–5 yearsMore than
5 yearsLong-term debt(1) $ 107,429 $ 2,142 $ 12,386 $ 20,977 $ 71,924Capital lease obligations(2) 950 335 391 160 64Total long-term debt, including current
maturities 108,379 2,477 12,777 21,137 71,988Interest on long-term debt(1) 81,026 4,802 9,160 8,169 58,895Operating leases(2) 17,875 2,822 4,887 3,442 6,724Purchase obligations(3) 16,799 6,926 6,386 1,258 2,229Other long-term liabilities(4) 2,536 1,444 1,092 – –Finance obligations(5) 2,360 266 548 570 976Total contractual obligations $ 228,975 $ 18,737 $ 34,850 $ 34,576 $ 140,812
(1) Items included in long-term debt with variable coupon rates are described in Note 6 to the consolidated financial statements.
(2) See Note 5 to the consolidated financial statements.
(3) The purchase obligations reflected above are primarily commitments to purchase programming and network services, equipment, software and marketing services, which will be used or sold in the ordinary course of business. These amounts do not represent our entire anticipated purchases in the future, but represent only those items that are the subject of contractual obligations. We also purchase products and services as needed with no firm commitment. For this reason, the amounts presented in this table alone do not provide a reliable indicator of our expected future cash outflows or changes in our expected cash position (see Note 15 to the consolidated financial statements).
(4) Other long-term liabilities include estimated postretirement benefit and qualified pension plan contributions (see Note 10 to the consolidated financial statements).
(5) Represents future minimum payments under the sublease arrangement for our tower transaction (see Note 5 to the consolidated financial statements).
We are not able to make a reliable estimate of when the unrecognized tax benefits balance of $1.9 billion and related interest and penalties will be settled with the respective taxing authorities until issues or examinations are further developed (see Note 11 to the consolidated financial statements).
www.verizon.com/2016AnnualReport Verizon Communications Inc. and Subsidiaries | 31
Management’s Discussion and Analysis of Financial Condition and Results of Operations continued
GuaranteesWe guarantee the debentures of our operating telephone company subsidiaries as well as the debt obligations of GTE LLC, as successor in interest to GTE Corporation, that were issued and outstanding prior to July 1, 2003 (see Note 6 to the consolidated financial statements).
As a result of the closing of the Access Line Sale on April 1, 2016, GTE Southwest Inc., Verizon California Inc. and Verizon Florida LLC are no longer wholly-owned subsidiaries of Verizon, and the guar-antees of $0.6 billion aggregate principal amount of debentures and first mortgage bonds of those entities have terminated pursuant to their terms.
In connection with the execution of agreements for the sale of busi-nesses and investments, Verizon ordinarily provides representations and warranties to the purchasers pertaining to a variety of nonfinancial matters, such as ownership of the securities being sold, as well as financial losses (see Note 15 to the consolidated financial statements).
As of December 31, 2016, letters of credit totaling approximately $0.4 billion, which were executed in the normal course of business and support several financing arrangements and payment obligations to third parties, were outstanding (see Note 15 to the consolidated financial statements).
Market RiskWe are exposed to various types of market risk in the normal course of business, including the impact of interest rate changes, foreign currency exchange rate fluctuations, changes in investment, equity and commodity prices and changes in corporate tax rates. We employ risk management strategies, which may include the use of a variety of derivatives including cross currency swaps, foreign currency and prepaid forwards and collars, interest rate swap agreements, and interest rate caps. We do not hold derivatives for trading purposes.
It is our general policy to enter into interest rate, foreign currency and other derivative transactions only to the extent necessary to achieve our desired objectives in optimizing exposure to various market risks. Our objectives include maintaining a mix of fixed and variable rate debt to lower borrowing costs within reasonable risk parameters and to protect against earnings and cash flow volatility resulting from changes in market conditions. We do not hedge our market risk exposure in a manner that would completely eliminate the effect of changes in interest rates and foreign exchange rates on our earnings. At December 31, 2016 and 2015, we posted collateral of approximately $0.2 billion and $0.1 billion, respectively, related to derivative contracts under collateral exchange arrangements. During 2015, we paid an immaterial amount of cash to enter into amendments to certain col-lateral exchange arrangements. These amendments suspend cash collateral posting for a specified period of time by both counterparties. We are in the process of negotiating extensions to amendments expiring during 2017. While we may be exposed to credit losses due to the nonperformance of our counterparties, we consider the risk remote. As such, we do not expect that our results of operations or financial condition will be materially affected by these risk manage-ment strategies.
Interest Rate RiskWe are exposed to changes in interest rates, primarily on our short-term debt and the portion of long-term debt that carries floating interest rates. As of December 31, 2016, approximately 78% of the aggregate principal amount of our total debt portfolio consisted of fixed rate indebtedness, including the effect of interest rate swap agreements designated as hedges. The impact of a 100 basis point change in interest rates affecting our floating rate debt would result in a change in annual interest expense, including our interest rate swap agreements that are designated as hedges, of approximately $0.3 billion. The interest rates on substantially all of our existing long-term debt obligations are unaffected by changes to our credit ratings.
The table that follows summarizes the fair values of our long-term debt, including current maturities, and interest rate swap derivatives as of December 31, 2016 and 2015. The table also provides a sensitivity analysis of the estimated fair values of these financial instruments assuming 100-basis-point upward and downward shifts in the yield curve. Our sensitivity analysis does not include the fair values of our commercial paper and bank loans, if any, because they are not signifi-cantly affected by changes in market interest rates.
(dollars in millions)
Long-term debt and related derivatives Fair Value
Fair Value assuming
+ 100 basis point shift
Fair Value assuming
– 100 basis point shift
At December 31, 2016 $ 117,580 $ 109,029 $ 128,007At December 31, 2015 117,943 108,992 128,641
Interest Rate SwapsWe enter into interest rate swaps to achieve a targeted mix of fixed and variable rate debt. We principally receive fixed rates and pay variable rates based on the London Interbank Offered Rate, resulting in a net increase or decrease to Interest expense. These swaps are designated as fair value hedges and hedge against interest rate risk exposure of designated debt issuances. At December 31, 2016 and 2015, the fair value of these contracts was $0.2 billion and $0.1 billion, respectively, which was primarily included within Other liabilities and Other assets, respectively, on our consolidated balance sheets. At December 31, 2016 and 2015, the total notional amount of the interest rate swaps was $13.1 billion and $7.6 billion, respectively.
Forward Interest Rate SwapsIn order to manage our exposure to future interest rate changes, we have entered into forward interest rate swaps. We designated these contracts as cash flow hedges. The fair value of these contracts, which was included within Other liabilities on our consolidated balance sheet, was not material at December 31, 2015. At December 31, 2015, these swaps had a notional value of $0.8 billion. During 2016, we settled all outstanding forward interest rate swaps.
Interest Rate CapsWe also have interest rate caps which we use as an economic hedge but for which we have elected not to apply hedge accounting. During 2016, we entered into interest rate caps to mitigate our interest exposure to interest rate increases on our ABS Financing Facility. The fair value of these contracts was not material at December 31, 2016. At December 31, 2016, the total notional value of these contracts was $2.5 billion.
32 | Verizon Communications Inc. and Subsidiaries www.verizon.com/2016AnnualReport
Management’s Discussion and Analysis of Financial Condition and Results of Operations continued
Foreign Currency TranslationThe functional currency for our foreign operations is primarily the local currency. The translation of income statement and balance sheet amounts of our foreign operations into U.S. dollars is recorded as cumulative translation adjustments, which are included in Accumulated other comprehensive income in our consolidated balance sheets. Gains and losses on foreign currency transactions are recorded in the consolidated statements of income in Other income and (expense), net. At December 31, 2016, our primary translation exposure was to the British Pound Sterling, Euro, Australian Dollar and Japanese Yen.
Cross Currency SwapsWe enter into cross currency swaps to exchange British Pound Sterling and Euro- denominated debt into U.S. dollars and to fix our future interest and principal payments in U.S. dollars, as well as to mitigate the effect of foreign currency transaction gains or losses. These swaps are designated as cash flow hedges. The fair value of the outstanding swaps, which was primarily included within Other liabilities on our consolidated balance sheets, was $1.8 billion and $1.6 billion at December 31, 2016 and 2015, respectively. At December 31, 2016 and 2015, the total notional amount of the cross currency swaps was $12.9 billion and $9.7 billion, respectively.
Net Investment HedgesWe have designated certain foreign currency instruments as net investment hedges to mitigate foreign exchange exposure related to non-U.S. dollar net investments in certain foreign subsidiaries against changes in foreign exchange rates. The fair value of these contracts was not material at December 31, 2015. At December 31, 2015, the total notional value of these contracts was $0.9 billion. During 2016, we settled these net investment hedges and designated $0.8 billion total notional value of Euro- denominated debt as a net investment hedge.
Critical Accounting Estimates and Recently Issued Accounting Standards
Critical Accounting EstimatesA summary of the critical accounting estimates used in preparing our financial statements is as follows:
• Wireless licenses and Goodwill are a significant component of our consolidated assets. Both our wireless licenses and goodwill are treated as indefinite-lived intangible assets and, therefore are not amortized, but rather are tested for impairment annually in the fourth fiscal quarter, unless there are events requiring an earlier assessment or changes in circumstances during an interim period that indicate these assets may not be recoverable. We believe our estimates and assumptions are reasonable and represent appro-priate marketplace considerations as of the valuation date. Although we use consistent methodologies in developing the assumptions and estimates underlying the fair value calculations used in our impairment tests, these estimates and assumptions are uncertain by nature, may change over time and can vary from actual results. It is possible that in the future there may be changes in our estimates and assumptions, including the timing and amount of future cash flows, margins, growth rates, market participant assumptions, com-parable benchmark companies and related multiples and discount rates, which could result in different fair value estimates. Significant and adverse changes to any one or more of the above noted estimates and assumptions could result in a goodwill impairment for one or more of our reporting units.
Wireless LicensesThe carrying value of our wireless licenses was approximately $86.7 billion as of December 31, 2016. We aggregate our wireless licenses into one single unit of accounting, as we utilize our wireless licenses on an integrated basis as part of our nationwide wireless network. Our wireless licenses provide us with the exclusive right to utilize certain radio frequency spectrum to provide wireless communication services. There are currently no legal, regulatory, contractual, competitive, economic or other factors that limit the useful life of our wireless licenses.
In 2016 and 2014, we performed a qualitative impairment assess-ment to determine whether it is more likely than not that the fair value of our wireless licenses was less than the carrying amount. As part of our assessment we considered several qualitative factors including the business enterprise value of Wireless, macroeconomic conditions (including changes in interest rates and discount rates), industry and market considerations (including industry revenue and EBITDA margin projections), the projected financial performance of Wireless, as well as other factors. Based on our assessments in 2016 and 2014, we qualitatively concluded that it was more likely than not that the fair value of our wireless licenses significantly exceeded their carrying value and, therefore, did not result in an impairment.
In 2015, our quantitative impairment test consisted of comparing the estimated fair value of our aggregate wireless licenses to the aggre-gated carrying amount as of the test date. If the estimated fair value of our aggregated wireless licenses is less than the aggregated carrying amount of the wireless licenses then an impairment charge would have been recognized. Our quantitative impairment test for 2015 indicated that the fair value significantly exceeded the carrying value and, therefore, did not result in an impairment.
In 2015, using a quantitative assessment, we estimated the fair value of our wireless licenses using the Greenfield approach. The Greenfield approach is an income based valuation approach that values the wireless licenses by calculating the cash flow generating potential of a hypothetical start-up company that goes into business with no assets except the wireless licenses to be valued. A discounted cash flow analysis is used to estimate what a marketplace participant would be willing to pay to purchase the aggregated wireless licenses as of the valuation date. As a result, we were required to make significant estimates about future cash flows specifically associated with our wireless licenses, an appropriate discount rate based on the risk associated with those estimated cash flows and assumed terminal value and growth rates. We considered current and expected future economic conditions, current and expected availability of wireless network technology and infrastructure and related equipment and the costs thereof as well as other relevant factors in estimating future cash flows. The discount rate represented our estimate of the weighted- average cost of capital (WACC), or expected return, that a marketplace par-ticipant would have required as of the valuation date. We developed the discount rate based on our consideration of the cost of debt and equity of a group of guideline companies as of the valuation date. Accordingly, our discount rate incorporated our estimate of the expected return a marketplace participant would have required as of the valuation date, including the risk premium associated with the current and expected economic conditions as of the valuation date. The terminal value growth rate represented our estimate of the marketplace’s long-term growth rate.
www.verizon.com/2016AnnualReport Verizon Communications Inc. and Subsidiaries | 33
Management’s Discussion and Analysis of Financial Condition and Results of Operations continued
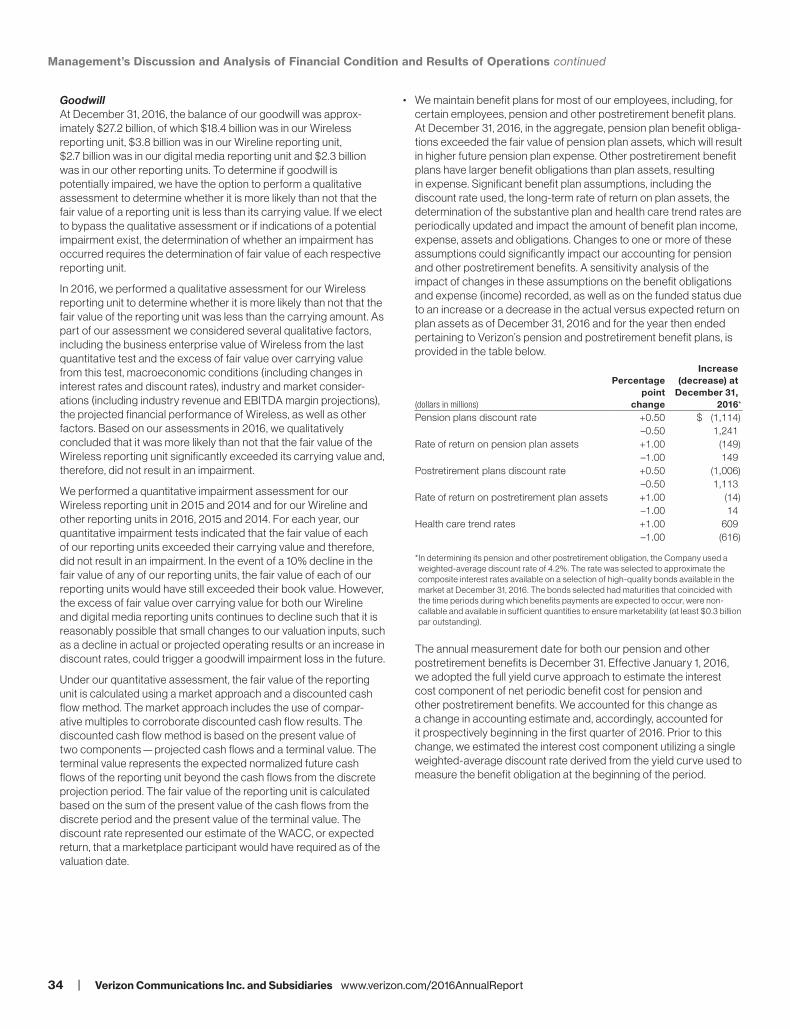
GoodwillAt December 31, 2016, the balance of our goodwill was approx-imately $27.2 billion, of which $18.4 billion was in our Wireless reporting unit, $3.8 billion was in our Wireline reporting unit, $2.7 billion was in our digital media reporting unit and $2.3 billion was in our other reporting units. To determine if goodwill is potentially impaired, we have the option to perform a qualitative assessment to determine whether it is more likely than not that the fair value of a reporting unit is less than its carrying value. If we elect to bypass the qualitative assessment or if indications of a potential impairment exist, the determination of whether an impairment has occurred requires the determination of fair value of each respective reporting unit.
In 2016, we performed a qualitative assessment for our Wireless reporting unit to determine whether it is more likely than not that the fair value of the reporting unit was less than the carrying amount. As part of our assessment we considered several qualitative factors, including the business enterprise value of Wireless from the last quantitative test and the excess of fair value over carrying value from this test, macroeconomic conditions (including changes in interest rates and discount rates), industry and market consider-ations (including industry revenue and EBITDA margin projections), the projected financial performance of Wireless, as well as other factors. Based on our assessments in 2016, we qualitatively concluded that it was more likely than not that the fair value of the Wireless reporting unit significantly exceeded its carrying value and, therefore, did not result in an impairment.
We performed a quantitative impairment assessment for our Wireless reporting unit in 2015 and 2014 and for our Wireline and other reporting units in 2016, 2015 and 2014. For each year, our quantitative impairment tests indicated that the fair value of each of our reporting units exceeded their carrying value and therefore, did not result in an impairment. In the event of a 10% decline in the fair value of any of our reporting units, the fair value of each of our reporting units would have still exceeded their book value. However, the excess of fair value over carrying value for both our Wireline and digital media reporting units continues to decline such that it is reasonably possible that small changes to our valuation inputs, such as a decline in actual or projected operating results or an increase in discount rates, could trigger a goodwill impairment loss in the future.
Under our quantitative assessment, the fair value of the reporting unit is calculated using a market approach and a discounted cash flow method. The market approach includes the use of compar-ative multiples to corroborate discounted cash flow results. The discounted cash flow method is based on the present value of two components — projected cash flows and a terminal value. The terminal value represents the expected normalized future cash flows of the reporting unit beyond the cash flows from the discrete projection period. The fair value of the reporting unit is calculated based on the sum of the present value of the cash flows from the discrete period and the present value of the terminal value. The discount rate represented our estimate of the WACC, or expected return, that a marketplace participant would have required as of the valuation date.
• We maintain benefit plans for most of our employees, including, for certain employees, pension and other postretirement benefit plans. At December 31, 2016, in the aggregate, pension plan benefit obliga-tions exceeded the fair value of pension plan assets, which will result in higher future pension plan expense. Other postretirement benefit plans have larger benefit obligations than plan assets, resulting in expense. Significant benefit plan assumptions, including the discount rate used, the long-term rate of return on plan assets, the determination of the substantive plan and health care trend rates are periodically updated and impact the amount of benefit plan income, expense, assets and obligations. Changes to one or more of these assumptions could significantly impact our accounting for pension and other postretirement benefits. A sensitivity analysis of the impact of changes in these assumptions on the benefit obligations and expense (income) recorded, as well as on the funded status due to an increase or a decrease in the actual versus expected return on plan assets as of December 31, 2016 and for the year then ended pertaining to Verizon’s pension and postretirement benefit plans, is provided in the table below.
(dollars in millions)
Percentage point
change
Increase (decrease) at
December 31, 2016*
Pension plans discount rate +0.50 $ (1,114)–0.50 1,241
Rate of return on pension plan assets +1.00 (149)–1.00 149
Postretirement plans discount rate +0.50 (1,006)–0.50 1,113
Rate of return on postretirement plan assets +1.00 (14)–1.00 14
Health care trend rates +1.00 609–1.00 (616)
* In determining its pension and other postretirement obligation, the Company used a weighted- average discount rate of 4.2%. The rate was selected to approximate the composite interest rates available on a selection of high- quality bonds available in the market at December 31, 2016. The bonds selected had maturities that coincided with the time periods during which benefits payments are expected to occur, were non- callable and available in sufficient quantities to ensure marketability (at least $0.3 billion par outstanding).
The annual measurement date for both our pension and other postretirement benefits is December 31. Effective January 1, 2016, we adopted the full yield curve approach to estimate the interest cost component of net periodic benefit cost for pension and other postretirement benefits. We accounted for this change as a change in accounting estimate and, accordingly, accounted for it prospectively beginning in the first quarter of 2016. Prior to this change, we estimated the interest cost component utilizing a single weighted- average discount rate derived from the yield curve used to measure the benefit obligation at the beginning of the period.
34 | Verizon Communications Inc. and Subsidiaries www.verizon.com/2016AnnualReport
Management’s Discussion and Analysis of Financial Condition and Results of Operations continued
The full yield curve approach refines our estimate of interest cost by applying the individual spot rates from a yield curve composed of the rates of return on several hundred high- quality fixed income corporate bonds available at the measurement date. These indi-vidual spot rates align with the timing of each future cash outflow for benefit payments and therefore provide a more precise estimate of interest cost.
This change in accounting estimate does not affect the measure-ment of our total benefit obligations at year end or our annual net periodic benefit cost as the change in the interest cost is offset in the actuarial gain or loss recorded at year end. Accordingly, this change in accounting estimate has no impact on our annual consolidated GAAP results. For the year ended December 31, 2016, this change resulted in our reduction of the interest cost component of net periodic benefit cost of approximately $0.4 billion. For the year ended December 31, 2016, the impact of this change on our non-GAAP measures was an increase to Consolidated Adjusted EBITDA by approximately $0.4 billion. Our non-GAAP measure for Segment EBITDA is unaffected because the interest cost component of net periodic benefit cost is not included in our segment results. For additional discussion of Non-GAAP measures and non- operational items see “Consolidated Results of Operations”.
• Our current and deferred income taxes and associated valuation allowances are impacted by events and transactions arising in the normal course of business as well as in connection with the adoption of new accounting standards, changes in tax laws and rates, acquisitions and dispositions of businesses and non- recurring items. As a global commercial enterprise, our income tax rate and the classification of income taxes can be affected by many factors, including estimates of the timing and realization of deferred income tax assets and the timing and amount of income tax payments. We account for tax benefits taken or expected to be taken in our tax returns in accordance with the accounting standard relating to the uncertainty in income taxes, which requires the use of a two-step approach for recognizing and measuring tax benefits taken or expected to be taken in a tax return. We review and adjust our liability for unrecognized tax benefits based on our best judgment given the facts, circumstances and information available at each reporting date. To the extent that the final outcome of these tax positions is different than the amounts recorded, such differences may impact income tax expense and actual tax payments. We recognize any interest and penalties accrued related to unrecog-nized tax benefits in income tax expense. Actual tax payments may materially differ from estimated liabilities as a result of changes in tax laws as well as unanticipated transactions impacting related income tax balances.
• Our Plant, property and equipment balance represents a signif-icant component of our consolidated assets. We record Plant, property and equipment at cost. We depreciate Plant, property and equipment on a straight-line basis over the estimated useful life of the assets. We expect that a one-year increase in estimated useful lives of our Plant, property and equipment would result in a decrease to our 2016 depreciation expense of $2.8 billion and that a one-year decrease would result in an increase of approximately $5.7 billion in our 2016 depreciation expense.
• We maintain allowances for uncollectible accounts receivable, including our device payment plan receivables, for estimated losses resulting from the failure or inability of our customers to make required payments. Our allowance for uncollectible accounts receiv-able is based on management’s assessment of the collectability
of specific customer accounts and includes consideration of the credit worthiness and financial condition of those customers. We record an allowance to reduce the receivables to the amount that is reasonably believed to be collectible. We also record an allowance for all other receivables based on multiple factors, including histor-ical experience with bad debts, the general economic environment and the aging of such receivables. If there is a deterioration of our customers’ financial condition or if future actual default rates on receivables in general differ from those currently anticipated, we may have to adjust our allowance for doubtful accounts, which would affect earnings in the period the adjustments are made.
Recently Issued Accounting StandardsSee Note 1 to the consolidated financial statements for a discussion of recently issued accounting standard updates not yet adopted as of December 31, 2016.
Acquisitions and Divestitures
WirelessWireless TransactionOn February 21, 2014, we completed the Wireless Transaction for aggregate consideration of approximately $130 billion. The con-sideration paid was primarily comprised of cash of approximately $58.89 billion, Verizon common stock with a value of approximately $61.3 billion and other consideration.
Omnitel TransactionOn February 21, 2014, Verizon and Vodafone also consummated the sale of the Omnitel Interest by a subsidiary of Verizon to a subsidiary of Vodafone in connection with the Wireless Transaction pursuant to a separate share purchase agreement. As a result, during 2014, we recognized a pre-tax gain of $1.9 billion on the disposal of the Omnitel interest.
See Note 2 to the consolidated financial statements for additional information regarding the Wireless Transaction.
Spectrum License TransactionsIn January 2015, the FCC completed an auction of 65 MHz of spectrum in the AWS-3 band. We participated in the auction and were the high bidder on 181 spectrum licenses, for which we paid cash of approximately $10.4 billion. The FCC granted us these spectrum licenses in April 2015.
During the fourth quarter of 2016, we entered into a license exchange agreement with affiliates of AT&T to exchange certain AWS and PCS spectrum licenses. As a result of this agreement, $0.9 billion of Wireless licenses are classified as held for sale on our consolidated balance sheet as of December 31, 2016. This non-cash exchange was completed in February 2017. We expect to record a gain on this trans-action in the first quarter of 2017.
www.verizon.com/2016AnnualReport Verizon Communications Inc. and Subsidiaries | 35
Management’s Discussion and Analysis of Financial Condition and Results of Operations continued
From time to time, we enter into agreements to buy, sell or exchange spectrum licenses. We believe these spectrum license transactions have allowed us to continue to enhance the reliability of our network while also resulting in a more efficient use of spectrum. See Note 2 to the consolidated financial statements for additional details regarding our spectrum license transactions.
Tower Monetization TransactionDuring March 2015, we completed a transaction with American Tower pursuant to which American Tower acquired the exclusive right to lease, acquire or otherwise operate and manage many of our wireless towers for an upfront payment of $5.1 billion, which also included payment for the sale of 162 towers. See Note 2 to the consolidated financial statements for additional information.
WirelineAccess Line SaleOn February 5, 2015, we entered into a definitive agreement with Frontier pursuant to which Verizon agreed to sell its local exchange business and related landline activities in California, Florida and Texas, including Fios Internet and video customers, switched and special access lines and high-speed Internet service and long distance voice accounts in these three states, for approximately $10.5 billion (approx-imately $7.3 billion net of income taxes), subject to certain adjustments and including the assumption of $0.6 billion of indebtedness from Verizon by Frontier. The transaction, which included the acquisition by Frontier of the equity interests of Verizon’s ILECs in California, Florida and Texas, did not involve any assets or liabilities of Verizon Wireless. The transaction closed on April 1, 2016. See Note 2 to the consolidated financial statements for additional information.
OtherDuring July 2014, we sold a non- strategic Wireline business for cash consideration that was not significant. See Note 2 to the consolidated financial statements for additional information.
On February 20, 2016, we entered into a purchase agreement to acquire XO Holdings’ wireline business, which owns and operates one of the largest fiber-based IP and Ethernet networks, for approximately $1.8 billion, subject to adjustment. We completed the acquisition on February 1, 2017. Separately, we entered into an agreement to lease certain wireless spectrum from a wholly-owned subsidiary of XO Holdings that holds its wireless spectrum. Verizon has an option, exer-cisable under certain circumstances, to buy that subsidiary.
On December 6, 2016, we entered into a definitive agreement with Equinix pursuant to which Verizon will sell 24 customer- facing data center sites in the United States and Latin America, for approximately $3.6 billion, subject to certain adjustments. The sale does not affect Verizon’s data center services delivered from 27 sites in Europe, Asia- Pacific and Canada, or its managed hosting and cloud offerings. The transaction is subject to customary regulatory approvals and closing conditions, and is expected to close during the first half of 2017.
Other
Acquisition of Yahoo! Inc.’s Operating BusinessOn July 23, 2016, Verizon entered into a stock purchase agreement (the Purchase Agreement) with Yahoo. Pursuant to the Purchase Agreement, upon the terms and subject to the conditions thereof, we agreed to acquire the stock of one or more subsidiaries of Yahoo holding all of Yahoo’s operating business for approximately $4.83 billion in cash, subject to certain adjustments (the Transaction). Prior to the closing of the Transaction, pursuant to a related reorga-nization agreement, Yahoo will transfer all of the assets and liabilities constituting Yahoo’s operating business to the subsidiaries to be acquired in the Transaction. The assets to be acquired will not include Yahoo’s cash, its ownership interests in Alibaba, Yahoo! Japan and certain other investments, certain undeveloped land recently divested by Yahoo or certain non-core intellectual property. We will receive for our benefit and that of our current and certain future affiliates a non-ex-clusive, worldwide, perpetual, royalty-free license to all of Yahoo’s intellectual property that is not being conveyed with the business.
On February 20, 2017, Verizon and Yahoo entered into an amendment to the Purchase Agreement, pursuant to which the Transaction purchase price will be reduced by $350 million to approximately $4.48 billion in cash, subject to certain adjustments. Subject to certain exceptions, the parties also agreed that certain user security and data breaches incurred by Yahoo (and the losses arising therefrom) will be disregarded (1) for purposes of specified conditions to Verizon’s obligations to close the Transaction and (2) in determining whether a “Business Material Adverse Effect” under the Purchase Agreement has occurred.
Concurrently with the amendment of the Purchase Agreement, Yahoo and Yahoo Holdings, Inc., a wholly owned subsidiary of Yahoo that Verizon has agreed to purchase pursuant to the Transaction, also entered into an amendment to the related reorganization agreement, pursuant to which Yahoo (which has announced that it intends to change its name to Altaba Inc. following the closing of the Transaction)will retain 50% of certain post-closing liabilities arising out of govern-mental or third party investigations, litigations or other claims related to certain user security and data breaches incurred by Yahoo. In accor-dance with the original Transaction agreements, Yahoo will continue to retain 100% of any liabilities arising out of any shareholder lawsuits (including derivative claims) and investigations and actions by the SEC.
The Transaction remains subject to customary closing conditions, including the approval of Yahoo's stockholders, and is expected to close in the second quarter of 2017.
36 | Verizon Communications Inc. and Subsidiaries www.verizon.com/2016AnnualReport
Management’s Discussion and Analysis of Financial Condition and Results of Operations continued
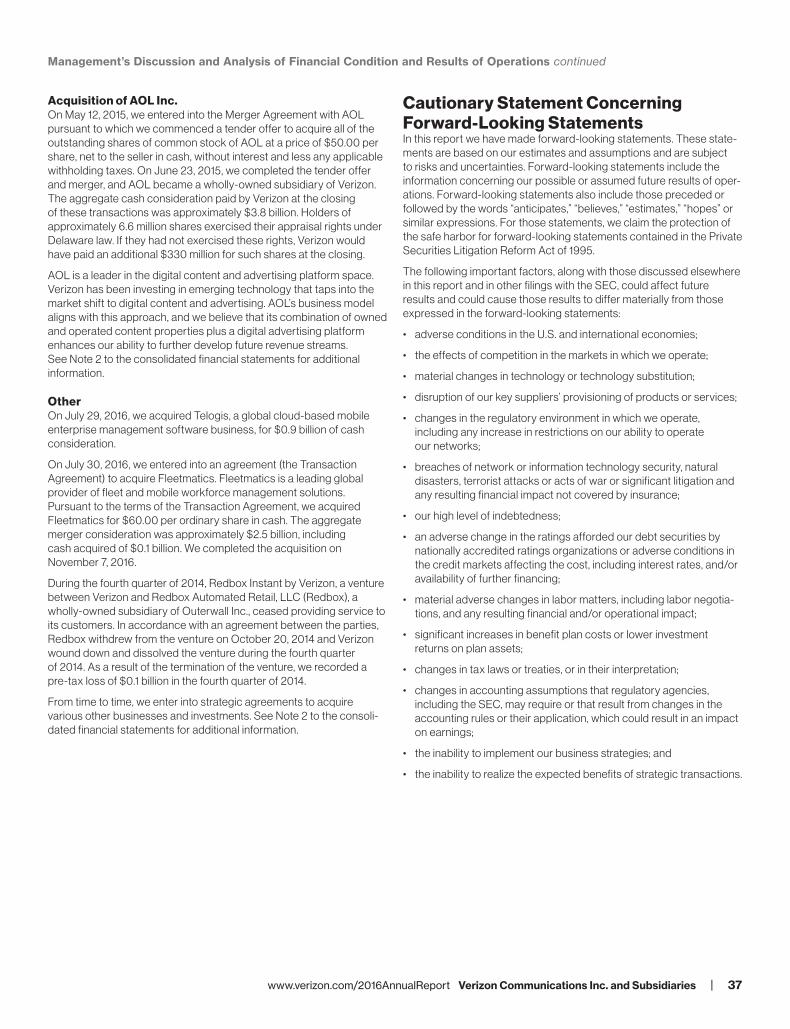
Acquisition of AOL Inc.On May 12, 2015, we entered into the Merger Agreement with AOL pursuant to which we commenced a tender offer to acquire all of the outstanding shares of common stock of AOL at a price of $50.00 per share, net to the seller in cash, without interest and less any applicable withholding taxes. On June 23, 2015, we completed the tender offer and merger, and AOL became a wholly-owned subsidiary of Verizon. The aggregate cash consideration paid by Verizon at the closing of these transactions was approximately $3.8 billion. Holders of approximately 6.6 million shares exercised their appraisal rights under Delaware law. If they had not exercised these rights, Verizon would have paid an additional $330 million for such shares at the closing.
AOL is a leader in the digital content and advertising platform space. Verizon has been investing in emerging technology that taps into the market shift to digital content and advertising. AOL’s business model aligns with this approach, and we believe that its combination of owned and operated content properties plus a digital advertising platform enhances our ability to further develop future revenue streams. See Note 2 to the consolidated financial statements for additional information.
OtherOn July 29, 2016, we acquired Telogis, a global cloud-based mobile enterprise management software business, for $0.9 billion of cash consideration.
On July 30, 2016, we entered into an agreement (the Transaction Agreement) to acquire Fleetmatics. Fleetmatics is a leading global provider of fleet and mobile workforce management solutions. Pursuant to the terms of the Transaction Agreement, we acquired Fleetmatics for $60.00 per ordinary share in cash. The aggregate merger consideration was approximately $2.5 billion, including cash acquired of $0.1 billion. We completed the acquisition on November 7, 2016.
During the fourth quarter of 2014, Redbox Instant by Verizon, a venture between Verizon and Redbox Automated Retail, LLC (Redbox), a wholly-owned subsidiary of Outerwall Inc., ceased providing service to its customers. In accordance with an agreement between the parties, Redbox withdrew from the venture on October 20, 2014 and Verizon wound down and dissolved the venture during the fourth quarter of 2014. As a result of the termination of the venture, we recorded a pre-tax loss of $0.1 billion in the fourth quarter of 2014.
From time to time, we enter into strategic agreements to acquire various other businesses and investments. See Note 2 to the consoli-dated financial statements for additional information.
Cautionary Statement Concerning Forward- Looking StatementsIn this report we have made forward- looking statements. These state-ments are based on our estimates and assumptions and are subject to risks and uncertainties. Forward- looking statements include the information concerning our possible or assumed future results of oper-ations. Forward- looking statements also include those preceded or followed by the words “anticipates,” “believes,” “estimates,” “hopes” or similar expressions. For those statements, we claim the protection of the safe harbor for forward- looking statements contained in the Private Securities Litigation Reform Act of 1995.
The following important factors, along with those discussed elsewhere in this report and in other filings with the SEC, could affect future results and could cause those results to differ materially from those expressed in the forward- looking statements:
• adverse conditions in the U.S. and international economies;
• the effects of competition in the markets in which we operate;
• material changes in technology or technology substitution;
• disruption of our key suppliers’ provisioning of products or services;
• changes in the regulatory environment in which we operate, including any increase in restrictions on our ability to operate our networks;
• breaches of network or information technology security, natural disasters, terrorist attacks or acts of war or significant litigation and any resulting financial impact not covered by insurance;
• our high level of indebtedness;
• an adverse change in the ratings afforded our debt securities by nationally accredited ratings organizations or adverse conditions in the credit markets affecting the cost, including interest rates, and/or availability of further financing;
• material adverse changes in labor matters, including labor negotia-tions, and any resulting financial and/or operational impact;
• significant increases in benefit plan costs or lower investment returns on plan assets;
• changes in tax laws or treaties, or in their interpretation;
• changes in accounting assumptions that regulatory agencies, including the SEC, may require or that result from changes in the accounting rules or their application, which could result in an impact on earnings;
• the inability to implement our business strategies; and
• the inability to realize the expected benefits of strategic transactions.
www.verizon.com/2016AnnualReport Verizon Communications Inc. and Subsidiaries | 37
Management’s Discussion and Analysis of Financial Condition and Results of Operations continued