Embed Size (px)
Citation preview

www.statssa.gov.za
T +27 12 310 8911
F +27 12 310 8500
Private Bag X44, Pretoria, 0001, South Africa
ISIbalo House, Koch Street, Salvokop, Pretoria, 0002
STATISTICAL RELEASE P5041.1
Selected building statistics of the private sector as reported by local government institutions
(Preliminary)
April 2017
Embargoed until: 15 June 2017
13:00 ENQUIRIES: FORTHCOMING ISSUE: EXPECTED RELEASE DATE:
Nicolai Claassen May 2017 20 July 2017
Tel: (012) 310 8007
STATISTICS SOUTH AFRICA P5041.1
Selected building statistics of the private sector, April 2017
1
Contents
Results for January to April 2017……………..……...…….…….………...............………………..……..... 3 Tables
Table 1 Value and percentage change of recorded building plans passed by larger municipalities at current prices by type of building ............................................................................................................... 9
Table 2 Seasonally adjusted value and percentage change of recorded building plans passed by larger municipalities at current prices by type of building .................................................................................... 10
Table 3 Value and percentage change of recorded building plans passed by larger municipalities at constant 2015 prices by type of building ...................................................................................................
11
Table 4 Seasonally adjusted value and percentage change of recorded building plans passed by larger municipalities at constant 2015 prices by type of building ........................................................................
12
Table 5 Value and percentage change of buildings reported as completed to larger municipalities at current prices by type of building ............................................................................................................... 13
Table 6 Seasonally adjusted value and percentage change of buildings reported as completed to larger municipalities at current prices by type of building .................................................................................... 14
Table 7 Value and percentage change of buildings reported as completed to larger municipalities at constant 2015 prices by type of building ...................................................................................................
15
Table 8 Seasonally adjusted value and percentage change of buildings reported as completed to larger municipalities at constant 2015 prices by type of building ........................................................................
16
Table 9 Recorded building plans passed by larger municipalities at current prices by type of building: South Africa ................................................................................................................................................ 17
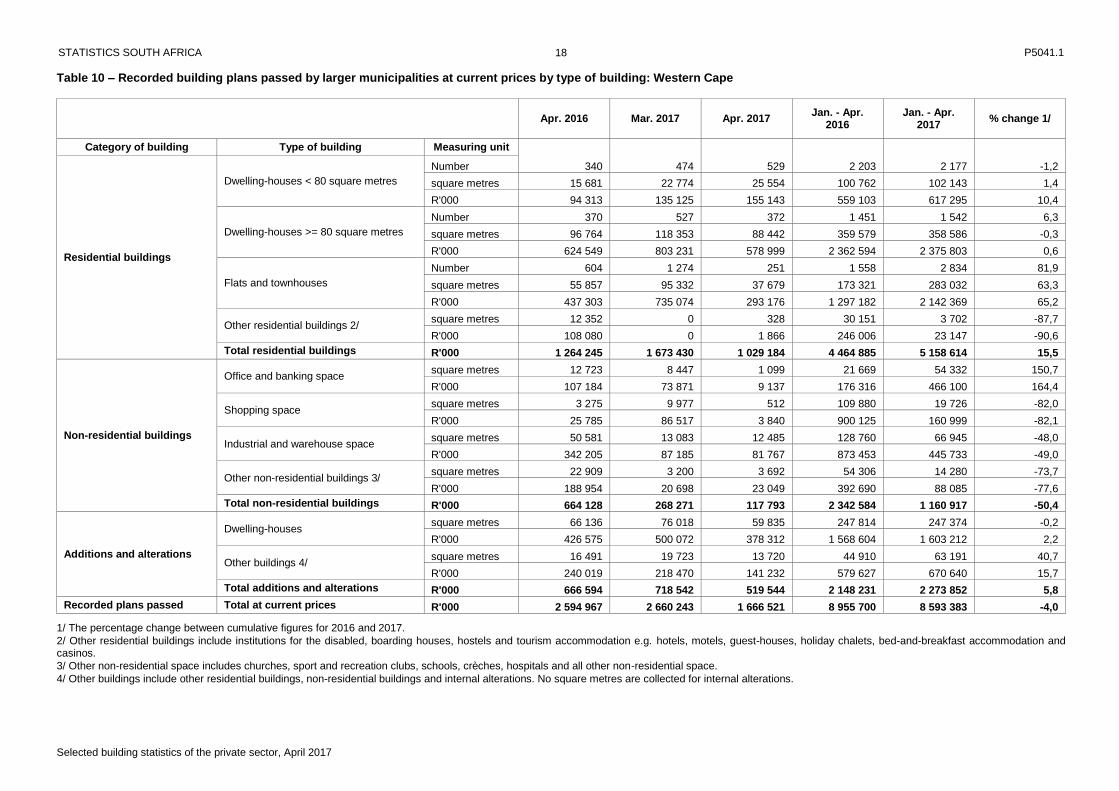
Table 10 Recorded building plans passed by larger municipalities at current prices by type of building: Western Cape ............................................................................................................................................. 18
Table 11 Recorded building plans passed by larger municipalities at current prices by type of building: Eastern Cape .............................................................................................................................................. 19
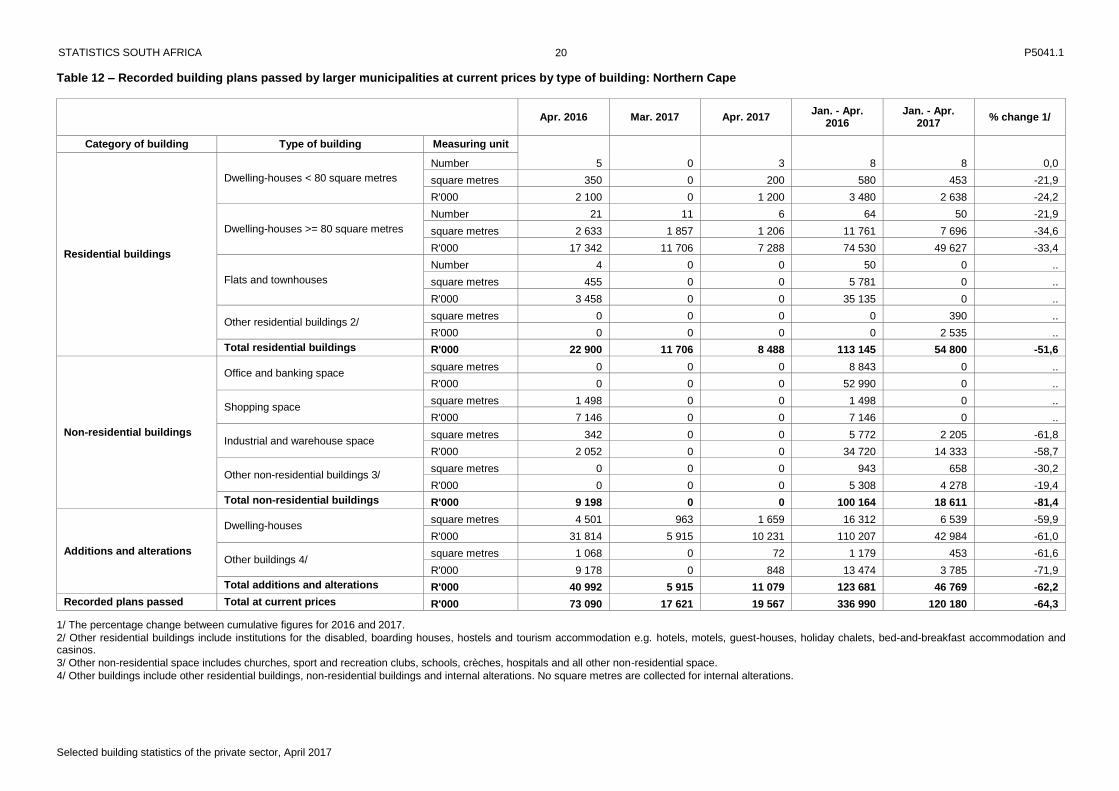
Table 12 Recorded building plans passed by larger municipalities at current prices by type of building: Northern Cape ............................................................................................................................................ 20
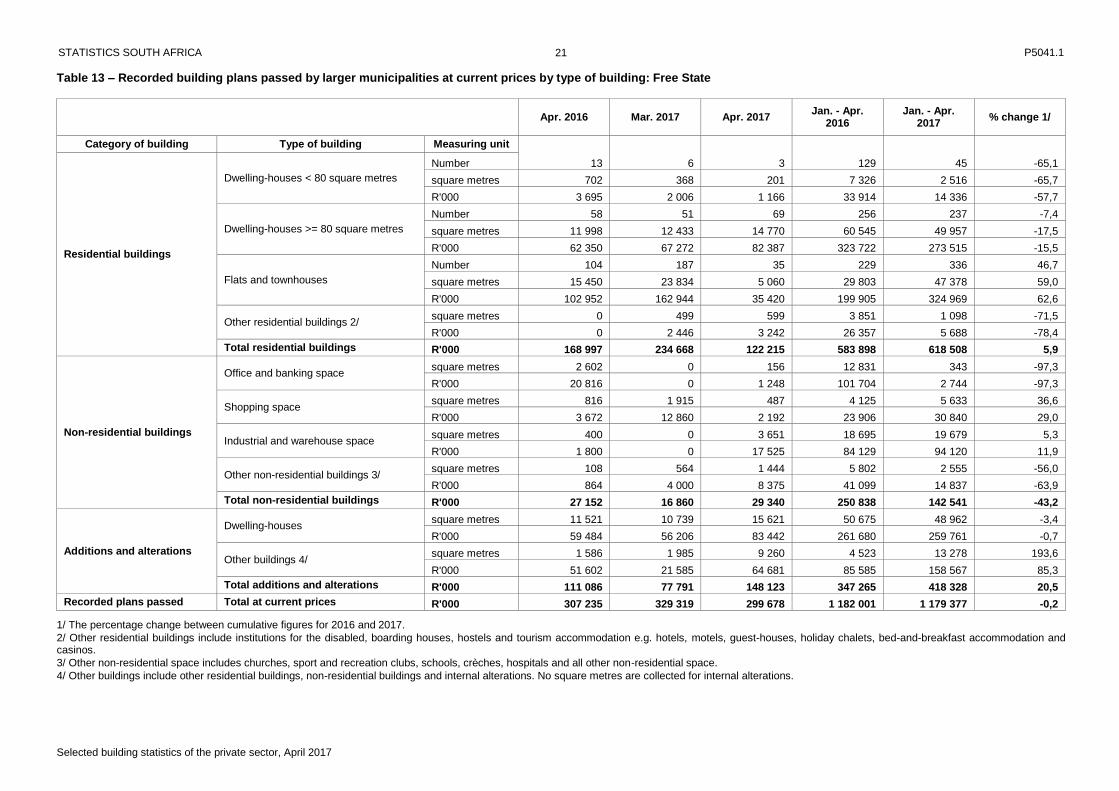
Table 13 Recorded building plans passed by larger municipalities at current prices by type of building: Free State ................................................................................................................................................... 21
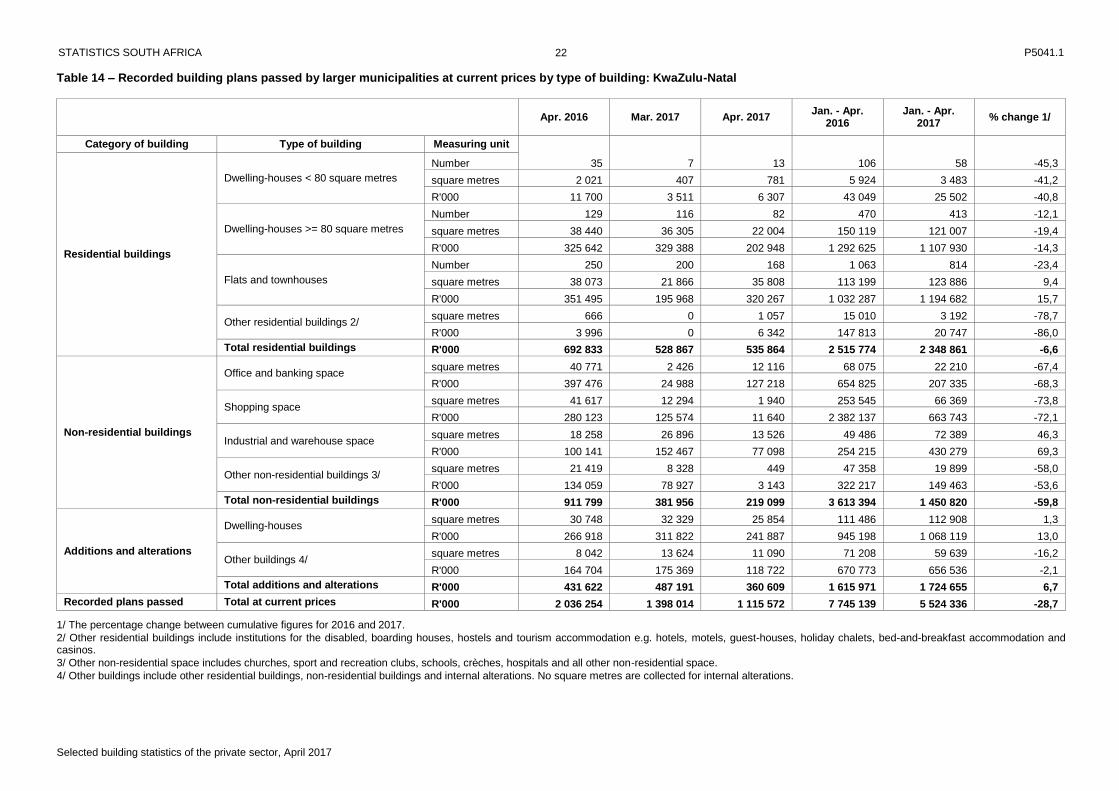
Table 14 Recorded building plans passed by larger municipalities at current prices by type of building: KwaZulu-Natal ............................................................................................................................................ 22
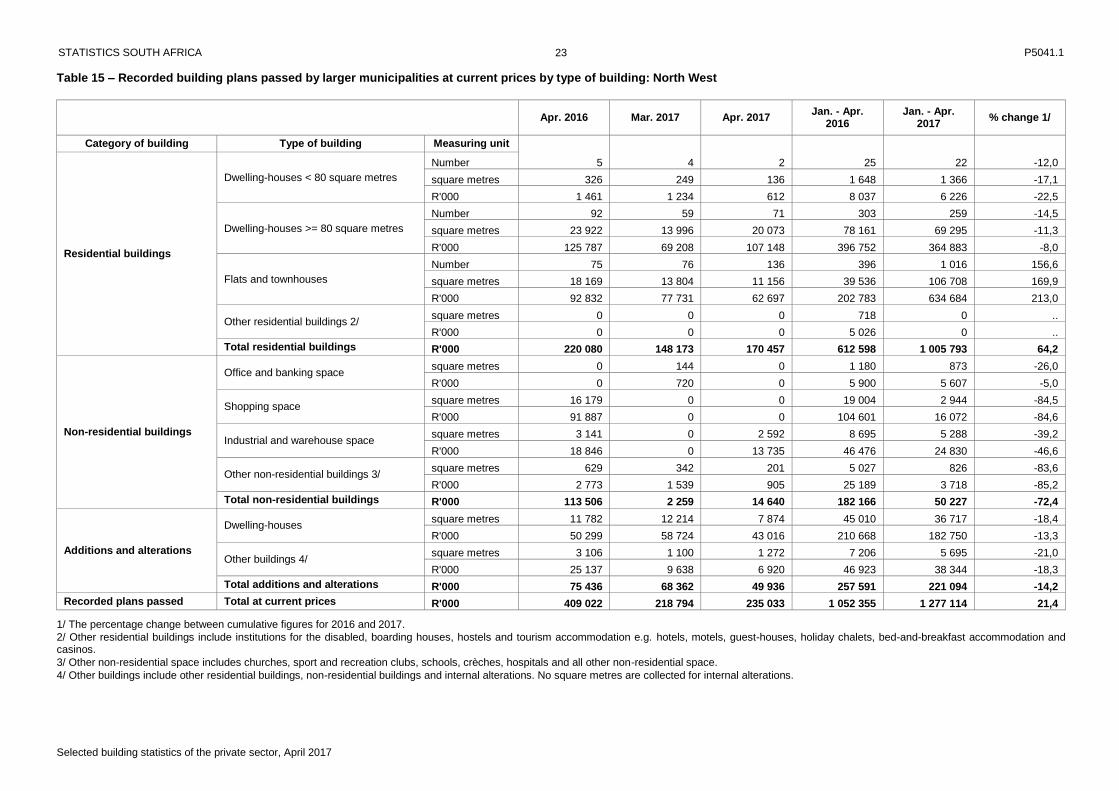
Table 15 Recorded building plans passed by larger municipalities at current prices by type of building: North West .................................................................................................................................................. 23
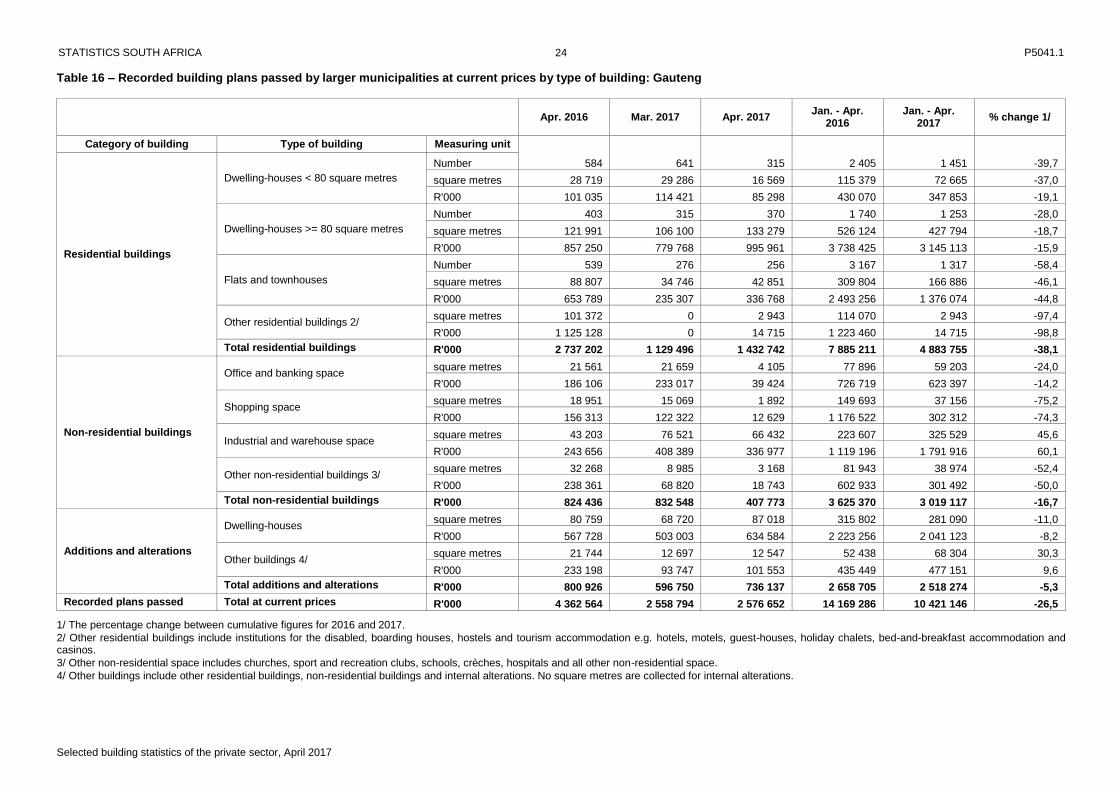
Table 16 Recorded building plans passed by larger municipalities at current prices by type of building: Gauteng ...................................................................................................................................................... 24
Table 17 Recorded building plans passed by larger municipalities at current prices by type of building: Mpumalanga ............................................................................................................................................... 25
Table 18 Recorded building plans passed by larger municipalities at current prices by type of building: Limpopo ...................................................................................................................................................... 26
Table 19 Buildings reported as completed to larger municipalities at current prices by type of building: South Africa ................................................................................................................................................ 27
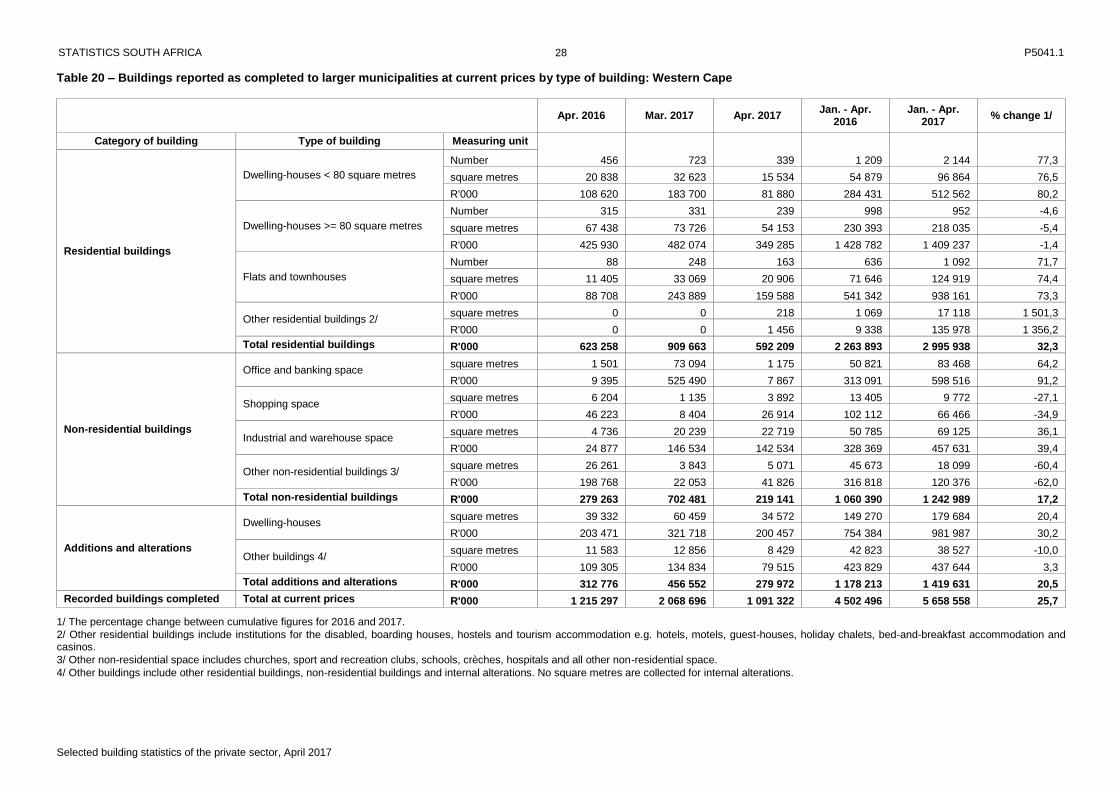
Table 20 Buildings reported as completed to larger municipalities at current prices by type of building: Western Cape ............................................................................................................................................. 28
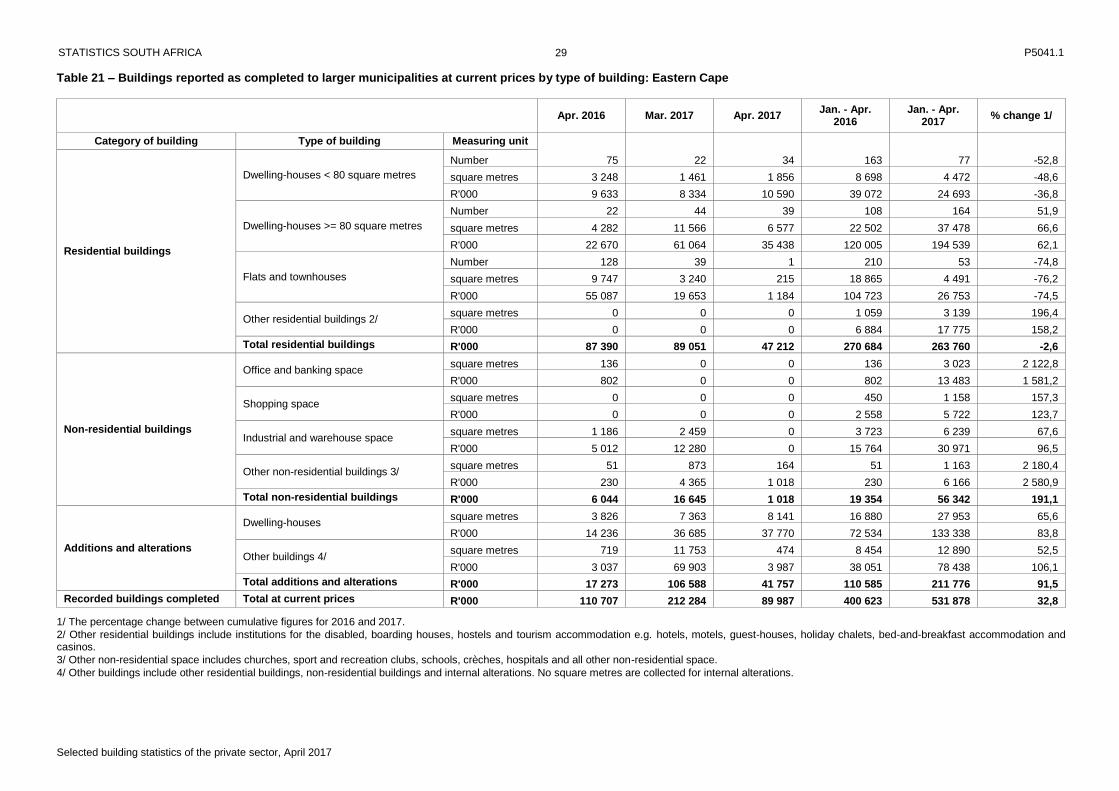
Table 21 Buildings reported as completed to larger municipalities at current prices by type of building: Eastern Cape .............................................................................................................................................. 29
Table 22 Buildings reported as completed to larger municipalities at current prices by type of building: Northern Cape ............................................................................................................................................ 30
Table 23 Buildings reported as completed to larger municipalities at current prices by type of building: Free State ................................................................................................................................................... 31
Table 24 Buildings reported as completed to larger municipalities at current prices by type of building: KwaZulu-Natal ............................................................................................................................................ 32
Table 25 Buildings reported as completed to larger municipalities at current prices by type of building: North West .................................................................................................................................................. 33

STATISTICS SOUTH AFRICA P5041.1
Selected building statistics of the private sector, April 2017
2
Table 26 Buildings reported as completed to larger municipalities at current prices by type of building: Gauteng ...................................................................................................................................................... 34
Table 27 Buildings reported as completed to larger municipalities at current prices by type of building: Mpumalanga ............................................................................................................................................... 35
Table 28 Buildings reported as completed to larger municipalities at current prices by type of building: Limpopo ...................................................................................................................................................... 36
Explanatory notes ..........................................................................................................................................
37
Glossary .......................................................................................................................................................... 40
Technical enquiries ....................................................................................................................................... 41
General information ....................................................................................................................................... 42
STATISTICS SOUTH AFRICA P5041.1
Selected building statistics of the private sector, April 2017
3
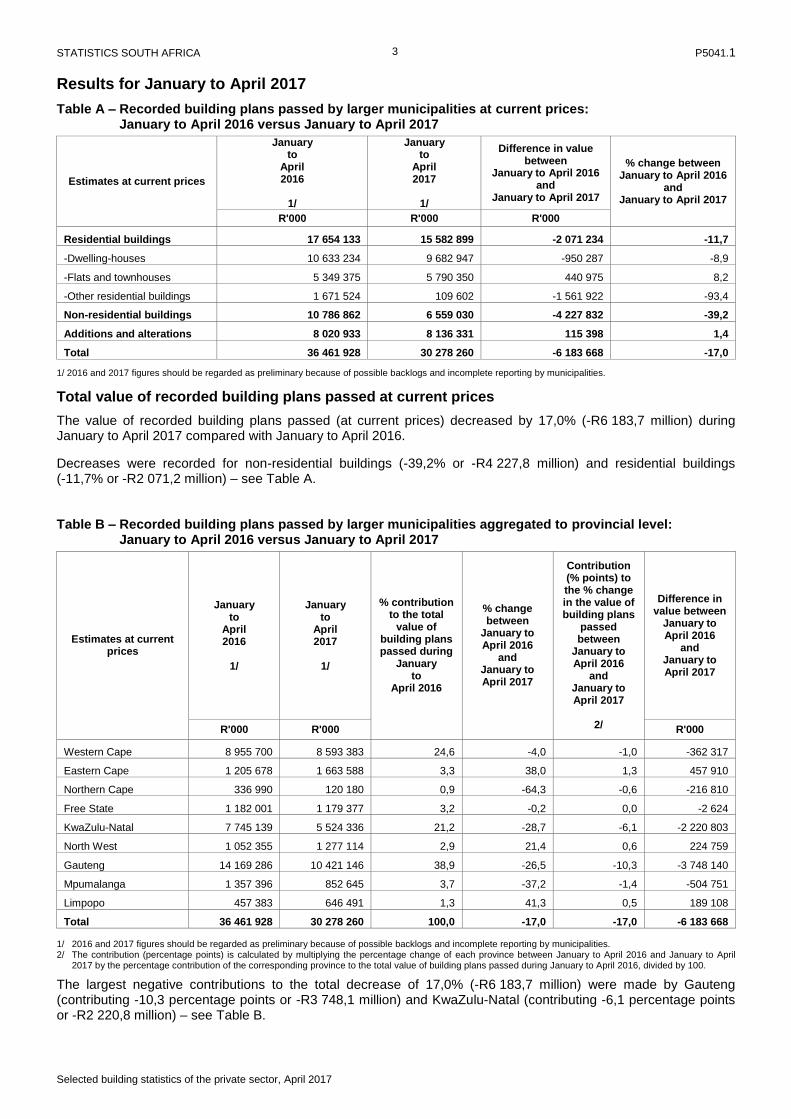
Results for January to April 2017 Table A – Recorded building plans passed by larger municipalities at current prices: January to April 2016 versus January to April 2017
Estimates at current prices
January to
April 2016
1/
January to
April 2017
1/
Difference in value between
January to April 2016 and
January to April 2017
% change between January to April 2016
and January to April 2017
R'000 R'000 R'000
Residential buildings 17 654 133 15 582 899 -2 071 234 -11,7
-Dwelling-houses 10 633 234 9 682 947 -950 287 -8,9
-Flats and townhouses 5 349 375 5 790 350 440 975 8,2
-Other residential buildings 1 671 524 109 602 -1 561 922 -93,4
Non-residential buildings 10 786 862 6 559 030 -4 227 832 -39,2
Additions and alterations 8 020 933 8 136 331 115 398 1,4
Total 36 461 928 30 278 260 -6 183 668 -17,0
1/ 2016 and 2017 figures should be regarded as preliminary because of possible backlogs and incomplete reporting by municipalities.
Total value of recorded building plans passed at current prices The value of recorded building plans passed (at current prices) decreased by 17,0% (-R6 183,7 million) during January to April 2017 compared with January to April 2016.
Decreases were recorded for non-residential buildings (-39,2% or -R4 227,8 million) and residential buildings (-11,7% or -R2 071,2 million) – see Table A. Table B – Recorded building plans passed by larger municipalities aggregated to provincial level: January to April 2016 versus January to April 2017
Estimates at current prices
January to
April 2016
1/
January to
April 2017
1/
% contribution to the total
value of building plans passed during
January to
April 2016
% change between
January to April 2016
and January to April 2017
Contribution (% points) to the % change in the value of building plans
passed between
January to April 2016
and January to April 2017
2/
Difference in value between
January to April 2016
and January to April 2017
R'000 R'000 R'000
Western Cape 8 955 700 8 593 383 24,6 -4,0 -1,0 -362 317
Eastern Cape 1 205 678 1 663 588 3,3 38,0 1,3 457 910
Northern Cape 336 990 120 180 0,9 -64,3 -0,6 -216 810
Free State 1 182 001 1 179 377 3,2 -0,2 0,0 -2 624
KwaZulu-Natal 7 745 139 5 524 336 21,2 -28,7 -6,1 -2 220 803
North West 1 052 355 1 277 114 2,9 21,4 0,6 224 759
Gauteng 14 169 286 10 421 146 38,9 -26,5 -10,3 -3 748 140
Mpumalanga 1 357 396 852 645 3,7 -37,2 -1,4 -504 751
Limpopo 457 383 646 491 1,3 41,3 0,5 189 108
Total 36 461 928 30 278 260 100,0 -17,0 -17,0 -6 183 668
1/ 2016 and 2017 figures should be regarded as preliminary because of possible backlogs and incomplete reporting by municipalities. 2/ The contribution (percentage points) is calculated by multiplying the percentage change of each province between January to April 2016 and January to April
2017 by the percentage contribution of the corresponding province to the total value of building plans passed during January to April 2016, divided by 100.
The largest negative contributions to the total decrease of 17,0% (-R6 183,7 million) were made by Gauteng (contributing -10,3 percentage points or -R3 748,1 million) and KwaZulu-Natal (contributing -6,1 percentage points or -R2 220,8 million) – see Table B.
STATISTICS SOUTH AFRICA P5041.1
Selected building statistics of the private sector, April 2017
4
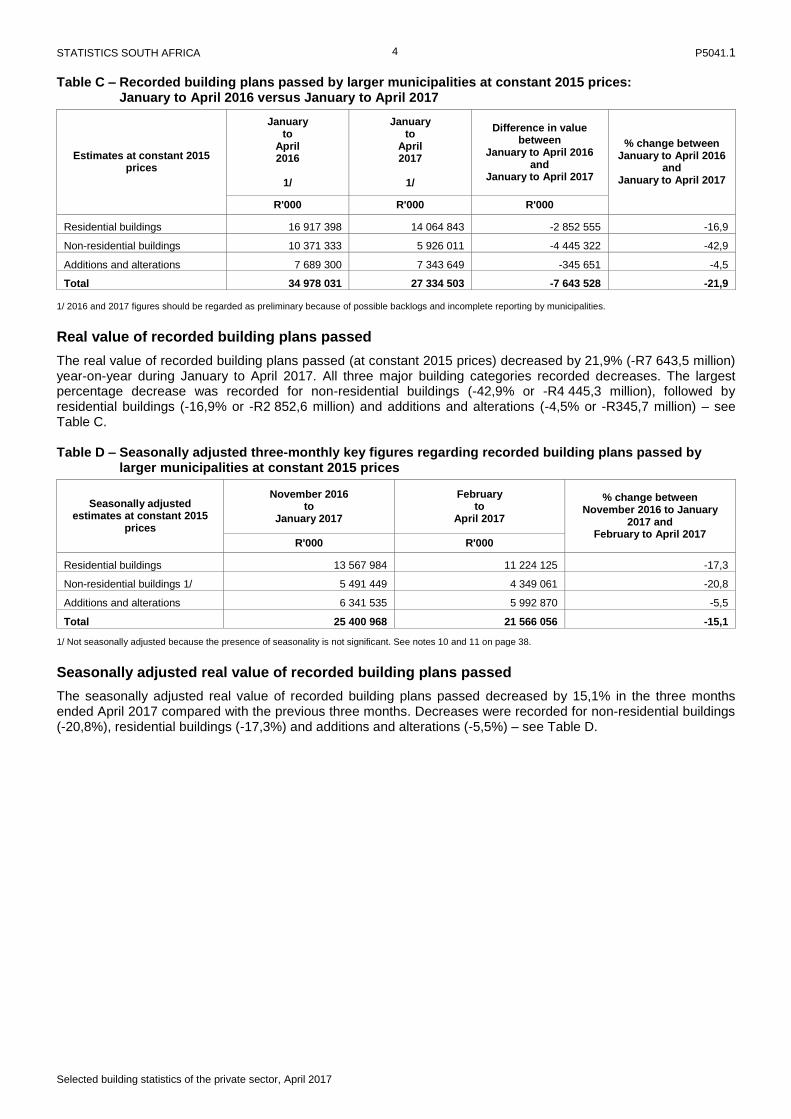
Table C – Recorded building plans passed by larger municipalities at constant 2015 prices: January to April 2016 versus January to April 2017
Estimates at constant 2015 prices
January to
April 2016
1/
January to
April 2017
1/
Difference in value between
January to April 2016 and
January to April 2017
% change between January to April 2016
and January to April 2017
R'000 R'000 R'000
Residential buildings 16 917 398 14 064 843 -2 852 555 -16,9
Non-residential buildings 10 371 333 5 926 011 -4 445 322 -42,9
Additions and alterations 7 689 300 7 343 649 -345 651 -4,5
Total 34 978 031 27 334 503 -7 643 528 -21,9 1/ 2016 and 2017 figures should be regarded as preliminary because of possible backlogs and incomplete reporting by municipalities.
Real value of recorded building plans passed The real value of recorded building plans passed (at constant 2015 prices) decreased by 21,9% (-R7 643,5 million) year-on-year during January to April 2017. All three major building categories recorded decreases. The largest percentage decrease was recorded for non-residential buildings (-42,9% or -R4 445,3 million), followed by residential buildings (-16,9% or -R2 852,6 million) and additions and alterations (-4,5% or -R345,7 million) – see Table C.
Table D – Seasonally adjusted three-monthly key figures regarding recorded building plans passed by larger municipalities at constant 2015 prices
Seasonally adjusted estimates at constant 2015
prices
November 2016 to
January 2017
February to
April 2017
% change between November 2016 to January
2017 and February to April 2017
R'000 R'000
Residential buildings 13 567 984 11 224 125 -17,3
Non-residential buildings 1/ 5 491 449 4 349 061 -20,8
Additions and alterations 6 341 535 5 992 870 -5,5
Total 25 400 968 21 566 056 -15,1
1/ Not seasonally adjusted because the presence of seasonality is not significant. See notes 10 and 11 on page 38.
Seasonally adjusted real value of recorded building plans passed The seasonally adjusted real value of recorded building plans passed decreased by 15,1% in the three months ended April 2017 compared with the previous three months. Decreases were recorded for non-residential buildings (-20,8%), residential buildings (-17,3%) and additions and alterations (-5,5%) – see Table D.

STATISTICS SOUTH AFRICA P5041.1
Selected building statistics of the private sector, April 2017
5 Figure 1 – Real value of recorded building plans passed by larger municipalities
Constant 2015 prices

STATISTICS SOUTH AFRICA P5041.1
Selected building statistics of the private sector, April 2017
6
Table E – Buildings reported as completed to larger municipalities at current prices: January to April 2016 versus January to April 2017
Estimates at current prices
January to
April 2016
1/
January to
April 2017
1/
Difference in value between
January to April 2016 and
January to April 2017
% change between January to April 2016
and January to April 2017
R'000 R'000 R'000
Residential buildings 9 507 966 12 664 554 3 156 588 33,2
-Dwelling-houses 6 728 748 6 883 799 155 051 2,3
-Flats and townhouses 2 712 202 4 150 311 1 438 109 53,0
-Other residential buildings 67 016 1 630 444 1 563 428 2 332,9
Non-residential buildings 5 532 637 5 423 074 -109 563 -2,0
Additions and alterations 3 221 809 3 400 555 178 746 5,5
Total 18 262 412 21 488 183 3 225 771 17,7 1/ 2016 and 2017 figures should be regarded as preliminary because of possible backlogs and incomplete reporting by municipalities.
Total value of buildings reported as completed at current prices The value of buildings reported as completed (at current prices) increased by 17,7% (R3 225,8 million) during January to April 2017 compared with January to April 2016.
Residential buildings rose by 33,2% (R3 156,6 million) – see Table E.
Table F – Buildings reported as completed to larger municipalities aggregated to provincial level: January to April 2016 versus January to April 2017
Estimates at current prices
January to
April 2016
1/
January to
April 2017
1/
% contribution to the total
value of buildings
completed during
January to April 2016
% change between
January to April 2016
and January to April 2017
Contribution (% points) to the % change in the value of
buildings completed between
January to April 2016
and January to April 2017
2/
Difference in value between
January to April 2016
and January to April 2017
R'000 R'000 R'000
Western Cape 4 502 496 5 658 558 24,7 25,7 6,3 1 156 062
Eastern Cape 400 623 531 878 2,2 32,8 0,7 131 255
Northern Cape 134 779 96 314 0,7 -28,5 -0,2 -38 465
Free State 506 553 325 135 2,8 -35,8 -1,0 -181 418
KwaZulu-Natal 3 413 715 3 270 246 18,7 -4,2 -0,8 -143 469
North West 758 714 545 350 4,2 -28,1 -1,2 -213 364
Gauteng 7 768 175 10 374 761 42,5 33,6 14,3 2 606 586
Mpumalanga 565 605 448 595 3,1 -20,7 -0,6 -117 010
Limpopo 211 752 237 346 1,2 12,1 0,1 25 594
Total 18 262 412 21 488 183 100,0 17,7 17,7 3 225 771
1/ 2016 and 2017 figures should be regarded as preliminary because of possible backlogs and incomplete reporting by municipalities. 2/ The contribution (percentage points) is calculated by multiplying the percentage change of each province between January to April 2016 and January to April
2017 by the percentage contribution of the corresponding province to the total value of buildings completed during January to April 2016, divided by 100.
Four provinces reported year-on-year increases in the value of buildings completed during January to April 2017. The largest contributions were recorded for Gauteng (contributing 14,3 percentage points or R2 606,6 million) and Western Cape (contributing 6,3 percentage points or R1 156,1 million) – see Table F.
STATISTICS SOUTH AFRICA P5041.1
Selected building statistics of the private sector, April 2017
7
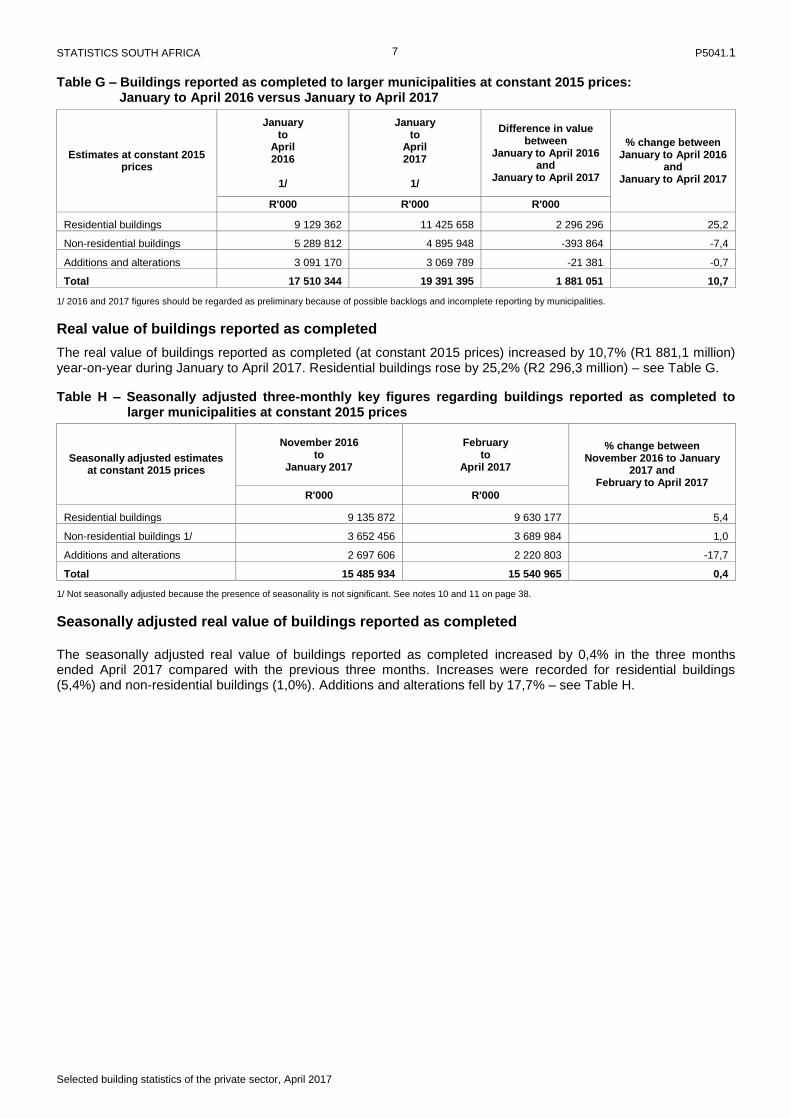
Table G – Buildings reported as completed to larger municipalities at constant 2015 prices: January to April 2016 versus January to April 2017
Estimates at constant 2015 prices
January to
April 2016
1/
January to
April 2017
1/
Difference in value between
January to April 2016 and
January to April 2017
% change between January to April 2016
and January to April 2017
R'000 R'000 R'000
Residential buildings 9 129 362 11 425 658 2 296 296 25,2
Non-residential buildings 5 289 812 4 895 948 -393 864 -7,4
Additions and alterations 3 091 170 3 069 789 -21 381 -0,7
Total 17 510 344 19 391 395 1 881 051 10,7
1/ 2016 and 2017 figures should be regarded as preliminary because of possible backlogs and incomplete reporting by municipalities.
Real value of buildings reported as completed The real value of buildings reported as completed (at constant 2015 prices) increased by 10,7% (R1 881,1 million) year-on-year during January to April 2017. Residential buildings rose by 25,2% (R2 296,3 million) – see Table G.
Table H – Seasonally adjusted three-monthly key figures regarding buildings reported as completed to larger municipalities at constant 2015 prices
Seasonally adjusted estimates at constant 2015 prices
November 2016 to
January 2017
February to
April 2017
% change between November 2016 to January
2017 and February to April 2017
R'000 R'000
Residential buildings 9 135 872 9 630 177 5,4
Non-residential buildings 1/ 3 652 456 3 689 984 1,0
Additions and alterations 2 697 606 2 220 803 -17,7
Total 15 485 934 15 540 965 0,4
1/ Not seasonally adjusted because the presence of seasonality is not significant. See notes 10 and 11 on page 38.
Seasonally adjusted real value of buildings reported as completed The seasonally adjusted real value of buildings reported as completed increased by 0,4% in the three months ended April 2017 compared with the previous three months. Increases were recorded for residential buildings (5,4%) and non-residential buildings (1,0%). Additions and alterations fell by 17,7% – see Table H.

STATISTICS SOUTH AFRICA P5041.1
Selected building statistics of the private sector, April 2017
8
Figure 2 – Real value of buildings reported as completed to larger municipalities
Constant 2015 prices
PJ Lehohla Statistician-General

STATISTICS SOUTH AFRICA P5041.1
Selected building statistics of the private sector, April 2017
9
Table 1 – Value and percentage change of recorded building plans passed by larger municipalities at current prices by type of building
Year and month 2/
Residential buildings Non-residential buildings Additions and alterations Total
R'000 % change 1/ R'000 % change 1/ R'000 % change 1/ R'000 % change 1/
2016
January 2 976 023 -12,8 3 244 246 372,0 1 451 533 -13,0 7 671 802 33,0
February 4 592 411 20,1 2 247 812 71,5 2 125 304 -8,7 8 965 527 20,1
March 4 600 728 8,1 2 515 020 17,0 2 056 047 -8,8 9 171 795 5,9
April 5 484 971 29,6 2 779 784 43,3 2 388 049 20,6 10 652 804 30,7
May 4 208 361 -0,2 2 167 660 -51,6 2 241 429 3,0 8 617 450 -20,7
June 4 978 546 10,3 1 445 606 -63,9 2 415 528 9,1 8 839 680 -17,6
July 3 762 166 -16,1 1 334 132 -35,8 2 532 825 -4,6 7 629 123 -17,2
August 4 397 152 3,3 1 796 343 -7,2 2 291 169 -0,1 8 484 664 0,0
September 4 802 689 2,1 2 513 194 66,5 2 707 391 20,4 10 023 274 18,5
October 5 420 582 21,5 2 488 211 116,3 2 717 674 17,8 10 626 467 34,2
November 4 827 911 10,5 2 804 152 99,2 2 458 564 15,0 10 090 627 27,5
December 4 736 194 25,9 1 462 921 -27,1 1 954 313 -10,4 8 153 428 2,6
Total 54 787 734 8,5 26 799 081 8,7 27 339 826 3,4 108 926 641 7,2 2017
January 3 161 447 6,2 1 731 491 -46,6 1 703 058 17,3 6 595 996 -14,0
February 4 541 114 -1,1 2 214 493 -1,5 2 166 491 1,9 8 922 098 -0,5
March 4 216 225 -8,4 1 651 432 -34,3 2 281 535 11,0 8 149 192 -11,1
April 3 664 113 -33,2 961 614 -65,4 1 985 247 -16,9 6 610 974 -37,9
1/ The percentage change is the change in the value of recorded building plans passed by municipalities of the relevant year/month compared with the value of recorded building plans passed by municipalities of the comparable period of the previous year expressed as a percentage. 2/ Preliminary figures.
STATISTICS SOUTH AFRICA P5041.1
Selected building statistics of the private sector, April 2017
10
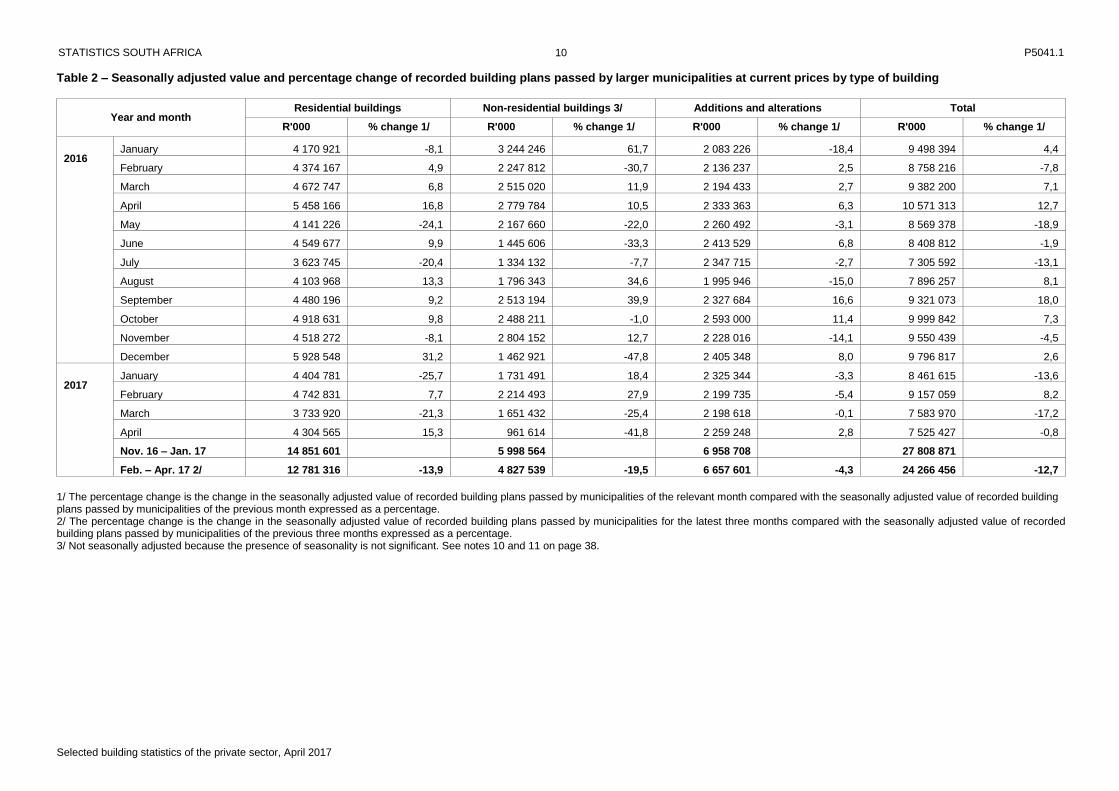
Table 2 – Seasonally adjusted value and percentage change of recorded building plans passed by larger municipalities at current prices by type of building
Year and month Residential buildings Non-residential buildings 3/ Additions and alterations Total
R'000 % change 1/ R'000 % change 1/ R'000 % change 1/ R'000 % change 1/
2016 January 4 170 921 -8,1 3 244 246 61,7 2 083 226 -18,4 9 498 394 4,4
February 4 374 167 4,9 2 247 812 -30,7 2 136 237 2,5 8 758 216 -7,8
March 4 672 747 6,8 2 515 020 11,9 2 194 433 2,7 9 382 200 7,1
April 5 458 166 16,8 2 779 784 10,5 2 333 363 6,3 10 571 313 12,7
May 4 141 226 -24,1 2 167 660 -22,0 2 260 492 -3,1 8 569 378 -18,9
June 4 549 677 9,9 1 445 606 -33,3 2 413 529 6,8 8 408 812 -1,9
July 3 623 745 -20,4 1 334 132 -7,7 2 347 715 -2,7 7 305 592 -13,1
August 4 103 968 13,3 1 796 343 34,6 1 995 946 -15,0 7 896 257 8,1
September 4 480 196 9,2 2 513 194 39,9 2 327 684 16,6 9 321 073 18,0
October 4 918 631 9,8 2 488 211 -1,0 2 593 000 11,4 9 999 842 7,3
November 4 518 272 -8,1 2 804 152 12,7 2 228 016 -14,1 9 550 439 -4,5
December 5 928 548 31,2 1 462 921 -47,8 2 405 348 8,0 9 796 817 2,6
2017 January 4 404 781 -25,7 1 731 491 18,4 2 325 344 -3,3 8 461 615 -13,6
February 4 742 831 7,7 2 214 493 27,9 2 199 735 -5,4 9 157 059 8,2
March 3 733 920 -21,3 1 651 432 -25,4 2 198 618 -0,1 7 583 970 -17,2
April 4 304 565 15,3 961 614 -41,8 2 259 248 2,8 7 525 427 -0,8
Nov. 16 – Jan. 17 14 851 601 5 998 564 6 958 708 27 808 871
Feb. – Apr. 17 2/ 12 781 316 -13,9 4 827 539 -19,5 6 657 601 -4,3 24 266 456 -12,7
1/ The percentage change is the change in the seasonally adjusted value of recorded building plans passed by municipalities of the relevant month compared with the seasonally adjusted value of recorded building plans passed by municipalities of the previous month expressed as a percentage. 2/ The percentage change is the change in the seasonally adjusted value of recorded building plans passed by municipalities for the latest three months compared with the seasonally adjusted value of recorded building plans passed by municipalities of the previous three months expressed as a percentage. 3/ Not seasonally adjusted because the presence of seasonality is not significant. See notes 10 and 11 on page 38.

STATISTICS SOUTH AFRICA P5041.1
Selected building statistics of the private sector, April 2017
11
Table 3 – Value and percentage change of recorded building plans passed by larger municipalities at constant 2015 prices by type of building
Year and month 2/ Residential buildings Non-residential buildings Additions and alterations Total
R'000 % change 1/ R'000 % change 1/ R'000 % change 1/ R'000 % change 1/
2016 January 2 911 960 -15,8 3 174 409 355,4 1 420 287 -16,1 7 506 656 28,3
February 4 403 079 13,3 2 155 141 61,8 2 037 684 -13,9 8 595 904 13,3
March 4 398 402 2,3 2 404 417 10,7 1 965 628 -13,7 8 768 447 0,2
April 5 203 957 22,6 2 637 366 35,6 2 265 701 14,1 10 107 024 23,6
May 3 981 420 -5,7 2 050 766 -54,3 2 120 557 -2,6 8 152 743 -25,1
June 4 661 560 3,6 1 353 564 -66,1 2 261 730 2,5 8 276 854 -22,6
July 3 512 760 -21,2 1 245 688 -39,6 2 364 916 -10,3 7 123 364 -22,2
August 4 101 821 -3,3 1 675 693 -13,2 2 137 285 -6,5 7 914 799 -6,4
September 4 467 618 -4,8 2 337 855 55,1 2 518 503 12,2 9 323 976 10,4
October 5 028 369 13,7 2 308 173 102,5 2 521 033 10,3 9 857 575 25,6
November 4 441 500 2,7 2 579 717 85,1 2 261 788 6,8 9 283 005 18,5
December 4 321 345 16,0 1 334 782 -32,8 1 783 132 -17,4 7 439 259 -5,5
Total 51 433 791 1,9 25 257 571 2,5 25 658 244 -2,9 102 349 606 0,8 2017
January 2 879 278 -1,1 1 576 950 -50,3 1 551 055 9,2 6 007 283 -20,0
February 4 098 478 -6,9 1 998 640 -7,3 1 955 317 -4,0 8 052 435 -6,3
March 3 794 982 -13,7 1 486 437 -38,2 2 053 587 4,5 7 335 006 -16,3
April 3 292 105 -36,7 863 984 -67,2 1 783 690 -21,3 5 939 779 -41,2
1/ The percentage change is the change in the value of recorded building plans passed by municipalities of the relevant year/month compared with the value of recorded building plans passed by municipalities of the comparable period of the previous year expressed as a percentage. 2/ Preliminary figures.

STATISTICS SOUTH AFRICA P5041.1
Selected building statistics of the private sector, April 2017
12
Table 4 – Seasonally adjusted value and percentage change of recorded building plans passed by larger municipalities at constant 2015 prices by type of building
Year and month Residential buildings Non-residential buildings 3/ Additions and alterations Total
R'000 % change 1/ R'000 % change 1/ R'000 % change 1/ R'000 % change 1/
2016 January 4 038 401 -10,0 3 174 409 59,8 2 030 570 -19,5 9 243 379 2,8
February 4 536 330 12,3 2 155 141 -32,1 2 044 928 0,7 8 736 399 -5,5
March 4 531 092 -0,1 2 404 417 11,6 2 095 046 2,5 9 030 556 3,4
April 5 048 038 11,4 2 637 366 9,7 2 217 160 5,8 9 902 564 9,7
May 3 857 913 -23,6 2 050 766 -22,2 2 138 907 -3,5 8 047 586 -18,7
June 4 206 738 9,0 1 353 564 -34,0 2 267 840 6,0 7 828 142 -2,7
July 3 408 538 -19,0 1 245 688 -8,0 2 202 403 -2,9 6 856 629 -12,4
August 3 821 953 12,1 1 675 693 34,5 1 865 026 -15,3 7 362 672 7,4
September 4 140 278 8,3 2 337 855 39,5 2 165 582 16,1 8 643 715 17,4
October 4 536 369 9,6 2 308 173 -1,3 2 399 814 10,8 9 244 355 6,9
November 4 164 712 -8,2 2 579 717 11,8 2 047 274 -14,7 8 791 703 -4,9
December 5 458 217 31,1 1 334 782 -48,3 2 186 887 6,8 8 979 886 2,1
2017 January 3 945 055 -27,7 1 576 950 18,1 2 107 374 -3,6 7 629 379 -15,0
February 4 118 823 4,4 1 998 640 26,7 1 986 913 -5,7 8 104 376 6,2
March 3 407 346 -17,3 1 486 437 -25,6 1 981 909 -0,3 6 875 692 -15,2
April 3 697 956 8,5 863 984 -41,9 2 024 048 2,1 6 585 988 -4,2
Nov. 16 – Jan. 17 13 567 984 5 491 449 6 341 535 25 400 968
Feb. – Apr. 17 2/ 11 224 125 -17,3 4 349 061 -20,8 5 992 870 -5,5 21 566 056 -15,1
1/ The percentage change is the change in the seasonally adjusted value of recorded building plans passed by municipalities of the relevant month compared with the seasonally adjusted value of recorded building plans passed by municipalities of the previous month expressed as a percentage. 2/ The percentage change is the change in the seasonally adjusted value of recorded building plans passed by municipalities for the latest three months compared with the seasonally adjusted value of recorded building plans passed by municipalities of the previous three months expressed as a percentage. 3/ Not seasonally adjusted because the presence of seasonality is not significant. See notes 10 and 11 on page 38.

STATISTICS SOUTH AFRICA P5041.1
Selected building statistics of the private sector, April 2017
13
Table 5 – Value and percentage change of buildings reported as completed to larger municipalities at current prices by type of building
Year and month 2/ Residential buildings Non-residential buildings Additions and alterations Total
R'000 % change 1/ R'000 % change 1/ R'000 % change 1/ R'000 % change 1/
2016 January 2 208 305 21,4 578 503 -26,4 651 330 29,8 3 438 138 10,7
February 2 459 034 17,8 1 029 861 1,0 869 860 28,7 4 358 755 15,2
March 2 523 781 -1,7 1 810 745 110,9 878 230 -14,4 5 212 756 17,1
April 2 316 846 -11,2 2 113 528 189,3 822 389 -8,9 5 252 763 23,8
May 3 275 280 5,0 1 819 266 87,9 913 420 14,6 6 007 966 23,0
June 3 105 362 19,4 1 325 164 25,4 930 103 -5,5 5 360 629 15,5
July 2 339 251 -11,2 1 150 587 5,0 705 601 -17,2 4 195 439 -8,5
August 2 511 205 -11,3 1 205 852 -15,1 791 833 -2,8 4 508 890 -11,0
September 3 647 566 21,5 1 326 114 -19,5 983 917 16,6 5 957 597 8,5
October 3 050 481 13,5 928 259 -45,2 1 022 162 33,4 5 000 902 -2,9
November 3 026 831 -11,9 1 682 124 -14,7 1 040 884 19,4 5 749 839 -8,4
December 4 515 140 61,4 985 304 -32,0 873 119 14,2 6 373 563 27,2
Total 34 979 082 8,7 15 955 307 8,6 10 482 848 7,0 61 417 237 8,3 2017
January 2 359 273 6,8 1 324 149 128,9 755 314 16,0 4 438 736 29,1
February 2 992 499 21,7 793 718 -22,9 841 521 -3,3 4 627 738 6,2
March 3 593 693 42,4 2 469 283 36,4 1 113 881 26,8 7 176 857 37,7
April 3 719 089 60,5 835 924 -60,4 689 839 -16,1 5 244 852 -0,2
1/ The percentage change is the change in the value of buildings reported as completed to municipalities of the relevant year/month compared with the value of buildings reported as completed to municipalities of the comparable period of the previous year expressed as a percentage. 2/ Preliminary figures.
STATISTICS SOUTH AFRICA P5041.1
Selected building statistics of the private sector, April 2017
14
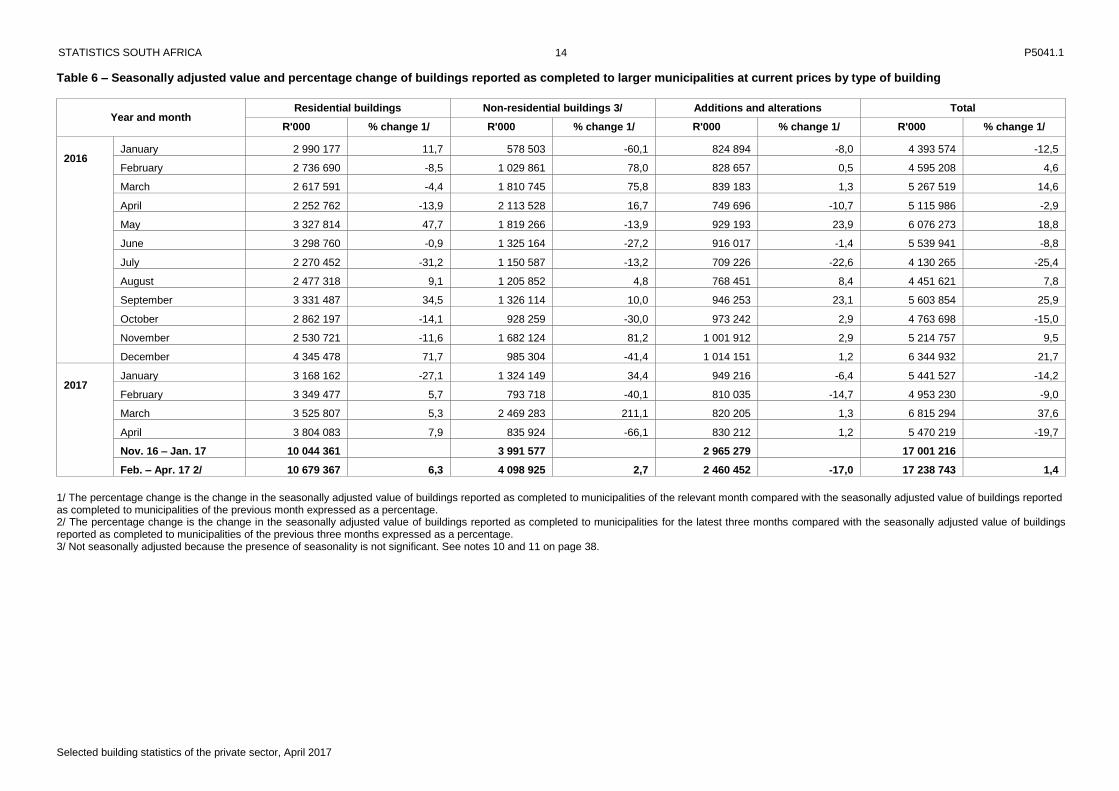
Table 6 – Seasonally adjusted value and percentage change of buildings reported as completed to larger municipalities at current prices by type of building
Year and month Residential buildings Non-residential buildings 3/ Additions and alterations Total
R'000 % change 1/ R'000 % change 1/ R'000 % change 1/ R'000 % change 1/
2016 January 2 990 177 11,7 578 503 -60,1 824 894 -8,0 4 393 574 -12,5
February 2 736 690 -8,5 1 029 861 78,0 828 657 0,5 4 595 208 4,6
March 2 617 591 -4,4 1 810 745 75,8 839 183 1,3 5 267 519 14,6
April 2 252 762 -13,9 2 113 528 16,7 749 696 -10,7 5 115 986 -2,9
May 3 327 814 47,7 1 819 266 -13,9 929 193 23,9 6 076 273 18,8
June 3 298 760 -0,9 1 325 164 -27,2 916 017 -1,4 5 539 941 -8,8
July 2 270 452 -31,2 1 150 587 -13,2 709 226 -22,6 4 130 265 -25,4
August 2 477 318 9,1 1 205 852 4,8 768 451 8,4 4 451 621 7,8
September 3 331 487 34,5 1 326 114 10,0 946 253 23,1 5 603 854 25,9
October 2 862 197 -14,1 928 259 -30,0 973 242 2,9 4 763 698 -15,0
November 2 530 721 -11,6 1 682 124 81,2 1 001 912 2,9 5 214 757 9,5
December 4 345 478 71,7 985 304 -41,4 1 014 151 1,2 6 344 932 21,7
2017 January 3 168 162 -27,1 1 324 149 34,4 949 216 -6,4 5 441 527 -14,2
February 3 349 477 5,7 793 718 -40,1 810 035 -14,7 4 953 230 -9,0
March 3 525 807 5,3 2 469 283 211,1 820 205 1,3 6 815 294 37,6
April 3 804 083 7,9 835 924 -66,1 830 212 1,2 5 470 219 -19,7
Nov. 16 – Jan. 17 10 044 361 3 991 577 2 965 279 17 001 216
Feb. – Apr. 17 2/ 10 679 367 6,3 4 098 925 2,7 2 460 452 -17,0 17 238 743 1,4
1/ The percentage change is the change in the seasonally adjusted value of buildings reported as completed to municipalities of the relevant month compared with the seasonally adjusted value of buildings reported as completed to municipalities of the previous month expressed as a percentage. 2/ The percentage change is the change in the seasonally adjusted value of buildings reported as completed to municipalities for the latest three months compared with the seasonally adjusted value of buildings reported as completed to municipalities of the previous three months expressed as a percentage. 3/ Not seasonally adjusted because the presence of seasonality is not significant. See notes 10 and 11 on page 38.

STATISTICS SOUTH AFRICA P5041.1
Selected building statistics of the private sector, April 2017
15
Table 7 – Value and percentage change of buildings reported as completed to larger municipalities at constant 2015 prices by type of building
Year and month 2/ Residential buildings Non-residential buildings Additions and alterations Total
R'000 % change 1/ R'000 % change 1/ R'000 % change 1/ R'000 % change 1/
2016 January 2 160 768 17,1 566 050 -29,0 637 309 25,3 3 364 127 6,8
February 2 357 655 11,1 987 403 -4,7 833 998 21,4 4 179 056 8,7
March 2 412 793 -7,0 1 731 114 99,6 839 608 -19,0 4 983 515 10,8
April 2 198 146 -16,0 2 005 245 173,6 780 255 -13,9 4 983 646 17,1
May 3 098 657 -0,8 1 721 160 77,6 864 163 8,3 5 683 980 16,2
June 2 907 642 12,2 1 240 790 17,7 870 883 -11,2 5 019 315 8,5
July 2 184 175 -16,5 1 074 311 -1,3 658 824 -22,2 3 917 310 -13,9
August 2 342 542 -17,0 1 124 862 -20,6 738 650 -9,0 4 206 054 -16,7
September 3 393 085 13,3 1 233 594 -24,9 915 272 8,7 5 541 951 1,1
October 2 829 760 6,2 861 094 -48,7 948 202 24,9 4 639 056 -9,1
November 2 784 573 -18,2 1 547 492 -20,7 957 575 11,0 5 289 640 -14,9
December 4 119 653 48,8 899 000 -37,3 796 641 5,2 5 815 294 17,2
Total 32 789 449 1,9 14 992 115 2,2 9 841 380 0,5 57 622 944 1,8 2017
January 2 148 700 -0,6 1 205 964 113,0 687 900 7,9 4 042 564 20,2
February 2 700 811 14,6 716 352 -27,5 759 495 -8,9 4 176 658 -0,1
March 3 234 647 34,1 2 222 577 28,4 1 002 593 19,4 6 459 817 29,6
April 3 341 500 52,0 751 055 -62,5 619 801 -20,6 4 712 356 -5,4
1/ The percentage change is the change in the value of buildings reported as completed to municipalities of the relevant year/month compared with the value of buildings reported as completed to municipalities of the comparable period of the previous year expressed as a percentage. 2/ Preliminary figures.

STATISTICS SOUTH AFRICA P5041.1
Selected building statistics of the private sector, April 2017
16
Table 8 – Seasonally adjusted value and percentage change of buildings reported as completed to larger municipalities at constant 2015 prices by type of building
Year and month Residential buildings Non-residential buildings 3/ Additions and alterations Total
R'000 % change 1/ R'000 % change 1/ R'000 % change 1/ R'000 % change 1/
2016 January 2 919 861 11,0 566 050 -60,5 802 356 -9,1 4 288 266 -13,3
February 2 622 780 -10,2 987 403 74,4 796 768 -0,7 4 406 951 2,8
March 2 501 330 -4,6 1 731 114 75,3 801 442 0,6 5 033 885 14,2
April 2 149 695 -14,1 2 005 245 15,8 715 000 -10,8 4 869 940 -3,3
May 3 165 758 47,3 1 721 160 -14,2 880 206 23,1 5 767 124 18,4
June 3 085 794 -2,5 1 240 790 -27,9 861 115 -2,2 5 187 699 -10,0
July 2 130 309 -31,0 1 074 311 -13,4 664 707 -22,8 3 869 326 -25,4
August 2 314 658 8,7 1 124 862 4,7 717 286 7,9 4 156 806 7,4
September 3 098 014 33,8 1 233 594 9,7 879 181 22,6 5 210 789 25,4
October 2 649 838 -14,5 861 094 -30,2 901 082 2,5 4 412 014 -15,3
November 2 318 464 -12,5 1 547 492 79,7 917 722 1,8 4 783 678 8,4
December 3 937 000 69,8 899 000 -41,9 920 382 0,3 5 756 382 20,3
2017 January 2 880 408 -26,8 1 205 964 34,1 859 502 -6,6 4 945 874 -14,1
February 3 022 320 4,9 716 352 -40,6 733 738 -14,6 4 472 410 -9,6
March 3 182 611 5,3 2 222 577 210,3 740 399 0,9 6 145 587 37,4
April 3 425 246 7,6 751 055 -66,2 746 666 0,8 4 922 968 -19,9
Nov. 16 – Jan. 17 9 135 872 3 652 456 2 697 606 15 485 934
Feb. – Apr. 17 2/ 9 630 177 5,4 3 689 984 1,0 2 220 803 -17,7 15 540 965 0,4
1/ The percentage change is the change in the seasonally adjusted value of buildings reported as completed to municipalities of the relevant month compared with the seasonally adjusted value of buildings reported as completed to municipalities of the previous month expressed as a percentage. 2/ The percentage change is the change in the seasonally adjusted value of buildings reported as completed to municipalities for the latest three months compared with the seasonally adjusted value of buildings reported as completed to municipalities of the previous three months expressed as a percentage. 3/ Not seasonally adjusted because the presence of seasonality is not significant. See notes 10 and 11 on page 38.
STATISTICS SOUTH AFRICA P5041.1
Selected building statistics of the private sector, April 2017
17
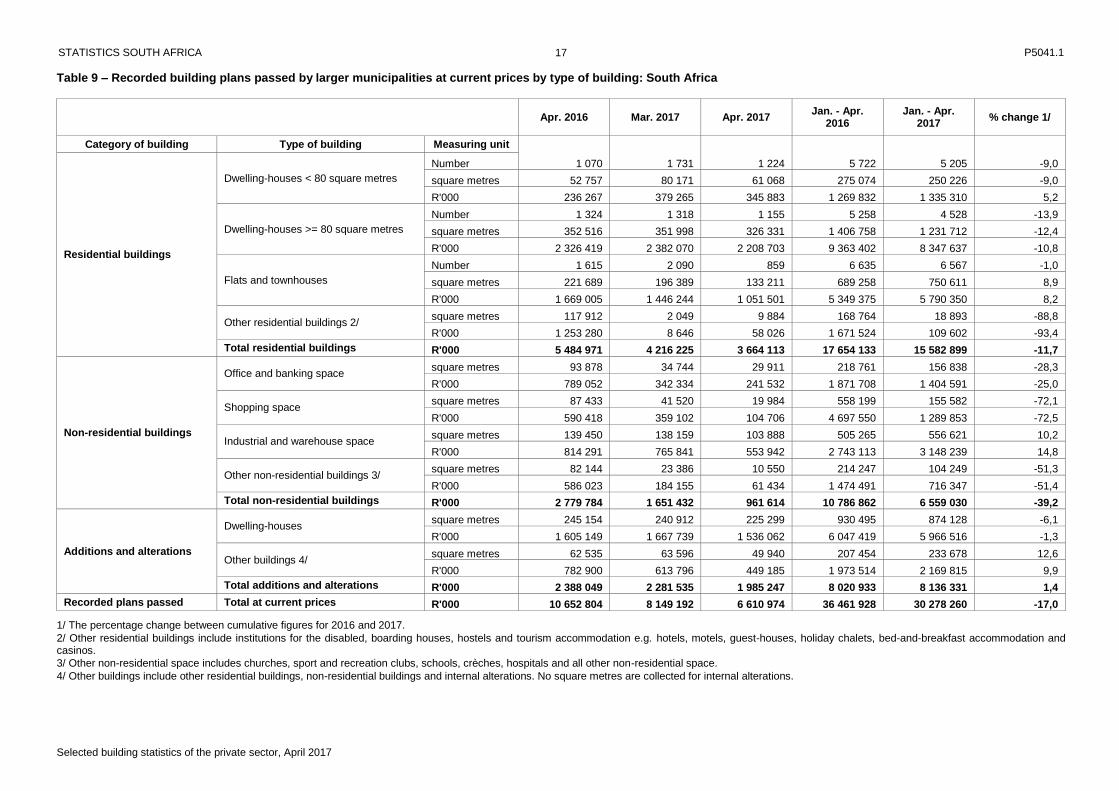
Table 9 – Recorded building plans passed by larger municipalities at current prices by type of building: South Africa
Apr. 2016 Mar. 2017 Apr. 2017 Jan. - Apr.
2016 Jan. - Apr.
2017 % change 1/
Category of building Type of building Measuring unit
1 070 1 731 1 224 5 722 5 205 -9,0
Residential buildings
Dwelling-houses < 80 square metres
Number
square metres 52 757 80 171 61 068 275 074 250 226 -9,0
R'000 236 267 379 265 345 883 1 269 832 1 335 310 5,2
Dwelling-houses >= 80 square metres
Number 1 324 1 318 1 155 5 258 4 528 -13,9
square metres 352 516 351 998 326 331 1 406 758 1 231 712 -12,4
R'000 2 326 419 2 382 070 2 208 703 9 363 402 8 347 637 -10,8
Flats and townhouses
Number 1 615 2 090 859 6 635 6 567 -1,0
square metres 221 689 196 389 133 211 689 258 750 611 8,9
R'000 1 669 005 1 446 244 1 051 501 5 349 375 5 790 350 8,2
Other residential buildings 2/ square metres 117 912 2 049 9 884 168 764 18 893 -88,8
R'000 1 253 280 8 646 58 026 1 671 524 109 602 -93,4
Total residential buildings R'000 5 484 971 4 216 225 3 664 113 17 654 133 15 582 899 -11,7
Non-residential buildings
Office and banking space square metres 93 878 34 744 29 911 218 761 156 838 -28,3
R'000 789 052 342 334 241 532 1 871 708 1 404 591 -25,0
Shopping space square metres 87 433 41 520 19 984 558 199 155 582 -72,1
R'000 590 418 359 102 104 706 4 697 550 1 289 853 -72,5
Industrial and warehouse space square metres 139 450 138 159 103 888 505 265 556 621 10,2
R'000 814 291 765 841 553 942 2 743 113 3 148 239 14,8
Other non-residential buildings 3/ square metres 82 144 23 386 10 550 214 247 104 249 -51,3
R'000 586 023 184 155 61 434 1 474 491 716 347 -51,4
Total non-residential buildings R'000 2 779 784 1 651 432 961 614 10 786 862 6 559 030 -39,2
Additions and alterations
Dwelling-houses square metres 245 154 240 912 225 299 930 495 874 128 -6,1
R'000 1 605 149 1 667 739 1 536 062 6 047 419 5 966 516 -1,3
Other buildings 4/ square metres 62 535 63 596 49 940 207 454 233 678 12,6
R'000 782 900 613 796 449 185 1 973 514 2 169 815 9,9
Total additions and alterations R'000 2 388 049 2 281 535 1 985 247 8 020 933 8 136 331 1,4
Recorded plans passed Total at current prices R'000 10 652 804 8 149 192 6 610 974 36 461 928 30 278 260 -17,0
1/ The percentage change between cumulative figures for 2016 and 2017.
2/ Other residential buildings include institutions for the disabled, boarding houses, hostels and tourism accommodation e.g. hotels, motels, guest-houses, holiday chalets, bed-and-breakfast accommodation and casinos.
3/ Other non-residential space includes churches, sport and recreation clubs, schools, crèches, hospitals and all other non-residential space.
4/ Other buildings include other residential buildings, non-residential buildings and internal alterations. No square metres are collected for internal alterations.
STATISTICS SOUTH AFRICA P5041.1
Selected building statistics of the private sector, April 2017
18
Table 10 – Recorded building plans passed by larger municipalities at current prices by type of building: Western Cape
Apr. 2016 Mar. 2017 Apr. 2017 Jan. - Apr.
2016 Jan. - Apr.
2017 % change 1/
Category of building Type of building Measuring unit
340 474 529 2 203 2 177 -1,2
Residential buildings
Dwelling-houses < 80 square metres
Number
square metres 15 681 22 774 25 554 100 762 102 143 1,4
R'000 94 313 135 125 155 143 559 103 617 295 10,4
Dwelling-houses >= 80 square metres
Number 370 527 372 1 451 1 542 6,3
square metres 96 764 118 353 88 442 359 579 358 586 -0,3
R'000 624 549 803 231 578 999 2 362 594 2 375 803 0,6
Flats and townhouses
Number 604 1 274 251 1 558 2 834 81,9
square metres 55 857 95 332 37 679 173 321 283 032 63,3
R'000 437 303 735 074 293 176 1 297 182 2 142 369 65,2
Other residential buildings 2/ square metres 12 352 0 328 30 151 3 702 -87,7
R'000 108 080 0 1 866 246 006 23 147 -90,6
Total residential buildings R'000 1 264 245 1 673 430 1 029 184 4 464 885 5 158 614 15,5
Non-residential buildings
Office and banking space square metres 12 723 8 447 1 099 21 669 54 332 150,7
R'000 107 184 73 871 9 137 176 316 466 100 164,4
Shopping space square metres 3 275 9 977 512 109 880 19 726 -82,0
R'000 25 785 86 517 3 840 900 125 160 999 -82,1
Industrial and warehouse space square metres 50 581 13 083 12 485 128 760 66 945 -48,0
R'000 342 205 87 185 81 767 873 453 445 733 -49,0
Other non-residential buildings 3/ square metres 22 909 3 200 3 692 54 306 14 280 -73,7
R'000 188 954 20 698 23 049 392 690 88 085 -77,6
Total non-residential buildings R'000 664 128 268 271 117 793 2 342 584 1 160 917 -50,4
Additions and alterations
Dwelling-houses square metres 66 136 76 018 59 835 247 814 247 374 -0,2
R'000 426 575 500 072 378 312 1 568 604 1 603 212 2,2
Other buildings 4/ square metres 16 491 19 723 13 720 44 910 63 191 40,7
R'000 240 019 218 470 141 232 579 627 670 640 15,7
Total additions and alterations R'000 666 594 718 542 519 544 2 148 231 2 273 852 5,8
Recorded plans passed Total at current prices R'000 2 594 967 2 660 243 1 666 521 8 955 700 8 593 383 -4,0
1/ The percentage change between cumulative figures for 2016 and 2017.
2/ Other residential buildings include institutions for the disabled, boarding houses, hostels and tourism accommodation e.g. hotels, motels, guest-houses, holiday chalets, bed-and-breakfast accommodation and casinos.
3/ Other non-residential space includes churches, sport and recreation clubs, schools, crèches, hospitals and all other non-residential space.
4/ Other buildings include other residential buildings, non-residential buildings and internal alterations. No square metres are collected for internal alterations.

STATISTICS SOUTH AFRICA P5041.1
Selected building statistics of the private sector, April 2017
19
Table 11 – Recorded building plans passed by larger municipalities at current prices by type of building: Eastern Cape
Apr. 2016 Mar. 2017 Apr. 2017
Jan. - Apr. 2016
Jan. - Apr. 2017
% change 1/
Category of building Type of building Measuring unit
30 468 207 245 1 015 314,3
Residential buildings
Dwelling-houses < 80 square metres
Number
square metres 1 521 20 783 9 192 12 623 45 065 257,0
R'000 6 219 92 306 51 985 62 681 212 403 238,9
Dwelling-houses >= 80 square metres
Number 82 95 57 295 275 -6,8
square metres 18 328 21 098 11 400 64 846 61 410 -5,3
R'000 119 354 120 914 61 393 391 617 352 976 -9,9
Flats and townhouses
Number 35 68 1 106 149 40,6
square metres 4 646 6 212 215 10 820 12 722 17,6
R'000 26 094 36 245 1 184 56 957 68 657 20,5
Other residential buildings 2/ square metres 0 1 550 4 384 148 6 066 3 998,6
R'000 0 6 200 29 282 962 36 010 3 643,2
Total residential buildings R'000 151 667 255 665 143 844 512 217 670 046 30,8
Non-residential buildings
Office and banking space square metres 263 0 7 097 544 7 250 1 232,7
R'000 1 184 0 37 859 2 501 38 669 1 446,1
Shopping space square metres 0 2 053 4 035 1 692 6 629 291,8
R'000 0 10 875 21 373 7 526 34 620 360,0
Industrial and warehouse space square metres 9 671 18 563 2 161 39 086 52 885 35,3
R'000 37 198 103 205 11 886 183 595 291 977 59,0
Other non-residential buildings 3/ square metres 3 759 1 139 33 7 247 3 038 -58,1
R'000 13 699 6 447 164 29 829 16 770 -43,8
Total non-residential buildings R'000 52 081 120 527 71 282 223 451 382 036 71,0
Additions and alterations
Dwelling-houses square metres 22 753 24 750 15 719 71 886 83 442 16,1
R'000 123 391 161 069 93 003 393 743 504 539 28,1
Other buildings 4/ square metres 8 353 12 680 1 182 17 892 18 050 0,9
R'000 37 978 68 075 6 523 76 267 106 967 40,3
Total additions and alterations R'000 161 369 229 144 99 526 470 010 611 506 30,1
Recorded plans passed Total at current prices R'000 365 117 605 336 314 652 1 205 678 1 663 588 38,0
1/ The percentage change between cumulative figures for 2016 and 2017.
2/ Other residential buildings include institutions for the disabled, boarding houses, hostels and tourism accommodation e.g. hotels, motels, guest-houses, holiday chalets, bed-and-breakfast accommodation and casinos.
3/ Other non-residential space includes churches, sport and recreation clubs, schools, crèches, hospitals and all other non-residential space.
4/ Other buildings include other residential buildings, non-residential buildings and internal alterations. No square metres are collected for internal alterations.
STATISTICS SOUTH AFRICA P5041.1
Selected building statistics of the private sector, April 2017
20
Table 12 – Recorded building plans passed by larger municipalities at current prices by type of building: Northern Cape
Apr. 2016 Mar. 2017 Apr. 2017
Jan. - Apr. 2016
Jan. - Apr. 2017
% change 1/
Category of building Type of building Measuring unit
5 0 3 8 8 0,0
Residential buildings
Dwelling-houses < 80 square metres
Number
square metres 350 0 200 580 453 -21,9
R'000 2 100 0 1 200 3 480 2 638 -24,2
Dwelling-houses >= 80 square metres
Number 21 11 6 64 50 -21,9
square metres 2 633 1 857 1 206 11 761 7 696 -34,6
R'000 17 342 11 706 7 288 74 530 49 627 -33,4
Flats and townhouses
Number 4 0 0 50 0 ..
square metres 455 0 0 5 781 0 ..
R'000 3 458 0 0 35 135 0 ..
Other residential buildings 2/ square metres 0 0 0 0 390 ..
R'000 0 0 0 0 2 535 ..
Total residential buildings R'000 22 900 11 706 8 488 113 145 54 800 -51,6
Non-residential buildings
Office and banking space square metres 0 0 0 8 843 0 ..
R'000 0 0 0 52 990 0 ..
Shopping space square metres 1 498 0 0 1 498 0 ..
R'000 7 146 0 0 7 146 0 ..
Industrial and warehouse space square metres 342 0 0 5 772 2 205 -61,8
R'000 2 052 0 0 34 720 14 333 -58,7
Other non-residential buildings 3/ square metres 0 0 0 943 658 -30,2
R'000 0 0 0 5 308 4 278 -19,4
Total non-residential buildings R'000 9 198 0 0 100 164 18 611 -81,4
Additions and alterations
Dwelling-houses square metres 4 501 963 1 659 16 312 6 539 -59,9
R'000 31 814 5 915 10 231 110 207 42 984 -61,0
Other buildings 4/ square metres 1 068 0 72 1 179 453 -61,6
R'000 9 178 0 848 13 474 3 785 -71,9
Total additions and alterations R'000 40 992 5 915 11 079 123 681 46 769 -62,2
Recorded plans passed Total at current prices R'000 73 090 17 621 19 567 336 990 120 180 -64,3
1/ The percentage change between cumulative figures for 2016 and 2017.
2/ Other residential buildings include institutions for the disabled, boarding houses, hostels and tourism accommodation e.g. hotels, motels, guest-houses, holiday chalets, bed-and-breakfast accommodation and casinos.
3/ Other non-residential space includes churches, sport and recreation clubs, schools, crèches, hospitals and all other non-residential space.
4/ Other buildings include other residential buildings, non-residential buildings and internal alterations. No square metres are collected for internal alterations.
STATISTICS SOUTH AFRICA P5041.1
Selected building statistics of the private sector, April 2017
21
Table 13 – Recorded building plans passed by larger municipalities at current prices by type of building: Free State
Apr. 2016 Mar. 2017 Apr. 2017
Jan. - Apr. 2016
Jan. - Apr. 2017
% change 1/
Category of building Type of building Measuring unit
13 6 3 129 45 -65,1
Residential buildings
Dwelling-houses < 80 square metres
Number
square metres 702 368 201 7 326 2 516 -65,7
R'000 3 695 2 006 1 166 33 914 14 336 -57,7
Dwelling-houses >= 80 square metres
Number 58 51 69 256 237 -7,4
square metres 11 998 12 433 14 770 60 545 49 957 -17,5
R'000 62 350 67 272 82 387 323 722 273 515 -15,5
Flats and townhouses
Number 104 187 35 229 336 46,7
square metres 15 450 23 834 5 060 29 803 47 378 59,0
R'000 102 952 162 944 35 420 199 905 324 969 62,6
Other residential buildings 2/ square metres 0 499 599 3 851 1 098 -71,5
R'000 0 2 446 3 242 26 357 5 688 -78,4
Total residential buildings R'000 168 997 234 668 122 215 583 898 618 508 5,9
Non-residential buildings
Office and banking space square metres 2 602 0 156 12 831 343 -97,3
R'000 20 816 0 1 248 101 704 2 744 -97,3
Shopping space square metres 816 1 915 487 4 125 5 633 36,6
R'000 3 672 12 860 2 192 23 906 30 840 29,0
Industrial and warehouse space square metres 400 0 3 651 18 695 19 679 5,3
R'000 1 800 0 17 525 84 129 94 120 11,9
Other non-residential buildings 3/ square metres 108 564 1 444 5 802 2 555 -56,0
R'000 864 4 000 8 375 41 099 14 837 -63,9
Total non-residential buildings R'000 27 152 16 860 29 340 250 838 142 541 -43,2
Additions and alterations
Dwelling-houses square metres 11 521 10 739 15 621 50 675 48 962 -3,4
R'000 59 484 56 206 83 442 261 680 259 761 -0,7
Other buildings 4/ square metres 1 586 1 985 9 260 4 523 13 278 193,6
R'000 51 602 21 585 64 681 85 585 158 567 85,3
Total additions and alterations R'000 111 086 77 791 148 123 347 265 418 328 20,5
Recorded plans passed Total at current prices R'000 307 235 329 319 299 678 1 182 001 1 179 377 -0,2
1/ The percentage change between cumulative figures for 2016 and 2017.
2/ Other residential buildings include institutions for the disabled, boarding houses, hostels and tourism accommodation e.g. hotels, motels, guest-houses, holiday chalets, bed-and-breakfast accommodation and casinos.
3/ Other non-residential space includes churches, sport and recreation clubs, schools, crèches, hospitals and all other non-residential space.
4/ Other buildings include other residential buildings, non-residential buildings and internal alterations. No square metres are collected for internal alterations.
STATISTICS SOUTH AFRICA P5041.1
Selected building statistics of the private sector, April 2017
22
Table 14 – Recorded building plans passed by larger municipalities at current prices by type of building: KwaZulu-Natal
Apr. 2016 Mar. 2017 Apr. 2017
Jan. - Apr. 2016
Jan. - Apr. 2017
% change 1/
Category of building Type of building Measuring unit
35 7 13 106 58 -45,3
Residential buildings
Dwelling-houses < 80 square metres
Number
square metres 2 021 407 781 5 924 3 483 -41,2
R'000 11 700 3 511 6 307 43 049 25 502 -40,8
Dwelling-houses >= 80 square metres
Number 129 116 82 470 413 -12,1
square metres 38 440 36 305 22 004 150 119 121 007 -19,4
R'000 325 642 329 388 202 948 1 292 625 1 107 930 -14,3
Flats and townhouses
Number 250 200 168 1 063 814 -23,4
square metres 38 073 21 866 35 808 113 199 123 886 9,4
R'000 351 495 195 968 320 267 1 032 287 1 194 682 15,7
Other residential buildings 2/ square metres 666 0 1 057 15 010 3 192 -78,7
R'000 3 996 0 6 342 147 813 20 747 -86,0
Total residential buildings R'000 692 833 528 867 535 864 2 515 774 2 348 861 -6,6
Non-residential buildings
Office and banking space square metres 40 771 2 426 12 116 68 075 22 210 -67,4
R'000 397 476 24 988 127 218 654 825 207 335 -68,3
Shopping space square metres 41 617 12 294 1 940 253 545 66 369 -73,8
R'000 280 123 125 574 11 640 2 382 137 663 743 -72,1
Industrial and warehouse space square metres 18 258 26 896 13 526 49 486 72 389 46,3
R'000 100 141 152 467 77 098 254 215 430 279 69,3
Other non-residential buildings 3/ square metres 21 419 8 328 449 47 358 19 899 -58,0
R'000 134 059 78 927 3 143 322 217 149 463 -53,6
Total non-residential buildings R'000 911 799 381 956 219 099 3 613 394 1 450 820 -59,8
Additions and alterations
Dwelling-houses square metres 30 748 32 329 25 854 111 486 112 908 1,3
R'000 266 918 311 822 241 887 945 198 1 068 119 13,0
Other buildings 4/ square metres 8 042 13 624 11 090 71 208 59 639 -16,2
R'000 164 704 175 369 118 722 670 773 656 536 -2,1
Total additions and alterations R'000 431 622 487 191 360 609 1 615 971 1 724 655 6,7
Recorded plans passed Total at current prices R'000 2 036 254 1 398 014 1 115 572 7 745 139 5 524 336 -28,7
1/ The percentage change between cumulative figures for 2016 and 2017.
2/ Other residential buildings include institutions for the disabled, boarding houses, hostels and tourism accommodation e.g. hotels, motels, guest-houses, holiday chalets, bed-and-breakfast accommodation and casinos.
3/ Other non-residential space includes churches, sport and recreation clubs, schools, crèches, hospitals and all other non-residential space.
4/ Other buildings include other residential buildings, non-residential buildings and internal alterations. No square metres are collected for internal alterations.
STATISTICS SOUTH AFRICA P5041.1
Selected building statistics of the private sector, April 2017
23
Table 15 – Recorded building plans passed by larger municipalities at current prices by type of building: North West
Apr. 2016 Mar. 2017 Apr. 2017
Jan. - Apr. 2016
Jan. - Apr. 2017
% change 1/
Category of building Type of building Measuring unit
5 4 2 25 22 -12,0
Residential buildings
Dwelling-houses < 80 square metres
Number
square metres 326 249 136 1 648 1 366 -17,1
R'000 1 461 1 234 612 8 037 6 226 -22,5
Dwelling-houses >= 80 square metres
Number 92 59 71 303 259 -14,5
square metres 23 922 13 996 20 073 78 161 69 295 -11,3
R'000 125 787 69 208 107 148 396 752 364 883 -8,0
Flats and townhouses
Number 75 76 136 396 1 016 156,6
square metres 18 169 13 804 11 156 39 536 106 708 169,9
R'000 92 832 77 731 62 697 202 783 634 684 213,0
Other residential buildings 2/ square metres 0 0 0 718 0 ..
R'000 0 0 0 5 026 0 ..
Total residential buildings R'000 220 080 148 173 170 457 612 598 1 005 793 64,2
Non-residential buildings
Office and banking space square metres 0 144 0 1 180 873 -26,0
R'000 0 720 0 5 900 5 607 -5,0
Shopping space square metres 16 179 0 0 19 004 2 944 -84,5
R'000 91 887 0 0 104 601 16 072 -84,6
Industrial and warehouse space square metres 3 141 0 2 592 8 695 5 288 -39,2
R'000 18 846 0 13 735 46 476 24 830 -46,6
Other non-residential buildings 3/ square metres 629 342 201 5 027 826 -83,6
R'000 2 773 1 539 905 25 189 3 718 -85,2
Total non-residential buildings R'000 113 506 2 259 14 640 182 166 50 227 -72,4
Additions and alterations
Dwelling-houses square metres 11 782 12 214 7 874 45 010 36 717 -18,4
R'000 50 299 58 724 43 016 210 668 182 750 -13,3
Other buildings 4/ square metres 3 106 1 100 1 272 7 206 5 695 -21,0
R'000 25 137 9 638 6 920 46 923 38 344 -18,3
Total additions and alterations R'000 75 436 68 362 49 936 257 591 221 094 -14,2
Recorded plans passed Total at current prices R'000 409 022 218 794 235 033 1 052 355 1 277 114 21,4
1/ The percentage change between cumulative figures for 2016 and 2017.
2/ Other residential buildings include institutions for the disabled, boarding houses, hostels and tourism accommodation e.g. hotels, motels, guest-houses, holiday chalets, bed-and-breakfast accommodation and casinos.
3/ Other non-residential space includes churches, sport and recreation clubs, schools, crèches, hospitals and all other non-residential space.
4/ Other buildings include other residential buildings, non-residential buildings and internal alterations. No square metres are collected for internal alterations.
STATISTICS SOUTH AFRICA P5041.1
Selected building statistics of the private sector, April 2017
24
Table 16 – Recorded building plans passed by larger municipalities at current prices by type of building: Gauteng
Apr. 2016 Mar. 2017 Apr. 2017
Jan. - Apr. 2016
Jan. - Apr. 2017
% change 1/
Category of building Type of building Measuring unit
584 641 315 2 405 1 451 -39,7
Residential buildings
Dwelling-houses < 80 square metres
Number
square metres 28 719 29 286 16 569 115 379 72 665 -37,0
R'000 101 035 114 421 85 298 430 070 347 853 -19,1
Dwelling-houses >= 80 square metres
Number 403 315 370 1 740 1 253 -28,0
square metres 121 991 106 100 133 279 526 124 427 794 -18,7
R'000 857 250 779 768 995 961 3 738 425 3 145 113 -15,9
Flats and townhouses
Number 539 276 256 3 167 1 317 -58,4
square metres 88 807 34 746 42 851 309 804 166 886 -46,1
R'000 653 789 235 307 336 768 2 493 256 1 376 074 -44,8
Other residential buildings 2/ square metres 101 372 0 2 943 114 070 2 943 -97,4
R'000 1 125 128 0 14 715 1 223 460 14 715 -98,8
Total residential buildings R'000 2 737 202 1 129 496 1 432 742 7 885 211 4 883 755 -38,1
Non-residential buildings
Office and banking space square metres 21 561 21 659 4 105 77 896 59 203 -24,0
R'000 186 106 233 017 39 424 726 719 623 397 -14,2
Shopping space square metres 18 951 15 069 1 892 149 693 37 156 -75,2
R'000 156 313 122 322 12 629 1 176 522 302 312 -74,3
Industrial and warehouse space square metres 43 203 76 521 66 432 223 607 325 529 45,6
R'000 243 656 408 389 336 977 1 119 196 1 791 916 60,1
Other non-residential buildings 3/ square metres 32 268 8 985 3 168 81 943 38 974 -52,4
R'000 238 361 68 820 18 743 602 933 301 492 -50,0
Total non-residential buildings R'000 824 436 832 548 407 773 3 625 370 3 019 117 -16,7
Additions and alterations
Dwelling-houses square metres 80 759 68 720 87 018 315 802 281 090 -11,0
R'000 567 728 503 003 634 584 2 223 256 2 041 123 -8,2
Other buildings 4/ square metres 21 744 12 697 12 547 52 438 68 304 30,3
R'000 233 198 93 747 101 553 435 449 477 151 9,6
Total additions and alterations R'000 800 926 596 750 736 137 2 658 705 2 518 274 -5,3
Recorded plans passed Total at current prices R'000 4 362 564 2 558 794 2 576 652 14 169 286 10 421 146 -26,5
1/ The percentage change between cumulative figures for 2016 and 2017.
2/ Other residential buildings include institutions for the disabled, boarding houses, hostels and tourism accommodation e.g. hotels, motels, guest-houses, holiday chalets, bed-and-breakfast accommodation and casinos.
3/ Other non-residential space includes churches, sport and recreation clubs, schools, crèches, hospitals and all other non-residential space.
4/ Other buildings include other residential buildings, non-residential buildings and internal alterations. No square metres are collected for internal alterations.

STATISTICS SOUTH AFRICA P5041.1
Selected building statistics of the private sector, April 2017
25
Table 17 – Recorded building plans passed by larger municipalities at current prices by type of building: Mpumalanga
Apr. 2016 Mar. 2017 Apr. 2017
Jan. - Apr. 2016
Jan. - Apr. 2017
% change 1/
Category of building Type of building Measuring unit
48 112 90 522 328 -37,2
Residential buildings
Dwelling-houses < 80 square metres
Number
square metres 2 844 5 160 4 503 26 231 16 164 -38,4
R'000 12 867 23 725 18 502 106 680 69 959 -34,4
Dwelling-houses >= 80 square metres
Number 122 97 97 487 316 -35,1
square metres 24 981 26 498 24 782 103 259 84 027 -18,6
R'000 126 983 124 584 119 740 527 122 414 427 -21,4
Flats and townhouses
Number 3 0 12 42 50 19,0
square metres 152 0 442 4 616 3 953 -14,4
R'000 682 0 1 989 20 772 17 923 -13,7
Other residential buildings 2/ square metres 3 522 0 573 4 816 1 502 -68,8
R'000 16 076 0 2 579 21 900 6 760 -69,1
Total residential buildings R'000 156 608 148 309 142 810 676 474 509 069 -24,7
Non-residential buildings
Office and banking space square metres 15 318 1 204 109 26 627 3 023 -88,6
R'000 73 853 5 418 501 146 040 13 718 -90,6
Shopping space square metres 2 616 212 5 254 16 281 10 147 -37,7
R'000 13 083 954 23 643 83 178 46 085 -44,6
Industrial and warehouse space square metres 12 604 1 365 627 25 423 5 403 -78,7
R'000 62 768 6 658 2 884 120 064 25 232 -79,0
Other non-residential buildings 3/ square metres 1 052 828 1 563 10 093 9 755 -3,3
R'000 7 313 3 724 7 055 48 607 44 334 -8,8
Total non-residential buildings R'000 157 017 16 754 34 083 397 889 129 369 -67,5
Additions and alterations
Dwelling-houses square metres 10 889 10 151 9 053 52 582 38 811 -26,2
R'000 48 750 46 545 38 387 241 575 173 865 -28,0
Other buildings 4/ square metres 1 060 969 42 3 803 2 847 -25,1
R'000 15 114 23 027 4 609 41 458 40 342 -2,7
Total additions and alterations R'000 63 864 69 572 42 996 283 033 214 207 -24,3
Recorded plans passed Total at current prices R'000 377 489 234 635 219 889 1 357 396 852 645 -37,2
1/ The percentage change between cumulative figures for 2016 and 2017.
2/ Other residential buildings include institutions for the disabled, boarding houses, hostels and tourism accommodation e.g. hotels, motels, guest-houses, holiday chalets, bed-and-breakfast accommodation and casinos.
3/ Other non-residential space includes churches, sport and recreation clubs, schools, crèches, hospitals and all other non-residential space.
4/ Other buildings include other residential buildings, non-residential buildings and internal alterations. No square metres are collected for internal alterations.

STATISTICS SOUTH AFRICA P5041.1
Selected building statistics of the private sector, April 2017
26
Table 18 – Recorded building plans passed by larger municipalities at current prices by type of building: Limpopo
Apr. 2016 Mar. 2017 Apr. 2017
Jan. - Apr. 2016
Jan. - Apr. 2017
% change 1/
Category of building Type of building Measuring unit
10 19 62 79 101 27,8
Residential buildings
Dwelling-houses < 80 square metres
Number
square metres 593 1 144 3 932 4 601 6 371 38,5
R'000 2 877 6 937 25 670 22 818 39 098 71,3
Dwelling-houses >= 80 square metres
Number 47 47 31 192 183 -4,7
square metres 13 459 15 358 10 375 52 364 51 940 -0,8
R'000 67 162 75 999 52 839 256 015 263 363 2,9
Flats and townhouses
Number 1 9 0 24 51 112,5
square metres 80 595 0 2 378 6 046 154,2
R'000 400 2 975 0 11 098 30 992 179,3
Other residential buildings 2/ square metres 0 0 0 0 0 ..
R'000 0 0 0 0 0 ..
Total residential buildings R'000 70 439 85 911 78 509 289 931 333 453 15,0
Non-residential buildings
Office and banking space square metres 640 864 5 229 1 096 9 604 776,3
R'000 2 433 4 320 26 145 4 713 47 021 897,7
Shopping space square metres 2 481 0 5 864 2 481 6 978 181,3
R'000 12 409 0 29 389 12 409 35 182 183,5
Industrial and warehouse space square metres 1 250 1 731 2 414 5 741 6 298 9,7
R'000 5 625 7 937 12 070 27 265 29 819 9,4
Other non-residential buildings 3/ square metres 0 0 0 1 528 14 264 833,5
R'000 0 0 0 6 619 93 370 1 310,6
Total non-residential buildings R'000 20 467 12 257 67 604 51 006 205 392 302,7
Additions and alterations
Dwelling-houses square metres 6 065 5 028 2 666 18 928 18 285 -3,4
R'000 30 190 24 383 13 200 92 488 90 163 -2,5
Other buildings 4/ square metres 1 085 818 755 4 295 2 221 -48,3
R'000 5 970 3 885 4 097 23 958 17 483 -27,0
Total additions and alterations R'000 36 160 28 268 17 297 116 446 107 646 -7,6
Recorded plans passed Total at current prices R'000 127 066 126 436 163 410 457 383 646 491 41,3
1/ The percentage change between cumulative figures for 2016 and 2017.
2/ Other residential buildings include institutions for the disabled, boarding houses, hostels and tourism accommodation e.g. hotels, motels, guest-houses, holiday chalets, bed-and-breakfast accommodation and casinos.
3/ Other non-residential space includes churches, sport and recreation clubs, schools, crèches, hospitals and all other non-residential space.
4/ Other buildings include other residential buildings, non-residential buildings and internal alterations. No square metres are collected for internal alterations.

STATISTICS SOUTH AFRICA P5041.1
Selected building statistics of the private sector, April 2017
27
Table 19 – Buildings reported as completed to larger municipalities at current prices by type of building: South Africa
Apr. 2016 Mar. 2017 Apr. 2017
Jan. - Apr. 2016
Jan. - Apr. 2017
% change 1/
Category of building Type of building Measuring unit
1 266 1 516 1 541 4 360 4 940 13,3
Residential buildings
Dwelling-houses < 80 square metres
Number
square metres 59 903 73 397 72 753 208 669 235 480 12,8
R'000 248 095 382 421 295 052 869 369 1 106 553 27,3
Dwelling-houses >= 80 square metres
Number 1 054 924 713 3 722 2 961 -20,4
square metres 242 859 243 452 188 673 901 274 817 952 -9,2
R'000 1 596 564 1 687 848 1 298 072 5 859 379 5 777 246 -1,4
Flats and townhouses
Number 595 2 251 1 066 4 100 5 623 37,1
square metres 66 269 184 962 107 775 369 650 517 840 40,1
R'000 472 187 1 523 424 865 630 2 712 202 4 150 311 53,0
Other residential buildings 2/ square metres 0 0 113 841 11 055 159 688 1 344,5
R'000 0 0 1 260 335 67 016 1 630 444 2 332,9
Total residential buildings R'000 2 316 846 3 593 693 3 719 089 9 507 966 12 664 554 33,2
Non-residential buildings
Office and banking space square metres 46 408 108 834 25 415 216 274 227 445 5,2
R'000 425 938 874 777 246 018 1 688 053 2 068 366 22,5
Shopping space square metres 146 481 130 690 30 870 195 070 184 530 -5,4
R'000 1 310 549 1 180 992 188 480 1 678 293 1 519 661 -9,5
Industrial and warehouse space square metres 33 244 63 721 44 332 266 210 256 452 -3,7
R'000 158 558 347 198 254 836 1 412 818 1 438 857 1,8
Other non-residential buildings 3/ square metres 29 660 9 463 15 982 117 818 52 902 -55,1
R'000 218 483 66 316 146 590 753 473 396 190 -47,4
Total non-residential buildings R'000 2 113 528 2 469 283 835 924 5 532 637 5 423 074 -2,0
Additions and alterations
Dwelling-houses square metres 101 496 119 704 84 015 385 635 370 971 -3,8
R'000 619 114 722 543 504 353 2 239 681 2 268 428 1,3
Other buildings 4/ square metres 20 277 47 300 21 123 113 579 121 382 6,9
R'000 203 275 391 338 185 486 982 128 1 132 127 15,3
Total additions and alterations R'000 822 389 1 113 881 689 839 3 221 809 3 400 555 5,5
Recorded buildings completed Total at current prices R'000 5 252 763 7 176 857 5 244 852 18 262 412 21 488 183 17,7
1/ The percentage change between cumulative figures for 2016 and 2017.
2/ Other residential buildings include institutions for the disabled, boarding houses, hostels and tourism accommodation e.g. hotels, motels, guest-houses, holiday chalets, bed-and-breakfast accommodation and casinos.
3/ Other non-residential space includes churches, sport and recreation clubs, schools, crèches, hospitals and all other non-residential space.
4/ Other buildings include other residential buildings, non-residential buildings and internal alterations. No square metres are collected for internal alterations.
STATISTICS SOUTH AFRICA P5041.1
Selected building statistics of the private sector, April 2017
28
Table 20 – Buildings reported as completed to larger municipalities at current prices by type of building: Western Cape
Apr. 2016 Mar. 2017 Apr. 2017
Jan. - Apr. 2016
Jan. - Apr. 2017
% change 1/
Category of building Type of building Measuring unit
456 723 339 1 209 2 144 77,3
Residential buildings
Dwelling-houses < 80 square metres
Number
square metres 20 838 32 623 15 534 54 879 96 864 76,5
R'000 108 620 183 700 81 880 284 431 512 562 80,2
Dwelling-houses >= 80 square metres
Number 315 331 239 998 952 -4,6
square metres 67 438 73 726 54 153 230 393 218 035 -5,4
R'000 425 930 482 074 349 285 1 428 782 1 409 237 -1,4
Flats and townhouses
Number 88 248 163 636 1 092 71,7
square metres 11 405 33 069 20 906 71 646 124 919 74,4
R'000 88 708 243 889 159 588 541 342 938 161 73,3
Other residential buildings 2/ square metres 0 0 218 1 069 17 118 1 501,3
R'000 0 0 1 456 9 338 135 978 1 356,2
Total residential buildings R'000 623 258 909 663 592 209 2 263 893 2 995 938 32,3
Non-residential buildings
Office and banking space square metres 1 501 73 094 1 175 50 821 83 468 64,2
R'000 9 395 525 490 7 867 313 091 598 516 91,2
Shopping space square metres 6 204 1 135 3 892 13 405 9 772 -27,1
R'000 46 223 8 404 26 914 102 112 66 466 -34,9
Industrial and warehouse space square metres 4 736 20 239 22 719 50 785 69 125 36,1
R'000 24 877 146 534 142 534 328 369 457 631 39,4
Other non-residential buildings 3/ square metres 26 261 3 843 5 071 45 673 18 099 -60,4
R'000 198 768 22 053 41 826 316 818 120 376 -62,0
Total non-residential buildings R'000 279 263 702 481 219 141 1 060 390 1 242 989 17,2
Additions and alterations
Dwelling-houses square metres 39 332 60 459 34 572 149 270 179 684 20,4
R'000 203 471 321 718 200 457 754 384 981 987 30,2
Other buildings 4/ square metres 11 583 12 856 8 429 42 823 38 527 -10,0
R'000 109 305 134 834 79 515 423 829 437 644 3,3
Total additions and alterations R'000 312 776 456 552 279 972 1 178 213 1 419 631 20,5
Recorded buildings completed Total at current prices R'000 1 215 297 2 068 696 1 091 322 4 502 496 5 658 558 25,7
1/ The percentage change between cumulative figures for 2016 and 2017.
2/ Other residential buildings include institutions for the disabled, boarding houses, hostels and tourism accommodation e.g. hotels, motels, guest-houses, holiday chalets, bed-and-breakfast accommodation and casinos.
3/ Other non-residential space includes churches, sport and recreation clubs, schools, crèches, hospitals and all other non-residential space.
4/ Other buildings include other residential buildings, non-residential buildings and internal alterations. No square metres are collected for internal alterations.
STATISTICS SOUTH AFRICA P5041.1
Selected building statistics of the private sector, April 2017
29
Table 21 – Buildings reported as completed to larger municipalities at current prices by type of building: Eastern Cape
Apr. 2016 Mar. 2017 Apr. 2017
Jan. - Apr. 2016
Jan. - Apr. 2017
% change 1/
Category of building Type of building Measuring unit
75 22 34 163 77 -52,8
Residential buildings
Dwelling-houses < 80 square metres
Number
square metres 3 248 1 461 1 856 8 698 4 472 -48,6
R'000 9 633 8 334 10 590 39 072 24 693 -36,8
Dwelling-houses >= 80 square metres
Number 22 44 39 108 164 51,9
square metres 4 282 11 566 6 577 22 502 37 478 66,6
R'000 22 670 61 064 35 438 120 005 194 539 62,1
Flats and townhouses
Number 128 39 1 210 53 -74,8
square metres 9 747 3 240 215 18 865 4 491 -76,2
R'000 55 087 19 653 1 184 104 723 26 753 -74,5
Other residential buildings 2/ square metres 0 0 0 1 059 3 139 196,4
R'000 0 0 0 6 884 17 775 158,2
Total residential buildings R'000 87 390 89 051 47 212 270 684 263 760 -2,6
Non-residential buildings
Office and banking space square metres 136 0 0 136 3 023 2 122,8
R'000 802 0 0 802 13 483 1 581,2
Shopping space square metres 0 0 0 450 1 158 157,3
R'000 0 0 0 2 558 5 722 123,7
Industrial and warehouse space square metres 1 186 2 459 0 3 723 6 239 67,6
R'000 5 012 12 280 0 15 764 30 971 96,5
Other non-residential buildings 3/ square metres 51 873 164 51 1 163 2 180,4
R'000 230 4 365 1 018 230 6 166 2 580,9
Total non-residential buildings R'000 6 044 16 645 1 018 19 354 56 342 191,1
Additions and alterations
Dwelling-houses square metres 3 826 7 363 8 141 16 880 27 953 65,6
R'000 14 236 36 685 37 770 72 534 133 338 83,8
Other buildings 4/ square metres 719 11 753 474 8 454 12 890 52,5
R'000 3 037 69 903 3 987 38 051 78 438 106,1
Total additions and alterations R'000 17 273 106 588 41 757 110 585 211 776 91,5
Recorded buildings completed Total at current prices R'000 110 707 212 284 89 987 400 623 531 878 32,8
1/ The percentage change between cumulative figures for 2016 and 2017.
2/ Other residential buildings include institutions for the disabled, boarding houses, hostels and tourism accommodation e.g. hotels, motels, guest-houses, holiday chalets, bed-and-breakfast accommodation and casinos.
3/ Other non-residential space includes churches, sport and recreation clubs, schools, crèches, hospitals and all other non-residential space.
4/ Other buildings include other residential buildings, non-residential buildings and internal alterations. No square metres are collected for internal alterations.

STATISTICS SOUTH AFRICA P5041.1
Selected building statistics of the private sector, April 2017
30
Table 22 – Buildings reported as completed to larger municipalities at current prices by type of building: Northern Cape
Apr. 2016 Mar. 2017 Apr. 2017
Jan. - Apr. 2016
Jan. - Apr. 2017
% change 1/
Category of building Type of building Measuring unit
0 0 1 0 1 ..
Residential buildings
Dwelling-houses < 80 square metres
Number
square metres 0 0 76 0 76 ..
R'000 0 0 456 0 456 ..
Dwelling-houses >= 80 square metres
Number 8 2 3 19 19 0,0
square metres 1 821 196 695 3 928 3 937 0,2
R'000 9 870 1 274 4 347 23 260 27 000 16,1
Flats and townhouses
Number 0 0 13 1 15 1 400,0
square metres 0 0 1 162 149 1 333 794,6
R'000 0 0 7 553 1 028 8 665 742,9
Other residential buildings 2/ square metres 0 0 0 158 935 491,8
R'000 0 0 0 948 5 512 481,4
Total residential buildings R'000 9 870 1 274 12 356 25 236 41 633 65,0
Non-residential buildings
Office and banking space square metres 0 0 1 440 0 1 440 ..
R'000 0 0 7 920 0 7 920 ..
Shopping space square metres 0 0 0 0 120 ..
R'000 0 0 0 0 720 ..
Industrial and warehouse space square metres 0 0 0 0 0 ..
R'000 0 0 0 0 0 ..
Other non-residential buildings 3/ square metres 0 0 0 0 0 ..
R'000 0 0 0 0 0 …
Total non-residential buildings R'000 0 0 7 920 0 8 640 ..
Additions and alterations
Dwelling-houses square metres 4 003 132 1 337 13 865 3 400 -75,5
R'000 29 158 858 9 648 99 716 26 304 -73,6
Other buildings 4/ square metres 579 0 951 1 051 2 518 139,6
R'000 4 400 0 5 968 9 827 19 737 100,8
Total additions and alterations R'000 33 558 858 15 616 109 543 46 041 -58,0
Recorded buildings completed Total at current prices R'000 43 428 2 132 35 892 134 779 96 314 -28,5
1/ The percentage change between cumulative figures for 2016 and 2017.
2/ Other residential buildings include institutions for the disabled, boarding houses, hostels and tourism accommodation e.g. hotels, motels, guest-houses, holiday chalets, bed-and-breakfast accommodation and casinos.
3/ Other non-residential space includes churches, sport and recreation clubs, schools, crèches, hospitals and all other non-residential space.
4/ Other buildings include other residential buildings, non-residential buildings and internal alterations. No square metres are collected for internal alterations.

STATISTICS SOUTH AFRICA P5041.1
Selected building statistics of the private sector, April 2017
31
Table 23 – Buildings reported as completed to larger municipalities at current prices by type of building: Free State
Apr. 2016 Mar. 2017 Apr. 2017
Jan. - Apr. 2016
Jan. - Apr. 2017
% change 1/
Category of building Type of building Measuring unit
33 11 1 50 58 16,0
Residential buildings
Dwelling-houses < 80 square metres
Number
square metres 1 757 505 61 2 805 3 283 17,0
R'000 4 693 1 613 152 9 779 16 561 69,4
Dwelling-houses >= 80 square metres
Number 34 30 13 102 55 -46,1
square metres 6 918 4 157 2 593 18 772 8 842 -52,9
R'000 35 358 21 431 14 486 91 672 47 518 -48,2
Flats and townhouses
Number 0 361 3 881 364 -58,7
square metres 0 27 104 360 35 468 27 464 -22,6
R'000 0 189 728 2 160 160 516 191 888 19,5
Other residential buildings 2/ square metres 0 0 0 105 0 ..
R'000 0 0 0 525 0 ..
Total residential buildings R'000 40 051 212 772 16 798 262 492 255 967 -2,5
Non-residential buildings
Office and banking space square metres 6 066 1 238 1 335 6 066 2 573 -57,6
R'000 42 462 8 666 8 983 42 462 17 649 -58,4
Shopping space square metres 7 996 0 0 11 587 786 -93,2
R'000 63 148 0 0 88 285 3 990 -95,5
Industrial and warehouse space square metres 0 110 0 10 964 1 340 -87,8
R'000 0 550 0 49 339 7 315 -85,2
Other non-residential buildings 3/ square metres 0 0 0 0 0 ..
R'000 0 0 0 0 0 ..
Total non-residential buildings R'000 105 610 9 216 8 983 180 086 28 954 -83,9
Additions and alterations
Dwelling-houses square metres 1 593 975 4 412 10 681 6 699 -37,3
R'000 7 347 4 388 19 854 48 393 30 664 -36,6
Other buildings 4/ square metres 72 151 269 1 301 552 -57,6
R'000 1 425 1 750 1 984 15 582 9 550 -38,7
Total additions and alterations R'000 8 772 6 138 21 838 63 975 40 214 -37,1
Recorded buildings completed Total at current prices R'000 154 433 228 126 47 619 506 553 325 135 -35,8
1/ The percentage change between cumulative figures for 2016 and 2017.
2/ Other residential buildings include institutions for the disabled, boarding houses, hostels and tourism accommodation e.g. hotels, motels, guest-houses, holiday chalets, bed-and-breakfast accommodation and casinos.
3/ Other non-residential space includes churches, sport and recreation clubs, schools, crèches, hospitals and all other non-residential space.
4/ Other buildings include other residential buildings, non-residential buildings and internal alterations. No square metres are collected for internal alterations.

STATISTICS SOUTH AFRICA P5041.1
Selected building statistics of the private sector, April 2017
32
Table 24 – Buildings reported as completed to larger municipalities at current prices by type of building: KwaZulu-Natal
Apr. 2016 Mar. 2017 Apr. 2017
Jan. - Apr. 2016
Jan. - Apr. 2017
% change 1/
Category of building Type of building Measuring unit
21 18 8 73 35 -52,1
Residential buildings
Dwelling-houses < 80 square metres
Number
square metres 1 173 929 477 4 233 1 943 -54,1
R'000 8 468 8 848 3 605 35 701 16 985 -52,4
Dwelling-houses >= 80 square metres
Number 55 76 55 255 252 -1,2
square metres 15 562 23 207 17 297 67 271 76 806 14,2
R'000 129 233 205 896 156 519 540 228 690 451 27,8
Flats and townhouses
Number 49 417 47 178 612 243,8
square metres 7 758 30 064 13 927 32 404 60 831 87,7
R'000 48 223 304 372 117 979 247 908 581 987 134,8
Other residential buildings 2/ square metres 0 0 628 7 952 12 095 52,1
R'000 0 0 5 282 44 879 134 848 200,5
Total residential buildings R'000 185 924 519 116 283 385 868 716 1 424 271 64,0
Non-residential buildings
Office and banking space square metres 27 799 24 380 0 68 937 26 273 -61,9
R'000 276 316 255 989 0 577 813 265 453 -54,1
Shopping space square metres 93 532 60 253 0 113 794 61 697 -45,8
R'000 913 637 632 656 0 1 067 793 647 818 -39,3
Industrial and warehouse space square metres 1 070 0 665 48 110 30 055 -37,5
R'000 5 778 0 3 791 252 951 169 403 -33,0
Other non-residential buildings 3/ square metres 495 0 9 556 495 13 838 2 695,6
R'000 2 237 0 97 791 2 237 132 766 5 835,0
Total non-residential buildings R'000 1 197 968 888 645 101 582 1 900 794 1 215 440 -36,1
Additions and alterations
Dwelling-houses square metres 13 779 12 431 6 132 51 357 38 603 -24,8
R'000 131 569 117 538 61 313 463 675 380 369 -18,0
Other buildings 4/ square metres 574 10 506 4 292 25 053 27 688 10,5
R'000 13 732 90 174 35 970 180 530 250 166 38,6
Total additions and alterations R'000 145 301 207 712 97 283 644 205 630 535 -2,1
Recorded buildings completed Total at current prices R'000 1 529 193 1 615 473 482 250 3 413 715 3 270 246 -4,2
1/ The percentage change between cumulative figures for 2016 and 2017.
2/ Other residential buildings include institutions for the disabled, boarding houses, hostels and tourism accommodation e.g. hotels, motels, guest-houses, holiday chalets, bed-and-breakfast accommodation and casinos.
3/ Other non-residential space includes churches, sport and recreation clubs, schools, crèches, hospitals and all other non-residential space.
4/ Other buildings include other residential buildings, non-residential buildings and internal alterations. No square metres are collected for internal alterations.

STATISTICS SOUTH AFRICA P5041.1
Selected building statistics of the private sector, April 2017
33
Table 25 – Buildings reported as completed to larger municipalities at current prices by type of building: North West
Apr. 2016 Mar. 2017 Apr. 2017
Jan. - Apr. 2016
Jan. - Apr. 2017
% change 1/
Category of building Type of building Measuring unit
32 53 31 107 140 30,8
Residential buildings
Dwelling-houses < 80 square metres
Number
square metres 2 003 3 073 1 966 6 532 8 170 25,1
R'000 7 115 13 475 9 180 23 082 35 522 53,9
Dwelling-houses >= 80 square metres
Number 122 81 70 429 212 -50,6
square metres 21 649 15 370 13 290 71 699 42 018 -41,4
R'000 106 105 85 984 67 698 332 620 218 090 -34,4
Flats and townhouses
Number 17 67 4 312 126 -59,6
square metres 1 633 3 949 800 28 583 9 944 -65,2
R'000 8 551 26 413 4 800 142 179 59 388 -58,2
Other residential buildings 2/ square metres 0 0 0 0 0 ..
R'000 0 0 0 0 0 ..
Total residential buildings R'000 121 771 125 872 81 678 497 881 313 000 -37,1
Non-residential buildings
Office and banking space square metres 0 0 1 618 2 616 1 618 -38,1
R'000 0 0 8 092 13 080 8 092 -38,1
Shopping space square metres 5 531 0 11 388 6 884 16 228 135,7
R'000 31 478 0 56 940 37 389 83 509 123,4
Industrial and warehouse space square metres 322 0 600 671 2 174 224,0
R'000 1 546 0 2 700 3 400 9 784 187,8
Other non-residential buildings 3/ square metres 322 0 1 191 2 401 1 191 -50,4
R'000 1 449 0 5 955 11 229 5 955 -47,0
Total non-residential buildings R'000 34 473 0 73 687 65 098 107 340 64,9
Additions and alterations
Dwelling-houses square metres 8 728 6 820 10 918 43 606 23 088 -47,1
R'000 39 257 30 683 53 406 182 331 108 132 -40,7
Other buildings 4/ square metres 115 1 305 622 2 831 3 181 12,4
R'000 770 6 123 3 207 13 404 16 878 25,9
Total additions and alterations R'000 40 027 36 806 56 613 195 735 125 010 -36,1
Recorded buildings completed Total at current prices R'000 196 271 162 678 211 978 758 714 545 350 -28,1
1/ The percentage change between cumulative figures for 2016 and 2017.
2/ Other residential buildings include institutions for the disabled, boarding houses, hostels and tourism accommodation e.g. hotels, motels, guest-houses, holiday chalets, bed-and-breakfast accommodation and casinos.
3/ Other non-residential space includes churches, sport and recreation clubs, schools, crèches, hospitals and all other non-residential space.
4/ Other buildings include other residential buildings, non-residential buildings and internal alterations. No square metres are collected for internal alterations.
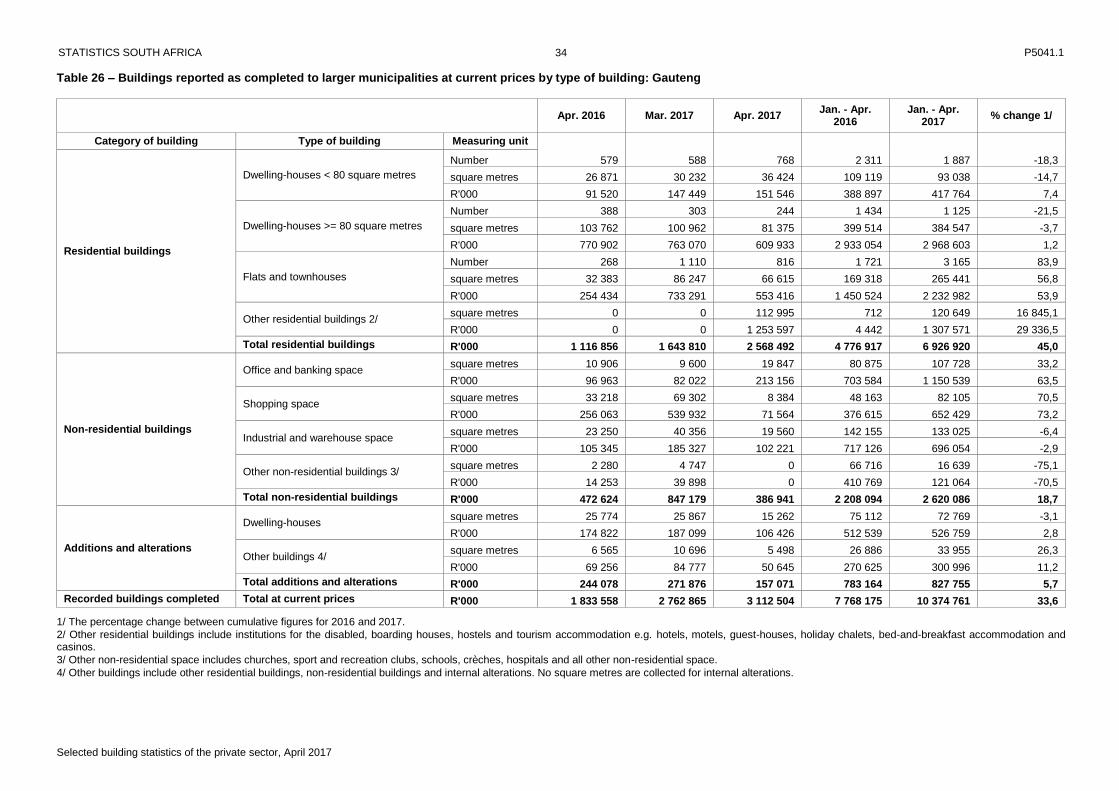
STATISTICS SOUTH AFRICA P5041.1
Selected building statistics of the private sector, April 2017
34
Table 26 – Buildings reported as completed to larger municipalities at current prices by type of building: Gauteng
Apr. 2016 Mar. 2017 Apr. 2017
Jan. - Apr. 2016
Jan. - Apr. 2017
% change 1/
Category of building Type of building Measuring unit
579 588 768 2 311 1 887 -18,3
Residential buildings
Dwelling-houses < 80 square metres
Number
square metres 26 871 30 232 36 424 109 119 93 038 -14,7
R'000 91 520 147 449 151 546 388 897 417 764 7,4
Dwelling-houses >= 80 square metres
Number 388 303 244 1 434 1 125 -21,5
square metres 103 762 100 962 81 375 399 514 384 547 -3,7
R'000 770 902 763 070 609 933 2 933 054 2 968 603 1,2
Flats and townhouses
Number 268 1 110 816 1 721 3 165 83,9
square metres 32 383 86 247 66 615 169 318 265 441 56,8
R'000 254 434 733 291 553 416 1 450 524 2 232 982 53,9
Other residential buildings 2/ square metres 0 0 112 995 712 120 649 16 845,1
R'000 0 0 1 253 597 4 442 1 307 571 29 336,5
Total residential buildings R'000 1 116 856 1 643 810 2 568 492 4 776 917 6 926 920 45,0
Non-residential buildings
Office and banking space square metres 10 906 9 600 19 847 80 875 107 728 33,2
R'000 96 963 82 022 213 156 703 584 1 150 539 63,5
Shopping space square metres 33 218 69 302 8 384 48 163 82 105 70,5
R'000 256 063 539 932 71 564 376 615 652 429 73,2
Industrial and warehouse space square metres 23 250 40 356 19 560 142 155 133 025 -6,4
R'000 105 345 185 327 102 221 717 126 696 054 -2,9
Other non-residential buildings 3/ square metres 2 280 4 747 0 66 716 16 639 -75,1
R'000 14 253 39 898 0 410 769 121 064 -70,5
Total non-residential buildings R'000 472 624 847 179 386 941 2 208 094 2 620 086 18,7
Additions and alterations
Dwelling-houses square metres 25 774 25 867 15 262 75 112 72 769 -3,1
R'000 174 822 187 099 106 426 512 539 526 759 2,8
Other buildings 4/ square metres 6 565 10 696 5 498 26 886 33 955 26,3
R'000 69 256 84 777 50 645 270 625 300 996 11,2
Total additions and alterations R'000 244 078 271 876 157 071 783 164 827 755 5,7
Recorded buildings completed Total at current prices R'000 1 833 558 2 762 865 3 112 504 7 768 175 10 374 761 33,6
1/ The percentage change between cumulative figures for 2016 and 2017.
2/ Other residential buildings include institutions for the disabled, boarding houses, hostels and tourism accommodation e.g. hotels, motels, guest-houses, holiday chalets, bed-and-breakfast accommodation and casinos.
3/ Other non-residential space includes churches, sport and recreation clubs, schools, crèches, hospitals and all other non-residential space.
4/ Other buildings include other residential buildings, non-residential buildings and internal alterations. No square metres are collected for internal alterations.

STATISTICS SOUTH AFRICA P5041.1
Selected building statistics of the private sector, April 2017
35
Table 27 – Buildings reported as completed to larger municipalities at current prices by type of building: Mpumalanga
Apr. 2016 Mar. 2017 Apr. 2017
Jan. - Apr. 2016
Jan. - Apr. 2017
% change 1/
Category of building Type of building Measuring unit
54 95 51 383 270 -29,5
Residential buildings
Dwelling-houses < 80 square metres
Number
square metres 2 974 4 212 2 416 18 555 12 555 -32,3
R'000 12 944 17 192 8 728 69 260 47 415 -31,5
Dwelling-houses >= 80 square metres
Number 87 36 30 286 106 -62,9
square metres 16 458 8 483 6 218 62 483 25 169 -59,7
R'000 72 424 38 047 27 720 271 186 116 991 -56,9
Flats and townhouses
Number 6 6 0 69 166 140,6
square metres 557 737 0 5 188 18 319 253,1
R'000 2 507 3 318 0 23 090 84 195 264,6
Other residential buildings 2/ square metres 0 0 0 0 0 ..
R'000 0 0 0 0 0 ..
Total residential buildings R'000 87 875 58 557 36 448 363 536 248 601 -31,6
Non-residential buildings
Office and banking space square metres 0 0 0 6 243 0 ..
R'000 0 0 0 34 365 0 ..
Shopping space square metres 0 0 7 206 787 12 506 1 489,1
R'000 0 0 33 062 3 541 58 217 1 544,1
Industrial and warehouse space square metres 1 240 557 438 7 902 9 281 17,5
R'000 8 800 2 507 2 015 36 599 41 809 14,2
Other non-residential buildings 3/ square metres 251 0 0 1 638 1 972 20,4
R'000 1 546 0 0 7 930 9 863 24,4
Total non-residential buildings R'000 10 346 2 507 35 077 82 435 109 889 33,3
Additions and alterations
Dwelling-houses square metres 3 933 5 540 3 122 22 378 17 601 -21,3
R'000 16 674 22 980 14 884 94 204 75 280 -20,1
Other buildings 4/ square metres 0 33 375 5 110 1 700 -66,7
R'000 0 3 277 3 107 25 430 14 825 -41,7
Total additions and alterations R'000 16 674 26 257 17 991 119 634 90 105 -24,7
Recorded buildings completed Total at current prices R'000 114 895 87 321 89 516 565 605 448 595 -20,7
1/ The percentage change between cumulative figures for 2016 and 2017.
2/ Other residential buildings include institutions for the disabled, boarding houses, hostels and tourism accommodation e.g. hotels, motels, guest-houses, holiday chalets, bed-and-breakfast accommodation and casinos.
3/ Other non-residential space includes churches, sport and recreation clubs, schools, crèches, hospitals and all other non-residential space.
4/ Other buildings include other residential buildings, non-residential buildings and internal alterations. No square metres are collected for internal alterations.

STATISTICS SOUTH AFRICA P5041.1
Selected building statistics of the private sector, April 2017
36
Table 28 – Buildings reported as completed to larger municipalities at current prices by type of building: Limpopo
Apr. 2016 Mar. 2017 Apr. 2017
Jan. - Apr. 2016
Jan. - Apr. 2017
% change 1/
Category of building Type of building Measuring unit
16 6 308 64 328 412,5
Residential buildings
Dwelling-houses < 80 square metres
Number
square metres 1 039 362 13 943 3 848 15 079 291,9
R'000 5 102 1 810 28 915 19 147 34 595 80,7
Dwelling-houses >= 80 square metres
Number 23 21 20 91 76 -16,5
square metres 4 969 5 785 6 475 24 712 21 120 -14,5
R'000 24 072 29 008 32 646 118 572 104 817 -11,6
Flats and townhouses
Number 39 3 19 92 30 -67,4
square metres 2 786 552 3 790 8 029 5 098 -36,5
R'000 14 677 2 760 18 950 40 892 26 292 -35,7
Other residential buildings 2/ square metres 0 0 0 0 5 752 ..
R'000 0 0 0 0 28 760 ..
Total residential buildings R'000 43 851 33 578 80 511 178 611 194 464 8,9
Non-residential buildings
Office and banking space square metres 0 522 0 580 1 322 127,9
R'000 0 2 610 0 2 856 6 714 135,1
Shopping space square metres 0 0 0 0 158 ..
R'000 0 0 0 0 790 ..
Industrial and warehouse space square metres 1 440 0 350 1 900 5 213 174,4
R'000 7 200 0 1 575 9 270 25 890 179,3
Other non-residential buildings 3/ square metres 0 0 0 844 0 ..
R'000 0 0 0 4 260 0 ..
Total non-residential buildings R'000 7 200 2 610 1 575 16 386 33 394 103,8
Additions and alterations
Dwelling-houses square metres 528 117 119 2 486 1 174 -52,8
R'000 2 580 594 595 11 905 5 595 -53,0
Other buildings 4/ square metres 70 0 213 70 371 430,0
R'000 1 350 500 1 103 4 850 3 893 -19,7
Total additions and alterations R'000 3 930 1 094 1 698 16 755 9 488 -43,4
Recorded buildings completed Total at current prices R'000 54 981 37 282 83 784 211 752 237 346 12,1
1/ The percentage change between cumulative figures for 2016 and 2017.
2/ Other residential buildings include institutions for the disabled, boarding houses, hostels and tourism accommodation e.g. hotels, motels, guest-houses, holiday chalets, bed-and-breakfast accommodation and casinos.
3/ Other non-residential space includes churches, sport and recreation clubs, schools, crèches, hospitals and all other non-residential space.
4/ Other buildings include other residential buildings, non-residential buildings and internal alterations. No square metres are collected for internal alterations.
STATISTICS SOUTH AFRICA P5041.1
Selected building statistics of the private sector, April 2017
37
Explanatory notes
Introduction 1 Statistics South Africa (Stats SA) conducts a monthly building statistics survey collecting information regarding building plans passed and buildings completed, financed by the private sector, from the largest local government institutions in South Africa. According to these institutions, they are not always notified about low-cost housing projects and, therefore, do not include the bulk of low-cost dwelling-houses in their reporting. Data regarding subsidised low-cost dwelling-houses can be obtained from the Department of Human Settlements.
2 In order to improve timeliness of the publication, some information for the current
month has been estimated due to late submission by respondents. These estimates will be revised in the next statistical release(s) as soon as actual information is available.
Purpose of the survey 3 The monthly survey data are used in monitoring the state of economy and
formulation of economic policy. Furthermore, the results are important inputs to estimate the gross domestic product (GDP) and to calculate the Composite Leading Business Cycle Indicator. The data are extensively used by the private sector.
Scope of the survey 4 This survey covers local government institutions conducting activities for the
private sector regarding -
passing of building plans; and
final inspection of completed buildings. Classification 5 Building activities are classified in division 5 according to the 1993 edition of the
Standard Industrial Classification of all Economic Activities, (SIC) Fifth Edition, Report No. 09-90-02. The SIC is based on the 1990 International Standard Industrial Classification of all Economic Activities (ISIC) with suitable adaptations for local conditions.
Collection rate 6 The preliminary collection rate for the survey on building statistics for April 2017
was 94,5%. The improved collection rate for March 2017 was 93,6%. Stati0stical unit 7 The statistical unit for the collection of information is a local government institution.
Local government institutions include district municipalities, metropolitan municipalities and local municipalities.
Survey methodology and design
8 Stats SA conducts a monthly survey of metropolitan municipalities and large local municipalities on building plans passed and buildings completed. An annual survey of the remaining municipalities is conducted regarding buildings completed. The monthly survey represents approximately 85 percent of the total value of buildings completed. Information regarding building plans passed and buildings completed for the private sector is collected by mail, fax and telephone.
Constant prices 9 The value of building plans passed and buildings completed at constant prices
measures building activities in terms of ruling prices in a specific base year, which is currently 2015. The value of building plans passed at constant prices for each month is obtained by deflating the values at current prices with a price index known as the ‘lump sum domestic buildings’ as published in statistical release P0151: Contract Price Adjustment Provisions (CPAP) Work Groups and Selected Materials Indices. In order to be applicable, these indices (base February 1991=100) are converted to the base year 2015=100.

STATISTICS SOUTH AFRICA P5041.1
Selected building statistics of the private sector, April 2017
38
Seasonal adjustment 10 Seasonally adjusted estimates of building plans passed and buildings completed
are generated each month, using the X-12-ARIMA Seasonal Adjustment Program developed by US Bureau of the Census Economic Research and Analyses Division, 1968.
11 Seasonal adjustment is a means of removing the estimated effects of normal
seasonal variation from the series so that the effects of other influences on the series can be more clearly recognised. Seasonal adjustment does not aim to remove irregular or non-seasonal influences which may be present in any particular month. Influences that are volatile or unsystematic can still make it difficult to interpret the movement of the series even after adjustment for seasonal variations. Therefore, the month-to-month movements of seasonally adjusted estimates may not be reliable indicators of trend behaviour. The X-12-ARIMA procedure for building statistics is described in more detail on the Stats SA website at Click to download building statistics seasonal adjustment May 2016.pdf
Trend cycle 12 The trend is a long-term pattern or movement of a time series. The X-12-ARIMA
Seasonal Adjustment Program is used for smoothing seasonally adjusted data. Revised figures 13 Revised figures are due to late submission of data to Stats SA, or to respondents
reporting revisions or corrections to their figures. Figures for the latest two years are therefore preliminary. Data are edited at municipal level.
14 Once a year the annual statistical release P5041.3: Selected building statistics of
the private sector as reported by local government institutions is published with the revised and updated information at provincial and municipal level for the previous calendar year. Due to this comprehensive revision, the monthly statistical release P5041.1 reflects provincial revision where applicable.
Related publications 15 Users may also wish to refer to the following publications:
P5041.3: Selected building statistics of the private sector as reported by local government institutions issued annually.
P9101.2: Actual and expected expenditure on construction by the public sector per statistical region issued annually.
Building Statistics (Report No. 50-11-01) issued annually. Rounding-off of figures
16 Where necessary, the figures in the tables have been rounded off to the nearest digit shown.

STATISTICS SOUTH AFRICA P5041.1
Selected building statistics of the private sector, April 2017
39
Symbols and abbreviations
17 .. no meaningful percentage change between two specified periods available since either one or both of the totals are nil
0 nil or figure too small to publish * revised Stats SA Statistics South Africa SIC Standard Industrial Classification of all Economic Activities ISIC International Standard Industrial Classification of all Economic Activities

STATISTICS SOUTH AFRICA P5041.1
Selected building statistics of the private sector, April 2017
40
Glossary
Additions and alterations Extensions to existing buildings as well as internal and external alterations of existing buildings.
Blocks of flats High-density housing consisting of a number of self-contained dwelling-units, each with at least one living-room together with a kitchen and bathroom, conjoined to similar units in one building.
Dwelling-house A free-standing, complete structure on a separate stand or a self-contained dwelling-unit, e.g. granny flat, on the same premises as an existing residence. Out-buildings and garages are included.
Local government institutions
Include –
District municipalities;
Metropolitan municipalities; and
Local municipalities.
Municipality A generic term describing the “unit” of government in the local spheres responsible for local government in a geographically demarcated area and including district, metropolitan and local municipalities. It is an institution consisting of a municipal council (elected political representatives) and municipal administration (appointed officials).
District municipality A municipality that has municipal executive and legislative authority in an area that includes more than one municipality, and which is described in section 155(1) of the Constitution as a category C municipality (refer to Local Government: Municipal Structure Act, 1998 (Act No. 117 of 1998)).
Metropolitan municipality A municipality that has municipal executive and legislative authority in an area that includes more than one municipality, and which is described in section 155(1) of the Constitution as a category A municipality (refer to Local Government: Municipal Structure Act, 1998 (Act No. 117 of 1998)).
Local municipality A municipality that shares municipal executive and legislative authority in its area with a district municipality within whose area it falls, which is described in section 155(1) of the constitution as a category B municipality.
Non-residential buildings Factories and commercial, financial and other office buildings, as well as other buildings not used for residential purposes, such as churches, halls, clubs, schools and hospitals.
Other residential buildings
Institutions for the disabled, boarding houses, old people’s homes, hostels, hotels, motels, guesthouses, holiday chalets, bed-and-breakfast accommodation, entertainment centres and casinos.
Percentage change When using monthly actual values, the percentage change is the change in actual values of building activities (building plans passed or buildings completed) of the relevant month compared with the actual values of building activities (building plans passed or buildings completed) of the same month in the previous year expressed as a percentage.
When using annual actual values, the percentage change is the change in the actual values of building activities (building plans passed or buildings completed) of the relevant year compared with the actual values of building activities (building plans passed or buildings completed) of the previous year expressed as a percentage.
When using seasonally adjusted values, the percentage change is the change in the seasonally adjusted values of building activities (building plans passed or buildings completed) of the relevant month compared with the seasonally adjusted values of building activities (building plans passed or buildings completed) of the previous month expressed as a percentage.

STATISTICS SOUTH AFRICA P5041.1
Selected building statistics of the private sector, April 2017
41
Reference period One calendar month.
Residential buildings Buildings that are used primarily as residences. Includes dwelling-houses, flats, townhouses and other residential buildings.
Townhouses Multiple, medium-density dwelling-units including cluster housing, group housing, simplexes, duplexes, triplexes and other similar dwelling-units which are usually grouped together, with one level of each unit on ground level. This category excludes blocks of flats.
Technical enquiries Nicolai Claassen Telephone number: (012) 310 8007 Email: [email protected]

STATISTICS SOUTH AFRICA P5041.1
Selected building statistics of the private sector, April 2017
42
General information Stats SA publishes approximately 300 different statistical releases each year. It is not economically viable to produce them in more than one of South Africa's eleven official languages. Since the releases are used extensively, not only locally but also by international economic and social-scientific communities, Stats SA releases are published in English. Stats SA has copyright on this publication. Users may apply the information as they wish, provided that they acknowledge Stats SA as the source of the basic data wherever they process, apply, utilise, publish or distribute the data and also that they specify that the relevant application and analysis (where applicable) result from their own processing of the data. Advance release calendar An advance release calendar is disseminated on www.statssa.gov.za Stats SA products A complete set of Stats SA publications is available at the Stats SA Library and the following libraries: National Library of South Africa, Pretoria Division National Library of South Africa, Cape Town Division Natal Society Library, Pietermaritzburg Library of Parliament, Cape Town Bloemfontein Public Library Johannesburg Public Library Eastern Cape Library Services, King William’s Town Central Regional Library, Polokwane Central Reference Library, Mbombela Central Reference Collection, Kimberley Central Reference Library, Mmabatho Stats SA also provides a subscription service. Electronic services A large range of data is available via online services. For more details about our electronic services, contact Stats SA’s user information service at (012) 310 8600. You can visit us on the Internet at: www.statssa.gov.za General enquiries User information services Telephone number: (012) 310 8600 Email address: [email protected] Postal address Private Bag X44, Pretoria, 0001
Produced by Stats SA