Embed Size (px)
Citation preview

SELECTED AQUIFER-TEST INFORMATION FOR THE COASTAL
PLAIN AQUIFERS OF SOUTH CAROLINA
By Walter R. Aucott and Roy Newcome, Jr.
U.S. GEOLOGICAL SURVEY
WATER-RESOURCES INVESTIGATIONS REPORT 86-4159
Prepared in cooperation with the
SOUTH CAROLINA WATER RESOURCES COMMISSION
Columbia, South Carolina
1986

UNITED STATES DEPARTMENT OF THE INTERIOR
DONALD PAUL HODEL, Secretary
GEOLOGICAL SURVEY
Dallas L. Peck, Director
For additional information write to:
District Chief U.S. Geological Survey, WRD 1835 Assembly Street, Suite 658 Columbia, South Carolina 29201
Copies of this report can be purchased from:
U.S. Geological Survey Books and Open-File Reports
SectionFederal Center, Bldg. 41 Box 25425Denver, Colorado 80225 (Telephone: 303/236-7476)

CONTENTSPage
Abstract -------------------------------------------------------------- 1Introduction ---------------------------------------------------------- 1
Definition of terms ---------------------------------------------- 2Previous investigations ------------------------------------------ 2
Generalized geohydrologic framework of the Coastal Plain aquifers ----- 3Aquifer test data ----------------------------------------------------- 3
Sources ---------------------------------------------------------- 3Limitations ------------------------------------------------------ 3Simplifying assumptions ------------------------------------------ 8
Methods of analysis --------------------------------------------------- 15Aquifer tests ---------------------------------------------------- 15Specific capacities ---------------------------------------------- 17
Use of test data ------------------------------------------------------ 17Summary --------------------------------------------------------------- 17Selected references --------------------------------------------------- 28
ILLUSTRATIONS
Page Figure 1. Map of the location of the Coastal Plain of South
Carolina ------------------------------------------------- 42. Generalized geohydrologic section A-A' --------------------- 53. Generalized geohydrologic section B-B' --------------------- 5
4-6. Map of the distribution of:4. Previously published aquifer-test and specific-capacity
test information ------------------------------------- 75. Aquifer tests ------------------------------------------ 166. Reported specific-capacity tests ----------------------- 27
TABLESPage
Table 1. Generalized geohydrologic correlation chart ----------------- 62. Aquifer-test and general well information ------------------- 93. Selected specific-capacity test and general well
information ----------------------------------------------- 18
III

SELECTED AQUIFER-TEST INFORMATION FOR THE COASTAL PLAIN AQUIFERS OF SOUTH CAROLINA
By Walter R. Aucott 1 and Roy Newcome, Jr. 2
ABSTRACT
Aquifer and well hydraulic characteristics are determined from more than 100 multiple-well and single-well aquifer tests in the Coastal Plain of South Carolina. Specific-capacity data are presented for many areas where aquifer-test information is sparse. The characteristics determined are based largely on well performance tests conducted by well drillers and con sulting engineers. Although use of this information has many limitations, it has value in establishing comparative hydraulic properties for the Coastal Plain aquifers.
INTRODUCTION
Ground-water from the Coastal Plain aquifers of South Carolina is a valuable resource. Many municipalities and industries located in the Coastal Plain are dependent on ground water for their water supply. Efforts to describe, develop, plan the use of, and manage this resource require knowledge of the hydraulic characteristics of the aquifers. The results of only a few aquifer tests have been published to date, for areas in South Carolina.
The objective of this report is to present the results of representa tive aquifer tests and specific-capacity tests for the Coastal Plain aqui fers of South Carolina. This report is limited in scope to data from the files of the U.S. Geological Survey and the South Carolina Water Resources Commission for the Coastal Plain aquifers of South Carolina. The data from most of the aquifer tests has not been previously analyzed to determine hydraulic characteristics of the aquifers. Published reports containing the results of aquifer tests are noted for reference.
The U.S. Geological Survey has been conducting a series of investiga tions of major aquifers throughout the United States as part of the Regional Aquifer Systems Analysis (RASA) program. These studies provide a more com prehensive understanding of ground-water availability throughout the Nation. The Coastal Plain aquifers in South Carolina are being studied as a part of this program. This report has been produced as a part of the RASA program.
1 Hydrologist, U.S. Geological Survey2 Hydrologist, South Carolina Water Resources Commission

Definition of Terms
Several terms are used frequently in this report. Transmissivity, storage coefficient, specific capacity, hydrologic boundary, multiple-well aquifer test, and single-well aquifer test are defined below to avoid con fusion in their use.
Transmissivity is defined as the rate at which water of the prevailing kinematic viscosity is transmitted through a unit width of the aquifer under a unit hydraulic gradient. It is generally expressed in units of cubic feet per day per foot, reduced to feet squared per day. Transmissivity is the most important and widely used parameter that describes the transmission of water through an aquifer. It can be used to predict the potential yield of a proposed well for a specified drawdown and to estimate the pumping effect of wells on one another.
The storage properties of an aquifer are indicated by the storage coefficient. The storage coefficient is defined as the volume of water an aquifer releases from or takes into storage per unit surface area of the aquifer per unit change in head. The term is dimensionless. In confined aquifers, water released from storage is the result of compression of the aquifer and expansion of the water. Storage coefficients generally are between 0.001 and 0.00001 for confined aquifers. In unconfined aquifers, water is released from storage mostly by gravity drainage of the aquifer pores. This results in much higher storage coefficients; 0.2 is typical.
Specific capacity is defined as the rate of discharge from a well divided by the drawdown of the water level in that well and is expressed in gallons per minute per foot. For comparability, specific capacity ideally is based on a 1-day period of pumping when possible, or a shorter period may be graphically projected to 1 day. Estimates of aquifer transmissivity can be made from specific-capacity data, although well efficiency, which is independent of transmissivity, affects specific capacity.
Hydrologic boundary is used to denote a significant change in hydraulic characteristics, such as that produced by a stream penetrating the aquifer or substantial changes in aquifer permeability or thickness. This concept is commonly used in the analysis of aquifer tests to explain the effects of nonhomogeneities or finite nature of the aquifer on the test data.
A multiple-well aquifer test in this report refers to a test where drawdown is measured in one or more observation wells other than the pumped well. The storage coefficient can be computed in a multiple-well test. A single-well aquifer test is a test where drawdown is measured only in the pumped well.
Previous Investigations
Although this report is the first comprehensive listing of the results of aquifer tests in the Coastal Plain of South Carolina, and it presents the results of many tests for the first time, it is not the first effort con cerned with the subject. Results of aquifer tests in the Coastal Plain of South Carolina were included in reports by Siple (1957 and 1967), Marine and Root (1976), Root (1977), Zack (1977), Hayes (1979), Park (1980 and 1985), and Cahill (1982). Most of the data in these reports were either original analyses of tests conducted by the investigator or the reporting of results

obtained by other investigators and consulting engineers. In addition, a considerable amount of specific-capacity data, mostly from drillers' records, were reported by Siple (1975), Hayes (1979), and Park (1980 and 1985) . Other tests have been reported individually by the consulting engi neers or drilling companies conducting the tests. All of the above informa tion, where used in the tabulation of aquifer test results in this report, is appropriately referenced.
GENERALIZED GEOHYDROLOGIC FRAMEWORK OF THE COASTAL PLAIN AQUIFERS
The Coastal Plain (fig. 1) is underlain by a coastward-thickening wedge of sediment consisting of sand, silt, clay, and limestone of Holocene to Late Cretaceous age. These sediments are underlain by pre-Cretaceous rocks consisting of consolidated sedimentary rocks of Triassic age and a complex of metamorphic and igneous rocks similar to those found near the surface in the Piedmont.
The wedge of sediments underlying the Coastal Plain of South Carolina (figs. 2 and 3) has been divided into six regional aquifers, with interven ing confining units, by Aucott and others (in press). These six aquifers; the surficial aquifer, the Floridan aquifer system, the Tertiary sand aqui fer, the Black Creek aquifer, the Middendorf aquifer, and the Cape Fear aquifer; are correlated with geologic formational units in table 1. A detailed description of the configuration and characteristics of these aqui fers can be found in Aucott and others (in press) and in Colquhoun and others (1983).
AQUIFER-TEST DATA Sources
Published aquifer-test information and analyses for the Coastal Plain aquifers of South Carolina are available from the following sources: Siple (1957, 1967, 1975), Marine and Root (1976), Root (1977), Zack (1977), Hayes (1979), Park (1980, 1985), and Cahill (1982). Distribution of previously published aquifer test information, by county, is shown in figure 4. These sources include multiple-well tests, single-well tests, and specific- capacity tests. Previously published aquifer tests were reanalyzed and included herein only if the measurement data were available. Otherwise, results previously published are not repeated here.
A great quantity of raw data from the files of the U.S. Geological Sur vey and the South Carolina Water Resources Commission was utilized in this study. This consisted mostly of well-performance tests conducted by dril lers. The largest part of these data consisted of specific capacity tests only, although many aquifer tests, mostly single-well, were available. Almost none of the information was collected by or under the supervision of U.S. Geological Survey or South Carolina Water Resources Commission personnel.
Limitations
Aquifer tests provide their most reliable information when they are conducted with wells tapping a substantial part of the aquifer. Much less representative data result when a minor fraction of the aquifer thickness is tapped or when two or more separate aquifers are screened by the same well.

» fJS £ o
OO00
O
00
00
Oro00
Oin ro
o* ro
ororo
oCVJro
Figure 1.--Location of the Coastal Plain of South Carolina (modified from Aucott and Speiran, 1985a).

A LAND SURFACE AND SEA LEVEL
PARRISISLAND CHARLESTON
SURFICIAL AQUIFER 7A
MYRTLE BEACH
CONFINING UNITSr H
Figure 2.--Generalized geohydrologic section A-A r (modified from Aucott and Speiran, 1985a).
BCOLUMBIA
SEA LEVEL LAND SURFACE TERTIARY SAND AQUIFER
ORANGEBURG STGEORGE
SURFICIAL AQUIFER
BCHARLESTON
FLORIDAN AQUIFER SYSTEM
EXPLANATION
- CONFINING UNITS
Figure 3.--Generalized geohydrologic section B-B' (modified from Aucott and Speiran, 1985a).

Table 1.--Generalized geohydroloKic correlation chart
[Adapted from Siple, 1959]
Aquifer System Geologic formations' Description
Surficial Quaternary Coastal terrace
deposits_____
Sand and clay, reddish-brown, orange and
white. __ __
Floridan aquifero
system Tertiary
(downdip)
Cooper Group
(lower part)
Ocala Limestone
Limestone and marl, gray to white, silty to
sandy, phosphatic.
Limestone, white to cream, calcitized,
fossiliferous, glauconitic.
Santee Limestone Limestone, white to creamy yellow, fossil
if erous, glauconitic; interbedded in part
with gray to yellow sandstone.____________
Barnwell Formation Sand, red to brown, fine- to coarse-grained,
massive.
Tertiary sand
(updip)
Tertiary
McBean Formation
Congaree Formation
Sand, green to yellow, fine-grained,
glauconitic; gray-green glauconitic marl.
Sand and sandstone, yellowish-brown to green,
fine- to coarse-grained, quartzose,
glauconitic; dark green to gray clay.
Black Mingo Forma
tion (upper part)
Shale, gray, sandy; black sandy limestone,
may be carbonaceous and fossiliferous in
places._____________________________________
Black Creek Cretaceous
Black Creek
Formation
Sand, gray to white, quartzose, calcareous,
micaceous, phosphatic, glauconitic; dark
gray to black thinly laminated clay con
taining nodules of pyrite and marcasite
and fragments of lignite._________________
Middendorf Cretaceous Middendorf Formation
Sand, light-gray, fine- to coarse-grained,
micaceous, glauconitic, and in part
calcareous; green, purple, and maroon
clay; greenish-gray micaceous silty
sandstone. __ _____________ __
Cape Fear Cretaceous Cape Fear Formation
Clay, reddish-brown, gray and green; yellow
to white fine- to coarse-grained sand with
traces of mica. __ ___ _____
These are geologic formations that are generally associated with a given aquifer. However, a
given aquifer may not consist of the same formations in all areas, and locally, an aquifer may
consist of parts of additional formations not listed.
Carbonate equivalent of the Tertiary sand aquifer.

35°/
3
EX
PL
AN
AT
ION
C -
PU
BL
ISH
ED
S
OU
RC
E O
FA
QU
IFE
R-T
ES
T A
ND
SP
EC
IFIC
- C
AP
AC
ITY
IN
FO
RM
AT
ION
A
S
LIS
TE
D
BE
LOW
A-
CA
HIL
L(I
982)
B-
HA
YE
S (
1979
) C
- M
AR
INA
AN
D R
OO
T (1
976)
D
- R
OO
T(1
97
7)
E -
PA
RK
(I980)
F-
PA
RK
0985)
G-
SIP
LE
(I9
57
) H
- S
IPL
E(I
967)
I -
SIP
LE
(I975)
J -
ZA
CK
(I977)
0
10
20
30
40
50
MIL
ES
i i
i i
I I
Figure 4.--Distribution of previously published aquifer-test and specific-
capacity test information.

In South Carolina it is common for wells to have multiple screened intervals in order to obtain as much water as possible from a particular well. Where several water-bearing beds are separated by thin nonproducing beds, the entire zone often behaves as a unit having a common water level, or hydrostatic pressure, and a common water quality. If water-bearing beds are separated by thick beds of much lower permeability, the water-bearing beds are likely to represent separate aquifers with differing hydrostatic pressures and possibly differing water-quality characteristics.
Some of the aquifer tests were made at wells in which the producing zones probably represent parts of more than one aquifer. In these situa tions it is not known what proportion of the well discharge is provided by each aquifer; therefore, the values for transmissivity derived from multiple-aquifer wells that are reported in table 2 should be considered as minimum estimates of the total transmissivity of these combined aquifers.
Simplifying Assumptions
The nature of the available data required that several assumptions be made. The first assumption is that the data available accurately represent the particular test conducted. The absence of control over test procedures means that the quality of the data is uncertain. This is particularly true for specific-capacity tests where a series of measurements over time that can be evaluated to detect possible unusual occurrences is unavailable. A number of single-well and multiple-well aquifer tests were not used because of data irregularities that may have reflected improper test procedures.
Partial penetration is a potential problem with many of the tests. No correction was made for partial penetration, for three reasons. First, most of the tests used were from large-scale municipal or industrial wells that screen most of an aquifer. Second, most drillers are likely to screen only the most permeable sediments in an aquifer, leaving the least permeable part of the aquifer unscreened. Last, many of the wells that are partially screened use multiple screens and it would be difficult to accurately make corrections. As a result of the lack of correction for partial penetration, the transmissivities presented are probably underestimates.
The effects of well loss and inadequate development can produce a sig nificant error in estimates of transmissivity derived from specific-capacity data. Because no corrections for these effects can be made with the avail able data, transmissivity estimates derived from specific-capacity data will tend to be underestimates of the actual values. Multiple-well and single- well aquifer tests provide the most accurate estimates of transmissivity. In areas of high data density, some tests yielding lower transmissivities have not been presented because they seem unrepresentative of aquifer trans missivity in that area. Where aquifer tests are sparse or nonexistent, selected specific-capacity data are presented. The greater specific capac ities in each aquifer in a general area were considered to be the most free of test errors and, therefore, most representative of the actual aquifer transmissivity. This is because most errors would tend to result in an underestimation of the transmissivity.

Table
2.--Aquifer-test and
general
well in
form
atio
n
Coun
ty
SCWRC
well
No.
No.
Aiken
Coun
tyAK
-452
39
W-X1
A I l
endale Co
unty
AL-66
37Z-q3
AL-268
34AA-q2
AL-3
26
33BB-p1
Bamberg
County
BAM-24
3lX-
m5
Barn
well
Co
unty
BW-7
5 34
W-s5
BW-7
9 35W-f1
BW-2
69
38Y-o1
Beaufort Co
unty
BFT-795
2711-15
BFT-
1560 25HH-p6
BFT-
1566
25
HH-p
12
BFT-
1570
25HH-p17
Berk
eley
Cou
nty
BRK-141
16W-
x1BRK-175
18AA
-U1
BRK-443
18AA-e4
BRK-45
7 19Z-b3
Lati
tude
3320
15
330655
330101
325631
3317
15
3221
40
3323
4833
1229
3222
19
3226
02322615
3226
28
3324
2333
0031
3304
3833
0927
Long
i -
tude
8143
59
8133
56
8118
0781
1420
8102
28
8115
40
8124
0781
3937
8041
34
8034
5680
3432
8034
32
7956
0279
5526
795935
8001
30
Loca
tion
Sava
nnah
Ri
ver
Plan
t
Morr
is Fa
rm
A I lendale
Fairfax
Bamberg
Blac
kvil
le
Wi 1
1 ist
onSavannah Ri
ver
Plant
Port
Ro
yal
Datha
Island
Datha
Isla
ndDatha
Isla
nd
St.
Stephen
Goos
e Creek
Mt.
Holl
yMo
ncks
Corner
1 Aquifer
Middendorf/
Blac
k Creek
Blac
k Creek/
Tertiary
F I or
i dan
F I or
i dan
Tert
iary
Tert
iary
/Bl
ack
Creek
Midd
endo
rfMiddendorf
Surf ici
al
Surf
ici
alSurf ici
alSurf ici
al
Middendorf
F I or
i dan
Middendorf
F I or
i dan
Screened
Scre
en
interval
leng
th
(fee
t)
(fee
t)
445-690
390-715
240-
328
257-339
140-356
204-465
490-680
430-600
45-9
4
50-5
859-66
51-5
9
1,09
4-1,
260
200-280
1,530-1,642
177-246
115
125
(OH) 40 80 50 100
110
(OH)
(OH)
(OH)
(OH) 60 75 80 50
Well
Date
diam
eter
of
(i
nche
s) te
st
18 18/8
16/6 10 12 12 10 8 8 4 4 4
18/10/6
10 14/8 6
1111
2/79
5/80
5/83
2/75
9/75
1/78
12/52
5/76
11/8
311/83
11/8
3
7/80
8/73
7/82
1/84
Duration
of test
dd/recoy.
(hours)
12/2
24/4
24/-
24/2
6.5/
-
21/-
12/6
----
23/23
4/1
4/0.
54/
0.5
24/-
24/7
121-
24/-
Pumping
rate
(gal
/min
)
2,005
1,500
752
298
500
703
1,40
4567
322 40 40 40 305
130
800
350
Spec
ific
capa
city
Tr
ansm
is-
6 [(
gal/
min)
si
vity
Remarks
/ft]
(f
t /d
)
31 16 7.4
1.3
2.9
6.9
12 38 54 8.3
10. 9.8
17 2.7
17 2.0
9,40
0
9,00
0
2,900
Also
known
as A
L-310.
500
500
4,400
13,000
14,000
Listed as
LA
-33
inSiple, (1
957)
.
15,000-- S=
0.00
01;
Haye
s (1979)
repo
rted
T=
15,0
002
ft /d
and
5=0.0001.
2,400
4,300
2,70
0
3,50
0790
4,500
S=0.
0005
.71
0

Tabl
e 2.
--A
quif
er-t
est
and
general
well
in
form
atio
n--C
onti
nued
Coun
ty
SCWR
C we
ll
No.
No.
Calh
oun
Coun
tyCA
L-27
29R-f2
CAL-
30
28T-
b1
CAL-
34
27U-
h1
CAL-
41
28S-
k1CA
L-42
26
S-01
CAL-
43
27S-
t1
CAL-
48
28T-b2
Char
lest
on Co
unty
CHM-163
17DD-m5
o
CHN-173
16CC
-y1
CHN-186
20FF
-V1
Lati
tude
3348
3633
3954
3333
43
3341
5033
4235
3341
38
333952
3247
1732
5042
3236
00
Long
i -
tude
8054
5480
4632
8042
36
8045
2480
3934
8040
57
8046
23
7952
1879
4940
8006
22
Location
Teep
akSt
. Ma
tthe
ws
Cameron
St.
Matt
hews
Ft.
Motte
St.
Matt
hews
St.
Matt
hews
Moun
t Pl
easa
ntSnee Fa
rms
Kiawah Island
Aquifer
Middendorf
Tertiary/
Blac
k Cr
eek
Tert
iary
/Bl
ack
Cree
kMiddendorf
Tert
iary
/Bl
ack
Cree
kTe
rtia
ry/
Blac
k Cr
eek
Tertiary
Middendorf
Midd
endo
rfMi
dden
dorf
Scre
ened
Sc
reen
interval
leng
th
(feet)
(feet)
305-405
170-408
250-280
510-770
220-300
260-340
100-200
1,829-1,912
1,575-1,862
2,018-2,210
65 50 30 100 80 60 100 83 95 166
Well
Da
te
diameter
of
(inches) test
6 10 8
12/8 10 10 12 16 16 8
2/76
4/80
5/76
7/78
2/81
12/7
5
2/81
2/83
2/84
3/77
Dura
tion
of te
st
Pumping
dd/r
ecoy
. ra
te
(hours)
(gal
/min
)
22/3.5
20/3
24/-
6/1.
714/-
10/- 5/-
24/-
24/24
24/-
524
500
250
1,12
052
5
535
450
750
450
430
Specific
capacity
Tran
smis
- 6
[(ga
l/mi
n)
sivity
Rema
rks
/ft]
(ft
/d)
9.7
26 11 14 27 24 7.5
4.7
2.5
1.7
3,00
06,
200
4,60
0
5,600
Also known
as CA
L-60
1.10,000
Also known
as CA
L-60
2.
13,0
00
Also known
as CA
L-60
0.
2,200
Also known
as CA
L-60
8.
1,60
01,
200
3,50
0
Ches
terf
ield
Co
unty
CTF-62
18G-u1
Clar
endo
n Co
unty
CLA-
29
2lS-
y1
CLA-30
19Q-
J1
Col le
ton
Coun
tyCOL -232
30AA-C4
Darl
ingt
on Co
unty
DAR-
89
16L-q1
DAR-
94
19K-o2
DAR-112
16L-
X1
3440
31
334025
3353
12
330402
3416
08
3422
1934
1554
7955
58
8014
55
8000
46
8057
14
7948
27
8004
2479
4817
Cher
aw
Manning
Turbevi
I le
Lodge
Darl
ington
Hart
svi
I le
Darl ington
Middendorf
Blac
k Creek/
Middendorf
Blac
k Cr
eek
F I or
i dan/
Blac
k Cr
eek
Cape Fear
Middendorf
Cape
Fear/
Middendorf
80-125
525-700
164-417
480-520
530-624
214-306
314-620
30 55 40 30 50 60 100
6 8 10 6 12 10 12
8/77
11/74
3/76
10/8
1
4/73
9/76
10/78
24/- 8/1
23/1
24/2 8/-
24/-
24/17
105
754
503
240
600
1,02
2951
5.3
15 13 5.3
4.5
16 5.3
700
Also
known
as CTF-601.
5,400
2,700
2,300
900
S=0.
000
05;
Park (1
980)
repo
rted
T=
940
ft /d
and
S=0.
0003
.5,100
1,30
0
Tabl
e 2.--Aquifer-test an
d general
well
information--Continued
County
SCURC
well
No.
Ife-
Dqrc
hest
tr County
DOR-88
21BB
-ni3
DOR -206 21AAT2
Florence County
FLO-146
16M-
W1FLO-147
13P-
d1
FLO-221
13N-d3
FLO-247
15Q-p3
Georgetown Co
unty
GEO-73
7U-q1
GEO-
125
7U-J
1
GEO-
173
llU-
il
GEO-185
11W-
r1GEO-188
12W-M
GEO-228
lOV-
vl
Horry
Coun
tyHO
-284
6T-q2
HO -287
7Q-p
1
HO-309
6R-q
3
HO-333
6T-i
1HO-335
3R-b
2
Lat
i -
tude
3257
3433
0150
341011
3359
34
3408
0034
5144
3331
5733
3343
3333
2433
2125
3321
4333
2524
3336
4333
5111
3346
07
3338
3433
4900
Longi
-
tude
801207
8012
20
794718
7933
28
7933
0079
4421
7903
4379
0044
7921
3479
2255
7927
4279
1659
785851
7904
18
785805
7856
4078
4154
Location
Summ
ery
i I le
Summervi L
le
Flor
ence
Pampl ico
Mars Bl
uff
Lake City
Inlet
Oaks
Gard
en C
ity
Brow
ns Ferry
Geor
geto
wnSampit
Georgetown
Surfside Be
ach
Conw
ay
Conw
ay
Myrtle B
each
N. My
rtle
Be
ach
Aquifer
Midd
endo
rfMi
dden
dorf
Midd
endo
rfBl
ack
Creek
Blac
k Cr
eek
Blac
k Cr
eek/
Middendorf
Blac
k Cr
eek
Blac
k Cr
eek
Blac
k Cr
eek
Blac
k Creek
Blac
k Cr
eek
Blac
k Cr
eek
Blac
k Creek
Middendorf
Blac
k Cr
eek
Black
Creek
Blac
k Cr
eek
Screened
inte
rval
(f
eet)
1,62
2-1,
750
1,58
7-1,
746
354-665
210-300
106-124
406-613
475-610
330-
600
551-672
625-655
654-800
440-
686
419-
616
612-728
360-375
314-
746
308-700
Screen
leng
th
(fee
t)
73 75 155 60 18 85 50 75 70 30 100
132 70 71 15 110
195
Well
diameter
( inches)
6 6 12 8 8 18 8 6 8 8 8/4
10 10/8 8 4 20 10/8
Date Of
3te
st
7/79
10/8
1
4/62
2/65
12/80
8/83
3/83
2/77
3/80
9/80
3/85
1/72
4/73
8/77
5/72
5/74
Duration
of te
stdd/recoy. 4
(hours)
24/-
24/2
24/-
12/-
4/-
24/7 5/-
24/2
25/2 6/-
-/12
24/12
7.5/
123
/1
32/-
24/4 8/8
Pumping
rate
(gal/min)
900
510
1,40
0536
118 75 100
188
201 37 175
517
503
517 32 500
503
Spec
ific
capacity
[(gal/min)
/ft] 6.3
2.4
11 7.2
2.4
15 4.3
1.2
3.4 .40
.45
2.1
5.8
10. 1.1
6.3
9.7
Tran
smis
- si
vity
(f
t /d
)
3,800
400
2,70
03,
000
2,40
03,
400
1,700
600
1,200
200
400
600
2,000
3,40
0
600
1,900
3,100
, 6
Remarks
Park (1980) reported
3,10
0 ft /d
.
Zack (1977) re
port
ed3,500
ft /d
.Zack (1977) re
port
ed600
ft /d
.
Zack (1
977,
) re
port
ed
HO-335A
3R-b
2 33
4900
78
4154
N. My
rtle
Beach
Blac
k Cr
eek
308-412
702,
760
ft"/
d.10/8
5/74
8/4
305
4.8
1,70
0 Pa
cker
test of
to
p 4
screens
in HO
-335
.

Tabl
e 2.--Aquifer-test and
general
well
in
form
atio
n--C
onti
nued
Coun
ty
well
No
.
SCWR
C No
.
Lati
tude
Long
i
tude
Loca
tion
Aquifer
Horry
County-
- Con
t i nued
HO -33
6
HO-345
HO-353
HO-410
HO-4
16HO
-463
HO- 46
7HO-473
HO- 482
HO -48
3HO
-571
HO- 596
HO -663
HO-6
66HO -68
3HO
-688
HO -696
HO-730
HO- 74
2HO
- 75
2HO- 85
8HO -85
9HO
-86
7
Jasper
3Q-U
1
7R-J
1
6T-m5
6S-s1
6T-h
12Q
-y4
3Q-p
13R
-g1
4R-s1
4R-x2
7Q-o
17T
-h1
6T-p5
8S-r4
5S-g
16T-64
7R-t
5
5S-i
83R-f2
3R-o7
5S-y
107T-u4
3Q-b3
County
3350
20
3348
34
3337
1533
4143
3338
1533
5056
3351
2333
4855
3346
2733
4508
3352
1433
3834
333607
3341
1833
4314
3339
2533
4608
3343
0333
4805
3347
5233
4036
3335
3533
5408
7840
11
7900
19
7857
4178
5632
785742
7839
0878
4417
7843
0178
4646
784831
7904
4879
0231
7859
07
7907
0978
5358
785613
790040
7851
36784422
7844
5678
5431
790040
7841
58
N. My
rtle
Bea
ch Bl
ack
Cree
k
Conw
ay
Blac
k Creek/
Midd
endo
rfGa
rden
City
Blac
k Creek
Myrt
le B
ch.
AFB
Blac
k Cr
eek
Gard
en City
Black
Cree
kN.
My
rtle
Beach
Blac
k Cr
eek
Wamp
ee
Blac
k Cr
eek
N. My
rtle
Be
ach
Blac
k Cr
eek
Myrt
le Be
ach
Blac
k Cr
eek
Myrt
le B
each
Black
Cree
kCo
nway
Mi
dden
dorf
near Bucksport
Blac
k Cr
eek
Surf
side
Beach
Blac
k Cr
eek
Bucksport
Blac
k Cr
eek
Myrt
le B
each
Blac
k Cr
eek
Myrt
le B
ch.
AFB
Blac
k Cr
eek
Burning
Ridge
Black
Creek/
Midd
endo
rfMy
rtle
Bea
ch
Black
Cree
kN.
My
rtle
Beach
Blac
k Cr
eek
Myrt
le Beach
Black
Cree
kMy
rtle
Beach
Blac
k Cr
eek
Gard
en C
ity
Black
Cree
kLi
ttle
River
Black
Cree
k
Screened
interval
(fee
t)
300-580
495-780
396-482
348-458
334-680
302-560
92-3
90324-530
340-624
346-602
654-795
655-748
410-624
388-575
366-634
395-597
408-802
370-660
326-622
290-658
369-635
340-700
203-372
Scre
en
leng
th
(feet)
150
100 70 90 120 95 70 84 142
150 80 50 70 90 150 85 189
150
150
150
150
200 72
Duration
Well
Date
of
te
st
diameter
of
dd/recoy.
(inc
hes)
te
st
(hou
rs)
10/8
20/8 8 8 10 10 10 10 10 10 10 8 8 8 10 10 12 10 10 10 10 12 10
8/74
5/75
3/75
11/7
64/
779/80
9/79
12/8
04/80
6/80
9/78
10/7
93/
81
8/81
12/8
18/82
2/82
10/82
2/83
6/83
4/84
7/84
11/8
3
24/8
24/-
24/2
326
/424
/23
24/2
24/1
124
/224/8
24/8
24/2
24/2
325
/2
24/2
24/7
24/9
24/6
24/4
24/2
324/23
24/1
224
/24
35/2
4
Pumpi ng
rate
(g
al/m
in)
503
703
300
201
400
508
300
390
450
450
503
200
513
226
503
403
1,00
1 503
510
520
503
760
370
Spec i f i
c
capa
ci ty
[(ga
l/mi
n)
/ft] 6.1
23 2.2
1.4
5.9
4.6
11 2.8
3.7
5.4
14 3.0
2.3
4.6
5.7
3.2
10. 5.8
3.8
5.4
8.0
4.3
2.5
Tran
smis
- 6
sivi
ty
Remarks
(ft
/d)
2,000
Zack (1977) re
port
ed
2,00
0 ft /d
.9,700
800
400
2,700
1,40
06,000
700
1,20
01,
500
3,900
900
1,10
0
1,30
02,000
1,20
02,000
2,00
01,
000
2,500
2,20
01,
200
1,30
0
Flor
idan
145-330
(OH)
12
5/57
25/9
1,
600
100
47,0
00
5=0.
0004
; Hazen
&Sa
wyer
(1957) &
Hayes
(197
9) re
port
ed
T=47
,000
ft
/d &
5=0.00036.

Table
2.--
Aqui
fer-
test
an
d general
well information--Continued
Coun
ty
SCWRC
well
No
. No
. .
Kershaw
Coun
tyKER-19
23J-u2
KER-
139
25M-
g1KER-148
23K-
i1
Lee
Coun
tyLE
-18
190-
g1LE
-19
190-
g2LE
-36
23L-
k1
Lex in
g to
n Co
unty
LEX -89
37P-V2
LEX-156
32R-
b1
Mari
on C
ount
yMR
N-67
9M-p2
MRN-89
9M-p
1MR
N-91
10
M-k3
Marl
boro
County
MLB-
117
15J-
d3MLB-145
14K-b1
Orangeburg C
ount
y
ORG-217
24V-
g1OR
G-20
0 29V- t1
Rich
I and
Coun
tyRIC-52
27Q-13
RIC-62
26R-C2
Lati
tude
3425
2634
1306
3423
49
3403
51340350
341724
335529
334910
3411
56341143
341248
343004
3424
16
3327
57332642
335244
334944
Long
i
tude
802015
803324
8023
19
8003
5680
0353
8020
29
8131
02810605
791404
791428
791544
794253
793558
802912
8050
59
8041
33803810
Location
Beth
une
Camden
Bethune
Lync
hbur
gLynchburg
Luck
now
Leesvi I le
Gast
on
Mull
ins
Mul
I ins
Mul
I ins
near
Blenheim
Brow
nsvi
lie
Santee
Orangeburg
East
over
Wate
ree
Aqui
fer
Middendorf
Middendorf
Midd
endo
rf
Middendorf
Middendorf
Middendorf
Middendorf
Middendorf
Black
Creek
Black
Creek
Black
Creek
Midd
endo
rfMiddendorf
Tertiary
Middendorf
Black
Creek
Middendorf
Scre
ened
in
terv
al
(fee
t)
140-
190
94-134
123-
152
316-
511
391-536
175-258
38-9
329
6-32
6
228-
356
194-
334
326-
346
68-124
150-
240
244-
356
835-
950
102-
112
380-
544
Screen
length
(feet)
35 20 18 60 65 35 36 30 50 48 20 27 76 50 100 10 103
Well
Da
te
diameter
of
(inches) te
st
8 6 8
16/8
16/8 8 8 8
10/8 10 12 10 12/8 10 20/10
620/10
9/53
6/78
2/77
11/7
23/73
5/78
3/76
5/72
5/72
7/79
6/72
6/59
4/82
3/77
7/78
4/76
10/7
4
Duration
of te
st
Pumping
dd/r
ecoy
. ra
te
(hou
rs)
(gal
/min
)
46/2
424/1
24/2
287-
247-
207-
21/1
224/2
12/1
024
/2 3/1
28.5/4
24/2
24/5 6/-
2/2
24/8
300
102
300
805
798
268
115
200
570
602
372
362
1,00
2
254
1,00
0
120
2,00
0
Specific
capa
city
Tr
ansm
is-
[(ga
l/mi
n)
sivi
ty
Remarks
/ft]
(f
t /d)
2.6
3.0
7.5
9.0
6.0
2.5
...
14 14 5.5
3.0
21 33 5.0
15 3.3
22
400
8=0.
0002
.90
0 Al
so known
as KE
R-60
1.4,
800
3,400
3,00
02,600
2,50
03,300
2,800
1,60
090
0
4,90
08,000
Also
kn
own
as M
LB-600.
1,50
0 Al
so kn
own
as O
RG-601.
18,000
1,90
09,300
5=0.
0001
.

Table
2.--Aquifer-test and
gene
ral
well information--Continued
Coun
ty
well
No
.
Sumter
SU-120
SU-1
51B
SU-153
SU-156
SU-159
SU-179
SCWRC
No.
Coun
ty23Q-r3
24S-d2
23Q-
r125
0-g1
24P-
g124
0-t1
Lati
tude
3351
47
3344
13
3351
5434
0306
3358
01340235
Longi
tude
802253
802810
802236
803235
802858
802528
Loca
tion
Sumter
P i new
ood
Sumter
Remb
ert
Shaw A
FBDa
lzel
l
Aqui
fer
Middendorf/
Black
Creek
Midd
endo
rf
Midd
endo
rfMi
dden
dorf
Black
Cree
kMiddendorf
Scre
ened
in
terv
al
(fee
t)
294-670
690-
740
533-633
145-
318
182-
242
140-
435
Scre
en
leng
th
(feet)
100 50 100 95 40 120
Well
Da
te
diameter
of
(inches) te
st
24/1
2 10
/65
8 7/76
22/1
2 8/76
12/10
6/77
20
9/75
12/10
3/79
Duration
of te
st
dd/r
ecoy
. (hours)
24/- 7/1
24/46
24/1 7/-
22/-
Pumping
rate
(g
al/m
in)
1,800
265
1,400
1,212
650
1,302
Spec
ific
ca
paci
ty
[(ga
l/mi
n)
/ft]
19 5.8
14 36 12 22
Tran
smis
- sivity
Remarks
(ft
/d)
7,10
0
2,70
0 Pa
rk (1
980)
re
port
ed2,
800
ft /d
.7,
100
5=0.
0005
.12
,000
4,200
15,0
00
Wi 1
1 iamsburg
Coun
tyWIL-26
WIL-
33WI
L-10
9WI
L-11
8
16S-
g2
17U-
r116
T-e2
17S-u1
3343
50
3331
2433
3928
334021
794820
795235
794908
795013
near Ki
ngst
ree
Lane
Kingstree
Kingstree
Black
Creek/
Midd
endo
rfBlack
Creek
Black
Creek
Cape Fe
ar/
Midd
endo
rf
565-
755
580-
636
304-
660
750-944
50 30 110 50
10/8
1/
61
6 6/
6918
5/78
18
11/7
6
24/-
24/-
72/96
24/1
700
150
754
500
10. 1.1
10. 3.5
2,700
460
2,900
Also
known a
s WI
L-75
.450
See
table
1 fo
r aquifer
correlation.
Aquifer
names
sepa
rate
d by
a sl
ash
indicate a
mul
tiaq
uife
r well or
a we
ll in
whi
ch the
aquifer
desi
gnat
ion
is le
ss
cert
ain.
The
firs
t aquifer
list
ed is the
one
for
whic
h th
e water
level
is co
nsid
ered
to
be m
ost
representative.
"Ter
tiar
y" in
dica
tes
the
Tertiary s
and
aqui
fer.
2 "(OH)" indicates
the
well
is a
n open h
ole
thro
ugho
ut th
e designated in
terv
al.
Scre
en le
ngth
s may
be less than s
cree
ned
interval because
of multiple w
ell
scre
ens.
Mont
h/ye
ar or year only o
f te
st.
Upper
number refers to
drawdown, lower
number re
fers
to re
cove
ry.
Spec
ific
capacity b
ased o
n drawdown a
t 24
hours or pr
ojec
ted
to 2
4 ho
urs
where
test
du
rati
on is less than 2
4 ho
urs.
6 S is
th
e st
orag
e coefficient.

METHODS OF ANALYSIS Aquifer Tests
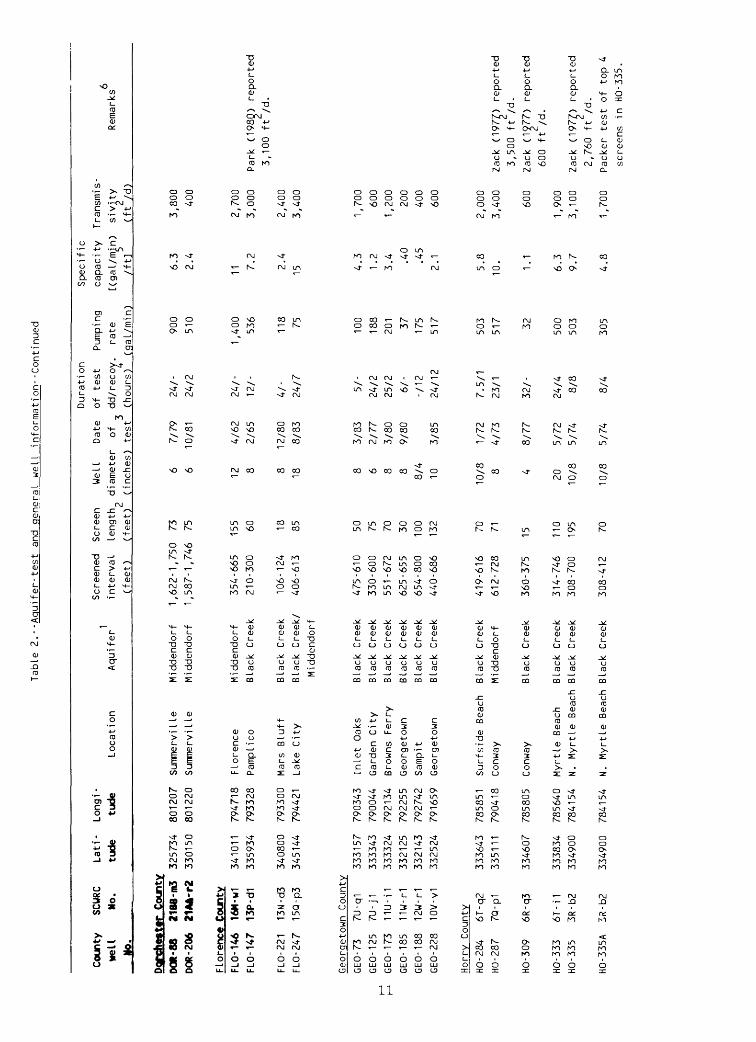
Table 2 is a compilation of selected aquifer-test information and related well information for the Coastal Plain aquifers of South Carolina. This table includes only the tests deemed to be representative of the respective aquifer transmissivities. Between one-half and one-third of the multiple-well and single-well aquifer tests that were evaluated have been incorporated into this table. The distribution of the tests, by county, is shown in figure 5.
Multiple-well aquifer tests, those using an observation well, were gen erally analyzed by either the Theis method for nonleaky aquifers (Theis, 1935), or the Hantush-Jacob method for leaky aquifers (Hantush-Jacob, 1955). Both of these methods involve a type-curve matching technique. Reported transmissivity results for multiple-well tests are derived considering all available data, including measurements from observation wells and the pumped well.
Multiple-well test results reflect the aquifer properties between the pumped well and one or more observation wells; however, single-well aquifer tests reflect the aquifer transmissivity in the general vicinity of the pumped well. Single-well aquifer tests generally were analyzed by using straight-line solutions for drawdown (Cooper and Jacob, 1946) or recovery (Theis, 1935). Curve-matching solutions are usually not feasible with single-well data because of the general lack of good early-time data and the interference from other factors in the pumped well early in the pumping period. The slope of the best-fit line through data points plotted as water level or drawdown versus time was used to compute transmissivity in the equation:
T = 35.2Q/(As/Alog t)
where T = transmissivity, in feet squared per day;Q = discharge rate, in gallons per minute; andAs/Alog t = slope of best-fit line of drawdown versus log time.
This method is usually adequate before leakage becomes significant because u, which is equal to r 2 S/4Tt, is less than 0.01 at small values of time (t) considering the small effective radius (r) of the pumping well and reason able storage coefficients (S) (Lohman, 1972, p. 23). Although recovery data frequently yield better analyses than drawdown data, most analyses relied on drawdown data because they were more available. Storage coefficients cannot be accurately determined from single-well aquifer test data.
Problems previously mentioned, such as partial penetration and lack of control over data collection, will affect analysis of aquifer tests. Many more single-well aquifer tests were not used than were used. The drawdown versus log time plots of the rejected tests were not linear or they formed no consistent pattern, indicating either that the assumptions of the method of analysis were violated or that inadequate test procedures were used in the data collection. In some cases, insufficient data were available for an adequate analysis. Some multiple-well aquifer tests were also rejected for similar reasons. Well losses and aquifer losses resulting from poor well
15

EX
PL
AN
AT
ION
V C
H C
ST
EI'
/LA
MC
AS
T
r OFAN)GEBU.V.<
/ 2
3-N
UM
BE
R
OF
AQ
UIF
ER
TE
ST
S
RE
PO
RT
ED
FO
R
82
EA
CH
C
OU
NT
Y
LIS
TE
D I
N
TH
IS R
EP
OR
T
0
10
20
3
0
40
50
MIL
ES
I I
I I
I I
81°
80°
Figure 5.--Distribution of aquifer tests.

development do not affect multiple-well tests and probably affect single- well tests only very early in the tests, a period not relied on in the analysis of the single-well tests.
Specific Capacities
Selected specific-capacity tests for areas where aqliifer-test data were unavailable or sparse are presented in table 3. About 10 percent of the available specific-capacity tests are included in this table. The distribu tion of tabulated specific-capacity tests is shown in figure 6.
The specific-capacity of a well can provide the basis for an estimate of a minimum aquifer transmissivity. Estimates of transmissivity can be obtained from specific-capacity data by a number of methods, including those of Brown (1963) and Bedinger and Enunett (1963). There is a direct relation between specific-capacity and aquifer transmissivity for a given condition of effective well diameter, duration of test, and storage coefficient. In actual practice, however, well loss varies widely resulting in a wide range of specific-capacity derived transmissivities in locations where numerous tests are available.
USE OF TEST DATA
Application of the transmissivity data should be made keeping in mind the limitations of the available test data and the methods of analysis, as previously discussed. The nature of the aquifer sediments also has bearing on the use of these data. Aquifers in the Coastal Plain of South Carolina typically consist of lenses of sand of varying thickness and areal extent. These lenses are idealized together both laterally and vertically as if they were a continuous, homogeneous single mass, although they are really not. This nonhomogeneity directly results in the common occurrence of hydrologic boundaries, as recognized in the analysis of the aquifer tests. It also results in significant variation in transmissivity over short distances.
The use of these data must be with the above uncertainties in mind. In areas where the density of data is relatively high, more confidence can be placed in the range of transmissivity values. Conversely, where the data density is low or consists mostly of transmissivity estimates derived from specific-capacity tests less confidence is appropriate. Extrapolation of these test results into nearby areas can yield meaningful results if the aquifer materials and the screened intervals are similar. Extrapolation of test results from one aquifer to estimate transmissivity in another aquifer has little meaning. In any case, the use of these data must be done with consideration of their limitations.
SUMMARY
Aquifer and well hydraulic characteristics obtained from more than 100 multiple-well and single-well aquifer tests in th,e Coastal Plain of South Carolina were tabulated by county. Multiple-well aquifer tests were ana lyzed by the Theis method for nonleaky aquifers and the Hantush-Jacob method for leaky aquifers. Single-well tests were analyzed by straight-line solu tion techniques for drawdown (Cooper-Jacob) and recovery (Theis recovery) tests. Specific-capacity test data are presented for areas where aquifer- test information is sparse. The data are based largely on well performance tests conducted by well drillers and consulting engineers. Many tests are
17

Tabl
e 3.
--Se
lect
ed s
peci
fic-
capa
city
test an
d ge
nera
l we
ll in
form
atio
n
Coun
ty
well
No
.
SCWR
C No
.
Lati
tude
Longi
tude
Loca
tion
Aquifer
Screened
interval
(feet)
Screen
Well
Date
length
diameter
of
(feet)
(inc
hes)
test
Duration
Pump
ing
of te
st
rate
4
(hou
rs)
(gal
/min
)
Spec
i f i
c
capacity
[(ga
l/mi
n)
/ft]
Aiken
Coun
tyAK
-440
AK-4
76AK
-516
AK-5
38
41U-
U441U-V2
39X-
k6
38X-n2
3330
59333058
331714
331713
815053
815115
814028
813828
Burn
etto
wnBu
rnet
town
Savannah Ri
ver
Plant
Savannah Ri
ver
Plan
t
Midd
endo
rfMiddendorf
Midd
endo
rf
Midd
endo
rf/
Blac
k Cr
eek
160-
200
126-
169
600-850
425-850
30 30 100
195
6 6 11 18
5/69
6/69
9/82
2/52
24 24 24 --
197
197
1,40
0
560
12 20.
14 60.
Alle
ndal
e Co
unty
AL-22
AL-47
AL-48
Bamberg
BAM -22
BAM -23
BAM -2
7
Barnwell
BW-57
BW-6
0BW-61
BW-63
BW-78
BU-2
68
BW-310
Beau
fort
BFT-
449
BFT-652
BFT
671
34BB-k1
35DD-f1
33Z-
y1
County
32X-g2
32X-
d13l
X-m6
Coun
ty25Y-c4
35Y-b8
35Y-
c735
X-v1
36W-
J137Y-f2
38Y-
d1
Coun
ty24
JJ-c
127
KK-H
1
27LL
-d2
325850
3246
39
330518
331855
3219
27331714
331410
331410
331410
331500
332358
331328
331452
321930
321313
320922
811634
8122
27
811420
810820
810825
8102
29
812245
812200
812100
812130
812520
8134
47
813852
8027
3780
4301
804356
Alle
ndal
eGroton
Plan
tati
onUlmer
Denmark
Denmark
Bamberg
Barn
well
Barn
well
Barn
well
Barnwell
Wi I li
sten
Savannah Ri
ver
Plant
Sava
nnah
Ri
ver
Plan
t
Fripp
Isla
ndHilton He
adIs
land
Hilt
on He
adIs
land
Blac
k Cr
eek
Tert
iary
/Bl
ack
Cree
kF 1
ori dan
Tert
iary
Tertiary
Blac
k Cr
eek
Tert
iary
Tertiary
Tertiary
Tert
iary
Middendorf
Middendorf/
Blac
k Cr
eek
Blac
k Creek/
Middendorf
F 1 or
i dan
F 1 ori
dan
F I ori dan
672-825
820-990
180-
300
162-297
194-
286
448-539
180-295
218-320
220-308
282-312
568-
770
360-600
285-576
96-150
140-200
145-
221
75 140 50 60 50 50 40 48 44 30 65 125 55 (OH)
(OH)
(OH)
10 8 10 12 12 12 18 8 8 12 12 18 8 12 12 16
2/80
3/78
1/79
2/73
3/78
5/78
7/62
6/68
5/68
9/68
1/78
11/51
10/7
7
3/74
6/75
12/80
2 -- 24 24 24 24 12 12 12 -- 17 24 12 8 8 12
1,25
01,
750
700
503
503
1,500
536
500
520
554
1,404
540
754
280
1,50
0
2,25
5
24 28 18 3.4
4.1
18 8.2
16 15 11 11 25 14 6.7
250 80.

Tabl
e 3.
--Se
lect
ed s
peci
fic-
capa
city
te
st an
d ge
nera
l well informat
ion-
-Con
tinu
ed
Coun
ty
well
No.
Beau
fort
BFT-1389
Berkeley
BRK-
26BR
K-47
BRK-
159
BRK-
166
BRK-
201
BRK-210
BRK-
213
BRK-
459
SCWR
C No.
Lati
tude
Long
i -
tude
Loca
tion
Aqui
fer
Coun
ty-
- Con
t i nued
28JJ-n2
Coun
ty15X-n1
22Y-
w117
BB-g
118X-r1
19Z-
s119
AA-W
219
BB-C
119Z-b5
3217
03
331735
3310
16325824
331619
3306
4733
0006
3259
3833
0938
8048
59
7941
1080
1717
8053
02795752
8001
0780
0256
8002
1980
0110
Waddell
Mari-
culture
Center
Jame
stow
nRidgevi lie
Cainhoy
Macbeth
Oakl
eyMt.
Holly
Goose
Creek
Moncks Corner
F 1 ori dan
Blac
k Cr
eek
F 1 ori
dan
F 1 ori
dan
F I ori
dan
F I ori
dan
F I ori dan
F I ori
dan
F I ori
dan
Scre
ened
Sc
reen
interval
leng
th
(fee
t)
(fee
t)
125-190
700-
880
283-372
219-315
40-102
64-252
65-3
23TD=322
195-305
(OH) 50 40 (OH)
(OH)
(OH)
(OH)
(OH) 75
Well
Da
te
Dura
tion
Pu
mpin
gdiameter
of
of te
st
rate
3 4
(inches) te
st
(hou
rs)
(gal
/min
)
14 16/6 6 6 4 6 8 8 18
3/83
24
5/80
241/
6519
7619
7419
7411/6
05/64
3/84
24
1,20
5
275
300
421 50 250
550
326
437
Specific
capacity
[(ga
l/mi
n)
/ft]
120 2.
34.
730. 3.8
6.2
14 5.6
6.6
Char
lest
on C
ount
yCH
N-13
6
CHN-167
CHN-
189
CHN-
294
CHN-314
CHN-
3/-'.
CHN-360
18DD-b1
17DD-g7
19EE
-d1
18CC-e1
20DD-y2
21EE-63
22FF
-p2
324920
3248
2932
4401
325413
324544
324403
323634
7956
57
795330
8003
23
795915
8009
52
801452
801953
Char
lest
onHeights
Moun
t Pleasant
Riverland
Terrace
Hanahan
Rantowles
Rave
nel
Litt
le Edisto
Isla
nd
F I ori
dan/
Tert
iary
Midd
endo
rfF I
ori dan/
Tert
iary
F I ori
dan
F I ori dan/
Tertiary
F I ori dan
Floridan
504-573
1,800-1,986
148-581
198-
361
150-
611
148-
555
103-
521
69 80 (OH)
(OH)
(OH)
(OH)
(OH)
6 8 4 6 6 4 4
4/60
2/83
241/
71
5/66
1979
7/56
4/69
220
1,04
0110
400
300 10 60
5.4
7.8
12 17 5.3
5.0
6.0
Ches
terf
ield
Cou
nty
CTF-55
22J-
J134
2802
8015
29McBee
Middendorf
214-325
4010
12/7
3 14
348
35
Clarendon
Coti
ntv
CLA-16
CLA-20
21S-r3
2lS-
m1
3341
37
3341
17
8012
47
8011
37
Manning
Manning
Black
Creek/
Midd
endo
rfBl
ack
Cree
k/Mi
dden
dorf
565-605
590-
640
25 50
6 8
1953
1964
200
752
15 22

Tabl
e 3.
--Se
lect
ed s
peci
f1c-
capa
city
tes
t an
d general
well informatio
n--C
onti
nued
County
SCWR
C well
No
. No
.
Clar
endo
n Co
unty
- -
CLA-22
19Q-i1
CLA-25
23T-
v1
Col leton
County
COL -20
26BB
-q1
COL -38
29AA
-k1
COL -49
26BB
-q3
COL -5
0 26CC-e2
Darlington C
ounty
DAR-35
171 -v
5DA
R-71
20K-t1
DAR-
77
19K-
g1DAR-80
19K-
f1
o
DAR-82
20K-
r1DA
R-86
17
L-m1
DAR-
87
19M-y1
DAR-
96
171 -v
3 DAR-105
19K-
g3
DAR-123
17L-
m2
Oil Ion
County
DIL-8
11J-
WDIL-74
11J-
J2DIL-85
1U-k
6DI
L-86
11
J-J5
DIL-
88
9L-b
1DIL-93
1U-v1
DIL-94
12K-
v1
Dorc
hest
er C
ount
yDO
R-36
24
Y-M
DOR -40
22Z-
g DO
R -42
23Y-
hDOR-73
22Z-x1
Lati
tude
Long
i -
tude
Loca
tion
Aquifer
Continued
335330
333539
325610
330214
325702
3254
47
3430
21342150
3423
1134
2301
342115
3417
54341012
3430
21
3423
09
3421
54
3425
21342800
3427
5634
2807
3419
58342512
342009
3313
37
330820
3313
3033
0538
800115
8021
19
8038
01805033
803758
803846
795122
8005
3680
0401
800412
8007
01795202
8004
06795122
8003
57
794510
792209
792030
792026
792030
791100
792141
792600
8027
01
802340
802700
801852
Turb
evil
leSummerton
Walterboro
Will
iams
Walterboro
Walterboro
Soci
ety
Hill
Hart
svi lie
Hart
svi lie
Hart
svi lie
Hart
svi lie
Darl
ingt
onLa
mar
Soci
ety
Hill
Hart
svi lie
Mech
anic
vi I le
Dill
onHa
mer
Hame
rHa
mer
Lake
View
Dill
onLa
tta
Harleyville
Dorchester
Harl
eyvi
I le
Ridgevi
1 le
Blac
k Creek
Midd
endo
rf
F 1 ori
dan
Blac
k Creek
Middendorf
Middendorf
Midd
endo
rfMi
dden
dorf
Middendorf
Middendorf
Middendorf
Midd
endo
rfMiddendorf
Midd
endo
rf
Midd
endo
rf
Midd
endo
rf
Midd
endo
rfMiddendorf
Middendorf
Middendorf
Middendorf
Middendorf
Middendorf
F 1 ori
dan
F 1
ori
dan
F I ori
dan
F I ori dan
Scre
ened
Screen
Well
Da
te
interval
length
diameter
of
(feet)
(feet)
(inches) te
st
200-
320
636-740
102-
628
650-700
1,60
2-1,
664
1,69
8-1,
760
127-
378
205-293
126-
166
204-236
208-
294
282-360
368-
476
175-373
133-
163
171-371
190-257
171-
405
138-
236
172-
316
503-569
258-319
340-
390
163-
289
206-
325
270-489
227-325
15 60 (OH) 50 62 62 168 50 23 32 50 40 60 85 20
200 38 140 60 50 35 61 50 55
(OH)
90 (OH)
8 8 10 10 6 6 8 10 8 10
12 12 8 18 8 16 10 8 10 12 8 8
20/10
10 6 10 12
1956
1970
1942
1963
3/70
9/70
1954
1962
1967
1970
3/
7119
7219
7211/75
1949
1956
10/65
1973
1972
1976
1980
1972
1960
9/70
Spec
ific
Du
rati
on
Pumping
capa
city
of test
rate
[(gal/min)
(hours)
(gal
/min
) /f
t]
24 24 -- -- -- -- 19 -- 24
24 -- 24 24 8 10 21 24 14 -- -- 24 --
150
525
240
328
1,25
41,431
240
800
278
530
1,43
0465
626
250
375
800
780
360
525
521
500
703
650
500
660
708
250
8.3
12 17 9.3
16 22 6.0
42 14 15
39 18 8.0
2.7
9.1
29 11 14 12 9.1
4.2
10. 8.4
8.6
41 6.2
14

Table
3.--
Sele
cted
spe
cifi
c-ca
paci
ty t
est
and
general
well in
form
atio
n--C
onti
nued
County
well
No
.
SCWR
C No
.
Lati
tude
Longi
tude
Location
Aqui
fer
Spec
i f i
c
Screened
Screen
Well
Date
Duration
Pumping
capa
city
interval
length
diam
eter
of
of te
st
rate
[(
gal/
min)
(feet)
(fee
t)
(inches) test
(hou
rs)
(gal
/min
) /f
t]
Dorc
hest
er County- -Continued
DOR -7
4DOR -149
Flor
ence
FLO-4
FLO-8
FLO-
10FL
O-17
FLO-
33FL
O-95
FLO- 105
FLO-113
FLO-114
FLO-
118
FLO-
125
FLO-
127
FLO-
148
FLO-153
FLO-154
FLO-
155
FLO-
156
FLO-161
FLO-
162
FLO-
179
FLO-
184
FLO-
188
FLO- 189
FLO-200
FLO-201
FLO-
202
FLO-204
23Z-g2
23AA-M
County
16M-t1
18N-
i313P-e1
16Q-
k216M-I1
16M-
d316Q-k1
16M-
W18P-s1
18N-
i615M-p1
16M-
S312
R-b3
18N-
i2-1
6M-r
1
12R-
b218P-v1
16M-
x1
16Q-
t2
17M-t1
12R-
6415
Q-e3
15Q-
e215
Q-q2
13N-
d214
M-p2
18N-
i5
3309
00330359
341153
340812
335944
335200
3412
02341413
335220
341055
3356
0634
0801
341134
3411
59334952
340813
341155
3349
58335559
3410
38
3351
29
3411
57334804
335500
335445
335140
340854
341122
340819
802315
8022
38
794550
795620
793405
794500
794540
7948
4779
4557
7947
5679
5601
795653
794452
7946
19792640
795619
794715
792648
795623
7948
51
794543
7950
57792652
794444
794434
794414
793339
793920
795609
Dorc
hest
erRi
dgev
i lie
Flor
ence
Timm
onsv
i I l
ePamplico
Lake
City
Flor
ence
Flor
ence
Lake
City
Florence
Olanta
Timm
onsv
i I l
eFl
oren
ceFlorence
Johnsonvi
1 le
Timmonsvi
1 le
Flor
ence
Johnsonvi
1 le
Olanta
Florence
Lake
City
Flor
ence
John
sonv
i 1 l
eSc
rant
onScranton
Lake
City
Mars
Bl
uff
Flor
ence
Timmonsvi
1 le
F I or
i dan
F I or
i dan
Middendorf/
Cape Fe
arBlack
Creek
Black
Creek
Black
Creek
Middendorf
Middendorf
Black
Creek
Black
Creek
Black
Creek
Black
Creek
Middendorf
Midd
endo
rfBlack
Creek
Middendorf
Middendorf/
Cape Fe
arMiddendorf
Black
Creek
Middendorf/
Cape Fe
arBlack
Creek/
Midd
endo
rfMi
dden
dorf
Black
Creek
Black
Creek
Black
Creek
Black
Creek/
Midd
endo
rfBlack
Creek
Middendorf
Middendorf
206-
325
65-396
261-726
156-
170
182-192
451-481
325-
648
330-375
152-
426
60-276
240-338
211-256
260-
495
309-495
264-496
355-475
303-
706
789-
870
175-
220
230-660
160-
556
306-
578
285-410
205-
420
200-430
280-580
106-
122
291-346
372-476
(OH)
(OH) 80 14 10 30 70 40 50 34 36 30 99 100 75 70 150 80 30 159 52 146 70 40 40 110 16 40 82
6 6 6 8 10 10 10 6 10 10 8 6 12 10 10 8 24 12 8 24 10 12 10 8 8 12 8 8 18
10/73
9/63
1/37
1911
3/47
8/47
2/53
5/54
6/55
12/55
9/53
1/59
24
1958
10/7
6 2
2/68
2412
/67
25
8/68
15/68
367/
71
71
1969
24
1963
2419
7819
7811/7
9 24
12/8
0 26
10/7
8 12
3/81
7
600
238
1,180
234
100
250
1,15
0340
1,250
450
450
488
1,000
700
500
517
1,46
9
668
300
1,25
0
750
1,30
0350
700
912
754
115
302
580
37 6.4
11 6.2
1.3
2.5
14 6.4
12 4.2
6.3
8.9
11 12 9.3
6.1
14 14 3.3
9.5
12 6.5
5.3
10.
14 6.6
2.3
6.0
3.7

Table
3.--
Sele
cted
specific-capacity t
est
and
gene
ral
well
informatio
n--C
onti
nued
ro
ro
Coun
ty
SCWRC
well
No.
No.
Lati
tude
Long
i -
tude
Location
Aqui
fer
Florence C
ounty- - Co
nt i nued
FLO-
211
16Q-
i2
FLO-247
15Q-
p3
Geor
geto
wn Co
unty
GEO-
9 10W-U
GEO-24
10W-
m4GEO-39
13V-
q1GEO-90
13V-
S1GEO-
105
7U-n
1GE
O-11
7 8V
-a1
GEO-
193
13V-
o2GE
O-21
0 8V-n1
GEO-211
9V-u2
GEO-
220
11S-
S2
GEO-
222
13V-
o3GE
O-22
7 9U
-r2
Hampton
County
HAM -3
1 34DD-y2
HAM -36
33DD-y5
HAM-46
32CC-U
Horr
y County
HO-314
50-g
5HO
-475
4P-u1
HO-513
8R-U
HO-659
6R-e
26HO
-751
50
-h1
HO- 859
7T-u
4
3353
21
335144
3322
0633
2217
3326
2733
2642
333255
3329
19
3327
29332706
332555
3341
57
332704
333144
323900
3245
2132
5238
3403
57335020
334736
334919
3403
19333535
794608
794421
791633
7917
2579
3345
7931
11790330
790512
793451
790806
791002
792112
793412
791256
805325
811400
8104
57
785346
7845
12790621
7859
54785240
790040
Lake
City
Lake
City
Geor
geto
wnGe
orge
town
Andrews
Andrews
Murrells Inlet
No.
Litc
hfie
ldBe
ach
Andrews
Pawleys
Isla
ndPawleys
Isla
ndDe
ep C
reek
Elem
. Sc
hool
Andrews
Plan
ters
vi lie
Yemassee
Esti
llHampton
Lori
sLo
ngs
Bucksport
Black
Mine
Lori
sGarden C
ity
Black
Creek/
Midd
endo
rfBl
ack
Creek/
Midd
endo
rf
Blac
k Creek
Cape Fe
arBlack
Creek
Blac
k Creek
Blac
k Creek
Black
Creek
Blac
k Creek
Blac
k Creek
Black
Creek
Blac
k Creek
Black
Creek
Black
Creek
F I on"
dan
F 1 ori
dan
Tertiary
Black
Creek
Blac
k Creek
Blac
k Creek
Surf
icial
Black
Creek
Black
Creek
Screened
Scre
en
interval
leng
th
(fee
t)
(fee
t)
285-574
406-613
385-875
1,19
0-1,
344
710-790
730-810
450-770
507-
557
598-792
420-602
450-
686
380-425
700-800
464-643
90-145
105-
152
640-
841
280-320
132-369
420-590
10-4
7260-320
340-700
90 85 50 55 80 80 100 50 67 170
130 30 80 110
(OH)
(OH)
125 40 60 90 37 60 200
Well
Da
te
diameter
of
(inc
hes)
te
st
12 18 8 824/8 20 8 10 20 10 10 6 16 8 12 10 16 10 10 8 4 10 12
8/82
8/83
11/43
10/4
93/
659/
745/77
2/79
1/75
10/82
10/82
8/83
9/84
11/84
1953
1959
1965
8/73
7/79
5/81
2/78
6/83
7/84
Dura
tion
Pumping
of te
st
rate
4
(hours)
(gal
/min
)
24 24 -- -- 24 48 24 7 48 24 23 24 22 24 -- 24 24 26 26 26 24 24
751
751
375 90 602
351
250 21 354
230
300
112
380
200
900
421
1,89
0
400
246
205 46 402
760
Spec
ific
ca
paci
ty
[(ga
l/mi
n)
/ft]
10 15 2.9
1.0
4.5
4.6
2.3
4.2
2.3
1.0
1.5
1.3
2.4
2.0
30 28 18 1.9
3.2
5.5
8.2
2.6
4.3

T abIe
3.-
- Selected
spec
ific
-cap
acit
y te
st an
d general
well information- -Cont i nu
ed
.
Coun
ty
SCWR
C well
No.
No. __________
Jasp
er Co
unty
JAS-101
30HH-f1
JAS-108
31GG-f1
JAS-111
31JJ
-02
JAS-158
29FF-g1
JAS-346
30HH-01
Kershaw
Coun
tyKE
R-69
22
J-y5
KER-
87
24K-p1
KER-101
28M-
w2KER-141
28N-J1
KER-
159
25L-C1
Lee
Coun
tyLE-1
2 21
M-g1
LE-1
5 21M-f1
LE-2
0 21M-o1
LE-27
2lM-
b2LE
-55
23N-
b3
I Pxinqton
Coun
ty
LEX -32
37Q-
a8
LEX -154
33Q-
k3LEX -159
33P-o1
LEX-180
34R-t1
LEX-191
31S-n1
LEX-195
37P-U11
LEX- 249
32Q-k1
LEX -608
36P-u1
Mari
on C
ount
yMR
N-37
A 11
M-q1
MRN-
42
11M-
x1
~
Lati
tude
i
3229
2032
2850
3217
2632
3757
3227
59
3425
2234
2112
3410
1834
0859
341927
341341
341306
3412
4234
1402
3409
38
3354
5933
5240
3357
1033
4612
3342
15
335501
3352
5233
5550
341101
341026
Longi
tude
8058
5080
5850
8104
37805311
805936
801951
8028
5380
4754
8045
3380
3235
8013
3280
1446
8014
1980
1103
8021
02
8130
3281
1000
8114
3081
1525
8103
10
8130
4781
0528
8125
04
7923
47
7923
42
_ -
- - -
Location
'
Ridge
I and
Cypress
Wood
sHardeevi lie
Poco
tali
goRi
dgel
and
Bethune
Cassatt
Elgin
Elgi
nShepard
Bish
opvi
lie
Bish
opvi
lle
Bish
opvi
lle
Bish
opvi
lle
Red
Hill
Leesvi lie
Edmu
ndLe
ton
Pel ion
Swan
sea
Leesvi lie
Glenn
Village
Summ
it
Mari
on
Mari
on
Aqui
fer
-"
F I ori dan
F I on"
dan
F I ori
dan
F I ori dan
Floridan
Middendorf
Middendorf
Middendorf
Middendorf
Middendorf
Middendorf
Middendorf
Middendorf
Middendorf
Blac
k Cr
eek
Midd
endo
rfMiddendorf
Middendorf
Middendorf
Blac
k Cr
eek/
Middendorf
Middendorf
Middendorf
Middendorf
Black
Creek/
Middendorf
Midd
endo
rf/
Black
Creek
__ .,-,.
"
Screened
inte
rval
(feet)
190-450
70-3
40182-600
90-167
130-220
90-1
4761
-92
116-141
115-147
136-170
243-320
276-312
217-
337
138-330
64-1
25
in QQ
3U-OO
150-264
75-1
05275-305
286-425
33-53
290-388
70-1
70
200-430
350-520
Scre
en
length
(feet)
(OH)
(OH)
(OH)
(OH)
(OH) 40 31 25 25 34 25 36 55 100 40 35 68 15 30 80 20 60 80 40 40
Well
diam
eter
(i
nche
s)
12 12 16 12 8 8 8 8 8 8 8 10 12 8 8 10
20 10 6 8 4 6 6 10
20/10
Date
- of
3 > test
1954
1953
1969
1953
7/84
1960
1970
1976
kill
1/83
1951
1968
1974
1977
1/81
2/70
1973
1970
11/7
7
4/76
1981
1981
1948
5/50
Dura
tior
of
te
st^
(hours)
3 8 24 4 10 -- 48 8 24 24 -- -- 22 24 24 24 24 -- 12 46 22 24 -- --
-
i Pumping
rate
(gal
/min
)
1,012
1,86
51,
040
900
270
448
264
203
150
250
510
542
750
1,10
045
4
150
500
150
284
1,000 60 120 95 400
525
- -
Specific
capac
i ty
[(ga
l/mi
n)
/ft]
140
120 98 45 78 6.
17.8
2.7
2.3
9.3
28 26 13 13 17 5.0
6.5
1.9
5.5
29 3.3
5.2
3.7
10 8.8

Table 3.
--Se
lect
ed s
peci
fic-
capa
city
tes
t and
gene
ral
well information--Continued
Coun
ty
well
No.
SCWR
C No
.
Lati
tude
Longi
tude
Loca
tion
Aqui
fer
Mari
on C
ount
y- - Co
nt i nued
MRN-
43MR
N-65
MRN-66
MRN-
72
MRN-81
MRN-
83
Marlboro
MLB-
51
MLB-
93ML
B-94
4>
MLB-109
MLB-110
MLB-112
MLB-131
MLB-139
MLB-140
MLB-142
MLB-149
MLB-160
MLB-
180
10M-
k211N-c1
10N-g1
11MT
1
10M-q1
10M-
U
County
15H-
S3
13G-W
15H-
t5
15J-d1
15J-
d215
H-I2
14G-U
15I-a1
15l-
i1
15H-
J215
H-t4
15H-r1
13H-
c2
3412
1934
0910
340855
3410
41
3411
38341226
343626
344012
343628
342943
342935
343715
344212
343404
3433
56
3438
48343636
3436
4734
3931
791530
7922
1579
1827
7923
12
791836
791658
794102
7932
24794036
7942
50794310
7941
15793626
794046
794106
794002
794052
794200
793216
Mu 1
1 i ns
Marion
near
Mul I ins
Marion
Mari
onMu
1 1 i
ns
Benn
etts
vi I le
McCo
llBe
nnet
tsvi
I le
Blenheim
Blen
heim
Benn
etts
vi 1 le
near
McCol I
Benn
etts
vi lie
Benn
etts
vi 1 le
Benn
etts
vi lie
Benn
etts
vi lie
Benn
etts
vi lie
McCo
ll
Black
Creek
Black
Creek
Black
Creek
Middendorf/
Black
Creek
Black
Creek
Black
Cree
k
Middendorf/
Cape Fe
arMiddendorf
Midd
endo
rf/
Cape
Fe
arMiddendorf
Middendorf
Cape Fe
arMi
dden
dorf
Middendorf
Middendorf
Middendorf
Middendorf
Middendorf
Middendorf
Screened
Scre
en
Well
Da
te
interval
leng
th
diameter
of
(fee
t)
(fee
t)
(inc
hes)
te
st
331-374
100-235
96-123
290-
497
182-355
178-
322
40-375
54-105
45-3
51
107-357
75-115
220-
345
65-100
65-125
72-132
60-160
45-1
3260
-140
80-212
43 48 27 55 55 50 110 14 48 141 40 125 20 60 60
80 62 40 75
12/1
010 6/4
10 10 12 10 8 10 10 10 8 6 10 10
10 ... 8 10
1951
1970
1972
1977
7/67
6/78
6/77
1954
1954
1957
1957
1958
11/7
7..
...
9/78
7/77
1/80
9/84
Spec i f i
c
Duration
Pumping
capacity
of te
st,
rate
[(
gal/
min)
4
(hours)
(gal/min)
/ft]
62 24 -- -- 24 24 24 -- -- 24 -- 12 24 25 23 24 2
514
339 87 955
402
400
350
340
800
508
325
200
151
350
560
351
500
200
403
7.9
6.4
3.6
7.0
6.8
3.8
3.3
5.2
5.6
15 16 2.0
5.4
18 4.6
6.1
10.
12 2.1
Orangeburg C
ounty
ORG-
30ORG-35
ORG-
37OR
G-49
ORG-84
ORG-
97OR
G-10
8
29V -c
31T-
n132T-s3
29V- 11
30W-k
32V- r3
27W-
U2
3329
1033
3750
3336
50332750
332240
332655
332100
805230
810400
810600
805130
810020
810730
804044
Orangeburg
North
Nort
hOrangeburg
Cope
Norway
Bowman
Tertiary
Tertiary
Tert
iary
Midd
endo
rfTe
rtia
ryTertiary
Black
Creek/
Middendorf
TD=192
131-162
95-1
2176
4-91
2TD
=147
170-231
588-940
29 31 16 90 (OH) 60 75
8 8 8 10 12 8 10
1956
1957
1963
1964
1973
1980
-- 20 5 24
500
350
260
1,01
2600
710
1,10
0
10.
50.
19 37 15 19 12

Tabl
e 3.
--Se
lect
ed s
pecific-capacity t
est
and(general
well
in
form
atio
n--C
onti
nued
Coun
ty
well
No.
SCWR
C No.
Lati
tude
Longi
-
tude
Location
Aqui
fer
Specific
Screened
Screen
Well
Date
Duration
Pumping
capacity
interval
leng
th
diam
eter
of
of test
rate
[(gal/min)
(fee
t)
(fee
t)
(inches)
test
(hou
rs)
(gal
/min
) /f
t]
Oran
gebu
rg County-
- Con
t i nue
dORG-109
ORG-123
ORG-200
ORG-216
ORG-218
ORG-221
ORG-222
ORG-227
ORG-
228
ORG-604
OR G-
605
R i ch
I and
RIC-25
RIC-
63RI
C-78
RIC-293
RIC-301
32T-
r
3lT-t1
29V- t1
23W-
k2
23V-
X1
26V- o1
26X-g1
31V-
q2
3lW-g1
32T-
J3l
T-m
Coun
ty28
Q-d1
26R-
C129P-r3
.29Q
-n1
26Q-X2
3336
41333625
3326
4633
2237
332522
3327
3933
1838
332653
3323
4033
3846
3337
52
3355
0033
4950
3356
31335244
335045
810608
810006
8050
5880
2007
802303
8040
01803858
8103
17
810250
8105
4181
0209
8048
00803820
805211
8053
36803802
Nort
hOr
ange
burg
Orangeburg
Euta
wvil
le
Eutawville
El loree
Bowman
Norway
Cope
Nort
hNo
rth
Conga ree
Eastover
Colu
mbia
Colu
mbia
East
over
Black
Creek
Blac
k Creek
Middendorf
F I on"
dan/
Blac
k Creek
F I on"
dan
/Black
Creek
Middendorf
F I on"
dan
Tertiary/
Blac
k Creek
Tertiary
Tertiary
Tertiary
Middendorf
Midd
endo
rfMi
dden
dorf
Midd
endo
rfBlack
Creek
238-476
218-318
843-944
179-
460
140-
424
707-1,007
40-3
0042
9-48
9
90-1
87210-261
122-
163
80-1
6041
7-54
216
2-29
4TD=161
220-
250
50 25 101
281
284
300
(OH) 60 (OH) 51 41 20 103 16 ... 30
10 4 10 16 16 16 6 10 16 8 8 8 20 8 6 12
11/7
9 24
1968
1980
24
1980
4
1980
1980
12
1981
1980
1980
6
1975
1975
24
1942
8/74
2419
56
1519
6819
70
759
100
1,585
1,74
2
1,25
3
2,200 50 750
1,50
050
325
0
150
2,000
300
325
524
22 17 48 29 16 60.
18 17 21 17 11 3.5
22 3.5
7.7
4.6
Sumter Co
unty
SU-7
SU-64
SU-7
2SU-72A
SU-7
8SU
-84
SU-8
5SU-122
SU-132
SU-1
36
23P-
t10
23P-t8
24P-
f124P-f2
23R-
o122
Q-e1
24P-
d122
Q-h1
22P-
y123Q-r2
3356
0833
5607
3358
51335830
3347
2733
5459
335905
3359
00335506
3351
56
802053
802100
802915
802903
8024
47801928
802832
801200
801924
802251
Sumter
Sumter
Shaw A
FBShaw A
FBSu
mter
Sumter
Shaw
AFB
Sumter
Sumt
erSumter
Middendorf
Midd
endo
rfBl
ack
Creek
Blac
k Creek
Blac
k Creek
Middendorf
Blac
k Creek
Black
Cree
kMiddendorf
Middendorf/
Blac
k Creek
415-625
493-607
270-340
240-340
126-
312
452-
720
167-278
73-97
406-
626
292-663
80 55 70 40 34 100 45 8
100
100
8 10 10 10 10 10 10 6 12 22
1941
24
1951
7/51
1956
5/59
819
5919
585/68
2010/65
24
1,25
090
060
050
375
21,404
850
100
1,825
1,75
0
29 28 19 7.2
10. 9.7
17 11 12 23

Tabl
e 3.
--Se
lect
ed sp
ecif
ic-c
apac
ity
test an
d general
well information--Continued
Coun
ty
well
No
.
SCWRC
No.
Lati-
Longi
tude
tu
deLo
cati
onAq
uife
rScreened
Scre
en
interval
length
(feet)
(feet)
Well
Date
diam
eter
of
(inc
hes)
te
st
Spec
i f i
c
Duration
Pumping
capacity
of test,
rate
[(
gal/
min)
4
(hou
rs)
(gal
/min
) /ft]
Sumter County-
- Con
t i nued
SU-137
SU-1
41SU-142
SU-145
SU-1
54SU
-166
SU-1
70SU
-198
SU-201
24P-
d225N-W1
24P-
e524
P-e2
25Q-
a224
P-e3
23Q-
t118
P-q1
25Q-
b1
335904
802834
340555
803213
335930
8030
0133
5938
80
2940
3355
41
803055
3359
40
802925
3351
18
802044
3356
42
7958
4733
5459
803103
Shaw A
FBRe
mber
tHi
gh Hills
High
Hi
lls
Wedgef iel
dHi
gh Hi
lls
Poca
lla
Woods
Bay
Wedgef iel
d
Black
Creek
Black
Creek
Black
Creek
Black
Creek
Black
Creek
Black
Creek
Black
Creek
Middendorf
Black
Creek
227-292
145-
161
299-
328
242-402
211-
237
292-444
TD=203
560-570
231-
286
65 16 26 65 26 72 15 10 30
10 6 6 8 6 8 6 6 10
1964
1970
1970
10/7
65/
693/74
1976
9/80
-- 24 24 24 24 24 -- 8 24
752 55 300
465
100
461
250
115
225
18 3.2
15 14 2.4
4.9
8.1
3.5
3.8
Will
iams
burg
Co
unty
WIL-3
WIL-
12WI
L-37
WIL-
38
16T-
e116S-y2
12S-
c116
S-d1
3339
54
7949
51334005
794915
3344
51
792710
3344
00
794805
Kingstree
King
stre
eHemingway
near
Kin
gstr
ee
Black
Creek
Black
Creek
Midd
endo
rfMiddendorf/
Cape
Fe
ar
400-
630
455-
520
833-
891
660-1,000
60 50 58 110
18/8
16/6
16/8
16/12
1941
8/52
1970
1969
-- -- 18 --
1,600
307
743
1,200
10. 5.8
14 19
See
table
1 for
aquifer
correlation.
Aquifer
name
s separated
by a
sl
ash
indi
cate
a m
ulti
aqui
fer
well or a
well in
whi
ch th
e aquifer
designation
is less certain.
The
first
aquifer
list
ed is th
e on
e for
which
the
test
is co
nsid
ered
to be m
ost
representative.
"Ter
tiar
y" in
dica
tes
Tertiary s
and
aquifer.
TD=x
indicates
tota
l depth
of well.
Scre
en"(
OH)"
in
dica
tes
the
well
is an
open
hole throughout the
desi
gnat
ed in
terv
al,
length ma
y be
less than s
creened
interval be
caus
e of
multiple well sc
reen
s.
Month/year or y
ear
only o
f test.
4 Because m
ost
test
s li
sted
in th
is ta
ble
are
well performance
test
s on
large
capacity m
unic
ipal
or in
dust
rial
wells,
it is
expe
cted
th
at the
duration o
f mo
st of th
e tests, for
whic
h no
dur
atio
n wa
s no
ted,
is a
t le
ast
8 ho
urs.

35 °
/*a
EX
PLA
NA
TIO
N
B
AR
IIWE
LL I
BA
MB
ER
G
4 - N
UM
BE
R O
F S
PE
CIF
IC-C
AP
AC
ITY
T
ES
TS
RE
PO
RTE
D F
OR
EA
CH
82
C
OU
NTY
LIS
TE
D I
N T
HIS
RE
PO
RT
0
10
2
0
30
4
0
50
MIL
ES
I L
I I
I I
80
C
Figure 6.--Reported specific-capacity tests.

not reported because they do not appear to be representative of aquifer transmissivity. Although this information should be applied cautiously, it is of value in estimating transmissivity and storage-coefficient values for the Coastal Plain aquifers.
SELECTED REFERENCES
Aucott, W. R., Davis, M. E., and Speiran, G. K., (in press), Geohydrologic framework for the Coastal Plain aquifers of South Carolina: U.S. Geo logical Survey Water-Resources Investigations Report 85-4271.
Aucott, W. R., and Speiran, G. K., 1985a, Ground-water flow in the Coastal Plain aquifers of South Carolina: Ground Water, v. 23, no. 6.
----- 1985b, Potentiometric surfaces of the Coastal Plain aquifers of South Carolina, prior to development: U.S. Geological Survey Water-Resources Investigations Report 84-4208, 5 sheets.
Bedinger, M. S., and Emmett, L. F., 1963, Mapping transmissibility of allu vium in the lower Arkansas River valley, Arkansas, in Short papers in geology and hydrology: U.S. Geological Survey Professional Paper 475-C, p. C188-C190.
Brown, R. H., 1963, Estimating the transmissibility of an artesian aquifer from the specific capacity of a well, in Methods of determining perme ability, transmissibility, and drawdown, Bentall, Ray, compiler: U.S. Geological Survey Water-Supply Paper 1536-1, p. 336-338.
Bush, P. W., 1982, Predevelopment flow in the Tertiary limestone aquifer,Southeastern United States; a regional analysis from digital modeling: U.S. Geological Survey Water-Resources Investigations Report 82-905, 41 p.
Cahill, J. M., 1982, Hydrology of the low-level radioactive-solid-wasteburial site and vicinity near Barnwell, South Carolina: U.S. Geologi cal Survey Open-File Report 82-863, 101 p.
Colquhoun, D. J., Woollen, I. D., Van Niewenhuise, D. S., Padgett, G. G., Oldham, R. W., Boylan, D. C., Bishop, J. W., andHowell, P. D., 1983, Surface and subsurface stratigraphy, structure and aquifers of the South Carolina Coastal Plain: University of South Carolina, Department of Geology, 78 p.
Cooke, C. W., 1936, Geology of the Coastal Plain of South Carolina: U.S. Geological Survey Bulletin 867, 196 p.
Cooper, H. H., Jr., and Jacob, C. E., 1946, A generalized graphical method for evaluating formation constants and summarizing well field history: American Geophysical Union Transactions, vol. 27, no. 4, p. 526-534.
Faye, R. E., and Prowell, D. C., 1982, Effects of Late Cretaceous andCenozoic faulting on the geology and hydrology of the Coastal Plain near the Savannah River, Georgia and South Carolina: U.S. Geological Survey Open-File Report 82-156, 73 p.
Ferris, J. G., Knowles, D. B., Brown, R. H., and Stallman, R. W., 1962, Thoery of aquifer tests: U.S. Geological Survey Water-Supply Paper 1536-E, 174 p.
Freeze, R. A., and Cherry, J. A., 1979, Groundwater: Englewood Cliffs, N.J., Prentice-Hall, 604 p.
Hantush, M. S., and Jacob, C. E., 1955, Non-steady radial flow in an infi nite leaky aquifer: American Geophysical Union Transactions, vol. 36, no. 1, p. 95-100.
Hayes, L. R., 1979, The ground-water resources of Beaufort, Colleton,Hampton, and Jasper Counties, South Carolina: South Carolina Water Resources Commission Report no. 9, 91 p.
28

Krause, R. E., 1982, Digital model evaluation of the predevelopment flowsystem of the Tertiary limestone aquifer, southeast Georgia, northeast Florida, and southern South Carolina: U.S. Geological Survey Water- Resources Investigations Report 82-173, 27 p.
Kruseman, G. P., and Ridder, N. A., 1979, Analysis and evaluation of pumping test data: International Institute for Land Reclamation and Improve ment, Bulletin 11, Wageningen, the Netherlands, 201 p.
Lohman, S. W., 1972, Ground-water hydraulics: U.S. Geological Survey Pro fessional Paper 708, 70 p.
Lohman, S. W., and others, 1972, Definitions of selected ground-waterterms--revisions and conceptual refinements: U.S. Geological Survey Water-Supply Paper 1988, 21 p.
Marine, I. W., 1979, Hydrology of buried crystalline rocks at the Savannah River Plant near Aiken, South Carolina: U.S. Geological Survey Open- File Report 79-1544, 160 p.
Marine, I. W., and Root, R. W., Jr., 1976, Summary of hydraulic conductivity tests in the SRP separations areas in Savannah River Laboratory envi ronmental transport and effects research annual report, 1975: Aiken, S.C., E. I. du Pont de Nemours and Company, Savannah River Laboratory, USERDA Report DP-1412.
Park, A. D., 1980, The ground-water resources of Sumter and Florence Coun ties, South Carolina: South Carolina Water Resources Commission Report No. 133, 43 p.
----- 1985, The ground-water resources of Charleston, Berkeley and Dor chester Counties, South Carolina: South Carolina Water Resources Com mission Report No. 139, 146 p.
Renken, R. A., 1984, The hydrogeologic framework for the southeastern United States Coastal Plain aquifer system: U.S. Geological Survey Water- Resources Investigations Report 84-4243.
Root, R. W., Jr., 1977, Results of pumping tests in shallow sediments in the separations areas in Savannah River Laboratory environmental transport and effects research annual report, 1976: Aiken, S.C., E. I. du Pont de Nemours and Company, Savannah River Laboratory, USERDA Report DP-1455.
Siple, G. E., 1946, Progress report on ground-water investigations in South Carolina: South Carolina Research, Planning and Development Board Bulletin No. 15, 166 p.
----- 1956, Memorandum on the geology and ground-water resources of theParris Island area, South Carolina: U.S. Geological Survey Open-File Report, 29 p.
----- 1957, Geology and ground water in parts of Aiken, Barnwell, and Alien- dale Counties, South Carolina: prepared for Savannah River Operations Office of the Atomic Energy Commission, copy on file with the U.S. Geo logical Survey, Columbia, S.C., 128 p.
----- 1959, Guidebook for the South Carolina Coastal Plain field trip of the Carolina Geological Society, Nov. 16-17, 1957: South Carolina State Development Board, Division of Geology Bulletin No. 24, 27 p.
----- 1967, Geology and ground water of the Savannah River Plant and vicin ity, South Carolina: U.S. Geological Survey Water-Supply Paper 1841, 113 p.
----- 1975, Ground-water resources of Orangeburg County, South Carolina: South Carolina State Development Board, Division of Geology Bulletin No. 36, 59 p.
29
Speiran, G. K., and Aucott, W. R., (in press), Effects of sediment deposi- tional environment on the geochemistry and quality of ground water in Cretaceous aquifers in the Coastal Plain of South Carolina: U.S. Geo logical Survey Water-Supply Paper.
Theis, C. V., 1935, The relation between the lowering of the piezometricsurface and the rate and duration of discharge of a well using ground- water storage: American Geophysical Union Transactions, vol. 16, p. 519-524.
Theis, C. V., Brown, R. H., and Meyer, R. R., 1963, Estimating the transmis sibility of aquifers from the specific capacity of wells: U.S. Geo logical Survey Water-Supply Paper 1536-1, p. 331-341.
Zack, A. L., 1977, The occurrence, availability, and chemical quality of ground water, Grand Strand area and surrounding parts of Horry and Georgetown Counties, South Carolina: South Carolina Water Resources Commission Report No. 8, 100 p., 9 plates.
* GOVERNMENT PRIHTIHG OFFICE: 1988 - 730135 / 40006
30