Embed Size (px)
Citation preview
Page 1/18
Functional Network Connectivity Imprint in FebrileSeizuresUllas V Acharya
National Institute of Mental Health and NeurosciencesKarthik Kulanthaivelu
National Institute of Mental Health and NeurosciencesRajanikant Panda
National Institute of Mental Health and NeurosciencesJitender Saini
National Institute of Mental Health and NeurosciencesArun K Gupta
National Institute of Mental Health and NeurosciencesBindu Parayil Sankaran
National Institute of Mental Health and NeurosciencesRaghavendra Kenchaiah
National Institute of Mental Health and NeurosciencesRavindranath Chowdary Mundlamuri
National Institute of Mental Health and NeurosciencesSanjib Sinha
National Institute of Mental Health and NeurosciencesMysore Lakshmikanta Keshavamurthy
Indira Gandhi Institute of Child HealthRose Dawn Bharath ( [email protected] )
National Institute of Mental Health and Neurosciences
Research Article
Keywords: Functional Connectivity, Febrile seizure, Hippocampus
Posted Date: March 29th, 2021
DOI: https://doi.org/10.21203/rs.3.rs-294273/v1
License: This work is licensed under a Creative Commons Attribution 4.0 International License. ReadFull License
Page 2/18
AbstractComplex febrile seizures (CFS), a subset of paediatric febrile seizures (FS), have been studied for theirprognosis, epileptogenic potential and neurocognitive outcome. We evaluated their functional connectivitydifferences with simple febrile seizures (SFS) in children with recent onset FS. Resting-state fMRI (rs-fMRI)datasets of 24 children with recently diagnosed FS (SFS-n=11; CFS-n=13) were analysed. Functionalconnectivity (FC) was estimated using time series correlation of seed region–to-whole-brain-voxels. Regionalconnectivity differences were correlated with clinical characteristics (corrected p < 0.05). CFS patientsdemonstrated increased FC of the bilateral middle temporal gyri (MTG), left supplementary cortex whencompared to SFS. Decreased FC of the primary sensory areas and Default mode network regions wereobserved in the CFS. Number of recurrent febrile seizures positively correlated with FC of bilateral MTG andnegatively correlated with left Supplementary Motor. Duration of longest febrile seizure correlated positivelywith connectivity of right MTG and left supplementary motor cortex. It also negatively correlated withconnectivity of bilateral post central gyrus and Precuneus. Our �ndings report altered connectivity in CFSproportional to the seizure recurrence and duration. Regardless of the causal/consequential nature, suchobservations demonstrate the imprint of these disease-de�ning variables of febrile seizures on thedeveloping brain.
IntroductionFebrile seizures (FS), are de�ned as seizures in children between 6 months to 5 years of age, accompaniedby fever, but without evidence of underlying central nervous system (CNS) infection 1. The de�nitionexcludes seizures in children due to neuroinfection, prior afebrile seizure, or a pre-existent CNS abnormality 2.It is the most common type of seizure in childhood, occurring in 2–5% of children 3. A polygenic basis forfebrile seizures is well elaborated with multiple candidate genes /loci described 4,5. Febrile seizures can besubtyped as either Simple Febrile Seizures (SFS) or Complex Febrile Seizures (CFS). SFS, accounting fortwo-thirds of FS, are typi�ed as a generalized convulsive episode of seizure without features suggesting afocal nature. They typically last for lesser than 15 minutes and do not recur within 24 hours. CFS usuallydemonstrate any of the following features: focal features; prolonged duration ( characterised as lasting morethan 15 minutes), seizure recurrence within 24 hours/index febrile illness; postictal neurological de�cits 6,7.
The immature brain is different from the adult brain in that it is more vulnerable to seizures, notwithstandingthe seizure characteristics, and therapeutic responses. Normal brain maturation is punctuated byoverexpression of factors enhancing neuronal excitability. The consequent relative imbalance in excitationvs inhibition is critical to synaptic plasticity and activity-directed synaptogenesis during development 8. Apertinent concern then is whether seizures in a growing brain can in�uence the neurocognitive outcome. Inthe context of short seizures provoked by fever (exempli�ed by SFS), prospective epidemiological studieshave demonstrated a benign outcome, without cognitive dysfunction or subsequent epilepsy9,10. Mostchildren who experience SFS do not develop (or are not associated with) structural mesial temporalabnormalities 11. Epilepsy frequency following SFS is estimated at 1.0-2.2 %, a �gure not any different fromthe normal population12. The relationship of CFS with temporal lobe epilepsy (TLE) is ridden with con�icting
Page 3/18
data. Retrospective risk-factor analyses have revealed that patients with intractable TLE happen to report ahistory of prolonged febrile seizures at higher frequency (30-60%) 9,13. CFS is associated with a heightenedrisk of epilepsy in 4.1-6.0 % of the cases 12. Min Lan Tsai et al, in a study on long term neurocognitiveoutcomes in subjects with CFS noted significantly lower full-scale intelligence quotient (FSIQ), perceptualreasoning index, and working memory index scores than in the control group14. Dube et al indicated thathyperthermic seizures in the immature rat model of FS do not cause spontaneous limbic seizures duringadulthood. 15. However, “prolonged” experimental FS led to later-onset limbic (temporal lobe) epilepsy andinterictal epileptiform EEG abnormalities in a signi�cant proportion of rats16.
Imaging literature towards understanding disease neurobiology of febrile seizures is sparse. Theodore et al.,in a study of 35 subjects presenting as refractory Complex Partial Seizures [CPS] with video-EEG of temporallobe onset found 9 patients with a prior presentation of CFS had smaller volumes of ipsilateral HippocampalFormation [HF]. FS in the clinical history had a predictive value on the severity of HF atrophy 17. To the bestof our knowledge, there are no studies that have evaluated connectivity differences in children with a recentdiagnosis of febrile seizure. With the above-cited differences in experimental, clinical and neurocognitiveoutcome pro�les as the background, we hypothesize that there could be differences in the connectivitypatterns between patients with SFS and CFS. To this end, we used functional connectivity patterns asderived from Blood Oxygen Level Dependent (BOLD) rs-fMRI in subjects with CFS and SFS.
Results24 subjects were included in the �nal analysis [Simple FS - 11 and Complex FS -13] within 12 days [IQR= 8.5-13.5] and 10 days [IQR = 9-30] after the last seizure respectively. Among the clinical variables analysed,namely mean age at onset, a number of recurrent febrile seizures, the maximum duration of febrile seizures,duration of the disease, none showed signi�cant between-group differences. Functional connectivity (FC)was estimated using time series correlation of seed region–to-whole-brain-voxels and the brain regionsshowing signi�cant between group connectivity differences were correlated with disease-de�ning clinicalcharacteristics. Our results revealed that CFS group had altered temporal lobe connectivity proportional torecurrences, and duration of the seizure.
Altered brain connectivity in complex febrile seizure
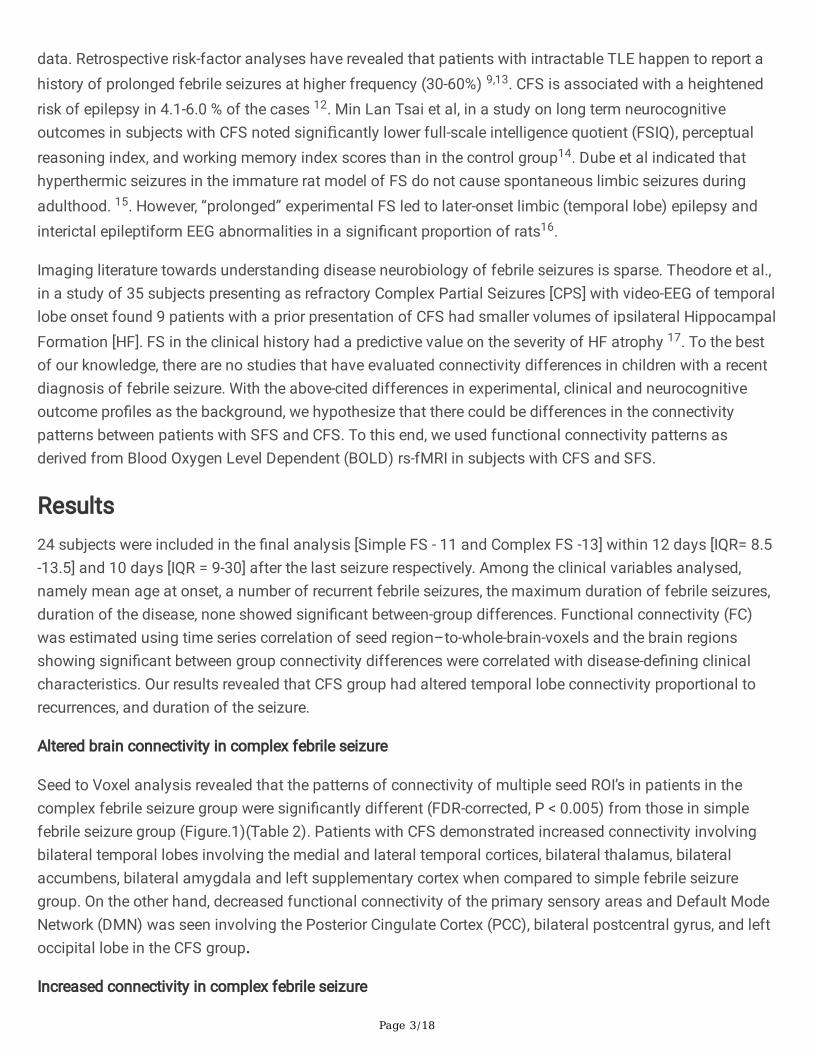
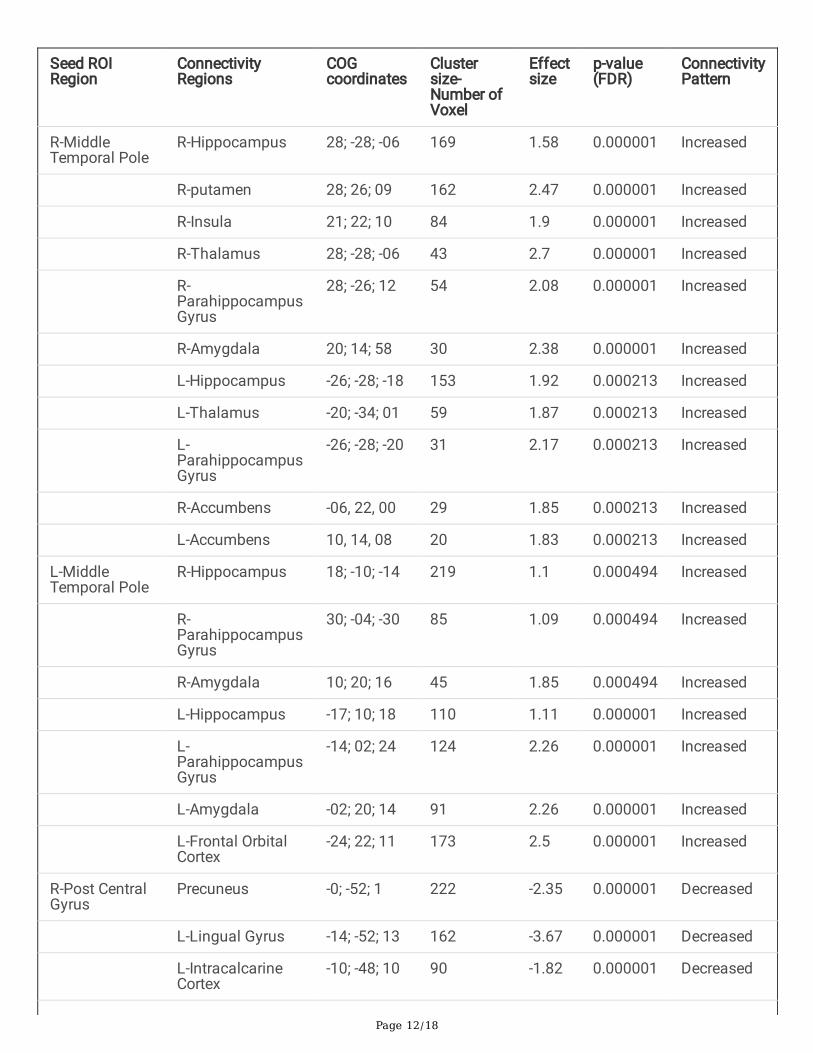
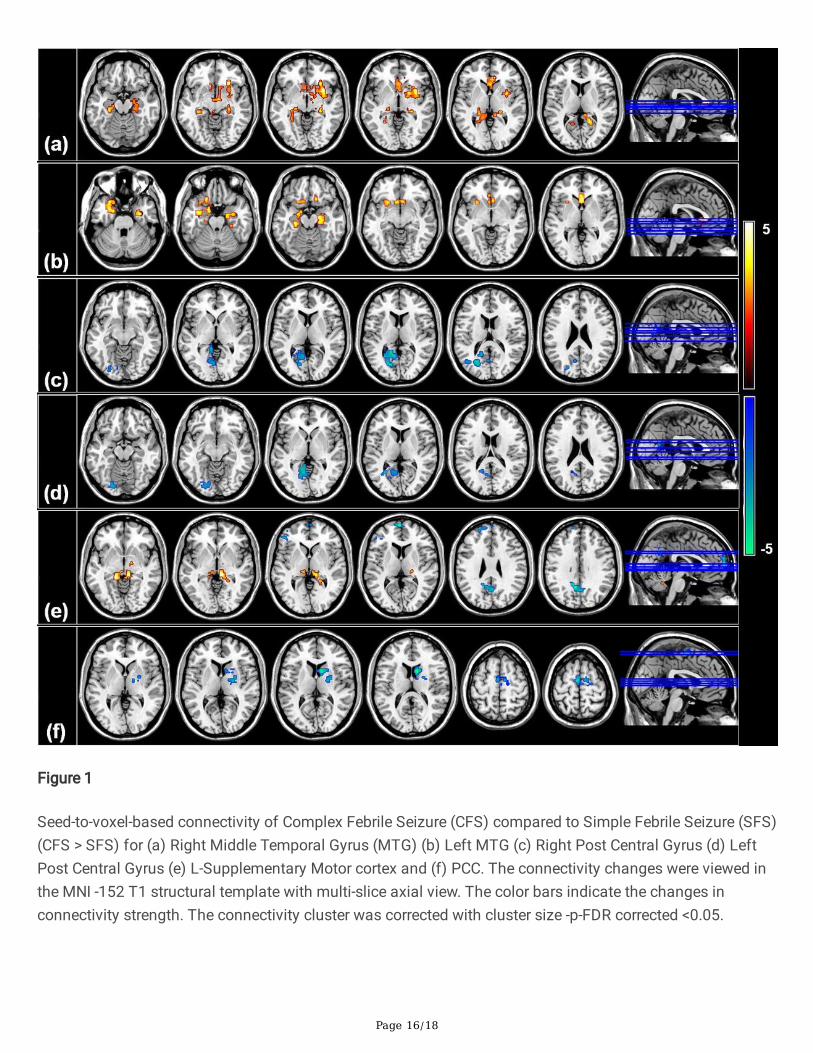
Seed to Voxel analysis revealed that the patterns of connectivity of multiple seed ROI’s in patients in thecomplex febrile seizure group were signi�cantly different (FDR-corrected, P < 0.005) from those in simplefebrile seizure group (Figure.1)(Table 2). Patients with CFS demonstrated increased connectivity involvingbilateral temporal lobes involving the medial and lateral temporal cortices, bilateral thalamus, bilateralaccumbens, bilateral amygdala and left supplementary cortex when compared to simple febrile seizuregroup. On the other hand, decreased functional connectivity of the primary sensory areas and Default ModeNetwork (DMN) was seen involving the Posterior Cingulate Cortex (PCC), bilateral postcentral gyrus, and leftoccipital lobe in the CFS group.
Increased connectivity in complex febrile seizure
Page 4/18
Bilateral middle temporal gyrus revealed increased functional connectivity with the bilateral hippocampus,bilateral parahippocampal gyrus and bilateral accumbens. Right middle temporal gyrus (Figure 1a) hadadditional increased connectivity with bilateral thalamus and ipsilateral amygdala and putamen. Left middletemporal gyrus (Figure 1b) demonstrated increased connectivity involving the amygdala bilaterally,ipsilateral orbitofrontal and subcallosal cortex. The left supplementary cortex revealed increasedconnectivity with the parahippocampal gyrus and bilateral thalamus.
Decreased connectivity in complex febrile seizure
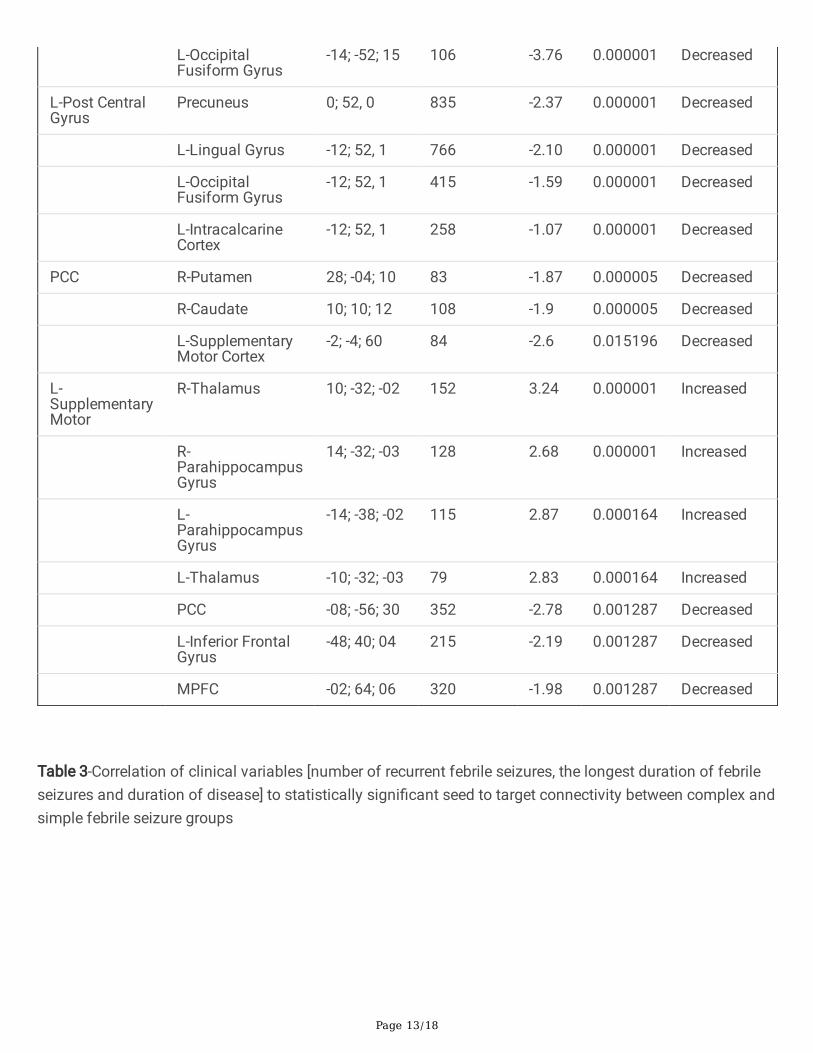
Precuneus and posterior cingulate cortex (Figure 1f) revealed decreased connectivity with bilateralsupplementary motor cortex, postcentral gyrus, bilateral caudate and right lentiform nucleus. Leftsupplementary motor cortex (Figure 1e), in addition, showed decreased connectivity with left inferior frontalgyrus. Bilateral postcentral gyri (Figure 1 c,d) showed additional decreased connectivity with left lingualgyrus, fusiform gyrus and intracalcarine cortex.
Altered connectivity proportional to the seizure recurrence and duration
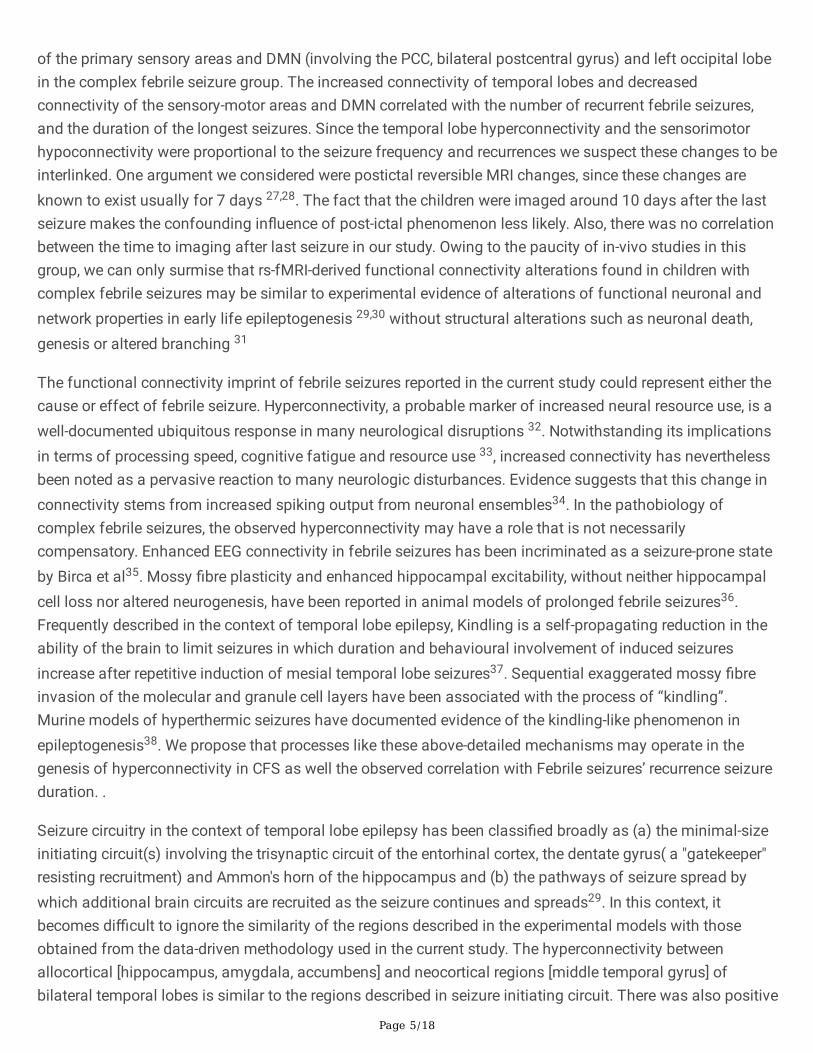
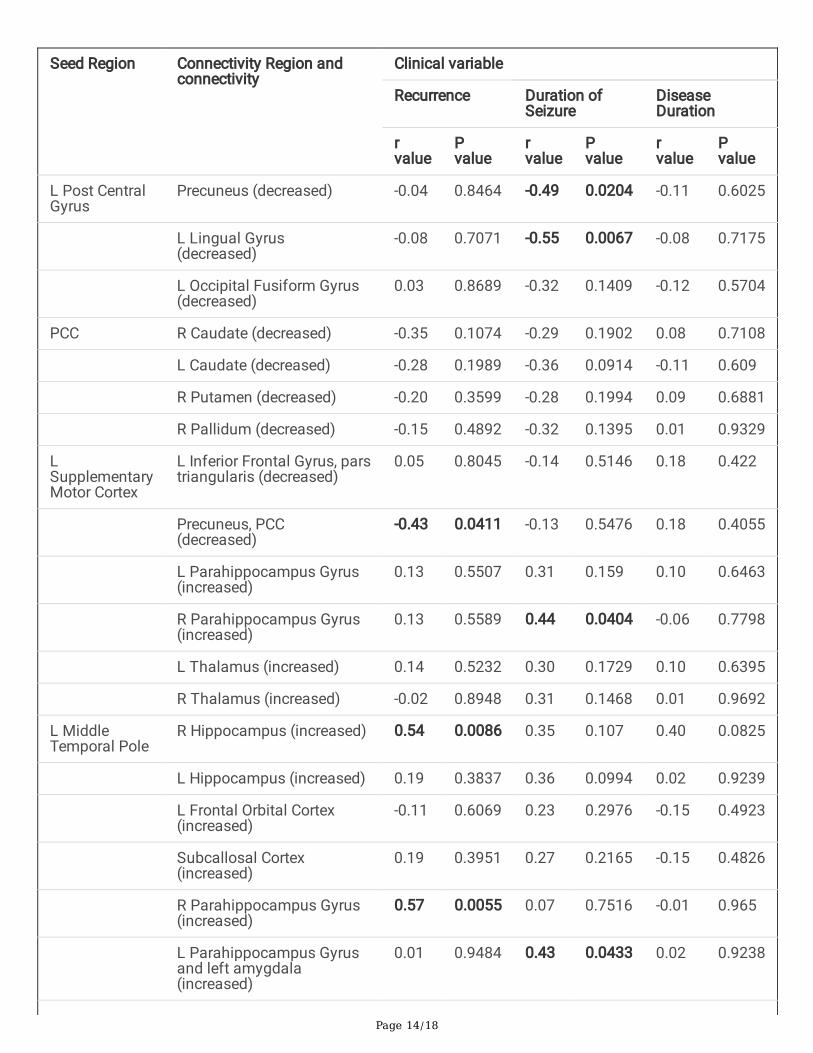
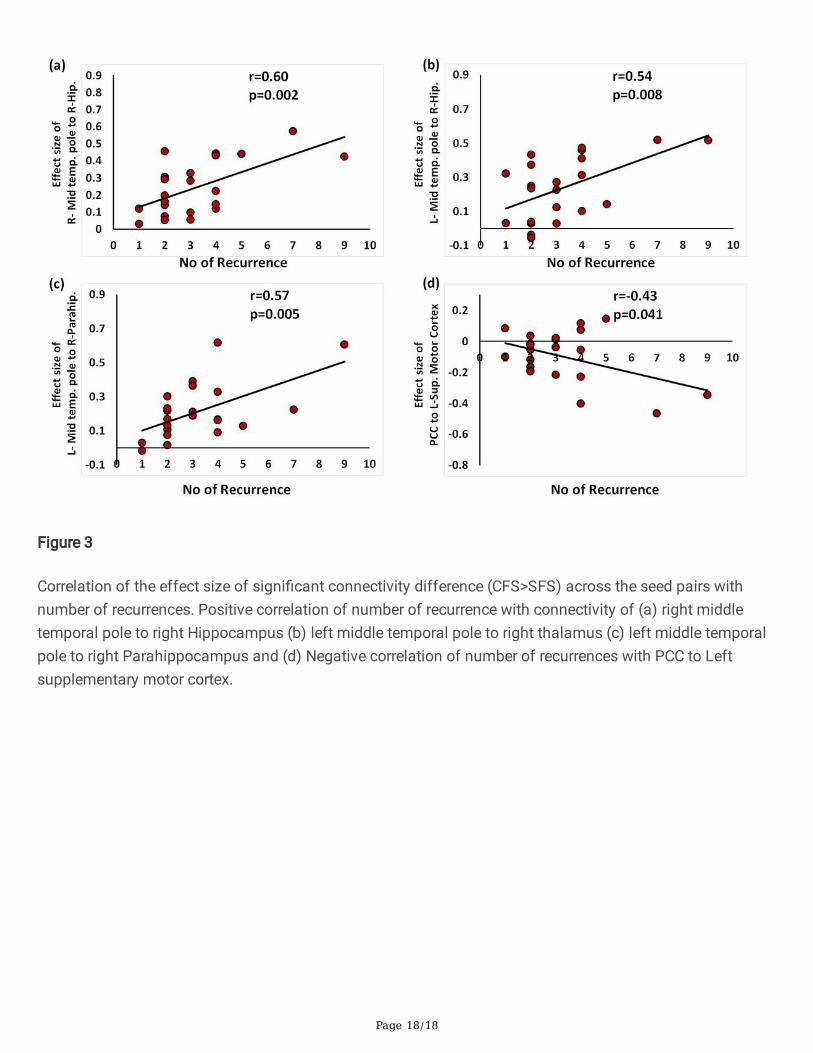
The number of recurrences of febrile seizures was positively correlated with brain functional connectivity ofbilateral middle temporal gyri to right Hippocampus [right: r = 0.6; p = 0.003; left: r = 0.54, p = 0.0086], andLeft Middle Temporal gyrus with right Parahippocampus [r = 0.57, p = 0.0055] and negatively correlated withleft Supplementary Motor to Precuneus [r = -.043, p = 0.041] (Figure 2; Table 3).
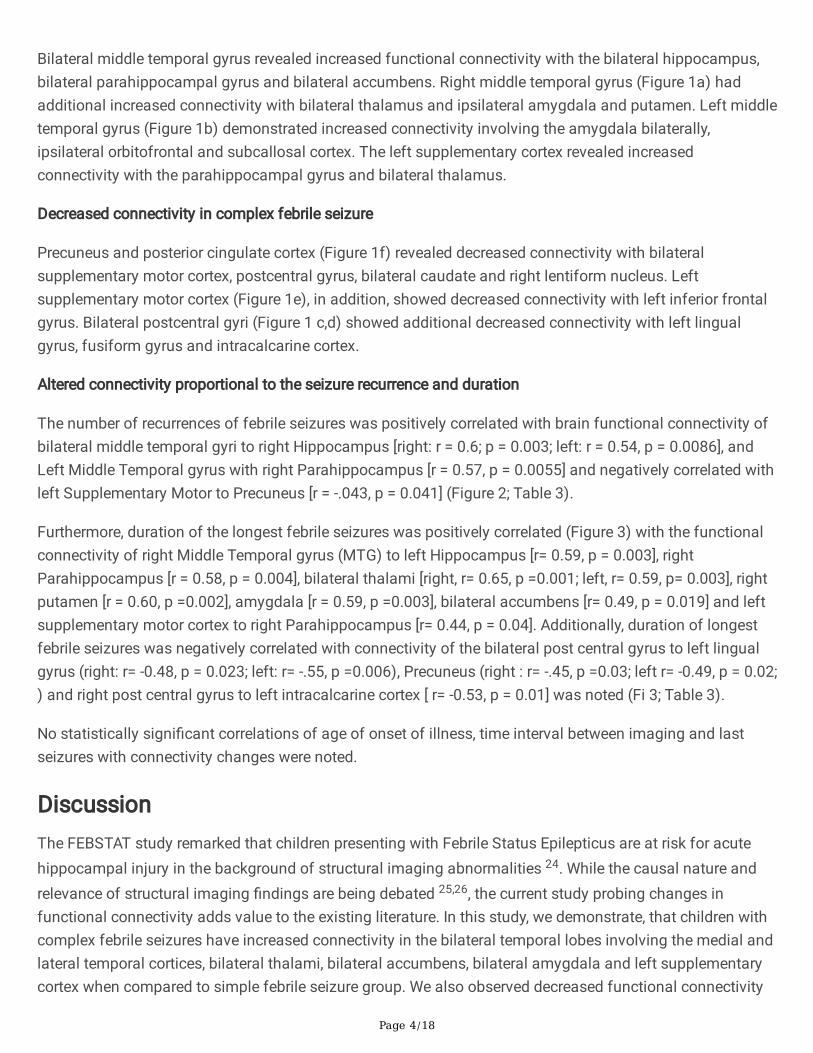
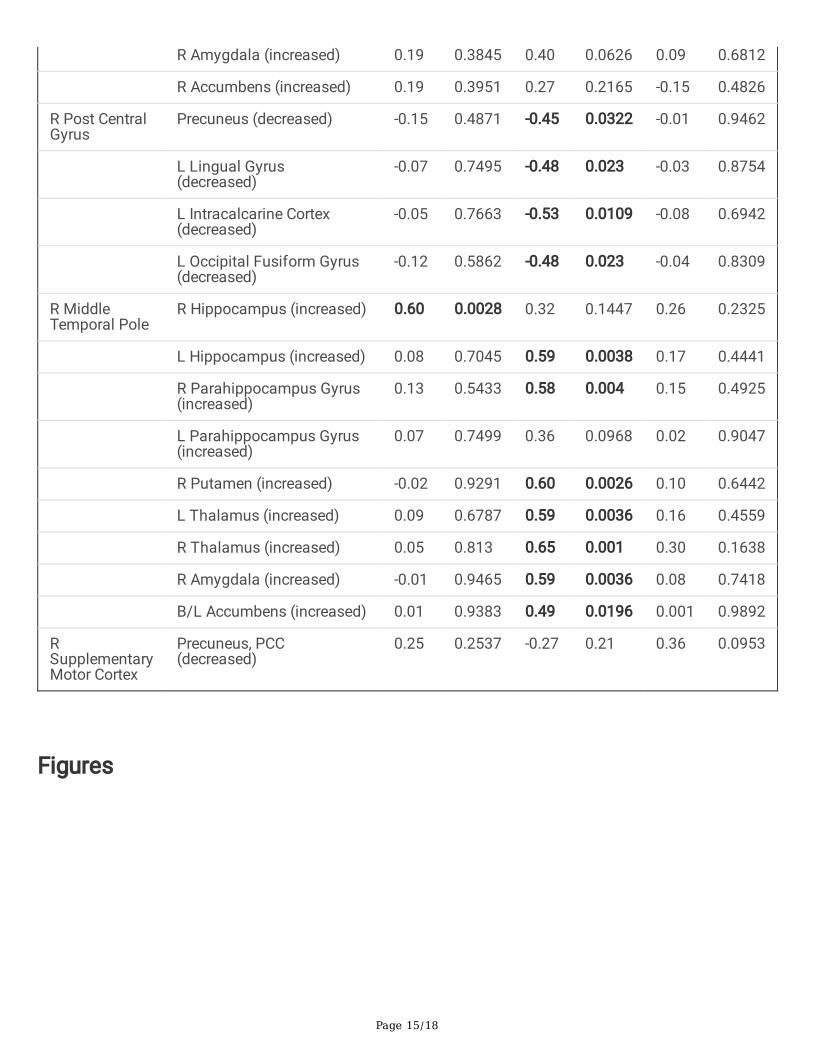
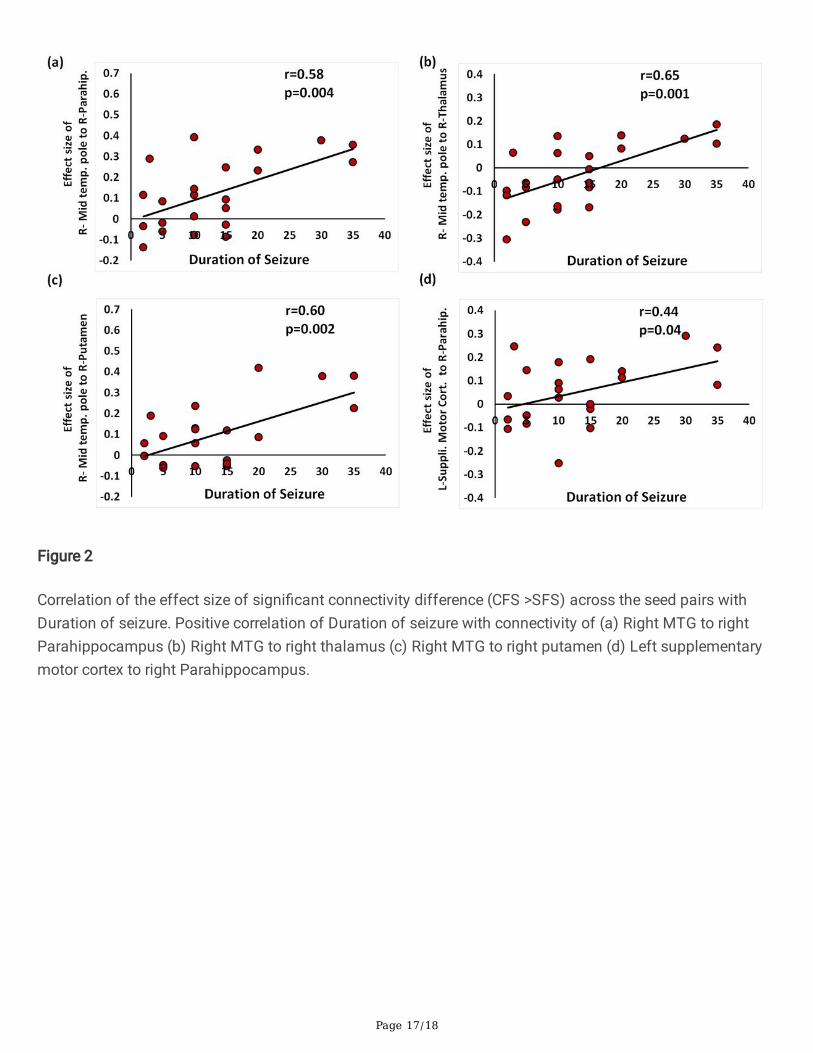
Furthermore, duration of the longest febrile seizures was positively correlated (Figure 3) with the functionalconnectivity of right Middle Temporal gyrus (MTG) to left Hippocampus [r= 0.59, p = 0.003], rightParahippocampus [r = 0.58, p = 0.004], bilateral thalami [right, r= 0.65, p =0.001; left, r= 0.59, p= 0.003], rightputamen [r = 0.60, p =0.002], amygdala [r = 0.59, p =0.003], bilateral accumbens [r= 0.49, p = 0.019] and leftsupplementary motor cortex to right Parahippocampus [r= 0.44, p = 0.04]. Additionally, duration of longestfebrile seizures was negatively correlated with connectivity of the bilateral post central gyrus to left lingualgyrus (right: r= -0.48, p = 0.023; left: r= -.55, p =0.006), Precuneus (right : r= -.45, p =0.03; left r= -0.49, p = 0.02;) and right post central gyrus to left intracalcarine cortex [ r= -0.53, p = 0.01] was noted (Fi 3; Table 3).
No statistically signi�cant correlations of age of onset of illness, time interval between imaging and lastseizures with connectivity changes were noted.
DiscussionThe FEBSTAT study remarked that children presenting with Febrile Status Epilepticus are at risk for acutehippocampal injury in the background of structural imaging abnormalities 24. While the causal nature andrelevance of structural imaging �ndings are being debated 25,26, the current study probing changes infunctional connectivity adds value to the existing literature. In this study, we demonstrate, that children withcomplex febrile seizures have increased connectivity in the bilateral temporal lobes involving the medial andlateral temporal cortices, bilateral thalami, bilateral accumbens, bilateral amygdala and left supplementarycortex when compared to simple febrile seizure group. We also observed decreased functional connectivity
Page 5/18
of the primary sensory areas and DMN (involving the PCC, bilateral postcentral gyrus) and left occipital lobein the complex febrile seizure group. The increased connectivity of temporal lobes and decreasedconnectivity of the sensory-motor areas and DMN correlated with the number of recurrent febrile seizures,and the duration of the longest seizures. Since the temporal lobe hyperconnectivity and the sensorimotorhypoconnectivity were proportional to the seizure frequency and recurrences we suspect these changes to beinterlinked. One argument we considered were postictal reversible MRI changes, since these changes areknown to exist usually for 7 days 27,28. The fact that the children were imaged around 10 days after the lastseizure makes the confounding in�uence of post-ictal phenomenon less likely. Also, there was no correlationbetween the time to imaging after last seizure in our study. Owing to the paucity of in-vivo studies in thisgroup, we can only surmise that rs-fMRI-derived functional connectivity alterations found in children withcomplex febrile seizures may be similar to experimental evidence of alterations of functional neuronal andnetwork properties in early life epileptogenesis 29,30 without structural alterations such as neuronal death,genesis or altered branching 31
The functional connectivity imprint of febrile seizures reported in the current study could represent either thecause or effect of febrile seizure. Hyperconnectivity, a probable marker of increased neural resource use, is awell-documented ubiquitous response in many neurological disruptions 32. Notwithstanding its implicationsin terms of processing speed, cognitive fatigue and resource use 33, increased connectivity has neverthelessbeen noted as a pervasive reaction to many neurologic disturbances. Evidence suggests that this change inconnectivity stems from increased spiking output from neuronal ensembles34. In the pathobiology ofcomplex febrile seizures, the observed hyperconnectivity may have a role that is not necessarilycompensatory. Enhanced EEG connectivity in febrile seizures has been incriminated as a seizure-prone stateby Birca et al35. Mossy �bre plasticity and enhanced hippocampal excitability, without neither hippocampalcell loss nor altered neurogenesis, have been reported in animal models of prolonged febrile seizures36.Frequently described in the context of temporal lobe epilepsy, Kindling is a self-propagating reduction in theability of the brain to limit seizures in which duration and behavioural involvement of induced seizuresincrease after repetitive induction of mesial temporal lobe seizures37. Sequential exaggerated mossy �breinvasion of the molecular and granule cell layers have been associated with the process of “kindling”.Murine models of hyperthermic seizures have documented evidence of the kindling-like phenomenon inepileptogenesis38. We propose that processes like these above-detailed mechanisms may operate in thegenesis of hyperconnectivity in CFS as well the observed correlation with Febrile seizures’ recurrence seizureduration. .
Seizure circuitry in the context of temporal lobe epilepsy has been classi�ed broadly as (a) the minimal-sizeinitiating circuit(s) involving the trisynaptic circuit of the entorhinal cortex, the dentate gyrus( a "gatekeeper"resisting recruitment) and Ammon's horn of the hippocampus and (b) the pathways of seizure spread bywhich additional brain circuits are recruited as the seizure continues and spreads29. In this context, itbecomes di�cult to ignore the similarity of the regions described in the experimental models with thoseobtained from the data-driven methodology used in the current study. The hyperconnectivity betweenallocortical [hippocampus, amygdala, accumbens] and neocortical regions [middle temporal gyrus] ofbilateral temporal lobes is similar to the regions described in seizure initiating circuit. There was also positive
Page 6/18
connectivity of right middle temporal gyrus to bilateral thalami and bilateral thalami to the leftsupplementary motor cortex which in turn had increased connectivity to bilateral parahippocampal gyri,probably indicating pathways of spread.
Decreased metabolic activity is observed in the default mode network in absence seizures throughmultimodal electrophysiologic and neuroimaging methods, possibly re�ecting the theorem of “networkinhibition hypothesis” 39. It is analogous to the activity-dependent push-pull mechanism between variouscircuits operating in normal physiological conditions. The observation of commensurate decreasedconnectivity of the DMN and sensorimotor regions observed in CFS patients in our study could then indicatethis compensatory phenomenon to the increased demand in the seizure circuitry. In the absence oflongitudinal studies/ follow-up for the outcome, the translational clinical relevance of the observed alteredconnectivity will remain obscure. We speculate that the observed altered connectivity could fall in thecontinuum of pathophysiology in children with complex febrile seizures.
Though the study has advanced the knowledge of the neurobiology of febrile seizures, it needs to be notedthat imaging was performed in natural sleep due to ethical aspects of giving sedation in children undergoingimaging for febrile seizures. In this precarious situation, it was di�cult to monitor the stages of sleep andhence the confounding effects of various stages of sleep on results cannot be eliminated. For the samereason, a lack of control group might also seem to be a limitation, but there is evidence for advantages ofdisease matched controls in evaluating heterogeneous diseases like epilepsy40. Results of our study arebased on the group-level analysis between the two groups and might not be relevant to an individual patient.We lost signi�cant data of 9 children due to uncorrectable head motion due to snoring and hence the studysample size is small and generalizability to a larger population becomes di�cult. Larger samples withlongitudinal observations and the clinical outcome would add further evidence to the above observations.
ConclusionsChildren with recently diagnosed complex febrile seizures reveal altered connectivity in several regionsincluding temporal lobes proportional to the frequency, and duration of the seizure. This evidence is in tunewith experimental evidence in febrile seizures but will require larger longitudinal studies to ascertain clinicalrelevance.
Materials And MethodsThe prospective study was conducted at a tertiary care referral centre for neurologic disorders in childrenwith recent onset febrile seizures Written informed consent was obtained from the caregiver of eachparticipant, and the study was approved by the NIMHANS Human Ethics Committee-Basic andNeurosciences Division to be performed in children without using sedation. Hence all children underwentimaging while they were naturally sleeping inside the MRI gantry. This was associated with increased scantime, due to multiple pauses and restarts and resultant loss of data in nine subjects
Study population

Page 7/18
Thirty -three patients with febrile seizures were recruited - [Simple FS -19; Complex FS -14]. Con�rmation ofthe diagnosis of febrile seizures was based on clinical parameters and biochemical investigations accordingto the American Academy of Pediatrics guidelines18. After exclusion of subjects with uncorrectable headmotion, 24 subjects were included in the �nal analysis [Simple FS - 11 and Complex FS -13]. The Male:Female ratio was 10:3 and 8:3 in the CFS and SFS groups respectively(p=1.0). A positive family history ofseizures was present in four and three patients in the CFS and SFS groups respectively. Time interval fromthe last seizure to the MR imaging for the CFS and SFS groups were 12 days [IQR= 8.5 -13.5] and 10 days[IQR = 9-30] respectively. Among the clinical variables analysed viz mean age at onset, a number of recurrentfebrile seizures, the maximum duration of febrile seizures, duration of the disease, none showed signi�cantbetween-group differences.
The demographic and clinical features of the patients are provided in Table 1
Image acquisition
MRI was performed in a 3 Tesla scanner (SKYRA, Siemens, Erlangen, Germany). Child was allowed to sleepin the gantry room in the hands of the parent after ensuring that they both were metal free after the roomlights were dimmed. Once the child was asleep in the MR environment, trained technologist transferred thechild on the table and positioned with minimum disturbance to the sleeping child wrapped in a blanket. If atany point the child woke up, the entire cycle was repeated. Head was well supported with soft pads. 32Channel head coil was used. The resting-state fMRI acquisition (rs-fMRI) using blood oxygen level-dependent (BOLD) contrast were as follows: 200 volumes, repetition time 2030ms, 40 slices, 3 mm slicethickness, FOV 195×195 mm, matrix 64×64, refocusing pulse 90°, voxel size-3 x 3 x 3mm The total time ofacquisition for rs-fMRI was 6 minutes 52 seconds. Anatomic images were acquired by using a 3D T1-weighted MPRAGE sequence in 192 sagittal sections with a TR of 1900ms, TE of 2.5ms, a TI of 900ms, aFOV of 256 x 256 and a section thickness of 1mm. Oblique Coronal T2 Fast Spin Echo (FSE) plannedperpendicular to the hippocampus was also done to rule out other structural abnormalities. Structuralimaging revealed that one patient with complex febrile seizure had bulky and T2 hyperintense righthippocampus. Rest of the imaging studies did not reveal any abnormality.
Image analysis
Pre-processing- Image analysis was performed using Statistical Parametric Mapping 8 (SPM8)(http://www.�l.ion.ucl.ac.uk/spm/software/spm8). Following realignment, co-registration of the T1 Imagesto the EPI counterparts was done. Segmentation of data to grey, white matter, CSF tissue probability mapswere done. The normalization step warped each individual subject imaging space into a standard space(University of North Carolina, UNC paediatric [two years] standard space). It was done independently for bothstructural and functional images.
Anatomic Parcellation - The fMRI data were segmented into 90 anatomic ROIs on the basis of a University ofNorth Carolina [UNC] paediatric [two years] atlas for whole-brain regions by using the anatomically labelledtemplate reported by Shi et al, 201119.
Page 8/18
Functional Connectivity Analysis - A seed-to-voxel–based functional connectivity analysis was performed bycomputing the temporal correlation between the blood oxygen level-dependent signals to create a correlationmatrix showing connectivity from a seed region to all other voxels in the brain by using the functionalconnectivity toolbox (CONN, version 17) implemented in SPM8 (http://www.nitrc.org/projects/conn)20.Meanwhile source reduction of WM and CSF-related physiologic noises was carried out before connectivityestimation, by using the CompCor algorithm21. Bivariate correlations were analysed so as to re�ectconnections between the seed region to the rest of the brain voxels. Then Fisher’s r-to-z transformation wasused on the connectivity matrix. This was followed by a general linear model that was designed to determinethose statistically signi�cant BOLD signal correlation between the mean time series from each seed ROI andthat of every other brain voxel, at the individual subjects’ level (�rst-level analysis) 22,23.
Second-level random-effects analysis was used to create within-group statistical parameter maps for eachnetwork and to examine connectivity differences between groups. The group mean effects were estimatedfor both groups. Statistically signi�cant, FDR corrected (p <0.05), seed to target connectivity was calculatedusing 2nd level co-variate analysis. Pearson linear correlation was performed between clinical variables[number of recurrent febrile seizures, the longest duration of febrile seizure, duration of disease, age of onsetand time interval between last seizures and MRI] using the effect size of statistically signi�cant seeds totarget connectivity. The correlation coe�cient, r (rho) and statistical signi�cance, p values were calculatedfor each of these connectivity using MATLAB. Positive correlations were designated with a plus (“+”) signand negative correlations with a minus (“-“) sign.
DeclarationsAcknowledgements- We thank the children with febrile seizures and their parents for being part of the study.We also thank the staff and students of the department of Neuroimaging and Interventional Radiology fortheir support during data acquisition.
Author contributions
RDB, SS, PSB designed research. JS, AKG, KR, RCM, KML recruited patients. UVA, KK, RP acquired andanalysed the data. UVA, KK, RP and RDB wrote the manuscript. All authors contributed to result interpretationand editing of the manuscript.
Disclosure of Con�icts of Interest
None of the authors has any con�ict of interest to disclose.
References1. Steering Committee on Quality Improvement and Management, Subcommittee on Febrile Seizures.
Febrile Seizures: Clinical Practice Guideline for the Long-term Management of the Child With SimpleFebrile Seizures. PEDIATRICS121, 1281–1286 (2008).
Page 9/18
2. Offringa, M. & Moyer, V. A. Evidence based paediatrics: Evidence based management of seizuresassociated with fever. BMJ323, 1111–1114 (2001).
3. Stafstrom, C. E. Chapter 1 - The Incidence and Prevalence of Febrile Seizures. in Febrile Seizures (eds.Baram, T. Z. & Shinnar, S.) 1–25 (Academic Press, 2002). doi:10.1016/B978-012078141-6/50003-2.
4. Baulac, S. et al. Fever, genes, and epilepsy. Lancet Neurol.3, 421–430 (2004).
5. Nakayama, J. Progress in searching for the febrile seizure susceptibility genes. Brain Dev.31, 359–365(2009).
�. Waruiru, C. Febrile seizures: an update. Arch. Dis. Child.89, 751–756 (2004).
7. Berg, A. T. & Shinnar, S. Complex febrile seizures. Epilepsia37, 126–133 (1996).
�. Jensen, F. E. & Sanchez, R. M. Chapter 11 - Why Does the Developing Brain Demonstrate HeightenedSusceptibility to Febrile and Other Provoked Seizures? in Febrile Seizures (eds. Baram, T. Z. & Shinnar,S.) 153–168 (Academic Press, 2002). doi:10.1016/B978-012078141-6/50013-5.
9. Cendes, F. & Andermann, F. Early childhood prolonged febrile convulsions, atrophy and sclerosis ofmesial structures, and temporal lobe epilepsy: 6.
10. Shinnar, S. & Glauser, T. A. Febrile seizures. J. Child Neurol.17, S44–S52 (2002).
11. Theodore, W. H. Do Febrile Seizures Cause Mesial Temporal Sclerosis? Epilepsy Curr.3, 121–122 (2003).
12. Pavlidou, E., Hagel, C. & Panteliadis, C. Febrile seizures: recent developments and unansweredquestions. Childs Nerv. Syst.29, 2011–2017 (2013).
13. Characteristics of medial temporal lobe epilepsy: I. Results of history and physical examination - French- 1993 - Annals of Neurology - Wiley Online Library.https://onlinelibrary.wiley.com/doi/abs/10.1002/ana.410340604.
14. Tsai, M.-L., Hung, K.-L., Tsan, Y.-Y. & Tung, W. T.-H. Long-term neurocognitive outcome and auditoryevent-related potentials after complex febrile seizures in children. Epilepsy Behav.47, 55–60 (2015).
15. Dube, C. et al. Prolonged febrile seizures in the immature rat model enhance hippocampal excitabilitylong term. Ann. Neurol.47, 336–344 (2000).
1�. Dubé, C. et al. Temporal lobe epilepsy after experimental prolonged febrile seizures: prospectiveanalysis. Brain129, 911–922 (2006).
17. Theodore, W. H. et al. Hippocampal atrophy, epilepsy duration, and febrile seizures in patients withpartial seizures. Neurology52, 132–132 (1999).
1�. Management, S. C. on Q. I. and & Seizures, S. on F. Febrile Seizures: Clinical Practice Guideline for theLong-term Management of the Child With Simple Febrile Seizures. Pediatrics121, 1281–1286 (2008).
19. Shi, F. et al. Infant Brain Atlases from Neonates to 1- and 2-Year-Olds. PLoS ONE6, e18746 (2011).
20. Whit�eld-Gabrieli, S. & Nieto-Castanon, A. Conn: A Functional Connectivity Toolbox for Correlated andAnticorrelated Brain Networks. Brain Connect.2, 125–141 (2012).
21. Behzadi, Y., Restom, K., Liau, J. & Liu, T. T. A Component Based Noise Correction Method (CompCor) forBOLD and Perfusion Based fMRI. NeuroImage37, 90–101 (2007).
22. Whit�eld-Gabrieli, S. & Ford, J. M. Default mode network activity and connectivity in psychopathology.Annu. Rev. Clin. Psychol.8, 49–76 (2012).
Page 10/18
23. Lindquist, M. A., Loh, J. M., Atlas, L. Y. & Wager, T. D. Modeling the Hemodynamic Response Function infMRI: E�ciency, Bias and Mis-modeling. Neuroimage45, S187–S198 (2009).
24. Shinnar, S. et al. MRI abnormalities following febrile status epilepticus in children: The FEBSTAT study.Neurology79, 871–877 (2012).
25. Grillo, E. & Ronaldo J. M. da Silva, F. MRI peri-ictal abnormalities in febrile status epilepticus. Cause orconsequence? (2020).
2�. Berg, M. J. & Abou-Khalil, B. Childhood febrile status epilepticus: Chicken or egg? Does it matter?Neurology79, 840–841 (2012).
27. Silverstein, A. M. & Alexander, J. A. Acute postictal cerebral imaging. Am. J. Neuroradiol.19, 1485–1488(1998).
2�. Szabo, K. et al. Diffusion-weighted and perfusion MRI demonstrates parenchymal changes in complexpartial status epilepticus. Brain128, 1369–1376 (2005).
29. Bertram, E. The relevance of kindling for human epilepsy. Epilepsia48 Suppl 2, 65–74 (2007).
30. Lothman, E. W., Bertram, E. H. & Stringer, J. L. Functional anatomy of hippocampal seizures. Prog.Neurobiol.37, 1–82 (1991).
31. McClelland, S., Dubé, C. M., Yang, J. & Baram, T. Z. Epileptogenesis after prolonged febrile seizures:Mechanisms, biomarkers and therapeutic opportunities. Neurosci. Lett.497, 155–162 (2011).
32. Hillary, F. G. et al. Hyperconnectivity is a fundamental response to neurological disruption.Neuropsychology29, 59–75 (2015).
33. Nakamura, T., Hillary, F. G. & Biswal, B. B. Resting network plasticity following brain injury. PloS One4,e8220 (2009).
34. Chawla, D., Lumer, E. D. & Friston, K. J. Relating macroscopic measures of brain activity to fast, dynamicneuronal interactions. Neural Comput.12, 2805–2821 (2000).
35. Birca, A. et al. Enhanced EEG connectivity in children with febrile seizures. Epilepsy Res.110, 32–38(2015).
3�. Bender, R. A., Dubé, C., Gonzalez-Vega, R., Mina, E. W. & Baram, T. Z. Mossy �ber plasticity and enhancedhippocampal excitability, without hippocampal cell loss or altered neurogenesis, in an animal model ofprolonged febrile seizures. Hippocampus13, 399–412 (2003).
37. Goddard, G. V., McIntyre, D. C. & Leech, C. K. A permanent change in brain function resulting from dailyelectrical stimulation. Exp. Neurol.25, 295–330 (1969).
3�. Dayao Zhao, Xiru Wu, Yinquan Pei, & Qihua Zuo. Kindling phenomenon of hyperthermic seizures in theepilepsy-prone versus the epilepsy-resistant rat. Brain Res.358, 390–393 (1985).
39. Danielson, N. B., Guo, J. N. & Blumenfeld, H. The default mode network and altered consciousness inepilepsy. Behav. Neurol.24, 55–65 (2011).
40. Bharath, R. D. et al. Seizure Frequency Can Alter Brain Connectivity: Evidence from Resting-State fMRI.AJNR Am. J. Neuroradiol.36, 1890–1898 (2015).
Tables
Page 11/18
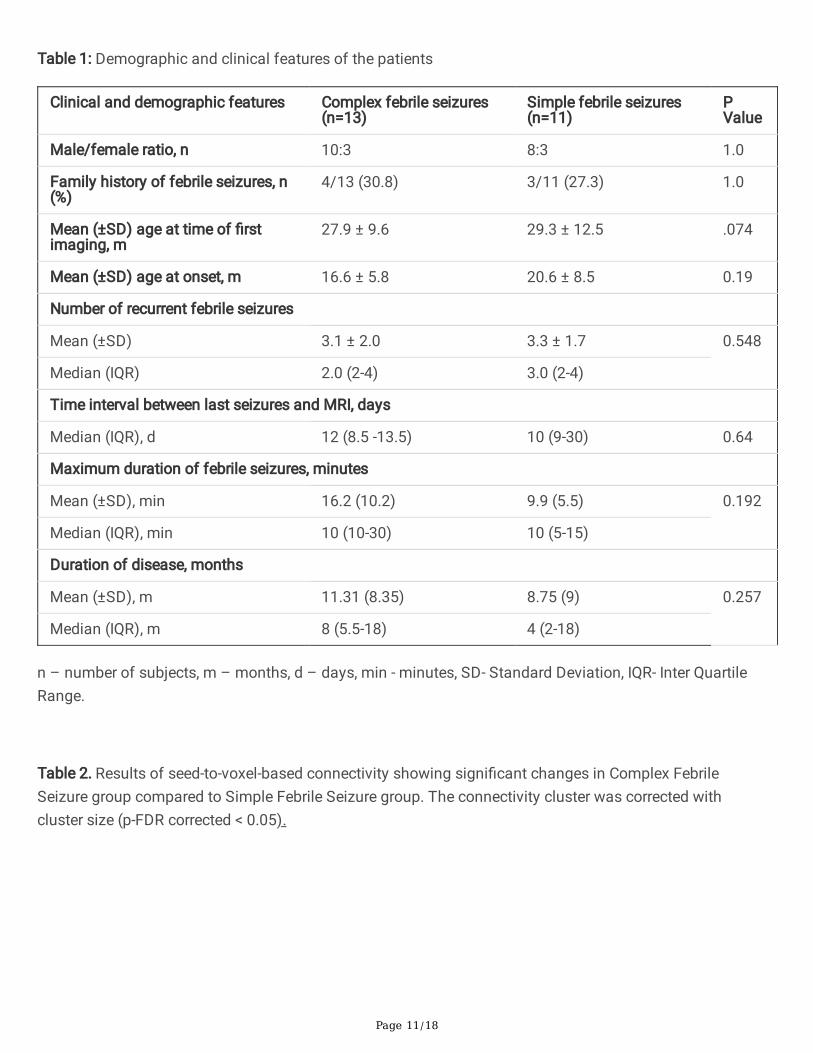
Table 1: Demographic and clinical features of the patients
Clinical and demographic features Complex febrile seizures(n=13)
Simple febrile seizures(n=11)
PValue
Male/female ratio, n 10:3 8:3 1.0
Family history of febrile seizures, n(%)
4/13 (30.8) 3/11 (27.3) 1.0
Mean (±SD) age at time of �rstimaging, m
27.9 ± 9.6 29.3 ± 12.5 .074
Mean (±SD) age at onset, m 16.6 ± 5.8 20.6 ± 8.5 0.19
Number of recurrent febrile seizures
Mean (±SD) 3.1 ± 2.0 3.3 ± 1.7 0.548
Median (IQR) 2.0 (2-4) 3.0 (2-4)
Time interval between last seizures and MRI, days
Median (IQR), d 12 (8.5 -13.5) 10 (9-30) 0.64
Maximum duration of febrile seizures, minutes
Mean (±SD), min 16.2 (10.2) 9.9 (5.5) 0.192
Median (IQR), min 10 (10-30) 10 (5-15)
Duration of disease, months
Mean (±SD), m 11.31 (8.35) 8.75 (9) 0.257
Median (IQR), m 8 (5.5-18) 4 (2-18)
n – number of subjects, m – months, d – days, min - minutes, SD- Standard Deviation, IQR- Inter QuartileRange.
Table 2. Results of seed-to-voxel-based connectivity showing signi�cant changes in Complex FebrileSeizure group compared to Simple Febrile Seizure group. The connectivity cluster was corrected withcluster size (p-FDR corrected < 0.05).
Page 12/18
Seed ROIRegion
ConnectivityRegions
COGcoordinates
Clustersize-Number ofVoxel
Effectsize
p-value(FDR)
ConnectivityPattern
R-MiddleTemporal Pole
R-Hippocampus 28; -28; -06 169 1.58 0.000001 Increased
R-putamen 28; 26; 09 162 2.47 0.000001 Increased
R-Insula 21; 22; 10 84 1.9 0.000001 Increased
R-Thalamus 28; -28; -06 43 2.7 0.000001 Increased
R-ParahippocampusGyrus
28; -26; 12 54 2.08 0.000001 Increased
R-Amygdala 20; 14; 58 30 2.38 0.000001 Increased
L-Hippocampus -26; -28; -18 153 1.92 0.000213 Increased
L-Thalamus -20; -34; 01 59 1.87 0.000213 Increased
L-ParahippocampusGyrus
-26; -28; -20 31 2.17 0.000213 Increased
R-Accumbens -06, 22, 00 29 1.85 0.000213 Increased
L-Accumbens 10, 14, 08 20 1.83 0.000213 Increased
L-MiddleTemporal Pole
R-Hippocampus 18; -10; -14 219 1.1 0.000494 Increased
R-ParahippocampusGyrus
30; -04; -30 85 1.09 0.000494 Increased
R-Amygdala 10; 20; 16 45 1.85 0.000494 Increased
L-Hippocampus -17; 10; 18 110 1.11 0.000001 Increased
L-ParahippocampusGyrus
-14; 02; 24 124 2.26 0.000001 Increased
L-Amygdala -02; 20; 14 91 2.26 0.000001 Increased
L-Frontal OrbitalCortex
-24; 22; 11 173 2.5 0.000001 Increased
R-Post CentralGyrus
Precuneus -0; -52; 1 222 -2.35 0.000001 Decreased
L-Lingual Gyrus -14; -52; 13 162 -3.67 0.000001 Decreased
L-IntracalcarineCortex
-10; -48; 10 90 -1.82 0.000001 Decreased
Page 13/18
L-OccipitalFusiform Gyrus
-14; -52; 15 106 -3.76 0.000001 Decreased
L-Post CentralGyrus
Precuneus 0; 52, 0 835 -2.37 0.000001 Decreased
L-Lingual Gyrus -12; 52, 1 766 -2.10 0.000001 Decreased
L-OccipitalFusiform Gyrus
-12; 52, 1 415 -1.59 0.000001 Decreased
L-IntracalcarineCortex
-12; 52, 1 258 -1.07 0.000001 Decreased
PCC R-Putamen 28; -04; 10 83 -1.87 0.000005 Decreased
R-Caudate 10; 10; 12 108 -1.9 0.000005 Decreased
L-SupplementaryMotor Cortex
-2; -4; 60 84 -2.6 0.015196 Decreased
L-SupplementaryMotor
R-Thalamus 10; -32; -02 152 3.24 0.000001 Increased
R-ParahippocampusGyrus
14; -32; -03 128 2.68 0.000001 Increased
L-ParahippocampusGyrus
-14; -38; -02 115 2.87 0.000164 Increased
L-Thalamus -10; -32; -03 79 2.83 0.000164 Increased
PCC -08; -56; 30 352 -2.78 0.001287 Decreased
L-Inferior FrontalGyrus
-48; 40; 04 215 -2.19 0.001287 Decreased
MPFC -02; 64; 06 320 -1.98 0.001287 Decreased
Table 3-Correlation of clinical variables [number of recurrent febrile seizures, the longest duration of febrileseizures and duration of disease] to statistically signi�cant seed to target connectivity between complex andsimple febrile seizure groups
Page 14/18
Seed Region Connectivity Region andconnectivity
Clinical variable
Recurrence Duration ofSeizure
DiseaseDuration
rvalue
Pvalue
rvalue
Pvalue
rvalue
Pvalue
L Post CentralGyrus
Precuneus (decreased) -0.04 0.8464 -0.49 0.0204 -0.11 0.6025
L Lingual Gyrus(decreased)
-0.08 0.7071 -0.55 0.0067 -0.08 0.7175
L Occipital Fusiform Gyrus(decreased)
0.03 0.8689 -0.32 0.1409 -0.12 0.5704
PCC R Caudate (decreased) -0.35 0.1074 -0.29 0.1902 0.08 0.7108
L Caudate (decreased) -0.28 0.1989 -0.36 0.0914 -0.11 0.609
R Putamen (decreased) -0.20 0.3599 -0.28 0.1994 0.09 0.6881
R Pallidum (decreased) -0.15 0.4892 -0.32 0.1395 0.01 0.9329
LSupplementaryMotor Cortex
L Inferior Frontal Gyrus, parstriangularis (decreased)
0.05 0.8045 -0.14 0.5146 0.18 0.422
Precuneus, PCC(decreased)
-0.43 0.0411 -0.13 0.5476 0.18 0.4055
L Parahippocampus Gyrus(increased)
0.13 0.5507 0.31 0.159 0.10 0.6463
R Parahippocampus Gyrus(increased)
0.13 0.5589 0.44 0.0404 -0.06 0.7798
L Thalamus (increased) 0.14 0.5232 0.30 0.1729 0.10 0.6395
R Thalamus (increased) -0.02 0.8948 0.31 0.1468 0.01 0.9692
L MiddleTemporal Pole
R Hippocampus (increased) 0.54 0.0086 0.35 0.107 0.40 0.0825
L Hippocampus (increased) 0.19 0.3837 0.36 0.0994 0.02 0.9239
L Frontal Orbital Cortex(increased)
-0.11 0.6069 0.23 0.2976 -0.15 0.4923
Subcallosal Cortex(increased)
0.19 0.3951 0.27 0.2165 -0.15 0.4826
R Parahippocampus Gyrus(increased)
0.57 0.0055 0.07 0.7516 -0.01 0.965
L Parahippocampus Gyrusand left amygdala(increased)
0.01 0.9484 0.43 0.0433 0.02 0.9238
Page 15/18
R Amygdala (increased) 0.19 0.3845 0.40 0.0626 0.09 0.6812
R Accumbens (increased) 0.19 0.3951 0.27 0.2165 -0.15 0.4826
R Post CentralGyrus
Precuneus (decreased) -0.15 0.4871 -0.45 0.0322 -0.01 0.9462
L Lingual Gyrus(decreased)
-0.07 0.7495 -0.48 0.023 -0.03 0.8754
L Intracalcarine Cortex(decreased)
-0.05 0.7663 -0.53 0.0109 -0.08 0.6942
L Occipital Fusiform Gyrus(decreased)
-0.12 0.5862 -0.48 0.023 -0.04 0.8309
R MiddleTemporal Pole
R Hippocampus (increased) 0.60 0.0028 0.32 0.1447 0.26 0.2325
L Hippocampus (increased) 0.08 0.7045 0.59 0.0038 0.17 0.4441
R Parahippocampus Gyrus(increased)
0.13 0.5433 0.58 0.004 0.15 0.4925
L Parahippocampus Gyrus(increased)
0.07 0.7499 0.36 0.0968 0.02 0.9047
R Putamen (increased) -0.02 0.9291 0.60 0.0026 0.10 0.6442
L Thalamus (increased) 0.09 0.6787 0.59 0.0036 0.16 0.4559
R Thalamus (increased) 0.05 0.813 0.65 0.001 0.30 0.1638
R Amygdala (increased) -0.01 0.9465 0.59 0.0036 0.08 0.7418
B/L Accumbens (increased) 0.01 0.9383 0.49 0.0196 0.001 0.9892
RSupplementaryMotor Cortex
Precuneus, PCC(decreased)
0.25 0.2537 -0.27 0.21 0.36 0.0953
Figures
Page 16/18
Figure 1
Seed-to-voxel-based connectivity of Complex Febrile Seizure (CFS) compared to Simple Febrile Seizure (SFS)(CFS > SFS) for (a) Right Middle Temporal Gyrus (MTG) (b) Left MTG (c) Right Post Central Gyrus (d) LeftPost Central Gyrus (e) L-Supplementary Motor cortex and (f) PCC. The connectivity changes were viewed inthe MNI -152 T1 structural template with multi-slice axial view. The color bars indicate the changes inconnectivity strength. The connectivity cluster was corrected with cluster size -p-FDR corrected <0.05.
Page 17/18
Figure 2
Correlation of the effect size of signi�cant connectivity difference (CFS >SFS) across the seed pairs withDuration of seizure. Positive correlation of Duration of seizure with connectivity of (a) Right MTG to rightParahippocampus (b) Right MTG to right thalamus (c) Right MTG to right putamen (d) Left supplementarymotor cortex to right Parahippocampus.
Page 18/18
Figure 3
Correlation of the effect size of signi�cant connectivity difference (CFS>SFS) across the seed pairs withnumber of recurrences. Positive correlation of number of recurrence with connectivity of (a) right middletemporal pole to right Hippocampus (b) left middle temporal pole to right thalamus (c) left middle temporalpole to right Parahippocampus and (d) Negative correlation of number of recurrences with PCC to Leftsupplementary motor cortex.