Embed Size (px)
Citation preview
AFRL-RV-HA-TR-2010-1043
Seismic Tomography of the Arabian-Eurasian Collision Zone and Surrounding Areas M. Nafi Toksöz Robert D. Van der Hilst Youshun Sun Haijiang Zhang Massachusetts Institute of Technology 77 Massachusetts Avenue Cambridge, MA 02139 Final Report 20 May 2010
APPROVED FOR PUBLIC RELEASE; DISTRIBUTION IS UNLIMITED.
AIR FORCE RESEARCH LABORATORY Space Vehicles Directorate 29 Randolph Rd AIR FORCE MATERIEL COMMAND HANSCOM AFB, MA 01731-3010

NOTICES
Using Government drawings, specifications, or other data included in this document for any purpose other than Government procurement does not in any way obligate the U.S. Government. The fact that the Government formulated or supplied the drawings, specifications, or other data does not license the holder or any other person or corporation; or convey any rights or permission to manufacture, use, or sell any patented invention that may relate to them. This report was cleared for public release and is available to the general public, including foreign nationals. Qualified requestors may obtain copies of this report from the Defense Technical Information Center (DTIC) (http://www.dtic.mil). All others should apply to the National Technical Information Service. AFRL-RV-HA-TR-2010-1043 HAS BEEN REVIEWED AND IS APPROVED FOR PUBLICATION IN ACCORDANCE WITH ASSIGNED DISTRIBUTION STATEMENT. //signature// //signature// ________________________________ _________________________________ ROBERT J. RAISTRICK Domenic Thompson, Maj, USAF, Chief Contract Manager Battlespace Surveillance Innovation Center This report is published in the interest of scientific and technical information exchange, and its publication does not constitute the Government’s approval or disapproval of its ideas or findings.

i
REPORT DOCUMENTATION PAGE Form Approved
OMB No. 0704-0188 Public reporting burden for this collection of information is estimated to average 1 hour per response, including the time for reviewing instructions, searching existing data sources, gathering and maintaining the data needed, and completing and reviewing this collection of information. Send comments regarding this burden estimate or any other aspect of this collection of information, including suggestions for reducing this burden to Department of Defense, Washington Headquarters Services, Directorate for Information Operations and Reports (0704-0188), 1215 Jefferson Davis Highway, Suite 1204, Arlington, VA 22202-4302. Respondents should be aware that notwithstanding any other provision of law, no person shall be subject to any penalty for failing to comply with a collection of information if it does not display a currently valid OMB control number. PLEASE DO NOT RETURN YOUR FORM TO THE ABOVE ADDRESS.
1. REPORT DATE 05-20-2010
2. REPORT TYPE Final Report
3. DATES COVERED (From - To) 01-22-2007 to 03-31-2010
4. TITLE AND SUBTITLE SEISMIC TOMOGRAPHY OF THE ARABIAN-EURASIAN COLLISION ZONE
5a. CONTRACT NUMBER FA8718-07-C-0001
AND SURROUNDING AREAS 5b. GRANT NUMBER
5c. PROGRAM ELEMENT NUMBER 62601F
6. AUTHOR(S) M. Nafi Toksöz, Robert D. Van der Hilst, Youshun Sun, and Haijiang Zhang
5d. PROJECT NUMBER 1010
5e. TASK NUMBER SM
5f. WORK UNIT NUMBER A1
7. PERFORMING ORGANIZATION NAME(S) AND ADDRESS(ES) Massachusetts Institute of Technology 77 Mass Ave. Cambridge, MA 02139
8. PERFORMING ORGANIZATION REPORT NUMBER
9. SPONSORING / MONITORING AGENCY NAME(S) AND ADDRESS(ES) Air Force Research Laboratory
29 Randolph Rd. Hanscom AFB, MA 01731-3010
10. SPONSOR/MONITOR’S ACRONYM(S) AFRL/RVBYE
11. SPONSOR/MONITOR’S REPORT NUMBER(S) AFRL-RV-HA-TR-2010-1043
12. DISTRIBUTION / AVAILABILITY STATEMENT Approved for Public Release; Distribution Unlimited.
13. SUPPLEMENTARY NOTES
14. ABSTRACT We developed P- and S- wave velocity structures in the crust and upper mantle in the Arabian-Eurasian collision zone and surrounding areas, including Iran, Arabia, Eastern Turkey, and the Caucasus. We first obtain Pn and Sn velocities using local and regional arrival time data. Second, we obtain the 3-D crustal P and S velocity models. Third, we extend the model into the upper mantle and transition zone by combining local, regional and teleseismic data and crust model constraints. To extend the model deeper into the mantle through the upper mantle transition zone, ISC/EHB data for P and PP phases are combined with the ABCE data. To counteract the “smearing effect,” the crust and upper mantle velocity structure, derived from regional travel-times, is used. An adaptive grid method based on ray density is used in the inversion. A P-wave velocity model extending down to a depth of 2000 km is obtained. regional-teleseismic tomography provides a high-resolution, 3-D P-wave velocity model for the crust, upper mantle, and the transition zone. The crustal models correlate well with geologic and tectonic features. The upper mantle tomograms show the images of the subducted Neotethys slab. The slab geometry is quite complex, reflecting the history of the changes in the plate motions and collision processes. Vp/Vs tomography was also determined in the study region, and an attenuation tomography was obtained in Iran.
15. SUBJECT TERMS Seismic tomography, Attenuation, Travel-time data
16. SECURITY CLASSIFICATION OF:
17. LIMITATION OF ABSTRACT
18. NUMBER OF PAGES
19a. NAME OF RESPONSIBLE PERSON Robert Raistrick
a. REPORT UNC
b. ABSTRACT UNC
c. THIS PAGE UNC SAR 41
19b. TELEPHONE NUMBER (include area code) 781-377-3726
Standard Form 298 (Rev. 8-98)Prescribed by ANSI Std. Z39.18

ii

iii
Table of Contents
1. Abstract ...................................................................................................................1
2. Introduction ............................................................................................................1
3. Regional Models .....................................................................................................3
3.1. The Crust and Uppermost Mantle Models ..................................................3
3.2. Vp/Vs Tomography .....................................................................................5
3.3. Upper Mantle Tomography ..........................................................................7
4. Models for Iran ....................................................................................................10
4.1. Data Description ........................................................................................10
4.2. Seismic Tomography ......................................................................................12
4.2.1. Data for Seismic Tomography .......................................................12
4.2.2. P and S tomography of the Crust and Upper Mantle .....................13
4.3 Relocation of Earthquakes in Iran ....................................................................14
4.4 Attenuation Tomography .................................................................................15
References .........................................................................................................................18 Appendices ........................................................................................................................22
Appendix I: Deliverables .......................................................................................22
Appendix II: Pn and Sn velocities in the Mideast and Central Asia ......................23
iv
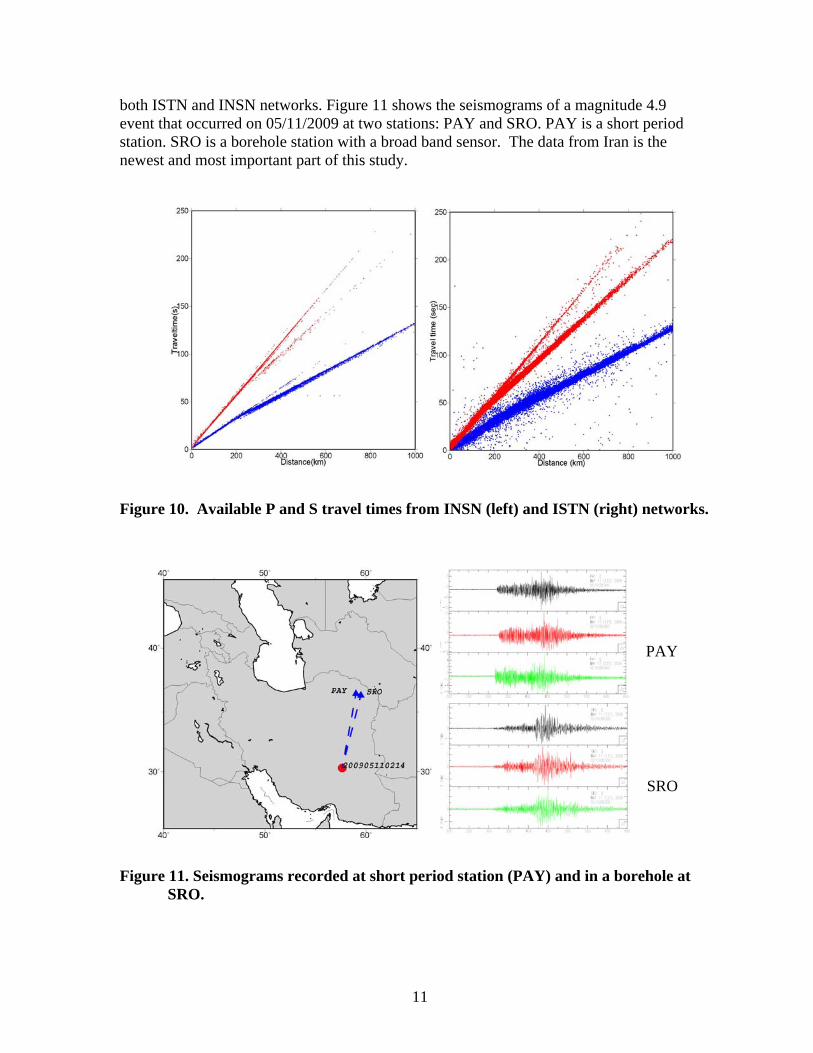
Figures Figure 1. Topographic map of the Middle East and surrounding regions. White lines denote the location of known faults, while the black dots represent the epicenter locations of earthquakes in the region. ..............................................................................2 Figure 2. Ray paths for Pn (upper) and Sn (bottom) travel times. 654,999 Pn rays were obtained form 42,984 events (black crosses) recorded by 1263 stations (red triangles), and 121,838 Sn rays were obtained form 22,283 events recorded by 887 stations. The data were selected for epicentral distances between 2 and 12 degrees with residuals less than 7.0s for Pn, and between 2 and 15 degree with residuals less than 6.0s for Sn. Each event was recorded by at least 3 stations for Pn and 2 stations for Sn. .................................................................................................................................4 Figure 3. Imaged Pn (upper) Sn velocity lateral variations. Average Pn velocity is 8.04 km/s and average Sn velocity is 4.60 km/s. Red represents slow velocities and blue denotes high velocities. ..............................................................................................5 Figure 4. Pseudowave lateral velocity variations obtained by tomographically inverting the difference travel-time residuals. Relative to the mean value of 10.8 km/s, the pseudowave maximum velocity perturbations is about 0.4 km/s. .......................7 Figure 5. Velocity profile at depth of 50 km. ....................................................................8 Figure 6. Velocity profile at depth of 200 km. ..................................................................8 Figure 7. Velocity profile at depth of 400 km. ..................................................................9 Figure 8. Velocity profile at depth of 600 km. .................................................................9 Figure 9. Seismic stations in Iran. INSN stations are in circles and ISTN stations are in triangles. ........................................................................................................................10 Figure 10. Available P and S travel times from INSN (left) and ISTN (right) networks .............................................................................................................................11 Figure 11. Seismograms recorded at short period station (PAY) and in a borehole at SRO. ..................................................................................................................................11 Figure 12. Available ray paths from the Iranian networks (left) and EHB database (right). ..............................................................................................................................12 Figure 13. P-wave models at depths of 21 and 51 km obtained using the double-difference tomography method. .......................................................................................13
v
Figure 14. Horizontal cross sections through the mantle from preliminary results of P-wave travel-time tomography. Blue colors represent regions with faster than average velocities, and red color show regions with slower than average velocities. ....14 Figure 15. Comparison of residuals using 1D model (solid line) and 3D model (red). ....15 Figure 16. Map of an earthquake relocation in Iran, where the USGS locations are shown as red circles, and the locations found using 3D tomographic models are shown in blue crosses. ......................................................................................................15 Figure 17. Left: Distribution of ray paths, stations (triangles) and events (crosses). Right: Preliminary imaged Q0 lateral variations. Blue corresponds to a high value and red to low. The average Q0 is 330. ............................................................................16

vi
1
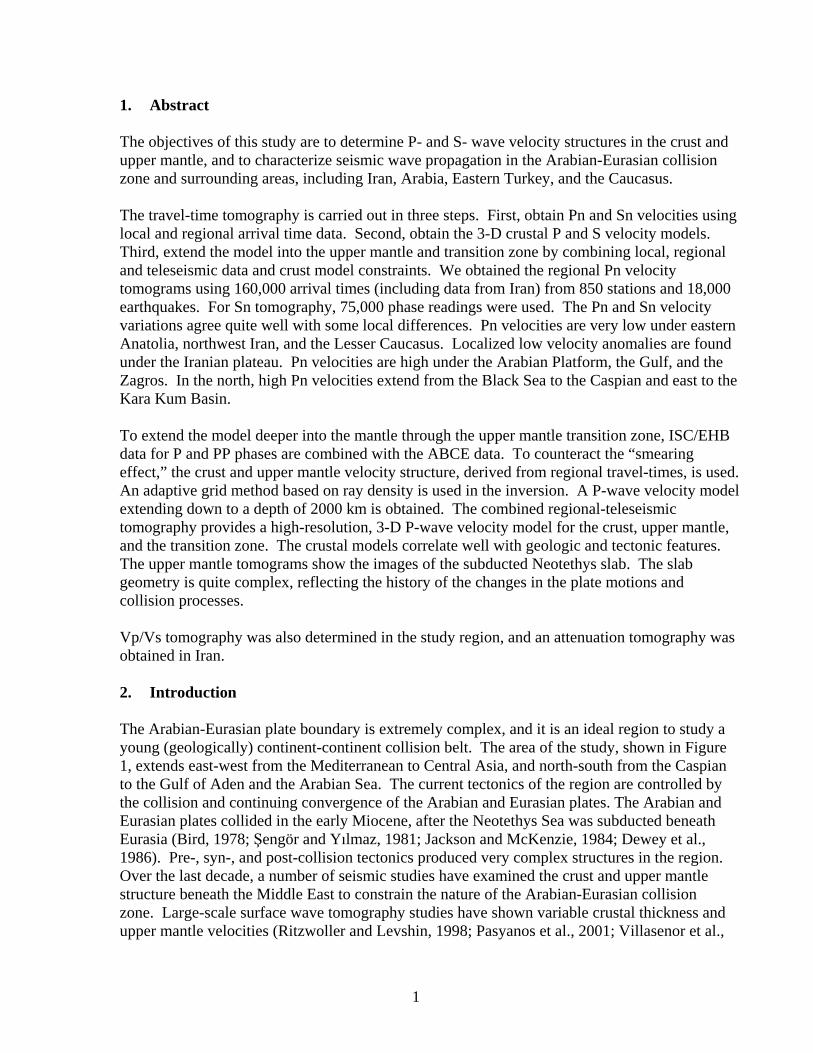
1. Abstract The objectives of this study are to determine P- and S- wave velocity structures in the crust and upper mantle, and to characterize seismic wave propagation in the Arabian-Eurasian collision zone and surrounding areas, including Iran, Arabia, Eastern Turkey, and the Caucasus. The travel-time tomography is carried out in three steps. First, obtain Pn and Sn velocities using local and regional arrival time data. Second, obtain the 3-D crustal P and S velocity models. Third, extend the model into the upper mantle and transition zone by combining local, regional and teleseismic data and crust model constraints. We obtained the regional Pn velocity tomograms using 160,000 arrival times (including data from Iran) from 850 stations and 18,000 earthquakes. For Sn tomography, 75,000 phase readings were used. The Pn and Sn velocity variations agree quite well with some local differences. Pn velocities are very low under eastern Anatolia, northwest Iran, and the Lesser Caucasus. Localized low velocity anomalies are found under the Iranian plateau. Pn velocities are high under the Arabian Platform, the Gulf, and the Zagros. In the north, high Pn velocities extend from the Black Sea to the Caspian and east to the Kara Kum Basin. To extend the model deeper into the mantle through the upper mantle transition zone, ISC/EHB data for P and PP phases are combined with the ABCE data. To counteract the “smearing effect,” the crust and upper mantle velocity structure, derived from regional travel-times, is used. An adaptive grid method based on ray density is used in the inversion. A P-wave velocity model extending down to a depth of 2000 km is obtained. The combined regional-teleseismic tomography provides a high-resolution, 3-D P-wave velocity model for the crust, upper mantle, and the transition zone. The crustal models correlate well with geologic and tectonic features. The upper mantle tomograms show the images of the subducted Neotethys slab. The slab geometry is quite complex, reflecting the history of the changes in the plate motions and collision processes. Vp/Vs tomography was also determined in the study region, and an attenuation tomography was obtained in Iran. 2. Introduction The Arabian-Eurasian plate boundary is extremely complex, and it is an ideal region to study a young (geologically) continent-continent collision belt. The area of the study, shown in Figure 1, extends east-west from the Mediterranean to Central Asia, and north-south from the Caspian to the Gulf of Aden and the Arabian Sea. The current tectonics of the region are controlled by the collision and continuing convergence of the Arabian and Eurasian plates. The Arabian and Eurasian plates collided in the early Miocene, after the Neotethys Sea was subducted beneath Eurasia (Bird, 1978; Şengör and Yılmaz, 1981; Jackson and McKenzie, 1984; Dewey et al., 1986). Pre-, syn-, and post-collision tectonics produced very complex structures in the region. Over the last decade, a number of seismic studies have examined the crust and upper mantle structure beneath the Middle East to constrain the nature of the Arabian-Eurasian collision zone. Large-scale surface wave tomography studies have shown variable crustal thickness and upper mantle velocities (Ritzwoller and Levshin, 1998; Pasyanos et al., 2001; Villasenor et al.,
2
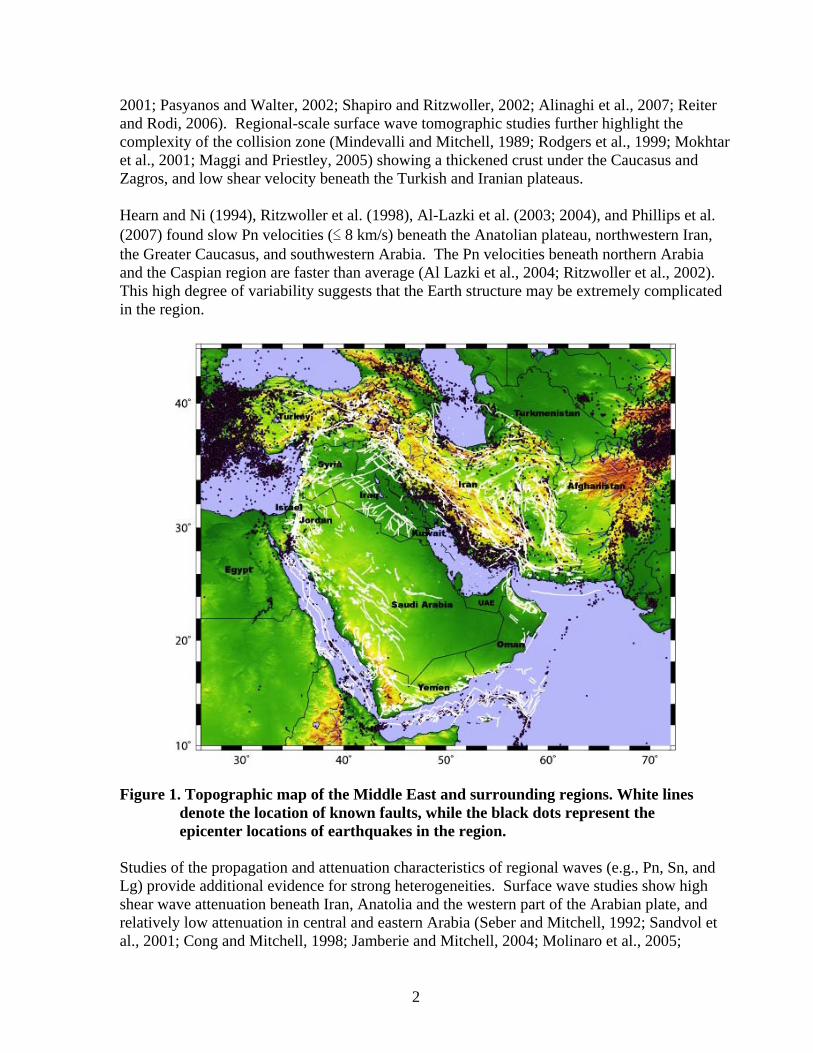
2001; Pasyanos and Walter, 2002; Shapiro and Ritzwoller, 2002; Alinaghi et al., 2007; Reiter and Rodi, 2006). Regional-scale surface wave tomographic studies further highlight the complexity of the collision zone (Mindevalli and Mitchell, 1989; Rodgers et al., 1999; Mokhtar et al., 2001; Maggi and Priestley, 2005) showing a thickened crust under the Caucasus and Zagros, and low shear velocity beneath the Turkish and Iranian plateaus. Hearn and Ni (1994), Ritzwoller et al. (1998), Al-Lazki et al. (2003; 2004), and Phillips et al. (2007) found slow Pn velocities (≤ 8 km/s) beneath the Anatolian plateau, northwestern Iran, the Greater Caucasus, and southwestern Arabia. The Pn velocities beneath northern Arabia and the Caspian region are faster than average (Al Lazki et al., 2004; Ritzwoller et al., 2002). This high degree of variability suggests that the Earth structure may be extremely complicated in the region.
Figure 1. Topographic map of the Middle East and surrounding regions. White lines
denote the location of known faults, while the black dots represent the epicenter locations of earthquakes in the region.
Studies of the propagation and attenuation characteristics of regional waves (e.g., Pn, Sn, and Lg) provide additional evidence for strong heterogeneities. Surface wave studies show high shear wave attenuation beneath Iran, Anatolia and the western part of the Arabian plate, and relatively low attenuation in central and eastern Arabia (Seber and Mitchell, 1992; Sandvol et al., 2001; Cong and Mitchell, 1998; Jamberie and Mitchell, 2004; Molinaro et al., 2005;
3
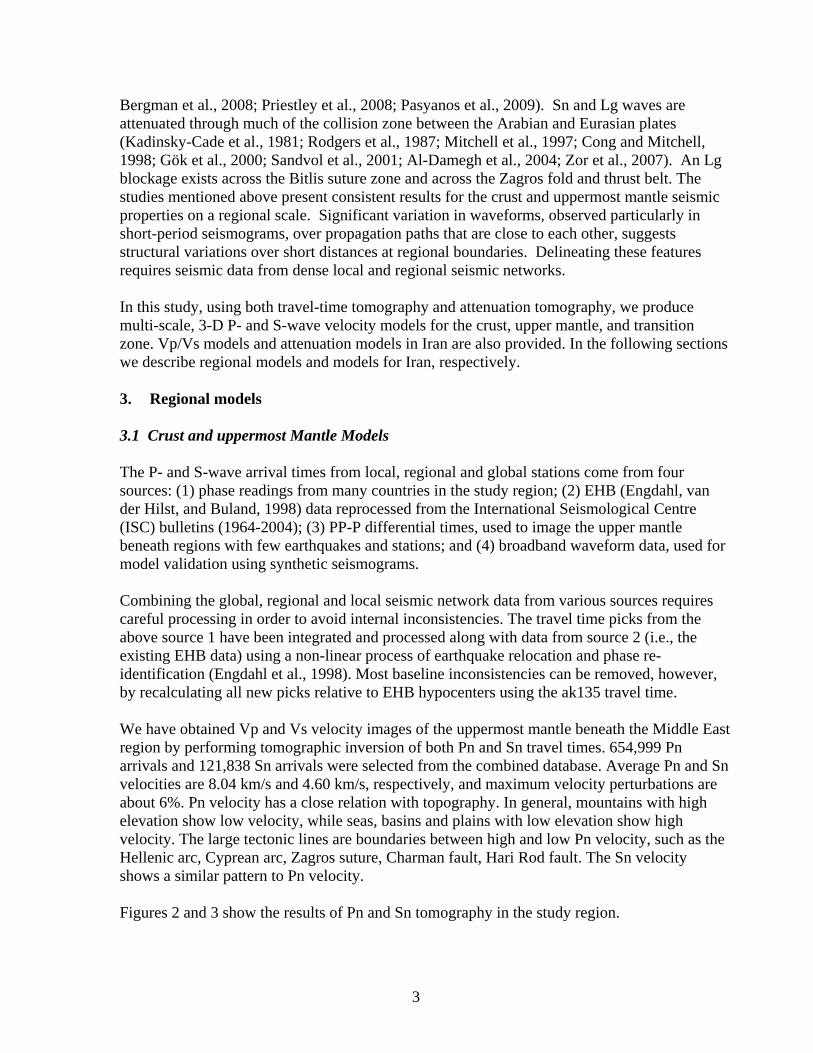
Bergman et al., 2008; Priestley et al., 2008; Pasyanos et al., 2009). Sn and Lg waves are attenuated through much of the collision zone between the Arabian and Eurasian plates (Kadinsky-Cade et al., 1981; Rodgers et al., 1987; Mitchell et al., 1997; Cong and Mitchell, 1998; Gök et al., 2000; Sandvol et al., 2001; Al-Damegh et al., 2004; Zor et al., 2007). An Lg blockage exists across the Bitlis suture zone and across the Zagros fold and thrust belt. The studies mentioned above present consistent results for the crust and uppermost mantle seismic properties on a regional scale. Significant variation in waveforms, observed particularly in short-period seismograms, over propagation paths that are close to each other, suggests structural variations over short distances at regional boundaries. Delineating these features requires seismic data from dense local and regional seismic networks. In this study, using both travel-time tomography and attenuation tomography, we produce multi-scale, 3-D P- and S-wave velocity models for the crust, upper mantle, and transition zone. Vp/Vs models and attenuation models in Iran are also provided. In the following sections we describe regional models and models for Iran, respectively. 3. Regional models 3.1 Crust and uppermost Mantle Models The P- and S-wave arrival times from local, regional and global stations come from four sources: (1) phase readings from many countries in the study region; (2) EHB (Engdahl, van der Hilst, and Buland, 1998) data reprocessed from the International Seismological Centre (ISC) bulletins (1964-2004); (3) PP-P differential times, used to image the upper mantle beneath regions with few earthquakes and stations; and (4) broadband waveform data, used for model validation using synthetic seismograms. Combining the global, regional and local seismic network data from various sources requires careful processing in order to avoid internal inconsistencies. The travel time picks from the above source 1 have been integrated and processed along with data from source 2 (i.e., the existing EHB data) using a non-linear process of earthquake relocation and phase re-identification (Engdahl et al., 1998). Most baseline inconsistencies can be removed, however, by recalculating all new picks relative to EHB hypocenters using the ak135 travel time. We have obtained Vp and Vs velocity images of the uppermost mantle beneath the Middle East region by performing tomographic inversion of both Pn and Sn travel times. 654,999 Pn arrivals and 121,838 Sn arrivals were selected from the combined database. Average Pn and Sn velocities are 8.04 km/s and 4.60 km/s, respectively, and maximum velocity perturbations are about 6%. Pn velocity has a close relation with topography. In general, mountains with high elevation show low velocity, while seas, basins and plains with low elevation show high velocity. The large tectonic lines are boundaries between high and low Pn velocity, such as the Hellenic arc, Cyprean arc, Zagros suture, Charman fault, Hari Rod fault. The Sn velocity shows a similar pattern to Pn velocity. Figures 2 and 3 show the results of Pn and Sn tomography in the study region.
4
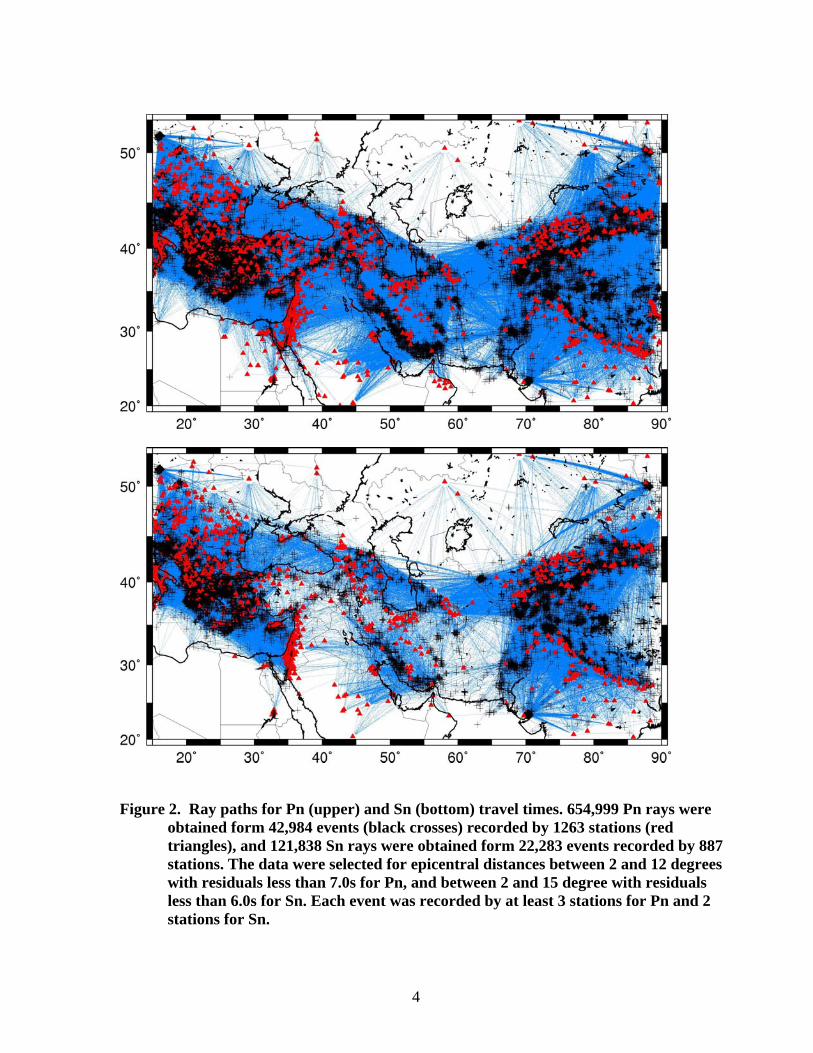
Figure 2. Ray paths for Pn (upper) and Sn (bottom) travel times. 654,999 Pn rays were
obtained form 42,984 events (black crosses) recorded by 1263 stations (red triangles), and 121,838 Sn rays were obtained form 22,283 events recorded by 887 stations. The data were selected for epicentral distances between 2 and 12 degrees with residuals less than 7.0s for Pn, and between 2 and 15 degree with residuals less than 6.0s for Sn. Each event was recorded by at least 3 stations for Pn and 2 stations for Sn.
5
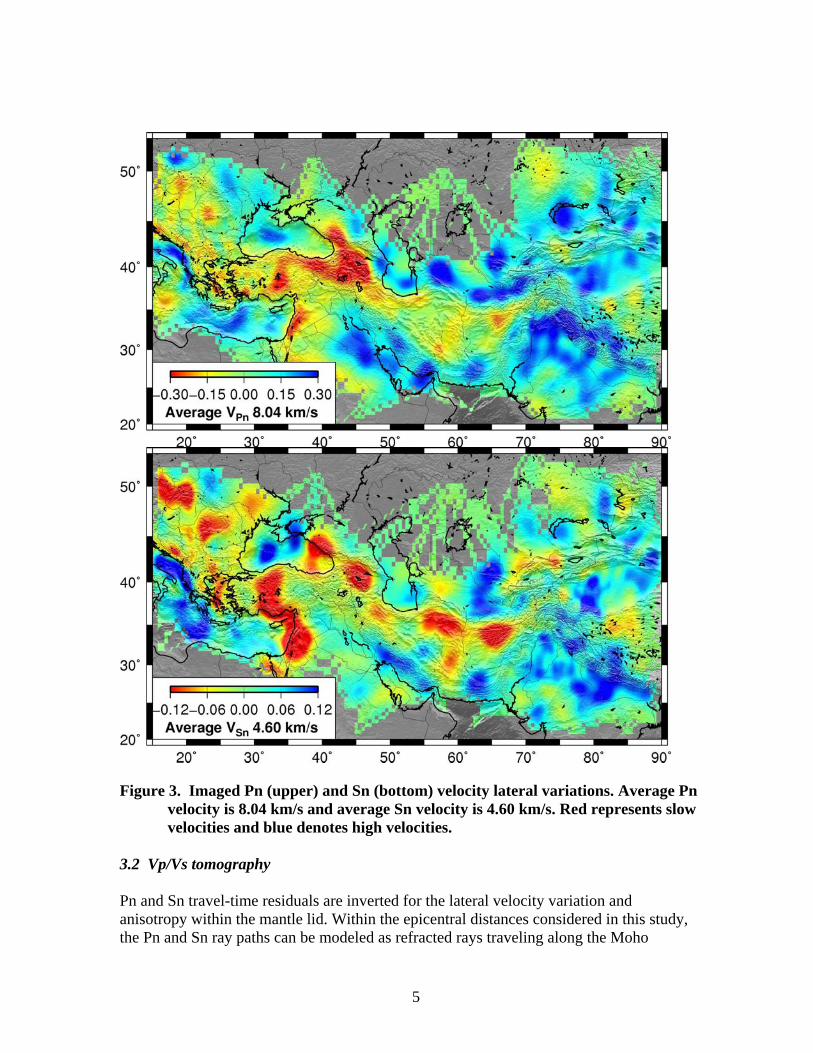
Figure 3. Imaged Pn (upper) and Sn (bottom) velocity lateral variations. Average Pn
velocity is 8.04 km/s and average Sn velocity is 4.60 km/s. Red represents slow velocities and blue denotes high velocities.
3.2 Vp/Vs tomography Pn and Sn travel-time residuals are inverted for the lateral velocity variation and anisotropy within the mantle lid. Within the epicentral distances considered in this study, the Pn and Sn ray paths can be modeled as refracted rays traveling along the Moho
6
discontinuity. The variation of seismic velocity within the uppermost mantle is parameterized by subdividing the surface of the uppermost mantle into a 2-D grid of square cells with dimensions of 30 km by 30 km. The Pn and Sn travel-time residuals are described as the sum of three time terms (Pei et al., 2007; Hearn, 1996):
_ _ _ _pn ij pn i pn j ijk pn kt a b d s (1)
_ _ _ _sn ij sn i sn j ijk sn kt a b d s (2)
where tpn_ij and tsn_ij are the Pn and Sn travel time residual for the ray from event j to station i; apn_i and asn_i are the static delays for station i, depending on the crustal thickness and velocity beneath the station; bpn_j and bsn_j are the static delays for event j, not only depending on the crustal thickness and velocity beneath the event, but also on the event focal depth; dijk is the distance traveled by ray ij in mantle cell k; spn_k and ssn_k are the Pn and Sn slowness perturbation for cell k. Equation (1) subtracted from equation (2), and using tij = tsn_ij - tpn_ij , ai = asn_i - apn_i , bj = bsn_j - bpn_j, sk = ssn_k - spn_k , then gives:
ij i j ijk kt a b d s (3)
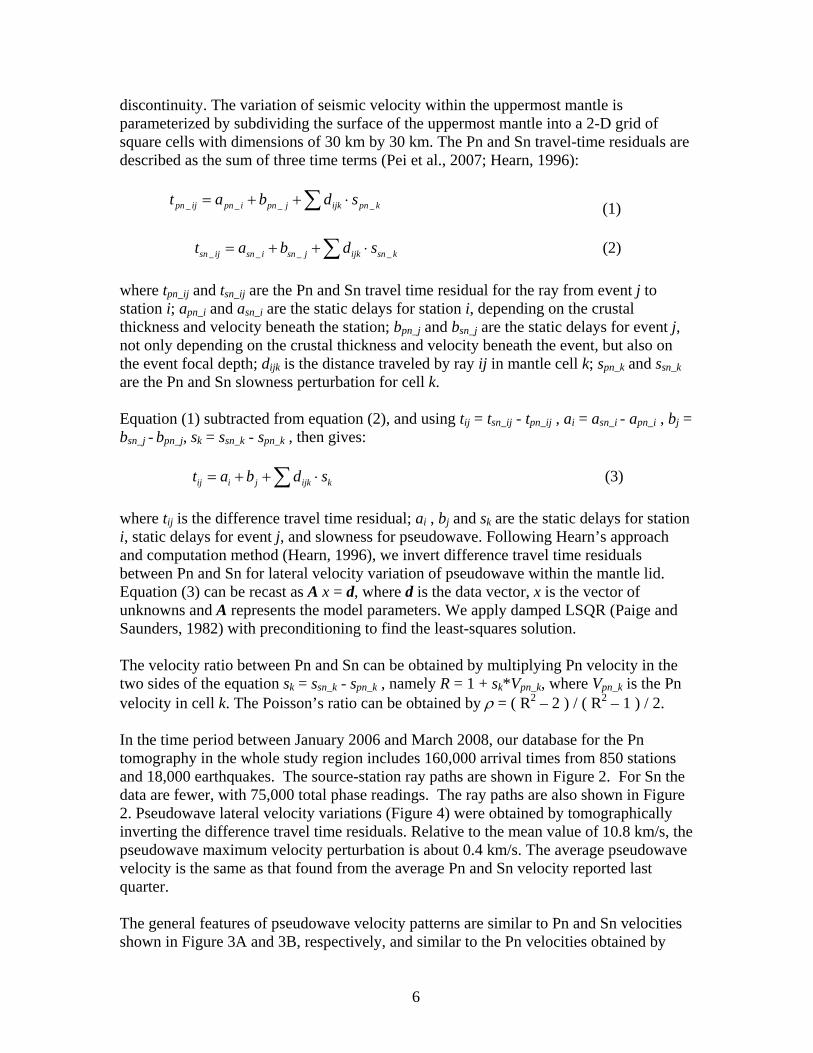
where tij is the difference travel time residual; ai , bj and sk are the static delays for station i, static delays for event j, and slowness for pseudowave. Following Hearn’s approach and computation method (Hearn, 1996), we invert difference travel time residuals between Pn and Sn for lateral velocity variation of pseudowave within the mantle lid. Equation (3) can be recast as A x = d, where d is the data vector, x is the vector of unknowns and A represents the model parameters. We apply damped LSQR (Paige and Saunders, 1982) with preconditioning to find the least-squares solution. The velocity ratio between Pn and Sn can be obtained by multiplying Pn velocity in the two sides of the equation sk = ssn_k - spn_k , namely R = 1 + sk*Vpn_k, where Vpn_k is the Pn velocity in cell k. The Poisson’s ratio can be obtained by = ( R2 – 2 ) / ( R2 – 1 ) / 2. In the time period between January 2006 and March 2008, our database for the Pn tomography in the whole study region includes 160,000 arrival times from 850 stations and 18,000 earthquakes. The source-station ray paths are shown in Figure 2. For Sn the data are fewer, with 75,000 total phase readings. The ray paths are also shown in Figure 2. Pseudowave lateral velocity variations (Figure 4) were obtained by tomographically inverting the difference travel time residuals. Relative to the mean value of 10.8 km/s, the pseudowave maximum velocity perturbation is about 0.4 km/s. The average pseudowave velocity is the same as that found from the average Pn and Sn velocity reported last quarter. The general features of pseudowave velocity patterns are similar to Pn and Sn velocities shown in Figure 3A and 3B, respectively, and similar to the Pn velocities obtained by
7
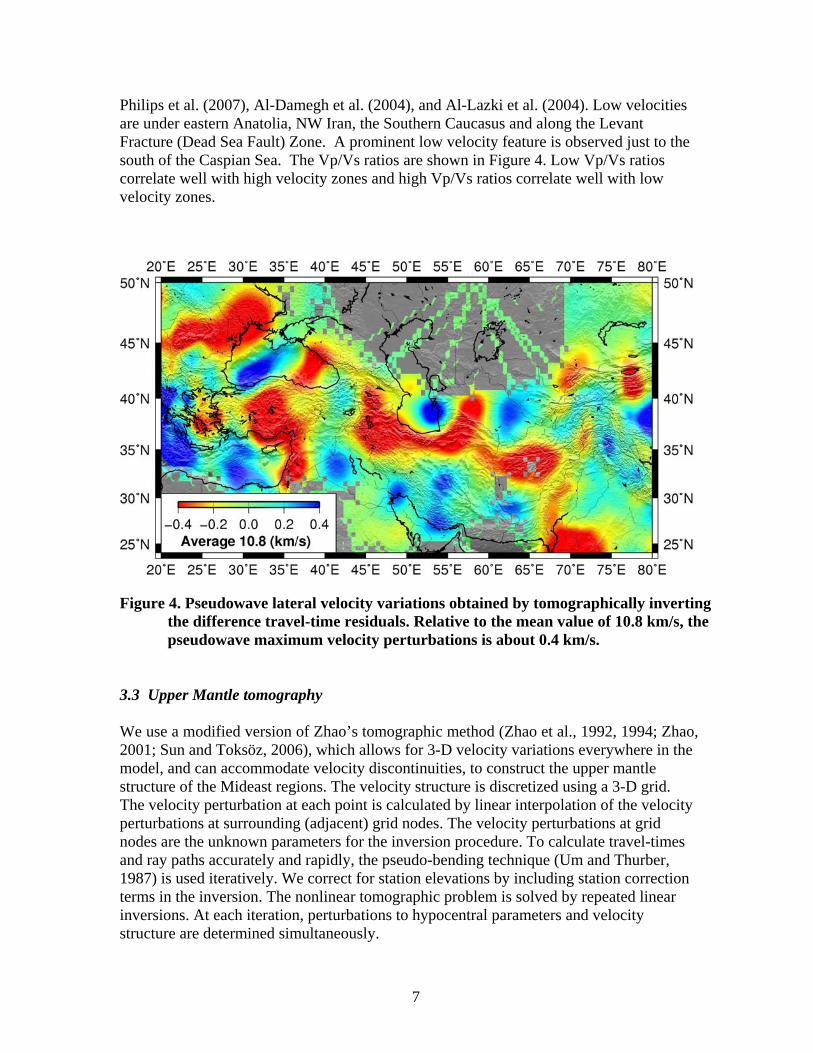
Philips et al. (2007), Al-Damegh et al. (2004), and Al-Lazki et al. (2004). Low velocities are under eastern Anatolia, NW Iran, the Southern Caucasus and along the Levant Fracture (Dead Sea Fault) Zone. A prominent low velocity feature is observed just to the south of the Caspian Sea. The Vp/Vs ratios are shown in Figure 4. Low Vp/Vs ratios correlate well with high velocity zones and high Vp/Vs ratios correlate well with low velocity zones.
Figure 4. Pseudowave lateral velocity variations obtained by tomographically inverting
the difference travel-time residuals. Relative to the mean value of 10.8 km/s, the pseudowave maximum velocity perturbations is about 0.4 km/s.
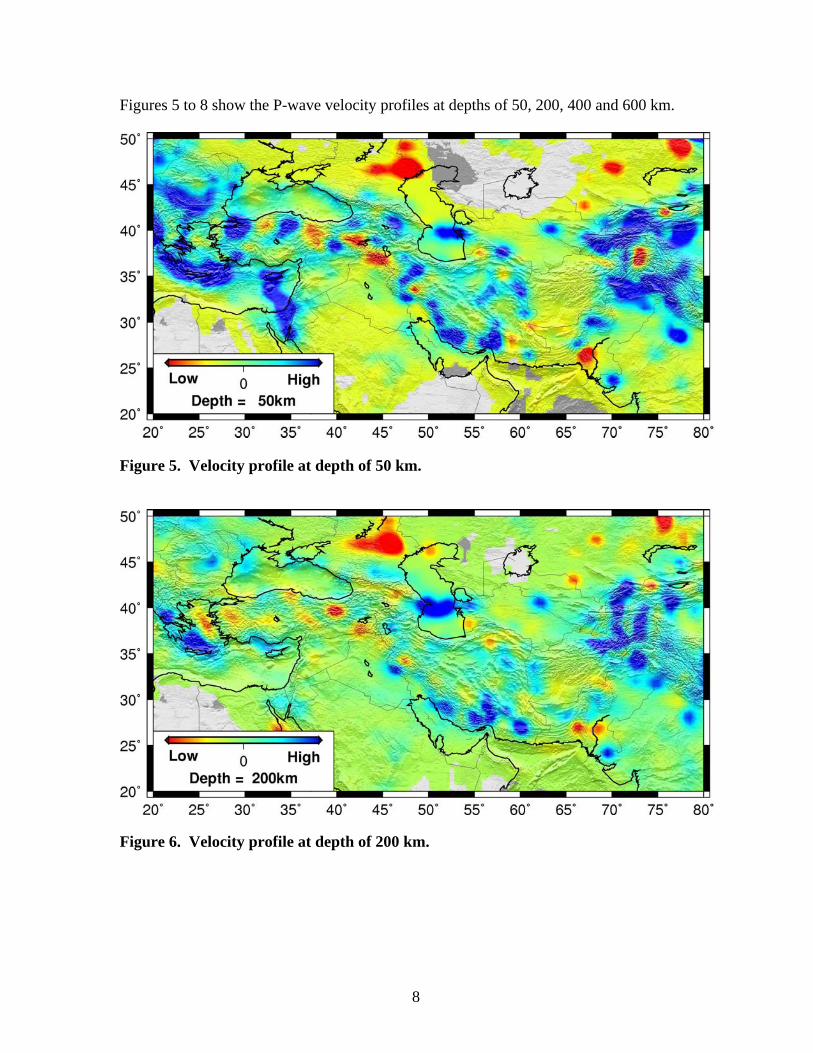
3.3 Upper Mantle tomography We use a modified version of Zhao’s tomographic method (Zhao et al., 1992, 1994; Zhao, 2001; Sun and Toksöz, 2006), which allows for 3-D velocity variations everywhere in the model, and can accommodate velocity discontinuities, to construct the upper mantle structure of the Mideast regions. The velocity structure is discretized using a 3-D grid. The velocity perturbation at each point is calculated by linear interpolation of the velocity perturbations at surrounding (adjacent) grid nodes. The velocity perturbations at grid nodes are the unknown parameters for the inversion procedure. To calculate travel-times and ray paths accurately and rapidly, the pseudo-bending technique (Um and Thurber, 1987) is used iteratively. We correct for station elevations by including station correction terms in the inversion. The nonlinear tomographic problem is solved by repeated linear inversions. At each iteration, perturbations to hypocentral parameters and velocity structure are determined simultaneously.
8
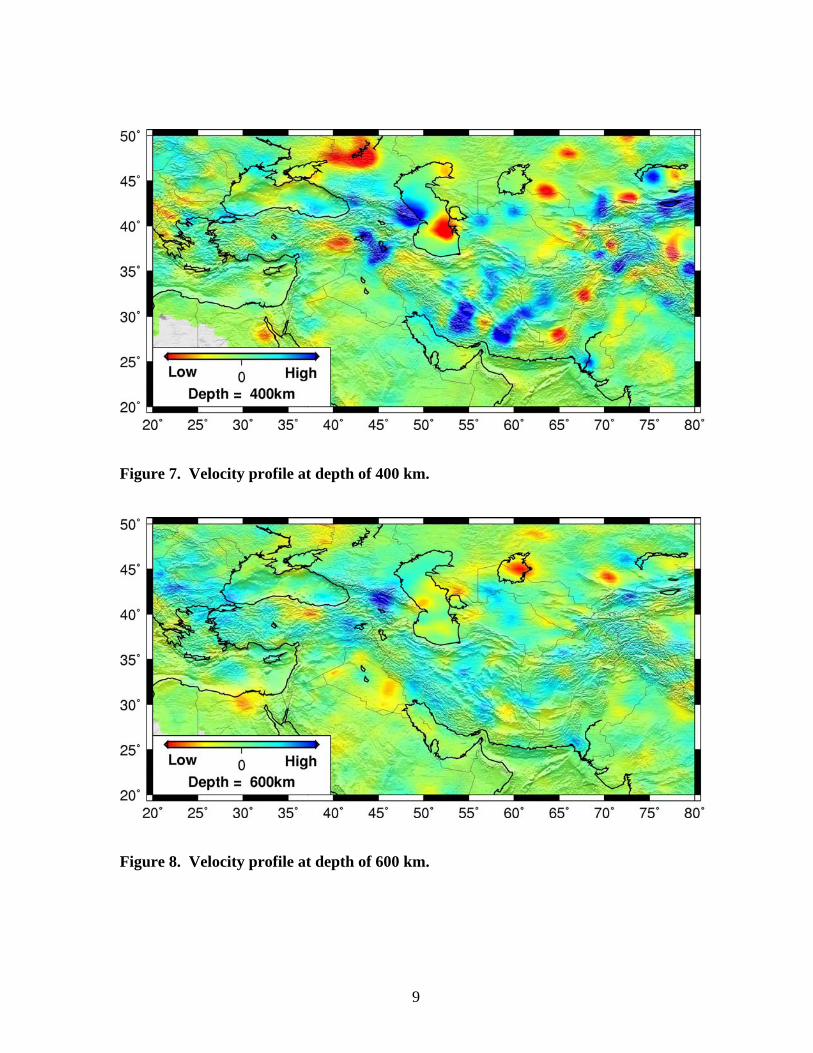
Figures 5 to 8 show the P-wave velocity profiles at depths of 50, 200, 400 and 600 km.
Figure 5. Velocity profile at depth of 50 km.
Figure 6. Velocity profile at depth of 200 km.
9
Figure 7. Velocity profile at depth of 400 km.
Figure 8. Velocity profile at depth of 600 km.
10
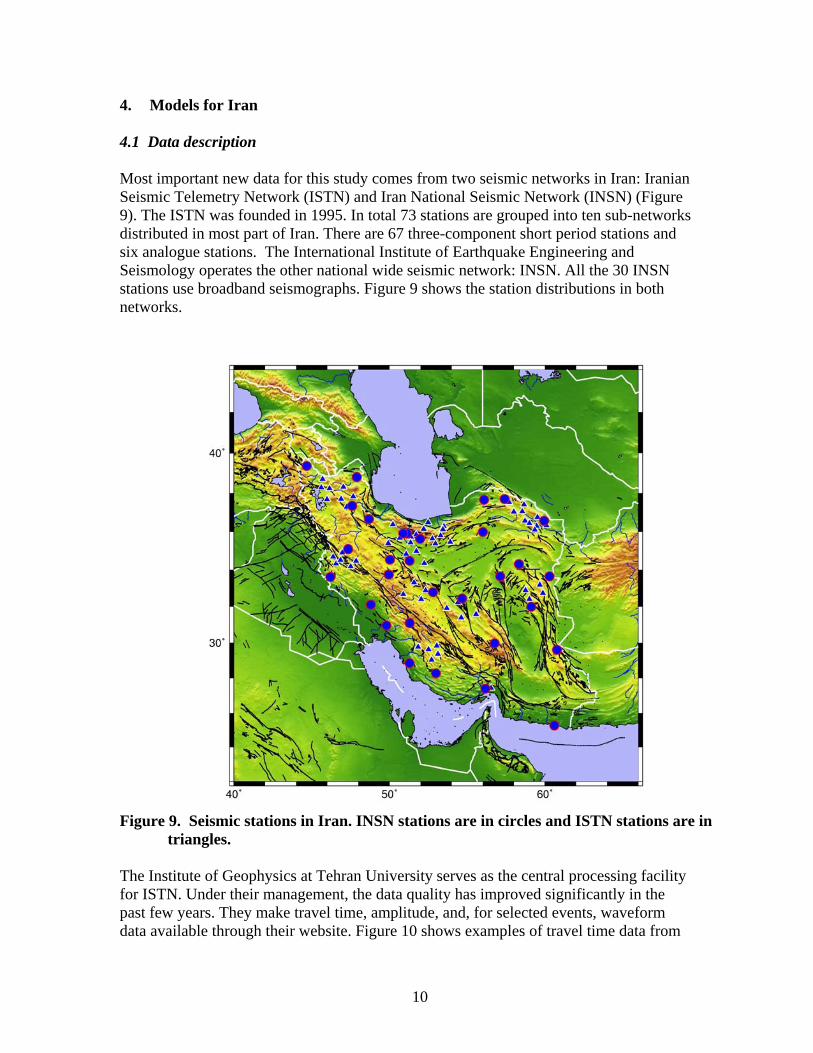
4. Models for Iran 4.1 Data description Most important new data for this study comes from two seismic networks in Iran: Iranian Seismic Telemetry Network (ISTN) and Iran National Seismic Network (INSN) (Figure 9). The ISTN was founded in 1995. In total 73 stations are grouped into ten sub-networks distributed in most part of Iran. There are 67 three-component short period stations and six analogue stations. The International Institute of Earthquake Engineering and Seismology operates the other national wide seismic network: INSN. All the 30 INSN stations use broadband seismographs. Figure 9 shows the station distributions in both networks.
Figure 9. Seismic stations in Iran. INSN stations are in circles and ISTN stations are in
triangles. The Institute of Geophysics at Tehran University serves as the central processing facility for ISTN. Under their management, the data quality has improved significantly in the past few years. They make travel time, amplitude, and, for selected events, waveform data available through their website. Figure 10 shows examples of travel time data from
11
both ISTN and INSN networks. Figure 11 shows the seismograms of a magnitude 4.9 event that occurred on 05/11/2009 at two stations: PAY and SRO. PAY is a short period station. SRO is a borehole station with a broad band sensor. The data from Iran is the newest and most important part of this study. Figure 10. Available P and S travel times from INSN (left) and ISTN (right) networks. Figure 11. Seismograms recorded at short period station (PAY) and in a borehole at
SRO.
SRO
PAY
12
4.2 Seismic tomography of the Iran and surrounding regions
The tomography research was completed based on our team’s extensive experience in travel-time tomography for the crust and mantle (Sun et al., 2004; Sun, 2005; Sun and ToksÖz, 2006; Sun et al., 2008a, b; Zhang and Thurber, 2003, 2005, 2006). The increased number of seismic stations, well-located earthquakes, and high-quality P and S wave travel-times have been used for generating a tomographic model of Iran and surrounding areas. The travel-time tomography was carried out in two steps. First, using the regional travel-time data, the 3-D crust uppermost mantle P and S wave velocity structures were determined. Second, the models were extended into the mantle transition zone by adding teleseismic travel-time data and constraining the crust and uppermost mantle velocities.
4.2.1 Data for seismic tomography
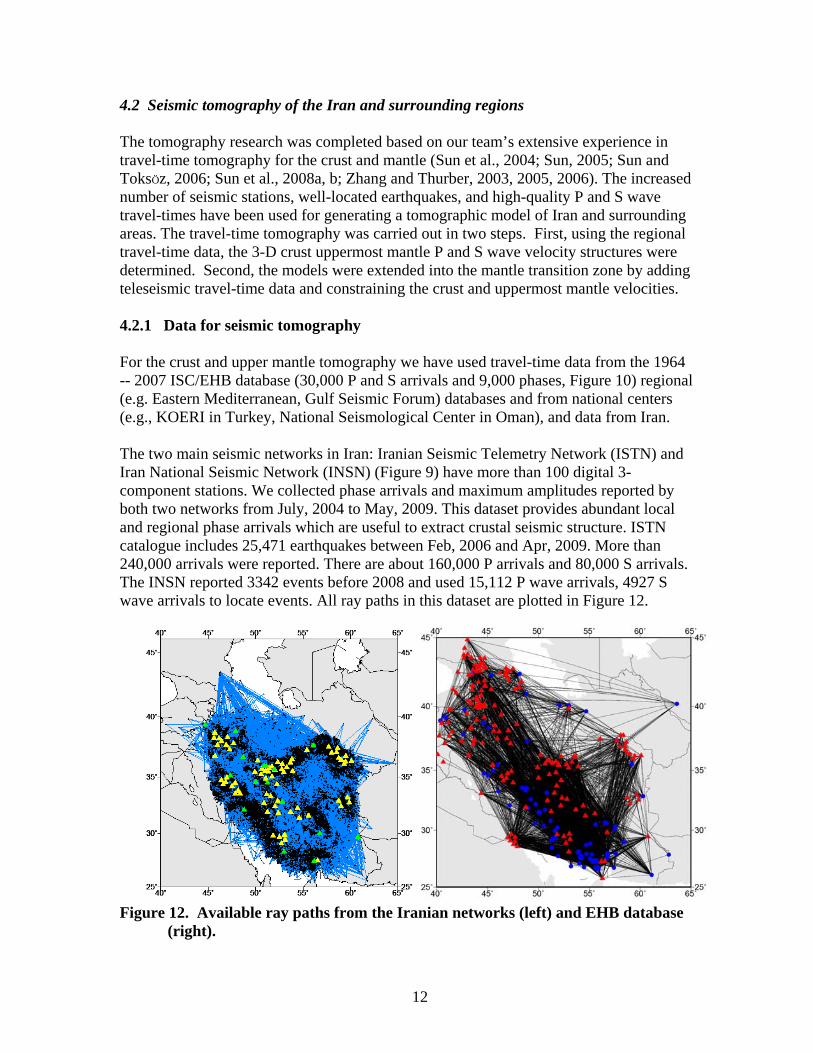
For the crust and upper mantle tomography we have used travel-time data from the 1964 -- 2007 ISC/EHB database (30,000 P and S arrivals and 9,000 phases, Figure 10) regional (e.g. Eastern Mediterranean, Gulf Seismic Forum) databases and from national centers (e.g., KOERI in Turkey, National Seismological Center in Oman), and data from Iran. The two main seismic networks in Iran: Iranian Seismic Telemetry Network (ISTN) and Iran National Seismic Network (INSN) (Figure 9) have more than 100 digital 3-component stations. We collected phase arrivals and maximum amplitudes reported by both two networks from July, 2004 to May, 2009. This dataset provides abundant local and regional phase arrivals which are useful to extract crustal seismic structure. ISTN catalogue includes 25,471 earthquakes between Feb, 2006 and Apr, 2009. More than 240,000 arrivals were reported. There are about 160,000 P arrivals and 80,000 S arrivals. The INSN reported 3342 events before 2008 and used 15,112 P wave arrivals, 4927 S wave arrivals to locate events. All ray paths in this dataset are plotted in Figure 12. Figure 12. Available ray paths from the Iranian networks (left) and EHB database
(right).

13
4.2.2 P- and S-Wave Travel-Time Tomography of the Crust and Upper Mantle
A high-resolution tomographic model for the heterogeneous crust is constructed by iterative, non-linear tomography. To generate adequate starting models for the nonlinear inversion we combine pertinent information from global (Mooney et al., 1998; Stevens et al., 2001; Ritzwoller et al., 2002), regional, and local crust and uppermost mantle models. Next, we use the adaptive moving window (AMW) approach (Sun et al., 2004, 2008b) to obtain crustal velocities and Pn and Sn models from a 1-D Monte Carlo inversion of local (≤ 20°) arrival time data in the whole region, building these into the next model (Model #2). The third step is a tomographic inversion of the local and regional arrival time data for 3-D variations in the P and S wave speed, using Model #2 as the initial input model.
For this purpose we use a modified version of Zhao’s tomographic method (Zhao et al., 1992, 1994; Zhao, 2001; Sun and ToksÖz, 2006), which allows for 3-D velocity variations everywhere in the model and can accommodate velocity discontinuities. The velocity structure is discretized using a 3-D grid. The velocity perturbation at each point is calculated by linear interpolation of the velocity perturbations at surrounding (adjacent) grid nodes. The velocity perturbations at grid nodes are the unknown parameters for the inversion procedure. To calculate travel-times and ray paths accurately and rapidly, the pseudo-bending technique (Um and Thurber, 1987) is used iteratively. We correct for station elevations by including station correction terms in the inversion. Finally, we apply an adaptive-mesh double-difference tomography method (Zhang and Thurber, 2005) to the newly assembled data set to further improve event locations and velocity models. Figure 13 shows Vp models at depths of 21 and 51 km obtained using the double-difference tomography method.
Figure 13. P-wave models at depths of 21 and 51 km obtained using the double-difference tomography method.
The extension of the velocity models into the mantle transition zone are accomplished by adding the teleseismic data from the 1964–2007 ISC/EHB database, which contains over
14
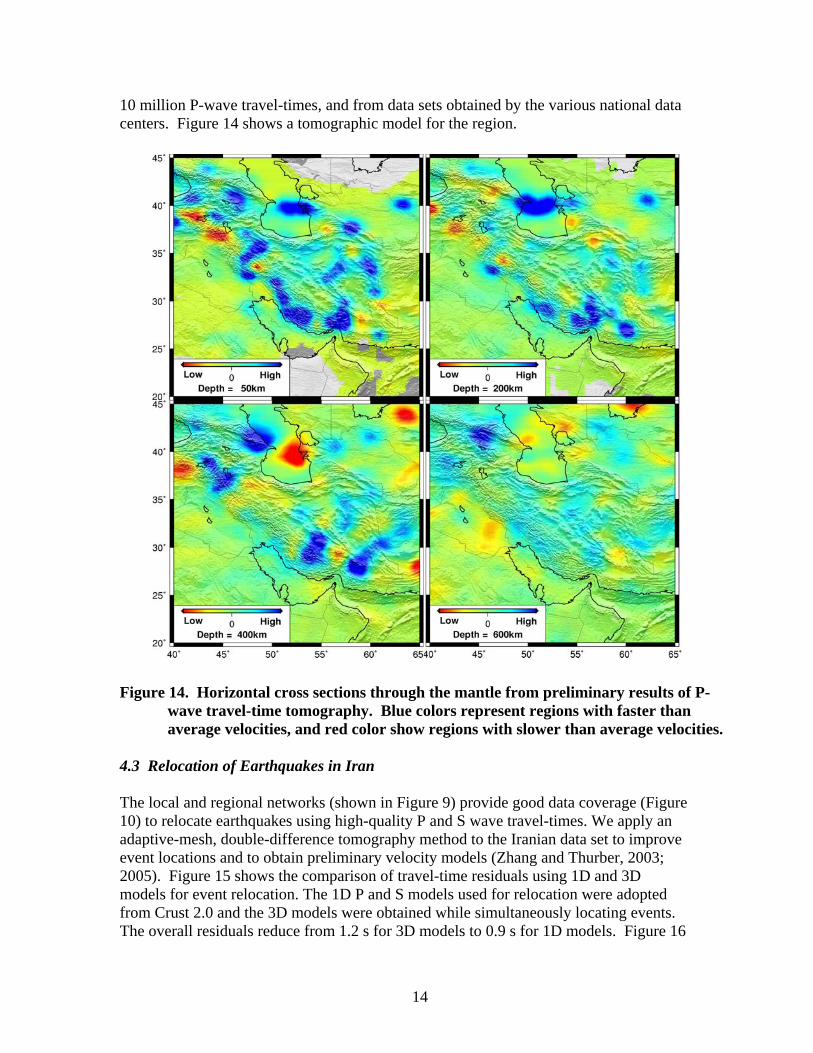
10 million P-wave travel-times, and from data sets obtained by the various national data centers. Figure 14 shows a tomographic model for the region.
Figure 14. Horizontal cross sections through the mantle from preliminary results of P-
wave travel-time tomography. Blue colors represent regions with faster than average velocities, and red color show regions with slower than average velocities.
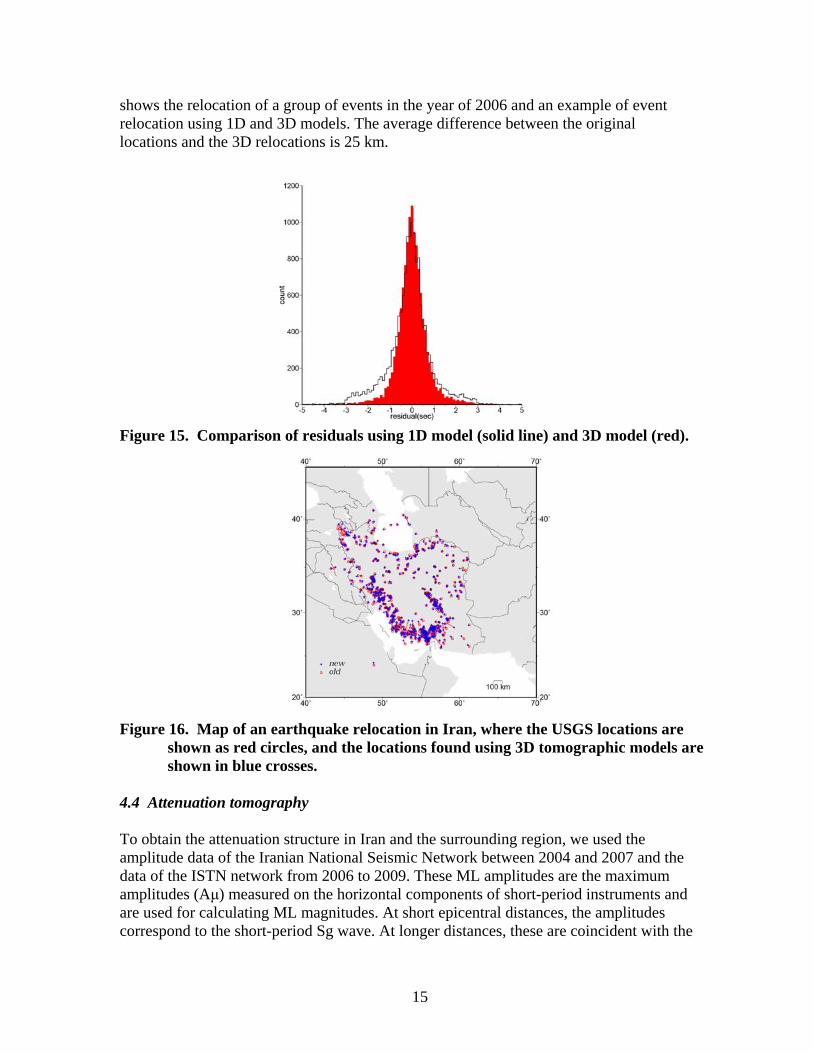
4.3 Relocation of Earthquakes in Iran The local and regional networks (shown in Figure 9) provide good data coverage (Figure 10) to relocate earthquakes using high-quality P and S wave travel-times. We apply an adaptive-mesh, double-difference tomography method to the Iranian data set to improve event locations and to obtain preliminary velocity models (Zhang and Thurber, 2003; 2005). Figure 15 shows the comparison of travel-time residuals using 1D and 3D models for event relocation. The 1D P and S models used for relocation were adopted from Crust 2.0 and the 3D models were obtained while simultaneously locating events. The overall residuals reduce from 1.2 s for 3D models to 0.9 s for 1D models. Figure 16
15
shows the relocation of a group of events in the year of 2006 and an example of event relocation using 1D and 3D models. The average difference between the original locations and the 3D relocations is 25 km. Figure 15. Comparison of residuals using 1D model (solid line) and 3D model (red). Figure 16. Map of an earthquake relocation in Iran, where the USGS locations are
shown as red circles, and the locations found using 3D tomographic models are shown in blue crosses.
4.4 Attenuation tomography To obtain the attenuation structure in Iran and the surrounding region, we used the amplitude data of the Iranian National Seismic Network between 2004 and 2007 and the data of the ISTN network from 2006 to 2009. These ML amplitudes are the maximum amplitudes (Aμ) measured on the horizontal components of short-period instruments and are used for calculating ML magnitudes. At short epicentral distances, the amplitudes correspond to the short-period Sg wave. At longer distances, these are coincident with the
16
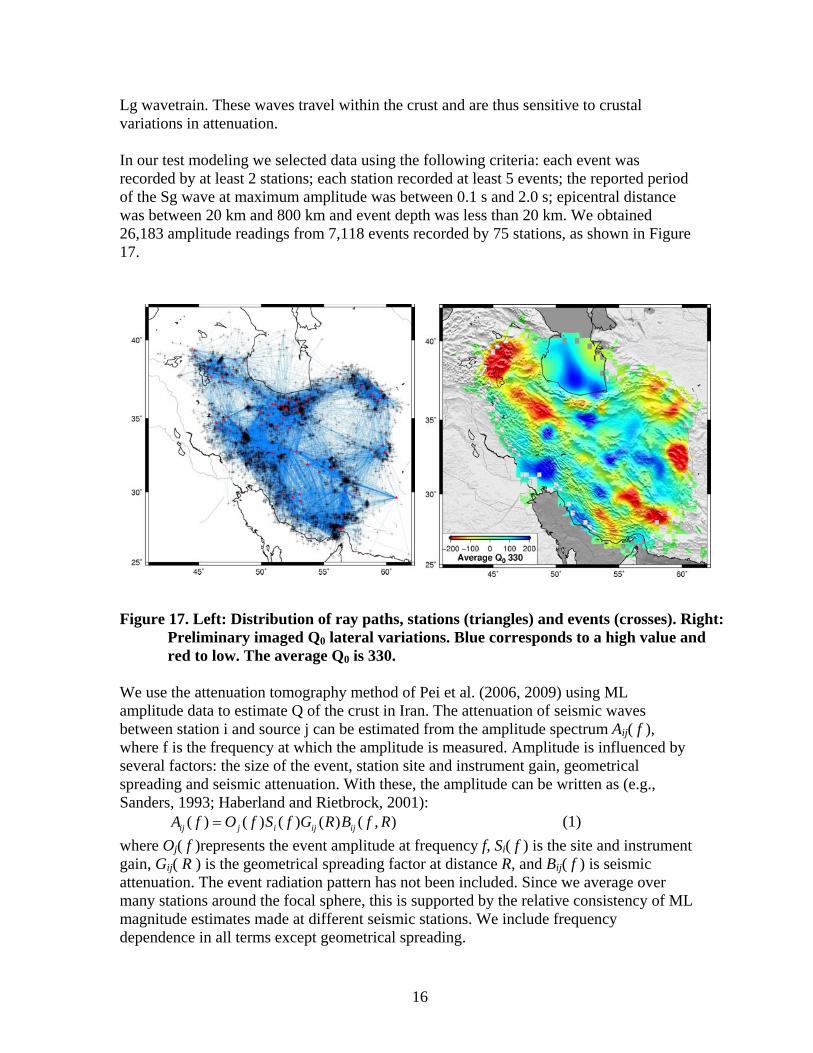
Lg wavetrain. These waves travel within the crust and are thus sensitive to crustal variations in attenuation. In our test modeling we selected data using the following criteria: each event was recorded by at least 2 stations; each station recorded at least 5 events; the reported period of the Sg wave at maximum amplitude was between 0.1 s and 2.0 s; epicentral distance was between 20 km and 800 km and event depth was less than 20 km. We obtained 26,183 amplitude readings from 7,118 events recorded by 75 stations, as shown in Figure 17. Figure 17. Left: Distribution of ray paths, stations (triangles) and events (crosses). Right:
Preliminary imaged Q0 lateral variations. Blue corresponds to a high value and red to low. The average Q0 is 330.
We use the attenuation tomography method of Pei et al. (2006, 2009) using ML amplitude data to estimate Q of the crust in Iran. The attenuation of seismic waves between station i and source j can be estimated from the amplitude spectrum Aij( f ), where f is the frequency at which the amplitude is measured. Amplitude is influenced by several factors: the size of the event, station site and instrument gain, geometrical spreading and seismic attenuation. With these, the amplitude can be written as (e.g., Sanders, 1993; Haberland and Rietbrock, 2001):
( ) ( ) ( ) ( ) ( , )ij j i ij ijA f O f S f G R B f R (1)
where Oj( f )represents the event amplitude at frequency f, Si( f ) is the site and instrument gain, Gij( R ) is the geometrical spreading factor at distance R, and Bij( f ) is seismic attenuation. The event radiation pattern has not been included. Since we average over many stations around the focal sphere, this is supported by the relative consistency of ML magnitude estimates made at different seismic stations. We include frequency dependence in all terms except geometrical spreading.
17
We use a frequency dependent source spectrum O( f ) (Brune, 1970; Hanks and Wyss, 1972) that can be described by a long-period spectral level Ω0 and the corner frequency fc as O(f) = Ω0 / (1 + (f 2 / fc
2)). The Ω0 is proportional to the seismic moment M0. Frequency f and corner frequency fc can be considered as constants for one event, and frequency f corresponds to the frequency of the recorded waveform at maximum amplitude of Sg. We assume source spectrum O( f ) is frequency independent for one event, although it is variable for different events. The site response, Si( f ),includes the effect of instrument gain and site amplification. The spectral dependence of Si( f ) is unknown; however, the ML bandwidth is small (0.5 Hz to 2 Hz) and the instrument response is reasonably flat within this range. We therefore assume Si( f ) is also independent of frequency. The geometrical spreading, G(R), is considered to be proportional to (1/R)k, where k is the geometrical spreading coefficient, which chiefly depends on wave type. k = 1.0 implies spherical spreading of body waves and k = 0.5 represents cylindrical spreading of Lg and surface waves. The attenuation of S waves, Bij( f ), is attributed to the quality factor Q. We assume a frequency dependent Q and model it as an exponential decay (e.g. Sanders, 1993; Haberland and Rietbrock, 2001):
10( ) exp( ) exp( )ij
fRB f cQ R
vQ
(2)
where c = πf 1-η/v, Q = Q0f η, Q0 and η are the S-wave Q at 1 Hz and its frequency exponent, respectively.
Using equation (2) and taking the natural logarithm of equation (1) yields 1
0ln ( ) ln ( )ij ij ij i jY A f G R a b Q cR (3)
where the station term is ln ( )i ia S f and event term is ln ( )j jb O f . Equation (3) is
very similar to the Pn travel time equation (Pei et al., 2007), thereby allowing us to resolve lateral variation of Q0 using the Pn tomography method. We first estimate the average Q0 by fitting the line Y — cR. Then we discretize the crust into small 2-D pixels of X km by Y km, then equation (3) can be rewritten as
10ij i j k ijk
k
Y a b Q cR .
By subtracting Yij from the average model (fitted line), a perturbation equation can be determined as follows
10ij i j k ijk
k
Y a b Q cR . (4)
Equation (4) can be recast as A x = d, where d is the data vector, x is the vector of unknowns and A represents the model parameters. We apply damped LSQR (Paige and Saunders, 1982) with preconditioning to find the least-squares solution. Laplacian smoothing was applied in the inversion (Lees and Crosson, 1989). We apply this approach to data from Iran as shown in Figure 17.
18
References
Al-Damegh, K., E. Sandvol, A. Al-Lazki, and M. Barazangi (2004). Regional seismic wave propagation (Lg and Sn) and Pn attenuation in the Arabian Plate and surrounding regions, Geophys. J. Int. 157: 775–795.
Alinaghi, A., I. Koulakov, and H. Thybo (2007). Seismic tomographic imaging of P- and S-waves velocity perturbations in the upper mantle beneath Iran, Geophysical Journal International, 169, 3, 1089-1102.
Al-Lazki, A., E. Sandvol, D. Seber, M. Barazangi, and N. Turkelli (2003). Pn tomographic imaging of mantle lid velocity and anisotropy at the junction of the Arabian, Eurasian, and African plates, Geophys. Res. Lett. 30: doi:10.1029/2003GL017391.
Al-Lazki, A. I., E. Sandvol, D. Seber, M. Barazangi, N. Turkelli, and R. Mohamad (2004). Pn tomographic imaging of mantle lid velocity and anisotropy at the junction of the Arabian, Eurasian and African plates, Geophys. J. Int. 158: 1024–1040.
Bergman, E.A., E.R. Engdahl, M.H. Ritzwoller, and S.C. Myers (2008). Crustal structure of the Iran region from in-country and ground truth data, Proceedings of the 30th Monitoring Research Review of Ground-Based Nuclear Explosion Monitoring Technologies, 10 pages, Portsmouth, VA (Sept 23 – 25).
Bird, P. (1978). Finite-element modeling of lithosphere deformation: The Zagros collision orogeny, Tectonophysics 50: 307–336.
Brune, J. N. (1970). Tectonic stress and the spectra of seismic shear waves from earthquakes, J. Geophys. Res. 75, 4997-5009.
Cong, L. and B. J. Mitchell (1998). Seismic velocity and Q structure of the Middle Eastern crust and upper mantle from surface wave dispersion and attenuation, Pure Appl. Geophys. 153: 503–538.
Dewey, J. F., M. R. Hempton, W. S. F. Kidd, F. Saroglu, and A. M. C. Şengör (1986). Shortening of continental lithosphere: The neotectonics of eastern Anatolia—A young collision zone, in Collision Tectonics, M. P. Coward and A. C. Ries (eds.) London: Geol. Soc. London, pp. 3–36.
Engdahl, E. R., R. D. van der Hilst, and R. Buland (1998). Global teleseismic earthquake relocation with improved travel times and procedures for depth determination, Bull. Seism. Soc. Am. 88: 722–743.
Gök, R., N. Turkelli, E. Sandvol, D. Seber, and M. Barazangi (2000). Regional wave propagation in Turkey and surrounding regions, Geophys. Res. Lett. 27: 429–432.
Haberland, C., and A. Rietbrock (2001). Attenuation tomography in the western central Andes: A detailed insight into the structure of a magmatic arc, J. Geophys. Res. 106, 11,151-11,167.
Hanks, T. C., and M. Wyss (1972). The use of body-wave spectra in the determination of seismic-source parameters, Bull. Seism. Soc. Am. 62, 561-589.
Hearn, T. M. and J. Ni (1994). Pn velocities beneath continental collision zones: The Turkish-Iranian plateau, Geophys. J. Int. 117: 273–283.
Hearn, T. M. (1996). Anisotropic Pn tomography in the western United States, J. Geophys. Res. 101: 8403–8414.
Jackson, J. and D. McKenzie (1984). The active tectonics of the Alpine-Himalayan belt between western Turkey and Pakistan, Geophys. J. R. Astron. Soc. 77: 185–265.
19
Jamberie, A. L. and B. J. Mitchell (2004). Shear wave Q structure and its lateral variation in the crust of China and surrounding regions, Geophys. J. Int. 157: 363–380.
Kadinsky-Cade, J., M. Barazangi, J. Oliver, and V. Isacks (1981). Lateral variation in high-frequency seismic wave propagation at regional distances across the Turkish and Iranian plateaus, J. Geophys. Res. 86: 9377–9396.
Kennett, B. L. N., E .R. Engdahl, and R. Buland (1995). Constrains on seismic velocities in the Earth from travel times, Geophys. J. Int. 122: 108–124.
Lees, J. M., and R. S. Crosson (1989). Tomographic inversion for three-dimensional velocity structure at mount St. Helens using earthquake data, J. Geophys. Res. 94, 5716-5728.
Maggi, A. and K. Priestley (2005). Surface waveform tomography of the Turkish-Iranian plateau, Geophys. J. Int. 160: 1068–1080.
Mindevalli, O. Y. and B. J. Mitchell (1989). Crustal structure and possible anisotropy in Turkey from seismic surface wave dispersion, Geophys. J. R. Astron. Soc. 98: 93–106.
Mitchell, B. J., Y. Pan, J. Xie, and L. Cong (1997). Lg code Q variation across Eurasia and its relation to crustal evolution, J. Geophys. Res. 102: 22,767–22,779.
Mokhtar, T. H., C. A. Ammon, R. B. Herrmann, and A. A. Ghalib (2001). Surface wave velocity across Arabia, Pure Appl. Geophys. 158: 144–1425.
Molinaro, M., H. Zeyen, and X. Laurencin (2005). Lithospheric structure beneath the southeastern Zagros Mountains, Iran: Recent slab break-off? Terra Nova, doi: 10.1111/j.1365-3121.2004.00575.
Mooney, W.D., G. Laske, and G. masters (1998). CRUST 5.1: A global crustal model at 5°× 5°, J. Geophys. Res., 103, 727-747.
Paige, C. C., and M. A. Saunders (1982). LSQR, An algorithm for sparse linear equations and sparse linear system, ACM Trans. Math. Software, 8, 43-71.
Pasyanos, M. E. and W. R. Walter (2002). Crust and upper mantle structure of North Africa, Europe, and the Middle East from inversion of surface waves, J. Geophys. Int. 149: 463–481.
Pasyanos, M. E., E.M. Matzel, W.R. Walter, and A.J. Rodgers (2009). Broad-band Lg attenuation modelling in the Middle East, Geophys. J. Int., 177 , 1166–1176.
Pasyanos, M. E., W. R. Walter, and S. E. Hazler (2001). A surface wave dispersion study of the Middle East and North Africa for monitoring the comprehensive Nuclear-Test-Ban Treaty, Pure Appl. Geophys. 158: 1445–1474.
Pei, S., J. Zhao, C. A. Rowe, S. Wang, T. M. Hearn, Z. Xu, H. Liu and Y. Sun (2006), ML Amplitude Tomography in North China, Bull. Seism. Soc. Am., 96, 1560-1566, doi:10.1785/0120060021.
Pei, S., J. Zhao, Y. Sun, Z. Xu, S. Wang, H. Liu, C. A. Rowe, M. Nafi Toksöz, X. Gao (2007), Upper mantle seismic velocities and anisotropy in China determined through Pn and Sn tomography, J. Geophys. Res., 112, B05312, doi:10.1029/2006JB004409.
Pei, S., Z. Cui, Y. Sun, M. N. Toksöz, C.A. Rowe, X. Gao, J. Zhao, H. Liu, J. He, F. D. Morgan (2009), Structure of the Upper Crust in Japan from S-wave Attenuation Tomography, Bull. Seism. Soc. Am., vol. 99, No. 1, pp. 428–434, February 2009, doi: 10.1785/0120080029.
Phillips, W. S., M. L. Begnaud, C. A. Rowe, L. K. Steck, S. C. Myers, M. E. Pasyanos, and S. Ballard (2007). Accounting for lateral variations of the upper mantle gradient in Pn tomography studies, Geophys. Res. Lett., 34, L14312, doi:10.1029/2007GL029338.
20
Priestley, K, D. McKenzie, E. Debayle, J. Jackson, M. Tatar, (2008). Thick lithospheric root beneath the Zagros Mountains of Iran, Eos Trans. AGU, 89(53), Fall Meet. Suppl., Abstract T23D-07.
Reiter, D. and W. Rodi (2006). Crustal and upper-mantle P- and S-velocity structure in central and southern Asia from joint body-and surface-wave inversion, in Proceedings of the 28th Seismic Research Review: Ground-Based Nuclear Explosion Monitoring Technologies, LA-UR-06-5471, Vol. 1, pp. 209–218.
Ritzwoller, M. and A. Levshin (1998). Eurasian surface wave tomography: Group velocities, J. Geophys. Res. 103: 4839–4878.
Ritzwoller, M., A. Levshin, L. Ratnikova, and A. Egorkin (1998). Intermediate-period group-velocity maps across Central Asia, western China, and parts of the Middle East, Geophys. J. Int. 134: 315–328.
Ritzwoller, M. H., M. P. Barmin, A. Villasenor, A. L. Levshin, and E. R. Engdahl (2002). Pn and Sn tomography across Eurasia to improve regional seismic event locations, Tectonophysics 358: 39–55.
Rodgers, A. J., J. F. Ni, and T. N. Hearn (1987). Propagation characteristics of short-period Sn and Lg in the Middle East, Bull. Seism. Soc. Am. 87: 396–413.
Rodgers, A. J., W. R. Walter, R. J. Mellors, A. M. S. Al-Amri, and Y-S. Zhang (1999). Lithospheric structure of the Arabian Shield and Platform from complete regional waveform modeling and surface wave group velocities, Geophys. J. Int. 138: 871–878.
Sanders, C. O. ( 1993). Local earthquake tomography: attenuation theory and results, in Seismic Tomography: Theory and Practice, edited by H. Iyer and K. Hirahara, pp. 676-694, Chapman and Hall, New York.
Sandvol, E., K. Al-Damegh, A. Calvert, D. Seber, M. Barazangi, R. Mohamad, R. Gok, N. Turkelli, and C. Gurbuz (2001). Tomographic imaging of Lg and Sn propagation in the Middle East, Pure and Appl.Geophys. 158: 1121–1163.
Seber, D. and B. Mitchell (1992). Attenuation of surface waves across the Arabian Peninsula, Tectonophysics 204: 137–170.
Şengör, A. M. C. and Y. Yılmaz (1981). Tethyan evolution of Turkey: A plate tectonic approach, Tectonophysics 75: 181–241.
Shapiro, N. M. and M. H. Ritzwoller (2002). Monte-Carlo inversion for a global shear velocity model of the crust and upper mantle, Geophys. J. Int. 152: 88–105.
Stevens, J. L., D. A. Adams, and G. E. Baker (2001). Improved surface wave detection and measurement using phase-matched filtering with a global one-degree dispersion model, in Proc. of 23rd Seismic Research Review: Worldwide Monitoring of Nuclear Explosions, 420-430, Jackson Hole, Wyoming, 2-5 October 2001.
Sun, Y. (2005). P- and S- wave tomography of the crust and uppermost mantle in China and surrounding areas. PhD thesis, MIT, Cambridge, MA.
Sun, Y. and M.N. Toksoz, 2006, Crustal structure of China and surrounding regions from P wave traveltime tomography, J. Geophys Res., 111, B03310, doi:10.1029/2005JB003962.
Sun, Y., M. N. Toksoz, S. Pei, and F. D. Morgan (2008b). The layered shear wave velocity structure of the crust and uppermost mantle in China, Bull. Seism. Soc. Am.,98(2), 746-755; doi: 10.1785/0120050222.
21
Sun, Y., M. N. Toksoz, S. Pei, D. Zhao, F. D. Morgan, and A. Rosca (2008a). S-wave tomography of the crust and uppermost mantle in China, J. Geophys. Res., 113, B11307, doi:10.1029/2008JB005836.
Sun, Y., X. Li, S. Kuleli, F. D. Morgan, and M. N. Toksöz, (2004), Adaptive moving window method for 3-D P-velocity tomography and its application in China. Bull. Seism. Soc. Am. 94, 740-746.
Um, J., and C. Thurber, (1987), A fast algorithm for two-point seismic ray tracing. Bull. Seism. Soc. Am. 77, 972-986.
Villasenor, A., M. H. Ritzwoller, A. L. Levshin, M. P. Barmin, E. R. Engdahl, W. Spakman, and J. Trampert (2001). Shear velocity structure of central Eurasia from inversion of surface wave velocities, Physics of the Earth and Planetary Interiors 123: 169–184.
Zhang, H., and C. H. Thurber (2003). Double-Difference Tomography: The Method and Its Application to the Hayward Fault, California, Bull. Seismol. Soc. Am., 93, 1875-1889.
Zhang, H., and C. Thurber (2005). Adaptive-mesh seismic tomography based on tetrahedral and Voronoi diagrams: Application to Parkfield, California, J. Geophys. Res., 110, B04303, doi:10.1029/2004JB003186.
Zhang, H., and C. Thurber (2006). Development and applications of double-difference tomography, Pure and Applied Geophys., 163, 373-403, doi:10.1007/s00024-005-0021-y.
Zhao, D. (2001). Seismic structure and origin of hotspots and mantle lumes. Earth Planet. Sci. Lett., 192, 251-265.
Zhao, D., A. Hasegawa, H. Kanamori (1994). Deep structure of Japan subduction zone as derived from local, regional and teleseismic events, J. Geophys. Res., 99, 22313-22329.
Zhao, D., A. Hasegawa, and S. Horiuchi, (1992), Tomographic imaging of P and S wave velocity structure beneath northeastern Japan. J. Geophys. Res., 97, 19909-19928.
Zor E., Sandvol E., J. Xie, N. Türkelli, B. Mitchell, A. H. Gasanov, and G. Yetirmishli (2007). Crustal Attenuation within the Turkish Plateau and Surrounding Regions. Bull. Seismol. Soc. Am., 97, 151-161.

22
Appendices Appendix I Deliverables:
1) Event catalogue in the Mideast region; (Mideast_pha.txt) 2) Crust velocity model in the Mideast; (Mideast_crust_vel.txt) 3) Mantle velocity model in the Mideast;
(Mideast_mantle_vel.txt, at 50, 200, 400 600 km) 4) Pn and Sn velocities in the Mideast; (Mideast_Pn_vel.txt; Mideast_Sn_vel.txt) 5) Relocated events in Iran. (iran_relocated_catalog.txt)
23
Appendix II
Tomographic Pn and Sn Velocity beneath Continental Collision Zone in Middle East and Middle Asia
Shunping Pei1,2 Youshun Sun2 M. Nafi Toksöz2
1) Institute of Tibetan Plateau Research, Chinese Academy of Sciences, Beijing
100085, China 2) Earth Resources Laboratory, Massachusetts Institute of Technology, USA
Email: [email protected]
To be submitted to the Journal of Geophysical Research May 17, 2010
Abstract We have obtained Vp and Vs velocity images of the uppermost mantle beneath the Middle East region by performing tomographic inversion of both Pn and Sn travel times. 654,999 Pn arrivals and 121,838 Sn arrivals were selected from the ISC/EHB database and the Annual Bulletin of Chinese Earthquakes. Average Pn and Sn velocities are 8.04 km/s and 4.60 km/s, respectively, and maximum velocity perturbations are about 6%. Pn velocity has a close relationship with topography. In general, the mountains with high elevation have low velocity, while the seas, basins and plains with low elevation have high velocity because the mountains are collision zones with strong tectonic activity and the stable plates have low elevation. The large tectonic lines are boundaries between high and low Pn velocity, such as the Hellenic arc, Cyprean arc, Zagros suture, the Charman fault, and the Hari Rod fault. The Sn velocity has a very similar pattern to Pn velocity.
Key Words: Tomography, Pn and Sn velocity, Middle East Primary Index Term: 8180 Tomography; 7218 Lithosphere
24
1. INTRODUCTION The Arabian-Eurasian plate boundary is extremely complex, and it is an ideal region
to study a young (geologically) continent-continent collision belt. The current tectonics of the region are controlled by the collision and continuing convergence of the Arabian and Eurasian plates (Figure 1). The Arabian and Eurasian plates collided in the early Miocene, after the Neotethys Sea was subducted beneath Eurasia (Bird, 1978; Şengör and Yılmaz, 1981; Jackson and McKenzie, 1984; Dewey et al., 1986). Pre-, syn-, and postcollision tectonics produced very complex structures in the region. Over the last decade, a number of seismic studies have examined the crust and upper mantle structure beneath the Middle East to constrain the nature of the Arabian-Eurasian collision zone. Large scale surface wave tomography studies have shown variable crustal thickness and upper mantle velocities (Ritzwoller and Levshin, 1998; Pasyanos et al., 2001; Villasenor et al., 2001; Pasyanos and Walter, 2002; Shapiro and Ritzwoller, 2002; Alinaghi et al., 2007; Reiter et al., 2005; Reiter and Rodi, 2006, 2008). Regional-scale surface wave tomographic studies further highlight the complexity of the collision zone (Mindevalli and Mitchell, 1989; Rodgers et al., 1999; Mohktar et al., 2001; Maggi and Priestley, 2005) showing a thickened crust under the Caucasus and Zagros, and low shear velocity beneath the Turkish and Iranian plateaus. Hearn and Ni (1994), Ritzwoller et al. (1998), Al-Lazki et al. (2003; 2004), and Phillips et al. (2007) found slow Pn velocities (≤ 8 km/s) beneath the Anatolian plateau, northwestern Iran, the Greater Caucasus, and southwestern Arabia. The Pn velocities beneath northern Arabia and the Caspian region are faster than average (Al Lazki et al., 2004; Ritzwoller et al., 2002; Angus et al., 2006). This high degree of variability suggests that the Earth structure may be extremely complicated in the region. The studies mentioned above present consistent results for the crust and uppermost mantle seismic properties on a regional scale. Significant variation in waveforms, observed particularly in short-period seismograms, over propagation paths that are close to each other, suggests structural variations over short distances at regional boundaries. Delineating these features requires seismic data from dense local and regional seismic networks. During this year we were able to increase the phase (arrival time) data significantly by adding readings from Iran and other regional networks.
In this work, we use many more Pn and Sn arrivals reported in the ISC/EHB (International Seismological Centre) database and many national seismic networks in the Middle East to construct a tomographic image of Pn and Sn seismic velocity beneath the Middle East and surrounding regions.
2. DATA
An important task under this project is to collect arrival time data from seismic stations situated in more than 20 countries in the region. A significant number of these stations are in networks that are relatively new and whose data are not available from global data centers such as IRIS or ISC. In the past year, Iran started to make phase data available from its networks. In Iran there are seven regional networks, deployed around major cities, with a total of 50 stations. Recently, Tehran University was designated as the central location that would collect and integrate data from the regional networks into a central database. The use of data from stations in Iran required deciphering of nomenclature and resolution of some apparent discrepancies between data from individual networks and the central database.
25
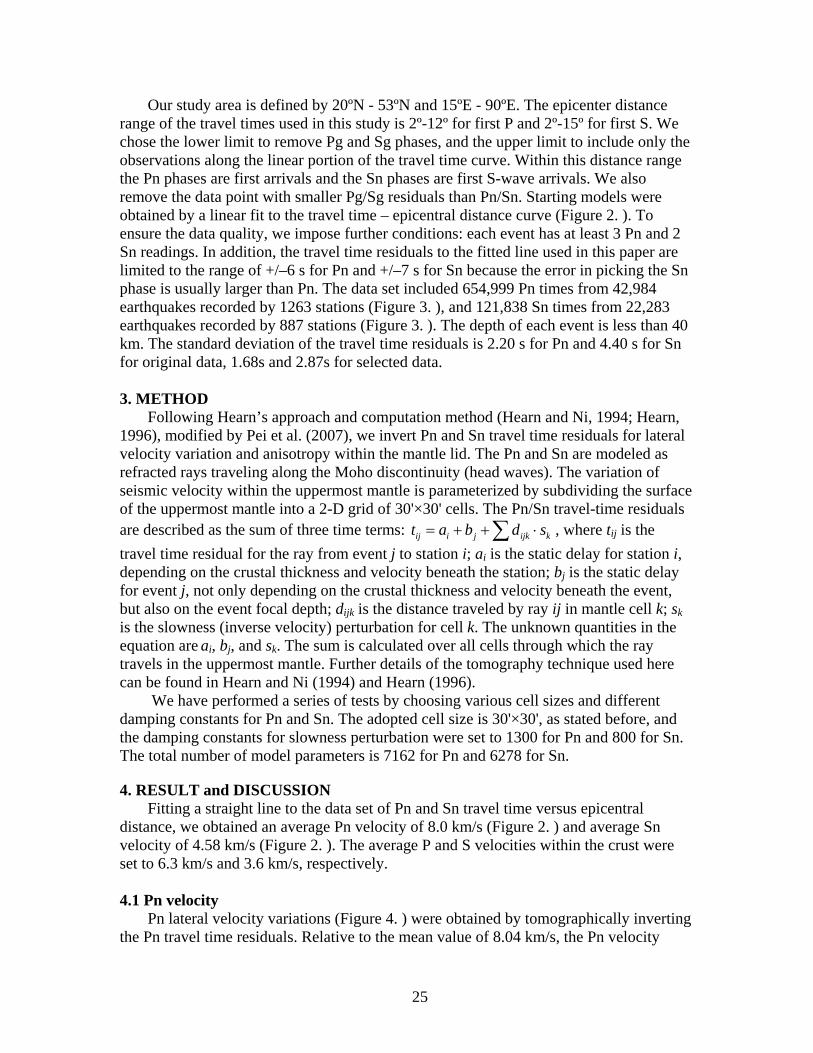
Our study area is defined by 20ºN - 53ºN and 15ºE - 90ºE. The epicenter distance range of the travel times used in this study is 2º-12º for first P and 2º-15º for first S. We chose the lower limit to remove Pg and Sg phases, and the upper limit to include only the observations along the linear portion of the travel time curve. Within this distance range the Pn phases are first arrivals and the Sn phases are first S-wave arrivals. We also remove the data point with smaller Pg/Sg residuals than Pn/Sn. Starting models were obtained by a linear fit to the travel time – epicentral distance curve (Figure 2. ). To ensure the data quality, we impose further conditions: each event has at least 3 Pn and 2 Sn readings. In addition, the travel time residuals to the fitted line used in this paper are limited to the range of +/–6 s for Pn and +/–7 s for Sn because the error in picking the Sn phase is usually larger than Pn. The data set included 654,999 Pn times from 42,984 earthquakes recorded by 1263 stations (Figure 3. ), and 121,838 Sn times from 22,283 earthquakes recorded by 887 stations (Figure 3. ). The depth of each event is less than 40 km. The standard deviation of the travel time residuals is 2.20 s for Pn and 4.40 s for Sn for original data, 1.68s and 2.87s for selected data.
3. METHOD
Following Hearn’s approach and computation method (Hearn and Ni, 1994; Hearn, 1996), modified by Pei et al. (2007), we invert Pn and Sn travel time residuals for lateral velocity variation and anisotropy within the mantle lid. The Pn and Sn are modeled as refracted rays traveling along the Moho discontinuity (head waves). The variation of seismic velocity within the uppermost mantle is parameterized by subdividing the surface of the uppermost mantle into a 2-D grid of 30'×30' cells. The Pn/Sn travel-time residuals are described as the sum of three time terms: ij i j ijk kt a b d s , where tij is the
travel time residual for the ray from event j to station i; ai is the static delay for station i, depending on the crustal thickness and velocity beneath the station; bj is the static delay for event j, not only depending on the crustal thickness and velocity beneath the event, but also on the event focal depth; dijk is the distance traveled by ray ij in mantle cell k; sk is the slowness (inverse velocity) perturbation for cell k. The unknown quantities in the equation are ai, bj, and sk. The sum is calculated over all cells through which the ray travels in the uppermost mantle. Further details of the tomography technique used here can be found in Hearn and Ni (1994) and Hearn (1996).
We have performed a series of tests by choosing various cell sizes and different damping constants for Pn and Sn. The adopted cell size is 30'×30', as stated before, and the damping constants for slowness perturbation were set to 1300 for Pn and 800 for Sn. The total number of model parameters is 7162 for Pn and 6278 for Sn.
4. RESULT and DISCUSSION
Fitting a straight line to the data set of Pn and Sn travel time versus epicentral distance, we obtained an average Pn velocity of 8.0 km/s (Figure 2. ) and average Sn velocity of 4.58 km/s (Figure 2. ). The average P and S velocities within the crust were set to 6.3 km/s and 3.6 km/s, respectively. 4.1 Pn velocity
Pn lateral velocity variations (Figure 4. ) were obtained by tomographically inverting the Pn travel time residuals. Relative to the mean value of 8.04 km/s, the Pn velocity
26
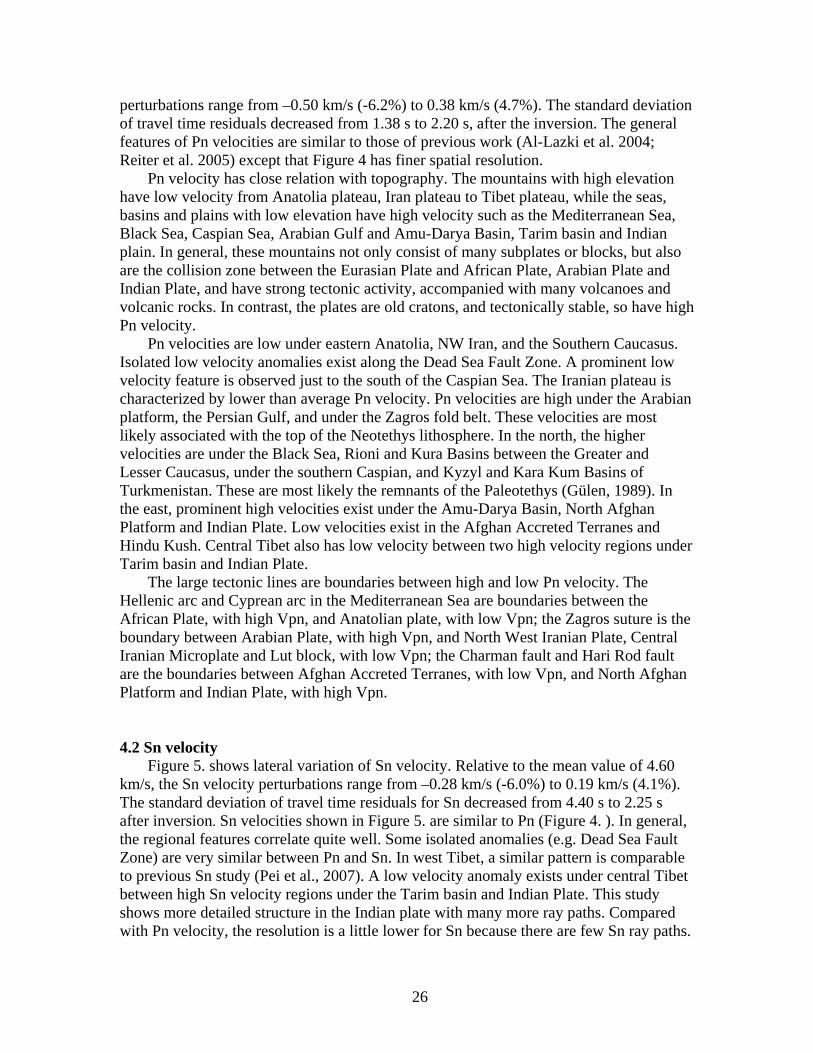
perturbations range from –0.50 km/s (-6.2%) to 0.38 km/s (4.7%). The standard deviation of travel time residuals decreased from 1.38 s to 2.20 s, after the inversion. The general features of Pn velocities are similar to those of previous work (Al-Lazki et al. 2004; Reiter et al. 2005) except that Figure 4 has finer spatial resolution.
Pn velocity has close relation with topography. The mountains with high elevation have low velocity from Anatolia plateau, Iran plateau to Tibet plateau, while the seas, basins and plains with low elevation have high velocity such as the Mediterranean Sea, Black Sea, Caspian Sea, Arabian Gulf and Amu-Darya Basin, Tarim basin and Indian plain. In general, these mountains not only consist of many subplates or blocks, but also are the collision zone between the Eurasian Plate and African Plate, Arabian Plate and Indian Plate, and have strong tectonic activity, accompanied with many volcanoes and volcanic rocks. In contrast, the plates are old cratons, and tectonically stable, so have high Pn velocity.
Pn velocities are low under eastern Anatolia, NW Iran, and the Southern Caucasus. Isolated low velocity anomalies exist along the Dead Sea Fault Zone. A prominent low velocity feature is observed just to the south of the Caspian Sea. The Iranian plateau is characterized by lower than average Pn velocity. Pn velocities are high under the Arabian platform, the Persian Gulf, and under the Zagros fold belt. These velocities are most likely associated with the top of the Neotethys lithosphere. In the north, the higher velocities are under the Black Sea, Rioni and Kura Basins between the Greater and Lesser Caucasus, under the southern Caspian, and Kyzyl and Kara Kum Basins of Turkmenistan. These are most likely the remnants of the Paleotethys (Gülen, 1989). In the east, prominent high velocities exist under the Amu-Darya Basin, North Afghan Platform and Indian Plate. Low velocities exist in the Afghan Accreted Terranes and Hindu Kush. Central Tibet also has low velocity between two high velocity regions under Tarim basin and Indian Plate.
The large tectonic lines are boundaries between high and low Pn velocity. The Hellenic arc and Cyprean arc in the Mediterranean Sea are boundaries between the African Plate, with high Vpn, and Anatolian plate, with low Vpn; the Zagros suture is the boundary between Arabian Plate, with high Vpn, and North West Iranian Plate, Central Iranian Microplate and Lut block, with low Vpn; the Charman fault and Hari Rod fault are the boundaries between Afghan Accreted Terranes, with low Vpn, and North Afghan Platform and Indian Plate, with high Vpn.
4.2 Sn velocity
Figure 5. shows lateral variation of Sn velocity. Relative to the mean value of 4.60 km/s, the Sn velocity perturbations range from –0.28 km/s (-6.0%) to 0.19 km/s (4.1%). The standard deviation of travel time residuals for Sn decreased from 4.40 s to 2.25 s after inversion. Sn velocities shown in Figure 5. are similar to Pn (Figure 4. ). In general, the regional features correlate quite well. Some isolated anomalies (e.g. Dead Sea Fault Zone) are very similar between Pn and Sn. In west Tibet, a similar pattern is comparable to previous Sn study (Pei et al., 2007). A low velocity anomaly exists under central Tibet between high Sn velocity regions under the Tarim basin and Indian Plate. This study shows more detailed structure in the Indian plate with many more ray paths. Compared with Pn velocity, the resolution is a little lower for Sn because there are few Sn ray paths.
27
5. CONCLUSION We have imaged both the Pn and Sn velocity structure of the Middle East using a large amount of data. We discuss in detail the relationship between velocity variations and tectonic activity, and we have arrived at the following conclusions: 1) The average Pn and Sn velocities are 8.04 km/s and 4.60 km/s, respectively. The
maximum velocity perturbations are about 6%. 2) Pn velocity has a close relation with topography. In general, the mountains with high
elevation have low velocity, while the seas, basins and plains with low elevation have high velocity because the mountains are collision zones with strong tectonic activity and the stable plates have low elevation.
3) The large tectonic lines are boundaries between high and low Pn velocity, such as the Hellenic arc, Cyprean arc, Zagros suture, Charman fault, Hari Rod fault.
4) The Sn velocity has a very similar pattern to Pn velocity. ACKNOWLEDGMENTS The authors sincerely thank Prof. Thomas M. Hearn for providing tomographic codes. This research was supported jointly by the National Natural Science Foundation of China (Grant No. 40674031) and the Earth Resources Laboratory at MIT (under contract number FA8718-04-C-0018).

28
References: Alinaghi, A., I. Koulakov, and H. Thybo (2007). Seismic tomographic imaging of P- and
S waves velocity perturbations in the upper mantle beneath Iran, Geophys. J. Int., 169, 3, 1089-1102.
Al-Lazki, A., E. Sandvol., D. Seber, M. Barazangi, and N. Turkelli (2003). Pn tomographic imaging of mantle lid velocity and anisotropy at the junction of the Arabian, Eurasian, and African plates, Geophys. Res. Lett., 30, doi:10.1029/2003GL017391.
Al-Lazki, A.I., E. Sandvol, D. Seber, M. Barazangi, N. Turkelli, and R. Mohamad (2004). Pn tomographic imaging of mantle lid velocity and anisotropy at the junction of the Arabian, Eurasian and African plates, Geophys. J. Int., 158, 1024-1040.
Angus, D. A., Wilson, David C., Sandvol, E., Ni, J. F (2006). Lithospheric structure of the Arabian and Eurasian collision zone in eastern Turkey from S-wave receiver functions, Geophys. J. Int., 166, 1335-1346.
Bird, P. (1978). Finite-element modeling of lithosphere deformation: The Zagros collision orogeny, Tectonophysics, 50, 307-336.
Dewey, J. F., M. R. Hempton, W. S. F. Kidd, F. Saroglu, and A. M. C. Segnor (1986). Shortening of continental lithosphere: The neotectonics of Eastern Anatolia – a young collision zone, in Collision Tectonics, edited by M. P. Coward and A. C., Ries, Geol. Soc. London, London, 3 – 36.
Gulen L. (1989). From plate tectonics to global domain tectonics, in: Crust/Mantle Recycling at Convergence Zones, S. R. Hart and L. GŸlen (eds.), NATO ASI Series, C258, Kluwer Academic Publishers, Boston, 173-179.
Hearn, T. M. (1996). Anisotropic Pn tomography in the western United States, J. Geophys. Res., 101, 8403-8414.
Hearn, T. M., and J. Ni (1994), Pn velocities beneath continental collision zones: The Turkish-Iranian plateau, Geophys. J. Int., 117, 273-283.
Hearn, T. M., S. Wang, J. F. Ni, Z. Xu, Y. Yu, and X. Zhang (2004), Uppermost mantle velocities beneath China and surrounding regions, J. Geophys. Res., 109, B11301, doi:10.1029/2003JB002874.
Jackson, J. and D. McKenzie (1984). The active tectonics of the Alpine-Himalayan belt between western Turkey and Pakistan, Geophys. J. R. Astron. Soc., 77, 185-265.
Maggi, A. and K. Priestley (2005). Surface waveform tomography of the Turkish-Iranian plateau, Geophys. J. Int., 160, 068-1080.
Mindevalli, O. Y., and B. J. Mitchell (1989). Crustal structure and possible anisotropy in Turkey from seismic surface wave dispersion, Geophys. J. R. Astron. Soc., 98, 93-106.
Mokhtar, T.H., C.A. Ammon, R.B. Herrmann, and A.A. Ghalib (2001). Surface wave velocity across Arabia, Pure Appl. Geophys. 158, 144–1425.
Pasyanos, M. E. and W. R. Walter (2002). Crust and upper mantle structure of North Africa, Europe, and the Middle East from inversion of surface waves, J. Geophys. Int., 149, 463-481.
29
Pasyanos, M.E., W. R. Walter, and S. E. Hazler (2001). A surface wave dispersion study of the Middle East and North Africa for monitoring the comprehensive Nuclear-Test-Ban Treaty, Pure Appl. Geophys., 158, 1445-1474.
Pei, S. P., Z. H. Xu, S. Y. Wang, and T. M. Hearn (2002), Pn velocity tomography in XinJiang, China, and adjacent regions, Chinese J. Geophys., 45, 217-224.
Pei, S., J. Zhao, Y. Sun, Z. Xu, S. Wang, H. Liu, C. A. Rowe, M. Nafi Toksöz, X. Gao (2007). Upper mantle seismic velocities and anisotropy in China determined through Pn and Sn tomography, J. Geophys. Res., 112, B05312, doi:10.1029/2006JB004409
Phillips, W. S., C. A. Rowe, and L. K. Steck (2005), The use of interstation P wave arrival time differences to account for regional path variability, Geophys. Res. Lett., 32, L11301, doi:10.1029/2005GL022558.
Phillips, W. S., M. L. Begnaud, C. A. Rowe, L. K. Steck, S. C. Myers, M. E. Pasyanos, and S. Ballard (2007). Accounting for lateral variations of the upper mantle gradient in Pn tomography studies, Geophys. Res. Lett., 34, L14312, doi:10.1029/2007GL029338.
Priestley, K, D. McKenzie, E. Debayle, J. Jackson, M. Tatar, (2008). Thick lithospheric root beneath the Zagros Mountains of Iran, Eos Trans. AGU, 89(53), Fall Meet. Suppl., Abstract T23D-07.
Reiter, D. and W. Rodi (2006). Crustal and upper-mantle P- and S-velocity structure in central and southern Asia from joint body- and surface-wave inversion, Proceedings of the 28th Seismic Research Review, Ground Based Nuclear Explosion Monitoring Technologies, LA-UR-06-5471, Vol. 1, pp. 209–218.
Reiter, D. and W. Rodi (2008). A new regional model 3-D velocity model for Asia from the joint inversion of P wave travel times and surface-wave dispersion data, 2008 Monitoring Research Review, FA8718-04-C-0027.
Reiter, D., W. Rodi, and M. Johnson (2005). Development of tomographic upper mantle velocity model beneath Pakistan and northern India for improved regional seismic-event location, J. Geophys. Res., 95, 926-940.
Ritzwoller, M. and A. Levshin (1998). Eurasian surface wave tomography: Group velocities, J. Geophys. Res. 103: 4839–4878.
Ritzwoller, M., A. Levshin, L. Ratnikova, and A. Egorkin (1998). Intermediate-period groupvelocity maps across Central Asia, western China, and parts of the Middle East, Geophys. J. Int., 134, 315-328.
Ritzwoller, M. H., M. P. Barmin, A. Villasenor, A. L. Levshin, and E. R. Engdahl (2002). Pn and Sn tomography across Eurasia to improve regional seismic event locations, Tectonophysics 358: 39–55.
Rodgers, A. J., W. R. Walter, R. J. Mellors, A.M.S. Al-Amri, and Y-S. Zhang (1999). Lithospheric structure of the Arabian Shield and Platform from complete regional waveform modeling and surface wave group velocities, Geophys. J. Int., 138, 871-878.
Sengor, A. M. C. and Y. Yılmaz (1981). Tethyan evolution of Turkey: A plate tectonic approach,Tectonophysics, 75, 181-241.
Shapiro, N.M. and M.H. Ritzwoller (2002). Monte-Carlo inversion for a global shear velocity model of the crust and upper mantle, Geophys. J. Int., 152, 88-105.

30
Villasenor, A., M. H. Ritzwoller, A. L. Levshin, M. P. Barmin, E. R. Engdahl, W. Spakman, and J. Trampert (2001). Shear velocity structure of central Eurasia from inversion of surface wave velocities, Phys. Earth Planet. Int., 123, 169-184.
31
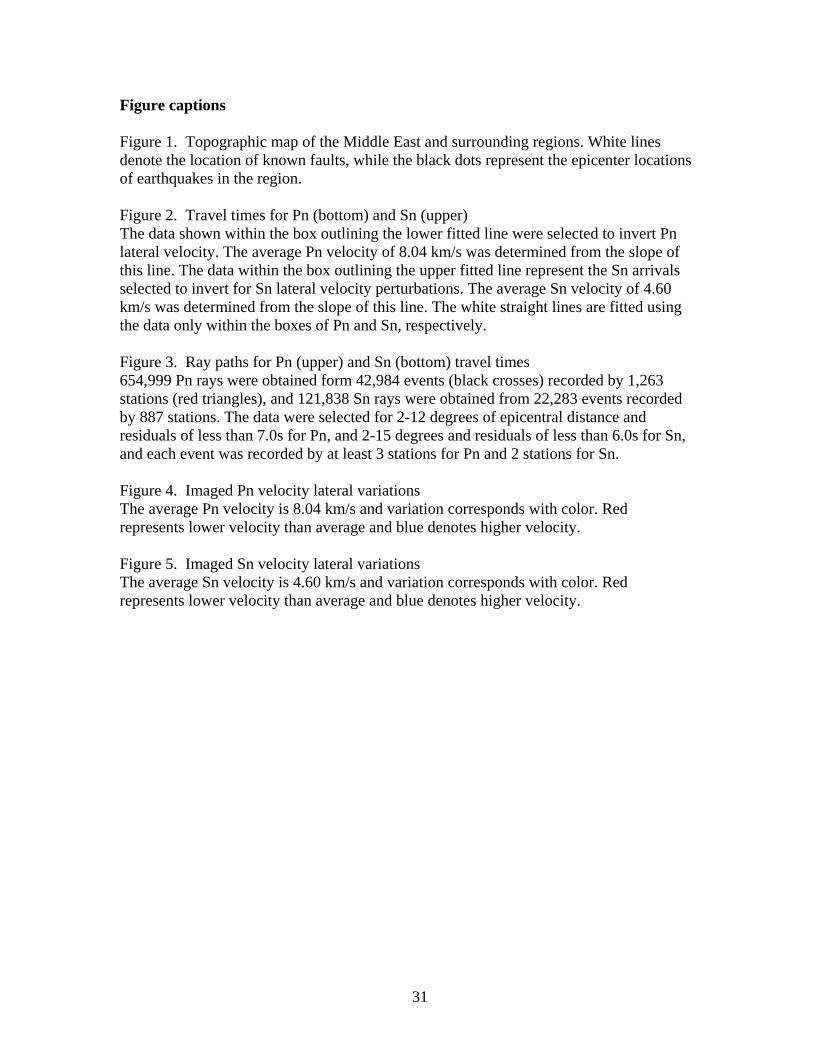
Figure captions Figure 1. Topographic map of the Middle East and surrounding regions. White lines denote the location of known faults, while the black dots represent the epicenter locations of earthquakes in the region. Figure 2. Travel times for Pn (bottom) and Sn (upper) The data shown within the box outlining the lower fitted line were selected to invert Pn lateral velocity. The average Pn velocity of 8.04 km/s was determined from the slope of this line. The data within the box outlining the upper fitted line represent the Sn arrivals selected to invert for Sn lateral velocity perturbations. The average Sn velocity of 4.60 km/s was determined from the slope of this line. The white straight lines are fitted using the data only within the boxes of Pn and Sn, respectively. Figure 3. Ray paths for Pn (upper) and Sn (bottom) travel times 654,999 Pn rays were obtained form 42,984 events (black crosses) recorded by 1,263 stations (red triangles), and 121,838 Sn rays were obtained from 22,283 events recorded by 887 stations. The data were selected for 2-12 degrees of epicentral distance and residuals of less than 7.0s for Pn, and 2-15 degrees and residuals of less than 6.0s for Sn, and each event was recorded by at least 3 stations for Pn and 2 stations for Sn. Figure 4. Imaged Pn velocity lateral variations The average Pn velocity is 8.04 km/s and variation corresponds with color. Red represents lower velocity than average and blue denotes higher velocity. Figure 5. Imaged Sn velocity lateral variations The average Sn velocity is 4.60 km/s and variation corresponds with color. Red represents lower velocity than average and blue denotes higher velocity.
32
Figure 1. Topographic map of the Middle East and surrounding regions. White lines
denote the location of known faults, while the black dots represent the epicenter locations of earthquakes in the region.
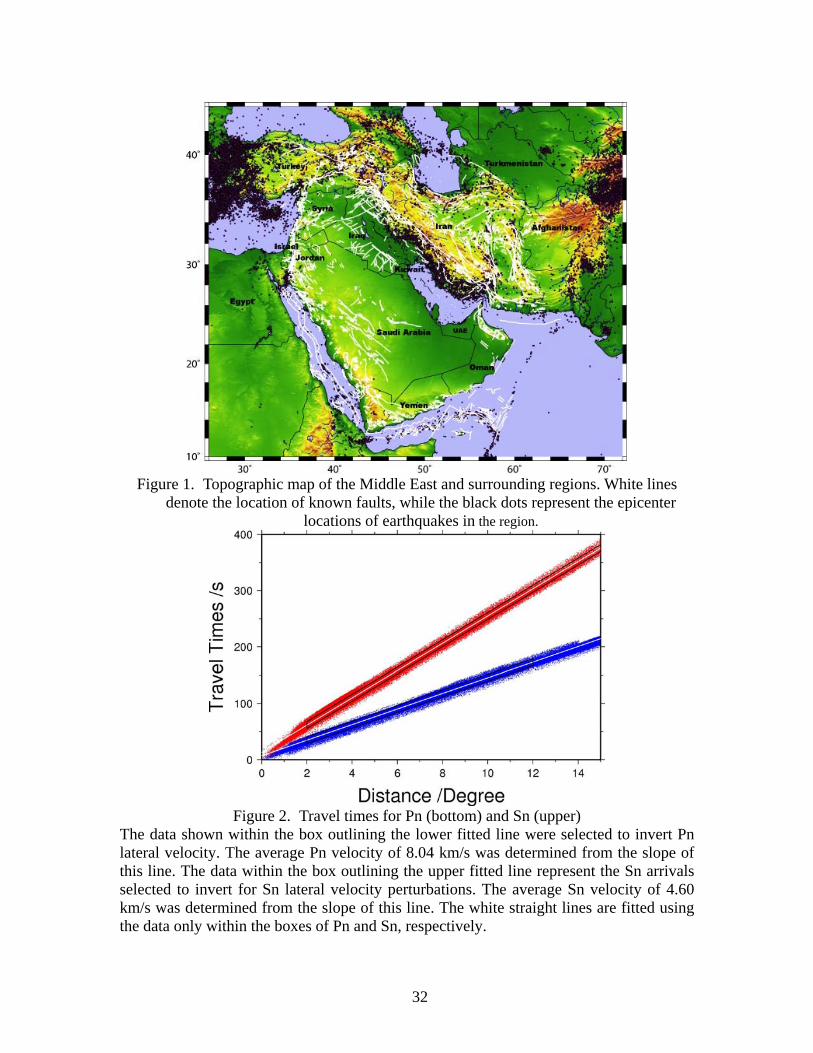
Figure 2. Travel times for Pn (bottom) and Sn (upper)
The data shown within the box outlining the lower fitted line were selected to invert Pn lateral velocity. The average Pn velocity of 8.04 km/s was determined from the slope of this line. The data within the box outlining the upper fitted line represent the Sn arrivals selected to invert for Sn lateral velocity perturbations. The average Sn velocity of 4.60 km/s was determined from the slope of this line. The white straight lines are fitted using the data only within the boxes of Pn and Sn, respectively.
33
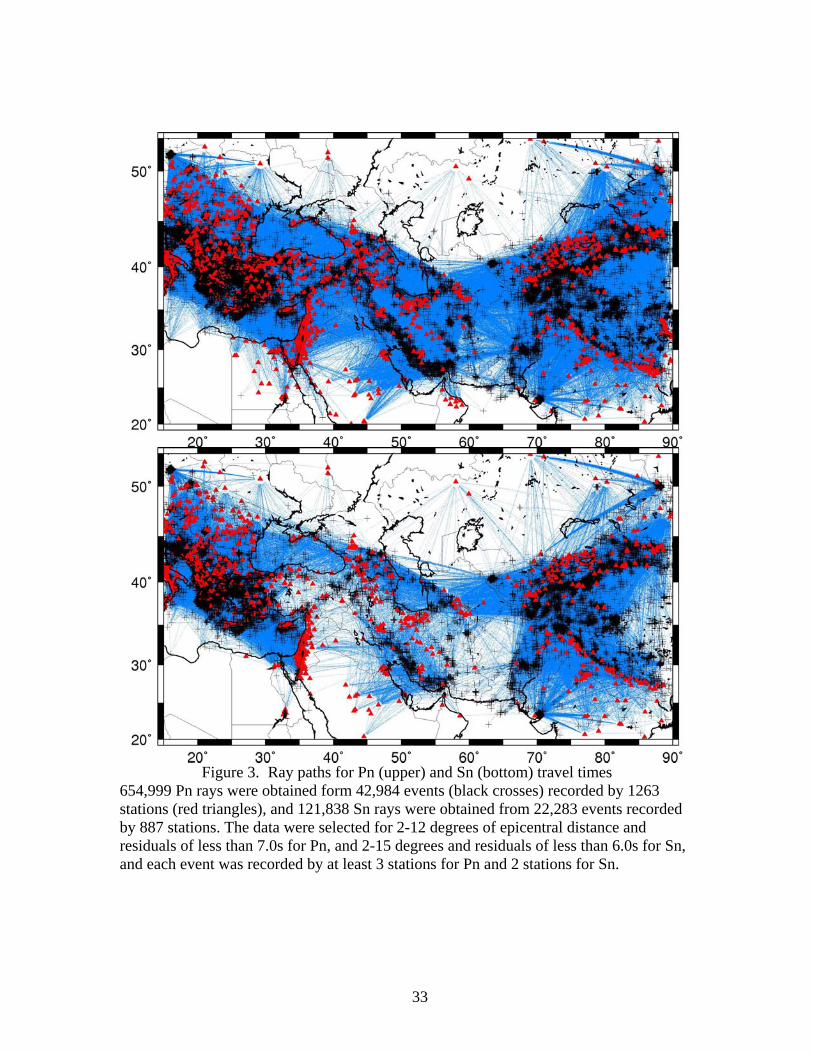
Figure 3. Ray paths for Pn (upper) and Sn (bottom) travel times
654,999 Pn rays were obtained form 42,984 events (black crosses) recorded by 1263 stations (red triangles), and 121,838 Sn rays were obtained from 22,283 events recorded by 887 stations. The data were selected for 2-12 degrees of epicentral distance and residuals of less than 7.0s for Pn, and 2-15 degrees and residuals of less than 6.0s for Sn, and each event was recorded by at least 3 stations for Pn and 2 stations for Sn.
34
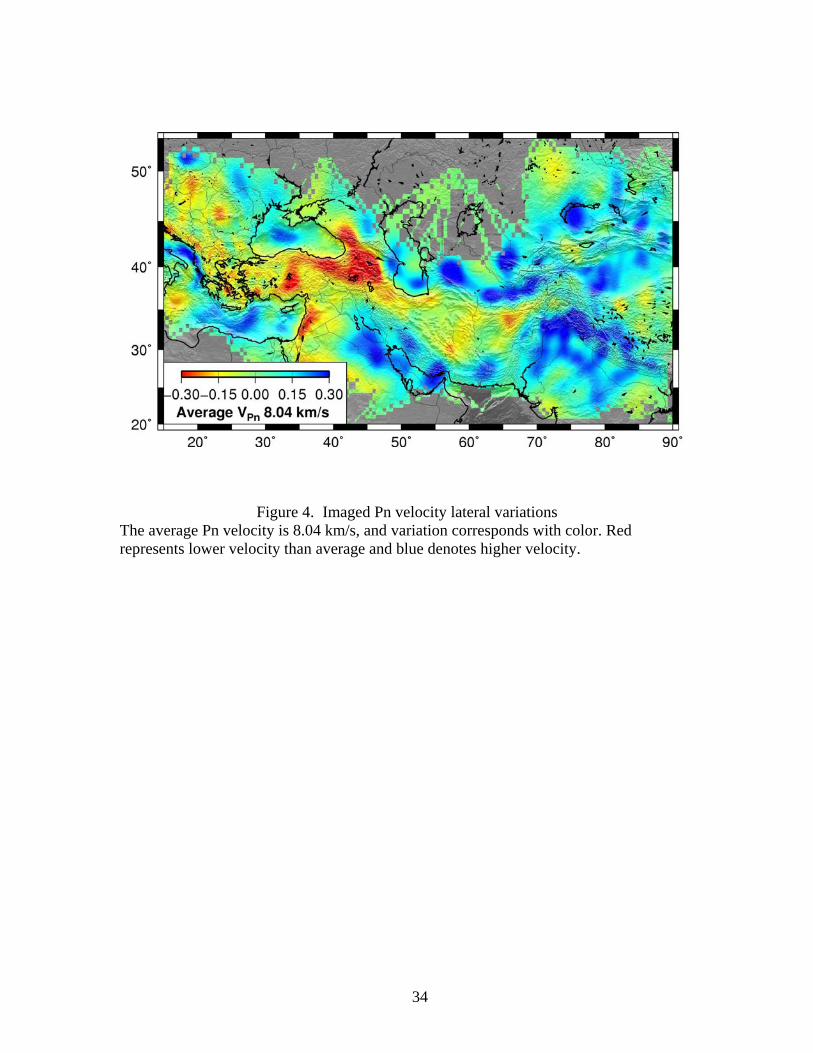
Figure 4. Imaged Pn velocity lateral variations The average Pn velocity is 8.04 km/s, and variation corresponds with color. Red represents lower velocity than average and blue denotes higher velocity.
35
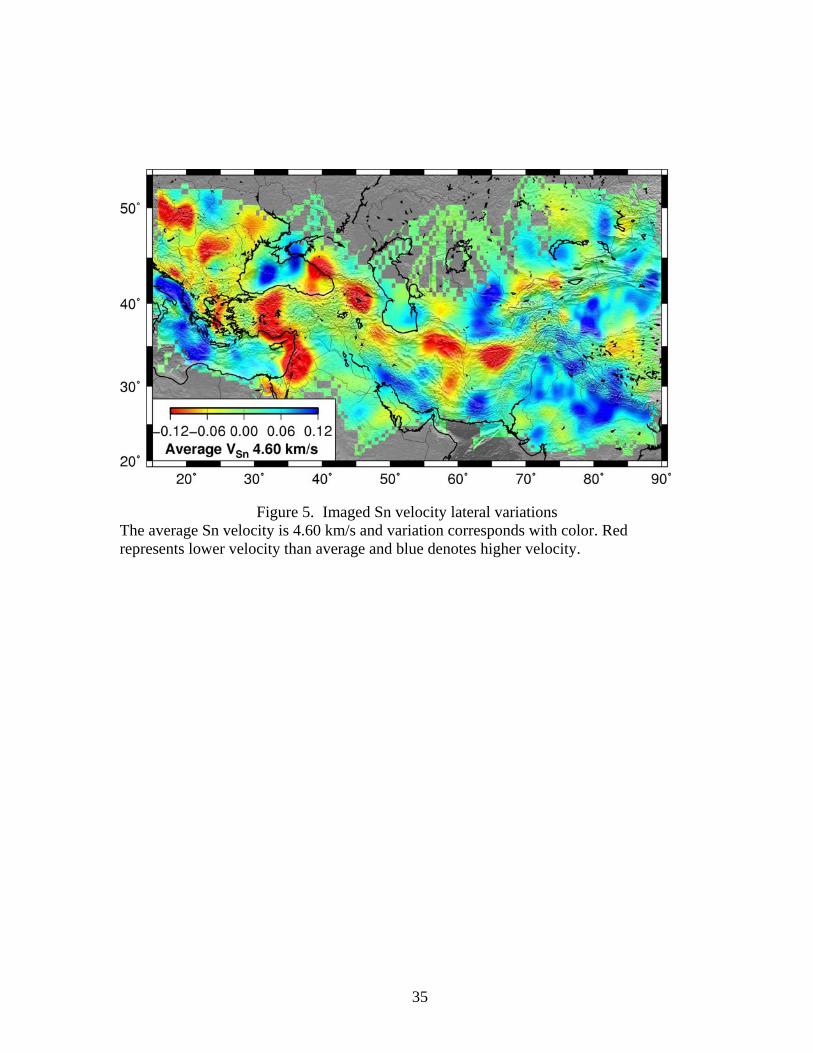
Figure 5. Imaged Sn velocity lateral variations The average Sn velocity is 4.60 km/s and variation corresponds with color. Red represents lower velocity than average and blue denotes higher velocity.