Embed Size (px)
Citation preview

URTeC: <Control ID: 2886614>
Seismic to Simulation: Woodford Shale Case Study in Oklahoma, USA Emilio J. Torres-Parada, Saurabh Sinha, Lennon E. Infante-Paez, Roger M. Slatt and Kurt J. Marfurt
University of Oklahoma, School of Geology and Geophysics. Norman, Oklahoma USA. Copyright 2018, Unconventional Resources Technology Conference (URTeC) DOI 10.15530/urtec-2018-< control ID: 2886614>
This paper was prepared for presentation at the Unconventional Resources Technology Conference held in Houston, Texas, USA, 23-25 July 2018.
The URTeC Technical Program Committee accepted this presentation on the basis of information contained in an abstract submitted by the author(s). The contents of this paper
have not been reviewed by URTeC and URTeC does not warrant the accuracy, reliability, or timeliness of any information herein. All information is the responsibility of, and, is
subject to corrections by the author(s). Any person or entity that relies on any information obtained from this paper does so at their own risk. The information herein does not
necessarily reflect any position of URTeC. Any reproduction, distribution, or storage of any part of this paper by anyone other than the author without the written consent of URTeC
is prohibited.
Abstract
The objective of our study is to use data from every scale for reservoir characterization and eventually
reservoir simulation. The current area of study is Woodford Shale in Oklahoma. Due to enormous pay zone
and thus oil and gas reserves, Woodford Shale is the center of attraction for major oil operators in Oklahoma
currently.
In this study we have used well logs to obtain high vertical resolution petrophysical and geomechanical
properties such as: Porosity, total organic carbon (TOC), Young’s Modulus, Shear Modulus, Biot’s
coefficient, Poisson’s ratio, stresses etc. We have used seismic inversion derived impedance volumes to
populate these properties in the model area to obtain better stratigraphic control on these properties. To
obtain the type curves (TC’s), we have used unsupervised machine learning methodologies such as Self
Organizing maps (SOM) and generative topographic mapping (GTM) to cluster the reservoir properties
together.
From these clusters, we have identified four type curve (TC) areas. To demonstrate the physical significance
of these four type curve areas, we have used a fully compositional, fully coupled geomechanical Equation
of State (EOS) simulator to simulate the Stimulated Rock Volume (SRV) as a function of stress and
eventually production.
Our results show, the integration from seismic to production scale provides excellent control on the
reservoir characterization and bolsters confidence on the static model. Out of all clustering techniques,
SOM works best in our case and is consistent with the regional geology. More number of samples in case
of seismic provides better horizontal control on geomechanical properties and hence modeling of the SRV
and ultimately predicting production behavior.
Introduction and Methodology
The use of estimations and modeling of Geological, Geochemical and Geomechanical properties in
hydrocarbon explorations is vital to optimize the production and minimize the costs of a reservoir. This
goal is achieved by assessments of rocks behavior under subsurface temperature and pressure stresses,
mainly based, on rock-mechanics experiments and calculation with well log data.

URTeC 2886614 2
In order to obtain the elastic properties of a rock sample and experience the experimental process, we
conducted the calculations applying the well logs in the study area that were vertically completed along the
whole Woodford Stratigraphic section (Density, Density-Porosity, P-wave velocity well logs). We then
applied the literature expressions of Woodford Shale elastic and poro-eslastic properties equations
published by Sierra-Perez (2011) of the PoroMechanics Institute at the University of Oklahoma: Young’s
modulus, Poisson’s ratio, bulk modulus, K, and the shear modulus, G.
Figure 1 show our workflow for this study. We use the well logs to derive geomechanical and
petrophysical properties and then seismic inversion derived impedance volume to propagate the well log
derived properties. We then use these properties in an inhouse developed software attribute assisted seismic
interpretation (AASPI) software to use unsupervised clustering methods such as SOM, GTM and K-means
clustering. We identify a total of four type curve areas based on these clustering methods. We extract small
sub-models from these areas for simulation.
Figure 1. Workflow used in this study. We derive the petrophysical and geomechanical properties from the
well logs. Seismic volume is first used for post-stack seismic inversion and then used to propagate the
geomechanical and petrophysical properties. These properties along with seismic volume is used for
unsupervised clustering using SOM, GTM and K-means clustering. These clusters are then used to define
four TC areas. Each of the type curve areas are then used separately for simulation.
Geology of Woodford Shale
Cardott (2009 and 2012) and Jarvie et al (2005 and 2007) characterized the Woodford Shale as a
prolific gas and oil shale reservoir in the world, therefore, there is a specific interest to characterize the
possible occurrence of internal stratigraphic variations for recognizing highly restricted intervals within this
open marine mudstone. This formation is from Upper Devonian-Lower Mississippian age, and its
principal lithology has been described as an organic-rich black shale with intercalations of chert, siltstone,
sandstone, dolostone, and light-colored shale (Slatt et al., 2011; Molinares, 2013; Turner, 2015). In addition,
laminations of reddish-brown clay, greenish clay and organic matter with scattered siliceous concretions
are also present in the formation (Kirkland et al., 1992; Comer, 2007).

URTeC 2886614 3
The Woodford Shale unconformably overlies the limestones and dolomites of the Hunton Group
(Silurian-Devonian age) and grades conformably into fine-grained silty limestones interbedded with thin
layers of dark-gray shales from the Sycamore Formation (Figure 2; Perry, 1995 in Portas, 2009; Slatt et al.,
2011). Cardott (2012) emphasizes that the Woodford Shale has a series of stratigraphic equivalents that
extend over central and Eastern United States (e.g. Chatanooga Shale, Arkansas Novaculite, Antrim Shale,
Bakken Shale, New Albany Shale, Marcellus Shale) that represent the global marine transgression which
occurred during the Late Devonian (Figure 3; Sullivan, 1985; Kirkland et al., 1992; Northcutt et al., 2001;
Comer, 2005; Slatt et al., 2011; Cardott,2012).
Figure 2. Location Map of the Oklahoma USA petroleum basins and principal geologic provinces
(Northcutt et al., 2001); Image on the right corresponds to the Stratigraphic chart for the a general
stratigraphic chart in Oklahoma (Perry, 1995 in Portas, 2009).
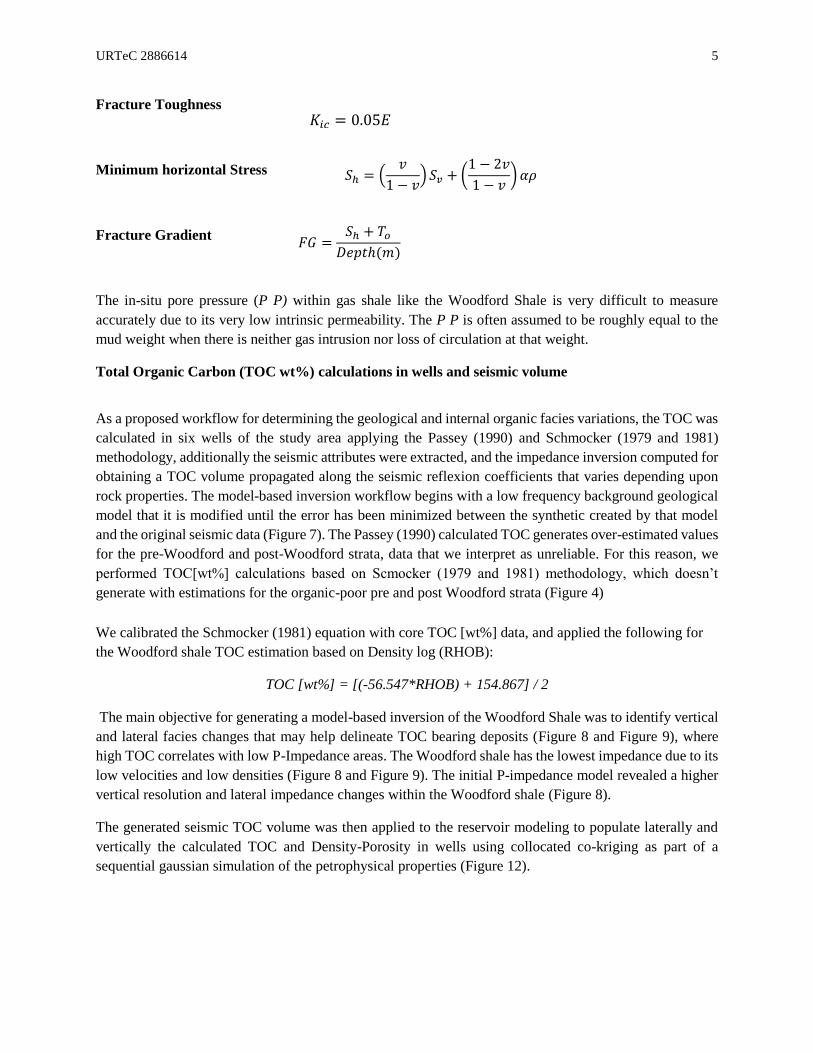
Figure 3. Depositional model of the Woodford shale through one eustatic sea level cycle (Slatt, 2016). The
early stage of falling sea level may result in water mass isolation and restricted water circulation over
topographic depressions left by karst/incised valley development on the underlying carbonate (Hunton
Limestone in the case of the Woodford) surface.
Woodford
Depositional Model(s) from North to South through a sea level cycle
South OK
North OK
Modified from Slatt, 2016
NorthOklahoma
South Oklahoma
Hunton Group - Carbonates
Pre-Woodford sea floor
Impro
ved water circulation
Sylvan Shale

URTeC 2886614 4
Procedures for estimating the Woodford Shale geomechanical properties
Reservoir geomechanics is the integrated study of the state of stress, pore pressure and physical properties
of reservoirs, natural fractures/faults, cap rocks and the formations in the overburden. It provides a context
within which to understand the interactions between Geological conditions and engineering and production
practices. The primary parameters controlling these interactions are the state of in-situ stress, rock strength,
bedding orientation and properties, pore pressure, distribution of fractures and faults, wellbore trajectory,
and mud weight. The state of stress in a hydrocarbon reservoir is defined in terms of the vertical stress (Sv)
and the two mutually perpendicular horizontal stresses (SHmax and Shmin). We applied the equations proposed
for the Woodford shale by Sierra-Perez (2011). In our study, we used P wave (Vp) and S wave(Vs)
velocities, we applied the Castagna (1986; 1993) relationship.
Dynamic Moduli from Velocities
In order to compute the elastic properties of the sample using the dynamic measurement we need to
calculate the sample density ( ) directly from the RHOB well log. For P wave calculation, we used 21
wells in the area of study.
With the P-wave and S-wave velocities we have calculated using the arrival times and the sample density,
we can compute the Young’s modulus (E), Poisson’s ratio ( ), bulk modulus (K) and shear modulus (G)
as follows:
for shale intervals.
for dolomite-rich intervals.
Tensile Stress.
The mechanical properties we used in our geomechanical modeling are the Fracture Gradient and Fracture
Toughness variations for the zones of interest. We estimated these mechanical properties using the well
logs from the study area, and reasonable estimates from the gas shale and rock mechanics literature (Havens,
et. al., 2010; Wang et. al., 2011). The equations used are the following:
v
( )( )22
222 43
sp
sps
VV
VVVE
−
−=
( )( )22
22
2
2
sp
sp
VV
VVv
−
−=
K = Vp2 −4
3Vs
2
2
sVG =
𝑈𝐶𝑆(𝑀𝑃𝑎) = 7.22𝐸0.712
𝑈𝐶𝑆(𝑀𝑃𝑎) = 25.1𝐸0.3
𝑇𝑜 = 10%𝑈𝐶𝑆
URTeC 2886614 5
Fracture Toughness
Minimum horizontal Stress
Fracture Gradient
The in-situ pore pressure (P P) within gas shale like the Woodford Shale is very difficult to measure
accurately due to its very low intrinsic permeability. The P P is often assumed to be roughly equal to the
mud weight when there is neither gas intrusion nor loss of circulation at that weight.
Total Organic Carbon (TOC wt%) calculations in wells and seismic volume
As a proposed workflow for determining the geological and internal organic facies variations, the TOC was
calculated in six wells of the study area applying the Passey (1990) and Schmocker (1979 and 1981)
methodology, additionally the seismic attributes were extracted, and the impedance inversion computed for
obtaining a TOC volume propagated along the seismic reflexion coefficients that varies depending upon
rock properties. The model-based inversion workflow begins with a low frequency background geological
model that it is modified until the error has been minimized between the synthetic created by that model
and the original seismic data (Figure 7). The Passey (1990) calculated TOC generates over-estimated values
for the pre-Woodford and post-Woodford strata, data that we interpret as unreliable. For this reason, we
performed TOC[wt%] calculations based on Scmocker (1979 and 1981) methodology, which doesn’t
generate with estimations for the organic-poor pre and post Woodford strata (Figure 4)
We calibrated the Schmocker (1981) equation with core TOC [wt%] data, and applied the following for
the Woodford shale TOC estimation based on Density log (RHOB):
TOC [wt%] = [(-56.547*RHOB) + 154.867] / 2
The main objective for generating a model-based inversion of the Woodford Shale was to identify vertical
and lateral facies changes that may help delineate TOC bearing deposits (Figure 8 and Figure 9), where
high TOC correlates with low P-Impedance areas. The Woodford shale has the lowest impedance due to its
low velocities and low densities (Figure 8 and Figure 9). The initial P-impedance model revealed a higher
vertical resolution and lateral impedance changes within the Woodford shale (Figure 8).
The generated seismic TOC volume was then applied to the reservoir modeling to populate laterally and
vertically the calculated TOC and Density-Porosity in wells using collocated co-kriging as part of a
sequential gaussian simulation of the petrophysical properties (Figure 12).
𝐾𝑖𝑐 = 0.05𝐸
𝑆ℎ = (𝑣
1 − 𝑣)𝑆𝑣 + (
1 − 2𝑣
1 − 𝑣)𝛼𝜌
𝐹𝐺 =𝑆ℎ + 𝑇𝑜
𝐷𝑒𝑝𝑡ℎ(𝑚)
URTeC 2886614 6
Applied 3D seismic Unsupervised machine learning techniques for reservoir characterization
The Woodford shale seismic characteristics in the study area make this formation amenable to
semiautomated interpretation using seismic attributes as an input to machine learning algorithms and
promises to be a very effective way to accelerate the interpretation from a more homogeneous background
(Woodford shale top is a seismic through [negative amplitudes], and Woodford shale base is a bright
Seismic reflector [Figure 5]). Because seismic attributes are quantitative measurements of both amplitude
and geometry, a key component to machine learning is determining which seismic attributes best
differentiate a feature of interest from the background. The self-organizing maps (or SOM) simply organize
the input attributes in a manner that voxels with similar characteristics (input attributes) are grouped and
colored similarly. The algorithm does what it is supposed to do, it organizes the data and finds patterns
without any constrain or bias (Figure 11). The main challenge for interpreters in applying SOM and similar
algorithms to seismic data is the attribute selection. The 3D seismic attributes that were input for the SOM
are RMS amplitude, dip azimuth of the seismic traces, P-Impedance, Most Positive Curvature, Most
Negative curvature and Peak Frequency. Similar colors correspond to similar rock facies as seen on Figures
9 and Figure 10
The focus of our seismic interpretation has been on applying and comparing different machine learning
methods including multilayer perceptron network, self-organizing maps, support vector machine, K-means,
generative topographic maps (Meldahl et al., 2011; Roy and Marfurt, 2013; Snyder, 2016; Zhao et al., 2016;
Qi et al., 2016) respectively. According to Infante-Paez (2018), in seismic interpretation, self-organizing
maps (SOM) is a clustering technique that extracts similar patterns across multiple seismic attribute
volumes and displays those similarities as a color-coded map (Figure 10), with similar colors representing
clusters that a human interpreter can visualize as similar facies (Zhao et al., 2016). Infante-Paez (2018)
highlights that the input attributes to feed the SOM are of three types: attributes that highlight the continuity-
how layer cake the reflectors are- (homogeneity and entropy), the amplitude (peak magnitude) and the
frequency (peak frequency) of the target patterns. These attributes are extracted from the raw amplitude
data using software developed at the University of Oklahoma AASPI consortium.
Geological Characterization Results
The following stratigraphic well log correlation and maps correspond to the Geomechanical and Organic
Matter properties of the interest interval of the middle Woodford member (Figure 12). We use the P-
Impedance inversion volume and SOM volumes to propagate our reservoir properties applying the
collocated co-kriging in a sequential gaussian simulation algorithm (Figure 9, Figure 10 and Figure 11).
The main zones of interest for the Woodford shale in the study area are the ones with high TOC, low
Fracture Gradient and Fracture Toughness. These screened intervals are then considered for the step of
reservoir performance simulation.
The identified zones of interest are local areas where we performed reservoir simulation using public
Industry standards of operations and completions in vicinity areas. We recognized as geological factors to
include in the simulations the calculated geological and geomechanical reservoir properties Young
Modulus, Poisson Ratio, Shear Modulus, Biot Modulus, the content and variability of Organic Matter with
the Calculated and Modeled TOC volume.

URTeC 2886614 7
Figure 4. Stratigraphic Correlation of the Woodford Shale along the Study area. Cored Well S-A with
measured TOC points and calculated TOC curves for reservoir modeling using Passey (Light green curve)
and Schmocker (Dark blue TOC curve) methodologies.
Figure 5. Seismic Expression of the Woodford shale in Study Area. Woodford shale top is a seismic
trough (negative amplitude) and Woodford shale base (Hunton Group Top) is a bright positive amplitude
horizon.
S- S- S- S-
XX670 ft
XX580 ft
SEWoodford Shale Top
XX100
XX500
-XX500
NW

URTeC 2886614 8
Figure 6. Woodford shale time structure map in study area. Structure converted to depth and applied as
reservoir model gridding constrain.
Figure 7. Woodford shale time thickness map in study area. Time thickness converted to depth and
applied as reservoir model gridding constrain. Note the increasing thickness at NE and South of Study
area. Wells from Stratigraphic correlation in Figure 4.
XX050 ms
XX500 ms
XX250 ms
S-AS-B
S-F
S-CS-D
S-A’
S-E
WDFD Time thickness
I
R C

URTeC 2886614 9
Figure 8. Image on the left correspond to the low frequency P-Impedance Back ground model in a cored
well. Image on the right is the P-Impedance volume using model-based calculations. Woodford top is the
light green seismic horizon.
Figure 9. Inverted P-Impedance. Extracted and Interpolated along the Woodford Seismic Window.
Higher TOC correlates with the zones of much lower average P-impedance values.

URTeC 2886614 10
Figure 10. Self-Organizing Maps [SOM] volume using Mahalanobis distance. Average values extracted in
the Woodford shale seismic window. Attributes that were input for the SOM are RMS amplitude, dip
azimuth of the seismic traces, P-Impedance, Most Positive Curvature, Most Negative curvature and Peak
Frequency. Similar colors correspond to similar rock facies according to Zhao et al. (2016) and Infante-
Paez (2018).
F
Figure 11. Woodford Reservoir Model. Wells displayed in study area with Shear and Compressional
Sonic logs. Reservoir grid from seismic-well tie and depth domain conversion of Woodford Seismic Top
and Bottom surfaces.
X750 ft
X1500 ft
X1000 ft

URTeC 2886614 11
Figure 12. Density-Porosity, Calculated TOC [wt%], Fracture Toughness and Fracture Gradient variation
Maps of the zone 3. This zone corresponds to brittle-ductile Woodford shale couplets between the upper
portion of middle member and the lower portion of the upper Woodford shale member.
Reservoir Simulation
We have selected four type curve areas for simulation in our study based on the seismic and well logs
derived clusters. We use a 5,000 Ft. lateral length of the wells in our area to perform our simulation based
on most accepted industry standards in vicinity areas. To fully capture the fluid effects, we use a fully
compositional rich condensate representative PVT in the area. We use the same fluid in all the areas as the
primary aim of this study is to identify the type curves based on reservoir properties that can be known
ahead of the drilling and not the fluid properties which can vary and alter the Recovery Factors (RF’s).
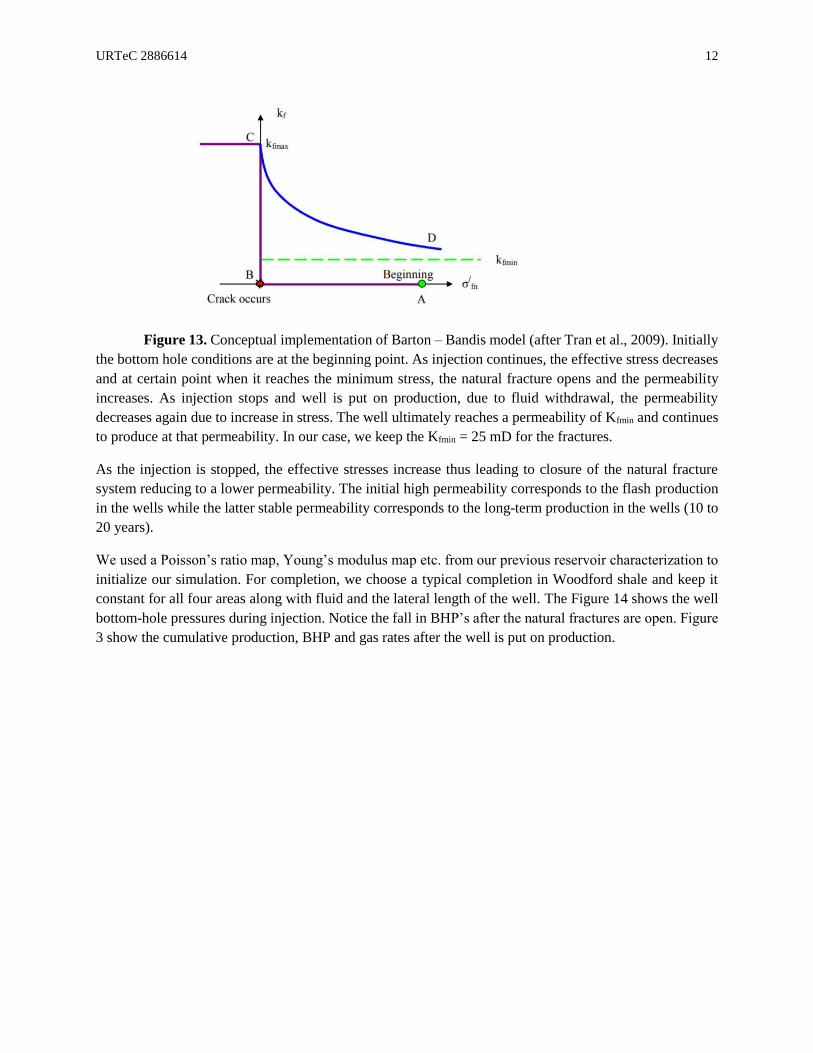
For geomechanical coupling, we use a fully coupled Barton-Bandis model (Bandis et al., 1983) in
a dual porosity setup. Figure 13 shows the conceptual implementation of this model in which the
permeability of the natural factures is coupled in the model as the minimum effective stress. As the injection
is carried out in a typical hydraulic fracturing scenario, the minimum effective stress decreases, eventually
increasing the permeability of the natural fractures.
Density - Porosity
TOC Smockers
Fracture Toughness
Fracture Gradient
URTeC 2886614 12
Figure 13. Conceptual implementation of Barton – Bandis model (after Tran et al., 2009). Initially
the bottom hole conditions are at the beginning point. As injection continues, the effective stress decreases
and at certain point when it reaches the minimum stress, the natural fracture opens and the permeability
increases. As injection stops and well is put on production, due to fluid withdrawal, the permeability
decreases again due to increase in stress. The well ultimately reaches a permeability of Kfmin and continues
to produce at that permeability. In our case, we keep the Kfmin = 25 mD for the fractures.
As the injection is stopped, the effective stresses increase thus leading to closure of the natural fracture
system reducing to a lower permeability. The initial high permeability corresponds to the flash production
in the wells while the latter stable permeability corresponds to the long-term production in the wells (10 to
20 years).
We used a Poisson’s ratio map, Young’s modulus map etc. from our previous reservoir characterization to
initialize our simulation. For completion, we choose a typical completion in Woodford shale and keep it
constant for all four areas along with fluid and the lateral length of the well. The Figure 14 shows the well
bottom-hole pressures during injection. Notice the fall in BHP’s after the natural fractures are open. Figure
3 show the cumulative production, BHP and gas rates after the well is put on production.

URTeC 2886614 13
Figure 14. Well bottom-hole pressure for the injection. Notice when crack occurs, the pressure
falls down quickly.
Figure 15. on the left: gas rate, BHP and cumulative gas for Area 1 well. Gas oil ratio for area 1 well.

URTeC 2886614 14
The initial high bottom-hole pressure (BHP) show the injection as the well is hydraulically fractured. The
expected ultimate recovery is considered as the five years’ cumulative gas and condensate production
respectively.
We repeat the same procedure for all the areas. Table 1 show the oil EUR’s for four areas. Notice the
dramatic difference in EUR’s in all areas. As completion and fluid is kept constant in the study, the change
is attributed to the reservoir characterization only. In this case, a high resolution comprehensive
characterization including petrophysical and geomechanical properties in the reservoir can add enormous
value in identification of high value areas, lateral landing zones and well interference studies and ultimately
well spacing optimization.
Area Oil EUR (MBO)
1 1802
2 1624
3 803
4 729
Table 1 show the oil EUR’s for four areas.
Summary and Conclusions
From previous geological analysis the zone with best reservoir properties such as porosity, permeability
and thickness in the middle Woodford shale member was zone 3.
As expected Young’s modulus showed higher values in the dolomitic reservoir of the upper-middle
Woodford shale intervals than other areas of the Woodford shale stratigraphic sequence.
The results show multi-attribute analysis provide a better way to populate the geocellular model instead of
individual seismic attributes and hence we illustrate multivariate way of property modeling. Geomechanical
simulation provides a robust way to model gradual closing of fractures and hence a time variant “shrinking”
simulated rock volume instead of conventional history matching with multiple permeability zones. Our
natural fracture model along with hydraulic fractures provide a better way to observe the pressure
distribution in the area and can be used to optimize well spacing or future enhanced oil recovery (EOR)
projects.
This study identifies geological sweet spots and type curves in the Woodford shale along with major facies.
We provide a sound physical basis to generate robust models as a reference solution to base the type curves.
As our workflow is integrated from seismic to simulation it provides a general guideline for operators to
scale their models from well logs to seismic and use good of both worlds. We include tight boundary
conditions to base our methodology and hence we provide more confidence level on type curves to estimate
the reserves for the operators
Cited References
Bandis, S. C., A. C. Lumsden, and N. R. Barton. 1983. “Fundamentals of Rock Joint Deformation.”
International Journal of Rock Mechanics and Mining Sciences and 20 (6): 249–68. doi:10.1016/0148-
9062(83)90595-8.

URTeC 2886614 15
Baruch E., O. Elebiju, and R. Perez, 2009, Geophysical evidence of basement-controlled faulting in the
Ellenburger Group and Viola Limestone, Fort Worth Basin, Texas: 79th Annual International Meeting,
SEG, Expanded Abstracts, 995–999.
Cardott B. J., 2009. Woodford gas-shale plays of Oklahoma. Louisiana oil & gas symposium, May 20,
2009. Oklahoma Geological Survey. http://www.ogs.ou.edu/fossilfuels/pdf/LAoilgas2009.pdf; accessed
on October 4, 2009.
Cardott, B. J., 2012. Thermal maturity of Woodford Shale gas and oil plays, Oklahoma, USA,
International Journal of Coal Geology, p. 1-13. doi:10.1016/j.coal.2012.06.004.
Castagna, J.P, Batzle M. L., and Eastwood R. L., 1886. Relationships between compressional-wave and
shear-wave velocities in clastic silicate rocks. Geophysics Journal, Society of Exploration Geophysicists.
Volume 50, Issue 4, pages 571-581.
Castagna, J.P, and Backus M. M., 1993. AVO analysis—Tutorial and review. Offset-dependent
reflectivity: Theory and practice of AVO analysis: SEG Investigations in Geophysics. Volume 8, pages
3-36.
Castillo, D.A., and Moos, D. 2000. Reservoir geomechanics applied to drilling and completion programs
in challenging formations: north west shelf, Timor sea, North Sea and Colombia. APPEA journal 2000.
Comer J. B., 2005. Facies distributions and hydrocarbon production potential of Woodford Shale in the
Southern Midcontinent. In Cardott B. J. (ed.) Unconventional energy resources in the Southern
Midcontinent, 2004 symposium. Oklahoma Geological Survey Circular 110, 51-62.
Havens, J. B. and Batzle, M.L. 2011. Minimum Horizontal Stress in the Bakken Formation. 45th US
Rock Mechanics / Geomechanics Symposium held in San Francisco, CA, June 26–29, 2011.
Havens, J.B. and Batzle, M. 2010. A Geomechanical Model of the Bakken Petroleum System. American
Rock Mechanics Association 44th US Rock Mechanics Symposium and 5th U.S.-Canada Rock
Mechanics Symposium, held in Salt Lake City, UT June 27–30, 2010.
Heggland, R., 2004, Definition of geohazards in exploration 3-D seismic data using attributes and neural
network analysis: AAPG Bulletin, 88, 857–868.
Infante-Paez, L. E., 2018. Seismic Expression of Igneous bodies in sedimentary basin and their impact on
hydrocarbon exploration: Examples from a compressive tectonic setting, Taranaki Basin, New Zealand.
Ph.D. Thesis Manuscript. The University of Oklahoma, School of Geology and Geophysics, pp. 196.
Jarvie, D.M., Hill, R.J., Pollastro, R.M., 2005. Assessment of the gas potential and yields from shales: the
Barnett Shale model. In: Cardott, B. (Ed.), Oklahoma Geological Survey Circular 110: Unconventional
Gas of the Southern Mid-continent Symposium, March 9e10, 2005, Oklahoma City, Oklahoma, pp. 37-
50.

URTeC 2886614 16
Jarvie, D.M., Hill, R.J., Ruble, T.E., Pollastro, R.M., 2007. Unconventional shale-gas systems: the
Mississippian Barnett Shale of north-central Texas as one model for thermogenic shale-gas assessment.
AAPG Bull. 91, 475-499.
Kirkland D, W., Denison, R, E., Summers, D, M., and Gormly, J, R., 1992. Geology and organic
geochemistry of the Woodford Shale in the Criner Hills and western Arbuckle Mountains, Oklahoma,
Oklahoma Geological Survey, Circular 93, p.38-69.
Meldahl, P., Heggland, R., Bril, B., and de Groot, P., 2001, Identifying fault and gas chimneys using
multi-attributes and neural networks: The Leading Edge, 20, 474–482. doi:10.1190/1.1438976
Miceli Romero, A., 2010. Geochemical characterization of the Woodford Shale, central and southeastern
Oklahoma. M.Sc. Thesis manuscript, The University of Oklahoma, pp. 149.
Molinares, C. E., 2013. Stratigraphy and palynomorphs composition of the Woodford Shale in the Wyche
Farm Shale Pit, Pontotoc County, Oklahoma. M.Sc. Thesis Manuscript. The University of Oklahoma,
School of Geology and Geophysics, pp. 104.
Northcutt, R. A., Johnson, K. S., and Hinshaw, G. C., 2001. Geology and petroleum reservoirs in Silurian,
Devonian, and Mississippian rocks in Oklahoma. In Johnson K. S. (ed.) Silurian, Devonian, and
Mississippian geology and petroleum in the southern Midcontinent, 1999 symposium. Oklahoma
Geological Survey Circular 105, 1-29
Passey, Q. R., S. Creaney, J. B. Kulla, F. J. Moretti, and J. D. Stroud, 1990. A Practical Model for
Organic Richness from Porosity and Resistivity Logs: AAPG Bulletin, 74, p. 1777-1794.
Passey, Q. R.., K. M. Bohacs, W. L. Esch, R. Klimentidis, and S. Sinha, 2010. From Oil-Prone Source
Rock to Gas-Producing Shale Reservoir – Geologic and Petrophysical Characterization of
Unconventional Shale-Gas Reservoirs: CPS/SPE International Oil & Gas Conference and Exhibition in
China, 29 p.
Portas R., 2009. Characterization and origin of fracture patterns in the Woodford Shale in southeastern
Oklahoma for application to exploration and development. Master of Science Thesis, the University of
Oklahoma, pp. 113.
Qi, J., T. Lin, T. Zhao, F. Li, and K. Marfurt, 2016, Semisupervised multiattribute seismic facies analysis:
Interpretation, 4, no. 1, SB91-SB106, doi:10.1190/INT-2015-0098.1.
Roy, A., B. Dowdell, and K. Marfurt, 2013, Characterizing a Mississippian tripolitic chert reservoir using
3D unsupervised and supervised multiattribute seismic facies analysis: An example from Osage County,
Interpretation for unconventional resources, 1, no. 2, 109–124, doi:10.1190/segam2012-1365.1.
Slatt, R. M., 2016. Woodford shale consortium report, Phase III. The University of Oklahoma, Institute of
Reservoir Characterization (IRC), pp. 210.

URTeC 2886614 17
Slatt, R. M., N. Buckner, Y. Abousleiman, R. Sierra, P. Philp, A. Miceli-Romero, R. Portas, N. O’Brien,
M. Tran, R. Davis, and T. Wawrzyniec, 2011. Outcrop/ behind outcrop (quarry), multiscale
characterization of the Woodford Gas Shale, Oklahoma, in J. Breyer, ed., Shale reservoirs—Giant
resources for the 21st century: American Association of Petroleum Geologists AAPG Memoir 97, p. 1–
21.
Sierra-Perez, R., 2011. Integrated geomechanics and geological characterization of the Devonian-
Mississippian Woodford Shale. M.Sc. Thesis Manuscript. The University of Oklahoma, School of
Geology and Geophysics.
Schmoker, J.W., 1979, Determination of Organic Content of Appalachian Devonian Shales from
Formation Density Logs. AAPG Bulletin Vol. 63, No. 9 (September 1979), P. 1504-1537.
Schmoker, J.W., 1981, Determination of Organic Matter Content of the Appalachian Devonian Shales
from Gamma-Ray Logs. AAPG Bulletin Vol. 65 No. 7, pp. 1258-1298.
Snyder, J., 2016, Correlating rate of penetration and bit trips to 3D surface seismic data, Anadarko shelf,
Oklahoma: M.S. Thesis, The University of Oklahoma.
Tran, David, Vijay Shrivastava, Long Nghiem, and Bruce Kohse. 2009. “Geomechanical Risk Mitigation
for CO2 Sequestration in Saline Aquifers.” Proceedings of SPE Annual Technical Conference and
Exhibition, 1–18. doi:10.2118/125167-MS.
Turner B., 2015. The Use of Chemo stratigraphy to Refine Ambiguous Sequence Stratigraphic
Correlations in Marine Shales: An Example of the Woodford Shale, Oklahoma. AAPG Education
Directorate, Woodford Shale Forum: Focus on Optimization, Oklahoma City, Oklahoma, May 12, 2015.
AAPG Datapages/Search and Discovery Article #90241.
Vermylen, J.P. 2011. Geomechanical Studies of the Barnett Shale, Texas, USA. PhD. Dissertation,
Stanford University. PP 143.
Wang, C. and Zeng, Z. 2011. Overview of Geomechanical Properties of Bakken Formation in Williston
Basin, North Dakota. 45th US Rock Mechanics / Geomechanics Symposium held in San Francisco, CA,
June 26–29, 2011.
Zhao, T., F. Li, and K. J. Marfurt, 2017, Seismic attribute selection for unsupervised seismic facies
analysis using user guided data-adaptive weights: Geophysics, 83, no. 2, 1–62, doi:10.1190/geo2017-
0192.1.
Zhao, T., J. Zhang, F. Li, and K. J. Marfurt, 2016, Characterizing a turbidite system in Cantebury Basin,
New Zealand, using seismic attribute and distance-preserving self-organizing maps: Interpretation, 4, no.
1, SB79–SB89, doi: 10.1190/INT-2015-0094.1.
Zeng, Z., and Jiang, A. 2006. Geomechanical Study of Bakken Formation for Improved Oil Recovery.
ISRM-Sponsored International Symposium on Rock Mechanics: “Rock Characterisation, Modelling and
Engineering Design Methods”.

URTeC 2886614 18
Zoback, M. D., C. Barton, M. Brudy, D. Castillo, T. Finkbeiner, B. Grollimund, D. Moos, P. Peska, C.
Ward, and D. Wiprut (2003). Determination of stress orientation and magnitude in deep wells, Int. J.
Rock Mech. Min. Sci. Geomech. Abstr., 40, 1049 – 1076.