Embed Size (px)
Citation preview

US Army Corps of Engineers
BUILDING STRONG®
Seismic Stability Evaluation of Lookout
Point Embankment Dam
Kenji Yamasaki, P.E.
Cornforth Consultants
David Scofield, P.E., C.E.G.
U.S. Army Corps of Engineers, Portland District
February 10, 2015

BUILDING STRONG®
PORTLAND DISTRICT 2
Outline (Part I)
Purpose of Seismic Evaluation
Project Overview
Geologic Section
Embankment Dam Design
Previous Seismic Screening Analysis
BUILDING STRONG®
PORTLAND DISTRICT 3
Purpose of Seismic Evaluation USACE conducts dam safety evaluations of all
projects at a five year schedule.
USACE has adopted a “Risk Based”
methodology to quantify the risk and make risk
based decisions.
To accomplish this, there is a need for more
detailed analyses to conduct risk assessment.
Lookout Point Dam is one of the first two dams
in Portland District undergoing this process.
This presentation covers the seismic analyses
used to develop parameters that went into the
risk process

BUILDING STRONG®
PORTLAND DISTRICT 4
Project Overview Location:
Lookout Point Dam, Oregon
Middle Fork Willamette River
(R.M. 7.5), 22 Miles upstream
of Eugene, OR
It is one of 13 Corps projects in
the Willamette Basin
The
Willamette
Basin
BUILDING STRONG®
PORTLAND DISTRICT 5
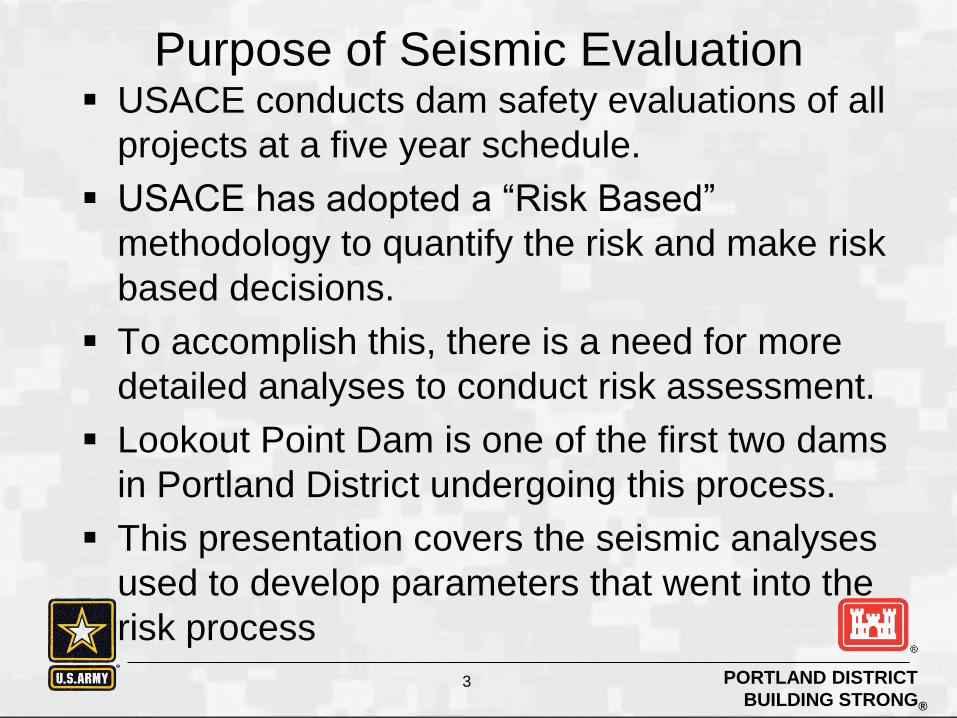
Project Overview
Concrete Gravity Section
Spillway/Regulating Outlets
Embankment
Powerhouse

BUILDING STRONG®
PORTLAND DISTRICT 6
Concrete Dam
Embankment
Powerhouse

BUILDING STRONG®
PORTLAND DISTRICT 7

BUILDING STRONG®
PORTLAND DISTRICT 8
Embankment Dam Design
Bedrock (Lava Flows, Tuffs with Clay Seams)
Summer Conservation (95%)
50% Pool
Minimum Flood Pool
Random Gravel shells are coarse alluvial gravels. Average 10
inch diameter.
Downstream Filter Zone is 8 Feet Thick. Processed Recent
Alluvium. Cohesionless.
Alluvial Gravel Foundation averages about 10-inch diameter.
BUILDING STRONG®
PORTLAND DISTRICT 9
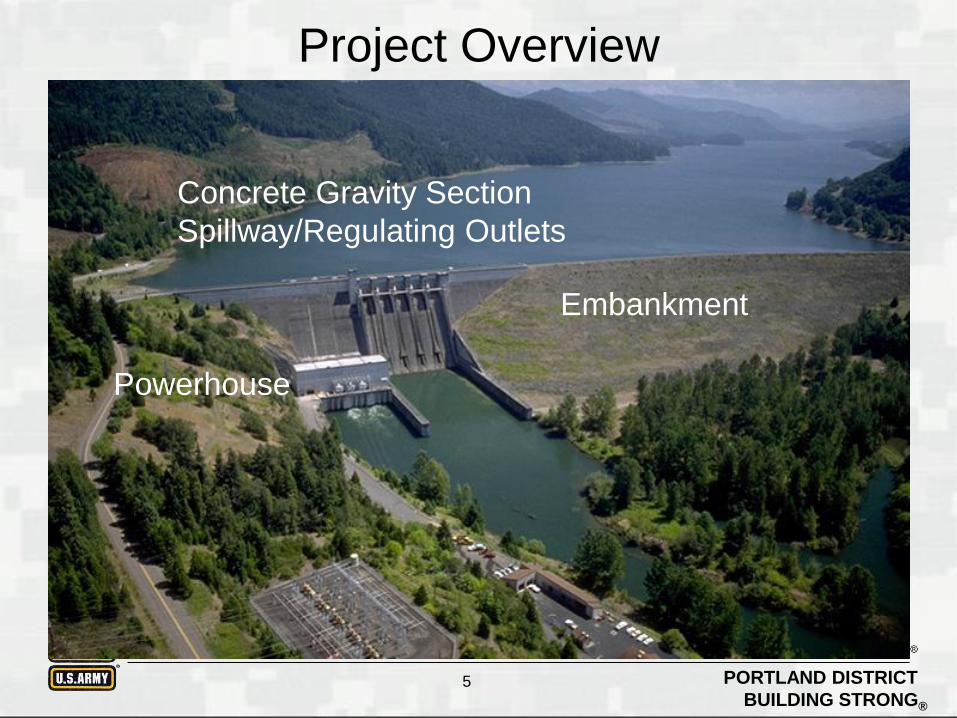
Geologic Section
Overburden removed from the
foot print of the core trench.

BUILDING STRONG®
PORTLAND DISTRICT 10
Embankment Dam Design Embankment is well constructed and documented
Foundations are either rock or overburden with low
liquefaction susceptibility
Filter Zone is thinner than would like for seismic design
There are seismically favorable design features
► Test fill was constructed using actual construction equipment.
Extensive laboratory testing.
► Impervious core and downstream filter zone wrap around the
concrete gravity dam
► Random gravel zone was designed with finer materials against the
filters and become coarser away to provide a secondary filter zone.
However, permanent construction record samples do not
substantiate this and it cannot be counted on.

BUILDING STRONG®
PORTLAND DISTRICT 11
10% Normal High Pool El. 929.3
45% Spillway Crest Pool El. 891.2
50% Pool El. 886.5
Previous Seismic
Screening Analysis
Stability analysis used is the Hynes-Griffin and Franklin
pseudo-static method developed by the Corps of Engineers.
Conclusion:
The embankment may crack with displacements that are
approaching the level of concern.
More sophisticated analyses are required.

BUILDING STRONG®
PORTLAND DISTRICT 12
Kenji Yamasaki with Cornforth Consultants will
present the new analyses conducted for the
Corps of Engineers to support our Dam Safety /
Risk Assessment Program

Outline (Part II)
Analysis Model
Seismic Hazard and Input Motions
Results
Cyclic Softening of Core

Analysis Model
Downstream shell is dry.

Estimated undrained shear
strength of compacted
clay core
Clay core material was
compacted at about 2% wet
of optimum in 12-in lifts
with an 85,000-pound rubber-
tired roller.
Overconsolidated
Normally consolidated

Static Factors of Safety - Upstream
FS ≈ 2.0

Seismic Hazard and Input Motions
AMEC Geomatrix and
Quest Structures, 2009

Uniform Hazard Response Spectra (UHRS) and Cascadia Deterministic Spectra
2,500-Year UHRS
matches Cascadia
M8.7 to M9.1 84th
Deterministic Spectra
(Max. Credible
Earthquake = MCE)
Seismic hazard is
dominated by Cascadia
subduction zone
interface earthquakes
M8 - M9+
0.7 g
at
0.2 s 0.3 g
PGA 0.4 g
at
1.0 s

Interface Earthquake Time Histories
• Scaled to match 1,000-Year, 2,500-Year, and 10,000-
Year UHRS (three levels of severity)
• Valparaiso, 1985, M8, U.F.S.M.D.I.C., 70°
• Michoacan, 1985, M8, Caleta de Campo, 180°
• Geomatrix (1993) M9.0 Synthetic
• PGA Values:
1,000-year: 0.14 g - 0.16 g
2,500-year: 0.24 g - 0.27 g
10,000-year: 0.45 g - 0.51 g

60 s 2,500-Year Level
Acceleration Time Histories
Valparaiso 1985 M8
Michoacan 1985 M8
0.25 g
Wait for completion of
NGA-Sub Project by
PEER (UC Berkeley and others).
Will include data from
2010 MW8.8 Chile and 2011 MW9.0 Japan
subduction earthquakes.

SEEP/W, QUAKE/W, SLOPE/W
Finite Element Mesh
Time histories applied along the base (rigid boundary)

QUAKE/W Response Analysis for Michoacan 2,500-Year Motion
Peak Horizontal Accelerations – Amplification from Base to Crest
Base Peak Acceleration = 0.24 g
Crest Peak Acceleration = 0.57 g

Base to crest
amplification of
acceleration is
about 1.5 to 3,
and is reasonable
for an embankment
dam.
Embankment
Base to Crest Amplification

Cyclic Softening Potential of Clay Core
Evaluate τxy at Points in Core (HP: History Points) τxy
Dynamic shear stress on
horizontal plane caused
by earthquake shaking

Represent irregular shear stress time history by equivalent
cycles of uniform shear stress loading (typically at 65% of max).


Represent irregular shear stress time history by equivalent
cycles of uniform shear stress loading (typically at 65% of max).
Then it can be compared to cyclic simple shear laboratory test results,
which are based on cyclic uniform stress loadings.

Idriss and Boulanger (2008): data from Andersen et al. 1988, Azzouz et al. 1989,
Hyodo et al. 1994, Lefebvre and Pfendler 1996, Woodward-Clyde 1992,
Zergoun and Vaid 1994.
(to cause 3% cyclic strain)
1.3

Idriss and Boulanger (2008): data from Andersen et al. 1988, Azzouz et al. 1989,
Hyodo et al. 1994, Lefebvre and Pfendler 1996, Woodward-Clyde 1992,
Zergoun and Vaid 1994.
(to cause 3% cyclic strain)
0.9

Idriss and Boulanger (2008): data from Andersen et al. 1988, Azzouz et al. 1989,
Hyodo et al. 1994, Lefebvre and Pfendler 1996, Woodward-Clyde 1992,
Zergoun and Vaid 1994.
(to cause 3% cyclic strain)
0.7

“Cyclic softening” likely
in upper part of core
under 2,500-year and 10,000-year
Cascadia M9 subduction earthquakes.
“Cyclic softening” not likely
in lower part of core.

dN = 10 – 20 in. (2,500-y)
Estimate Displacements Caused by Subduction Earthquakes
NEWMARK DISPLACEMENTS, dN (U/S SIDE)
dN = 70 – 110 in. (10,000-y)
Shallow Failure Surface
Strength of upper core
reduced to 30% of su
ky ≈ 0.21

dN = 0.1 – 2 in. (2,500-y)
Estimate Displacements Caused by Subduction Earthquakes
NEWMARK DISPLACEMENTS, dN (U/S SIDE)
dN = 10 – 20 in. (10,000-y)
Intermediate Failure Surface
ky ≈ 0.20

dN = 0 (2,500-y)
Estimate Displacements Caused by Subduction Earthquakes
NEWMARK DISPLACEMENTS, dN (U/S SIDE)
dN = < 3 in. (10,000-y)
Deep Failure Surface
ky ≈ 0.22

Conclusions
• “Cyclic softening” of core may occur under the 2,500-year level of Cascadia subduction earthquake shaking. However, the strength loss potential is probably low: core compacted wet of optimum with rubber-tired rollers.
• Seismic displacement under the 2,500-year level subduction earthquake shaking is not likely to offset the downstream filter.

Thank you for your kind attention.