Embed Size (px)
Citation preview
Seismic Signs of Magma Pathways through the Crust in the Eyjafjallajökull volcano, South Iceland
Sigurlaug HjaltadóttirKristín S. VogfjörðRagnar Slunga
VÍ 2009-013
Skýrsla
Seismic Signs of Magma Pathways through the Crust in the Eyjafjallajökullvolcano, South Iceland
Sigurlaug Hjaltadóttir, Icelandic Meteorological OfficeKristín S. Vogfjörð, Icelandic Meteorological OfficeRagnar Slunga, QuakeLook Stockholm AB
VÍ 2009-013ISSN 1670-8261
Skýrsla
+354 522 60 00+354 522 60 [email protected]
Veðurstofa ÍslandsBústaðavegur 9150 Reykjavík


5
SIXTH FRAMEWORK PROGRAMME
SUSTAINABLE DEVELOPMENT, GLOBAL CHANGE AND ECOSYSTEMS
Project No.: 018471
Acronym: VOLUME
VOLcanoes; Understanding sub-surface mass moveMEnt
Instrument: STReP
Thematic Priority: FP6-2004-Global-3
D2.3a and D2.13a Relative locations and source mechanisms for events at the Eyjafjallajökul volcano
6
VOLUME Rannsóknaverkefnið Í Evrópusamstarfsverkefninu VOLUME (VOLcanoes: Understanding subsurface mass moveMEnt) var unnið að rannsóknum á jarðeðlis- og jarðefnafræðilegum vísbendingum um kvikuhreyfingar í eldfjöllum. Þátttakendur voru víða að úr Evrópu og fjöldi eldfjalla í Evrópu og öðrum heimsálfum voru efniviðir rannsóknanna. Veðurstofa Íslands var þátt-takandi í verkefninu og í upphaflegu áætluninni var áformað að vinna með jarðskjálfta- og GPS-gögn frá Kötlu og Eyjafjallajökli. Í framvindu verkefnisins kom hins vegar í ljós að litlar upplýsingar lágu í GPS tímaröðum frá mælistöðvunum við eldfjöllin tvö. Samtímis var hafin jarðskjálftahrina og jarðskorpuhreyfingar við Upptyppinga í nyrðra gosbeltinu og var því hluti rannsóknarvinnu tengdri þeim umbrotum felld undir verkefnið. Helstu niðurstöður rannsóknanna voru dregnar saman í nokkrum smáskýrslum, sem var skilað sem afurðum Veðurstofunnar í verkefninu. Þessum smáskýrslum er safnað saman í tvær skýrslur, þar sem sú fyrri inniheldur niðurstöður rannsókna frá Eyjafjallajökli, en sú síðari niðurstöður frá Kötlu og Upptyppingum. Upplýsingar um VOLUME verkefnið má finna á vefsíðunni: http://www.volume-project.net/
7
Contents LIST OF FIGURES ............................................................................................................. 7
LIST OF TABLES .............................................................................................................. 8
1 ABSTRACT .................................................................................................................. 9
2 INTRODUCTION ......................................................................................................... 9 2.1 Geological backgound ............................................................................................. 9 1.2 Seismic activity and deformation of the volcano .................................................. 11
3 DATA AND METHODS ............................................................................................ 12 3.1 Dataset ................................................................................................................... 12 3.2 Method ................................................................................................................... 13
4 RESULTS .................................................................................................................... 14 4.1 Relative locations and temporal and spatial evolution of the seismicity .............. 14 4.2 Mechanisms ........................................................................................................... 19 4.3 Frequency-magnitude distributions and b-values .................................................. 22 3.4 Depth distribution and stress drop ......................................................................... 24
5 DISCUSSION ............................................................................................................. 24
6 CONCLUSIONS ......................................................................................................... 26
ACKNOWLEDGEMENTS .............................................................................................. 27
REFERENCES .................................................................................................................. 27
APPENDIX I .................................................................................................................... 30
APPENDIX II .................................................................................................................... 31
List of figures Figure 1. Map showing the location of Eyjafjallajökull ................................................... 10 Figure 2. Upper: Cumulative number of earthquakes in and near to Eyjafjallajökull. .... 11 Figure 3. Recorded seismicity by the SIL-system in Eyjafjallajökull and vicinity. ......... 13 Figure 4. Relocated seismicity using model P23-ave and model SIL .............................. 16 Figure 5. Selected relocated events with low relative error ............................................. 17 Figure 6. Temporal/spatial evolution of seismicity 1991–1995. ...................................... 18 Figure 7. Temporal/spatial evolution of seismicity between 1996 and 2007. .................. 19 Figure 8. Temporal/spatial evolution during the latter intrusion swarm and until 2006. . 19 Figure 9. Mechanisms in selected depth intervals for the three main swarms. ................ 21 Figure 10. Distribution of P- and T-axis for events ......................................................... 21 Figure 11. P- and T-axis distribution, azimuth and dip for optimum fault plane solutions for small clusters .............................................................................................................. 22 Figure 12. Frequency-magnitude distribution for five distinct depth intervals. ............... 22

8
Figure 13. Frequency in percentage versus depth for all relocated events ....................... 24
List of tables Table 1. b-values for Eyjafjallajökull estimated for all events and five distinct depth intervals. ............................................................................................................................. 22 Table A.1. SIL-stations near to Eyjafjallajökull ................................................................. 30
9
1 Abstract Between 1991 and August 2006, 860 earthquakes in Eyjafjallajökull volcano, South Iceland were recorded by the SIL national seismic network. These earthquakes have been relocated using a relative, double-difference location method and their source mechanisms recalculated. The spatial and temporal seismicity pattern is analysed, as well as the distribution of focal mechanisms and the relationship between b-values and source depth is examined. During the analysis period, three major swarms were recorded. Two of the swarms, in 1994 and 1999–2000, occurred in the upper crust and were accompanied by crustal deformation. No uplift was detected during the third swarm, which occurred in 1996 near the crust mantle boundary, between 19 and 25 km depth. The distribution of the seismicity forms an overall pipe-like structure under the northern slopes of the volcano, and maps the likely pathway of magma from the mantle, through the crust and up into the upper levels of the volcano, where the magma fed the two intrusions in 1994 and 1999. The intermediate, 1996-seismicity was probably caused by magma intruding up into the bottom of the crust: The intrusion would have temporarily elevated the strain rate and caused the otherwise ductile lower crust to behave in a brittle manner. Source mechanisms for the earthquake data set are rather scattered but commonly show horizontal, E-W oriented dilation, particularly at the crust-mantle boundary, further supporting the idea of magma intruding into the crust. During the summer of 2009 the fourth swarm was recorded beneath Eyjafjallajökull. These events have also been relocated. The seismicity, as well as the observations at a near-by continuous GPS station, strongly suggest that an intrusion was formed beneath the volcano during the swarm.
2 Introduction
2.1 Geological backgound Rifting and volcanic activity in southern Iceland take place on two parallel rift segments, the Western and the Eastern Volcanic Zones (WVZ and EVZ (Figure 1). The two segments are connected through a 70–80 km long transform zone, the South Iceland Seismic Zone (SISZ), which regularly produces a sequence of large, destructive earthquakes of magnitudes up to M7 (Einarsson et al., 1981; Einarsson, 2008). The majority of the rifting is taken up by the southward propagating and much more active EVZ (Sigmundsson et al., 1995), where spreading rate decreases southwards (LaFemina et al., 2005; Geirsson et al., 2006, Árnadóttir et al., 2008) to the volcanic flank zone, which has poorly developed extensional features (Sæmundsson, 1979). The Eyjafjallajökull volcano is situated in this flank zone (Figure 1). Partly covered by an ice cap, the volcano rises 1666 m a.s.l. and has a prominent ridge shape, elongated in the east-west direction with an east-west-striking fissure swarm, as well as a radial dyke system, extending from the small summit crater (Jónsson, 1988; Einarsson and Brandsdóttir, 2000). The southern flank of the mountain has been eroded by the outlet-glaciers and rivers which extend from the ice cap. Reversely magnetized rock can be found in the gulleys formed, indicating that volcanic activity has persisted in this volcanic complex for more than 0.7 M years, and at some places intrusions count for roughly 70% of the rock volume (Jónsson, 1985). Compared to the neighbouring volcanic system, Katla, which lies beneath the Mýrdalsjökull ice cap only a few kilometres to the east, Eyjafjallajökull has been much less active during the 1100 years of historic time in Iceland, with only two known
10
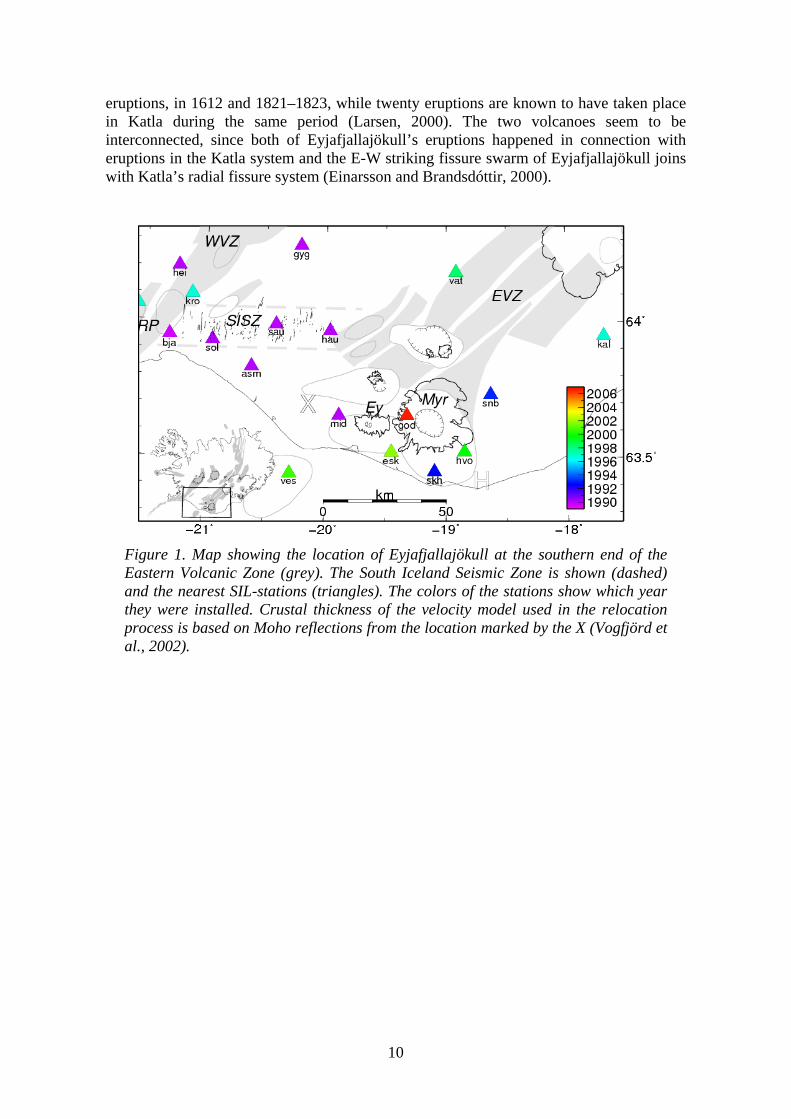
eruptions, in 1612 and 1821–1823, while twenty eruptions are known to have taken place in Katla during the same period (Larsen, 2000). The two volcanoes seem to be interconnected, since both of Eyjafjallajökull’s eruptions happened in connection with eruptions in the Katla system and the E-W striking fissure swarm of Eyjafjallajökull joins with Katla’s radial fissure system (Einarsson and Brandsdóttir, 2000).
Figure 1. Map showing the location of Eyjafjallajökull at the southern end of the Eastern Volcanic Zone (grey). The South Iceland Seismic Zone is shown (dashed) and the nearest SIL-stations (triangles). The colors of the stations show which year they were installed. Crustal thickness of the velocity model used in the relocation process is based on Moho reflections from the location marked by the X (Vogfjörd et al., 2002).
11
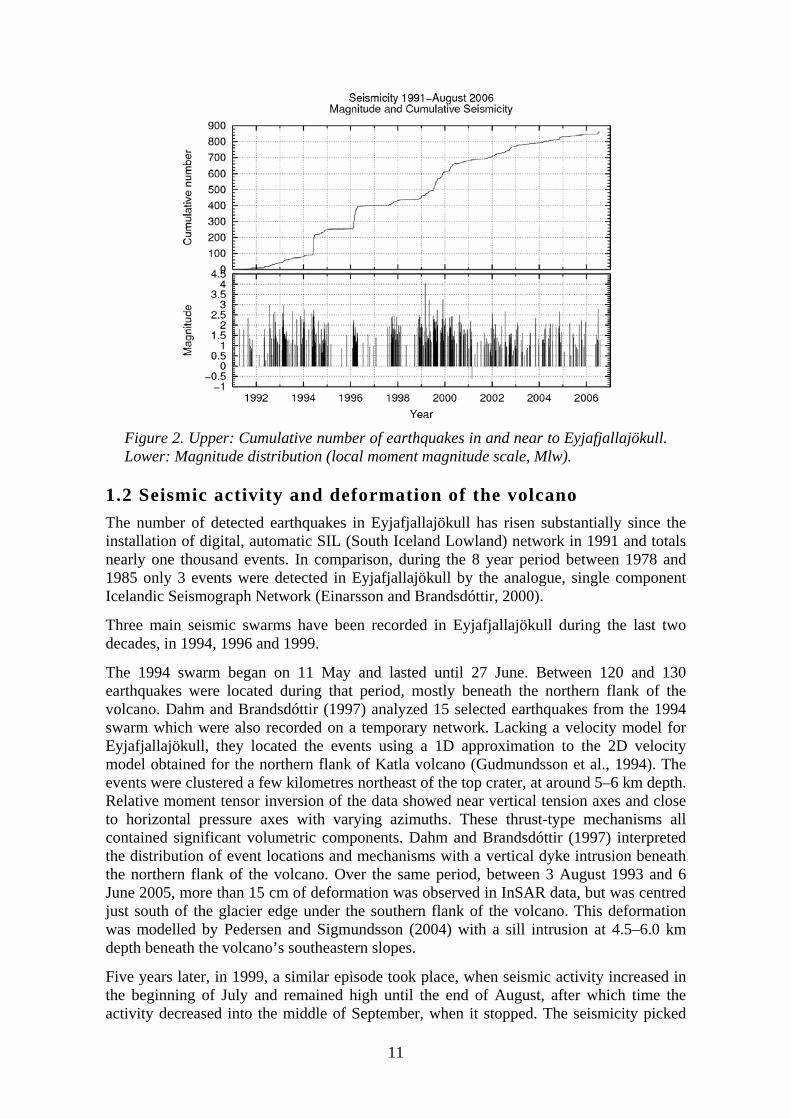
Figure 2. Upper: Cumulative number of earthquakes in and near to Eyjafjallajökull. Lower: Magnitude distribution (local moment magnitude scale, Mlw).
1.2 Seismic activity and deformation of the volcano The number of detected earthquakes in Eyjafjallajökull has risen substantially since the installation of digital, automatic SIL (South Iceland Lowland) network in 1991 and totals nearly one thousand events. In comparison, during the 8 year period between 1978 and 1985 only 3 events were detected in Eyjafjallajökull by the analogue, single component Icelandic Seismograph Network (Einarsson and Brandsdóttir, 2000).
Three main seismic swarms have been recorded in Eyjafjallajökull during the last two decades, in 1994, 1996 and 1999.
The 1994 swarm began on 11 May and lasted until 27 June. Between 120 and 130 earthquakes were located during that period, mostly beneath the northern flank of the volcano. Dahm and Brandsdóttir (1997) analyzed 15 selected earthquakes from the 1994 swarm which were also recorded on a temporary network. Lacking a velocity model for Eyjafjallajökull, they located the events using a 1D approximation to the 2D velocity model obtained for the northern flank of Katla volcano (Gudmundsson et al., 1994). The events were clustered a few kilometres northeast of the top crater, at around 5–6 km depth. Relative moment tensor inversion of the data showed near vertical tension axes and close to horizontal pressure axes with varying azimuths. These thrust-type mechanisms all contained significant volumetric components. Dahm and Brandsdóttir (1997) interpreted the distribution of event locations and mechanisms with a vertical dyke intrusion beneath the northern flank of the volcano. Over the same period, between 3 August 1993 and 6 June 2005, more than 15 cm of deformation was observed in InSAR data, but was centred just south of the glacier edge under the southern flank of the volcano. This deformation was modelled by Pedersen and Sigmundsson (2004) with a sill intrusion at 4.5–6.0 km depth beneath the volcano’s southeastern slopes.
Five years later, in 1999, a similar episode took place, when seismic activity increased in the beginning of July and remained high until the end of August, after which time the activity decreased into the middle of September, when it stopped. The seismicity picked
12
up again in late October and remained high between November and May the following year, and then gradually decreased. Analogous to the episode in 1994, the InSAR observations showed that the maximum uplift was located at the southern slopes of the volcano (Sturkell et al., 2003; Petersen and Sigmundsson, 2005). The more than 20 cm of observed uplift was modelled with another sill intrusion, but deeper than before, at ~6.3 km depth (Pedersen and Sigmundsson, 2005).
Both intrusion episodes, in 1994 and 1999, were also detected by GPS and dry tilt measurements. Sturkell et al. (2003) modelled the data from 1999 by a point pressure source at 3.5 km depth, just south of the glacier rim. They suggested a similar model for the 1994 event, but located the source roughly 3 km farther northeast. A more recent interpretation based on a combined multi-temporal InSAR algorithm (Hooper, 2008; Hooper, personal communication 2008) places the two sill intrusions at 5.6 ± 0.1 km in 1994 and at 5.7 ± 0.5 km in 1999–2000.
No observed crustal deformation accompanied the seismic swarm in 1996, which produced approximately 140 earthquakes between 30 January and 22 April that year. The reason probably being the depth of the seismic cluster, which was near the base of the crust.
The purpose of this research is to analyze the seismic activity within Eyjafjallajökull recorded by the SIL network during the period 1991–2006, in order to study the processes that caused the heightened seismicity and uplift. To improve the event locations the earthquakes are relocated using the double-difference method of Slunga et al., (1995). Earthquake mechanisms are analyzed, and b-value of the magnitude distribution is examined with respect to depth, as are frequency distribution and stress drop. Special interest is paid to the 1996 seismic swarm near the crust-mantle boundary, which could have marked the beginning of the 1999–2000 unrest and is the first such recorded in Iceland.
3 Data and methods
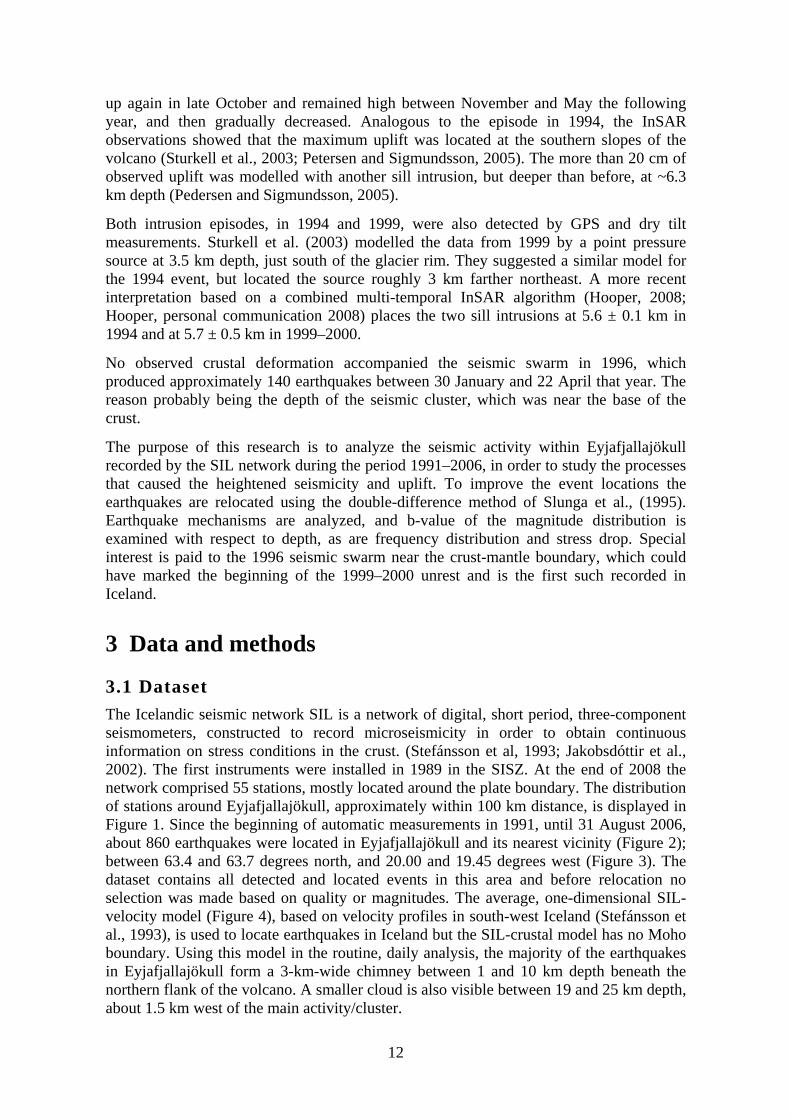
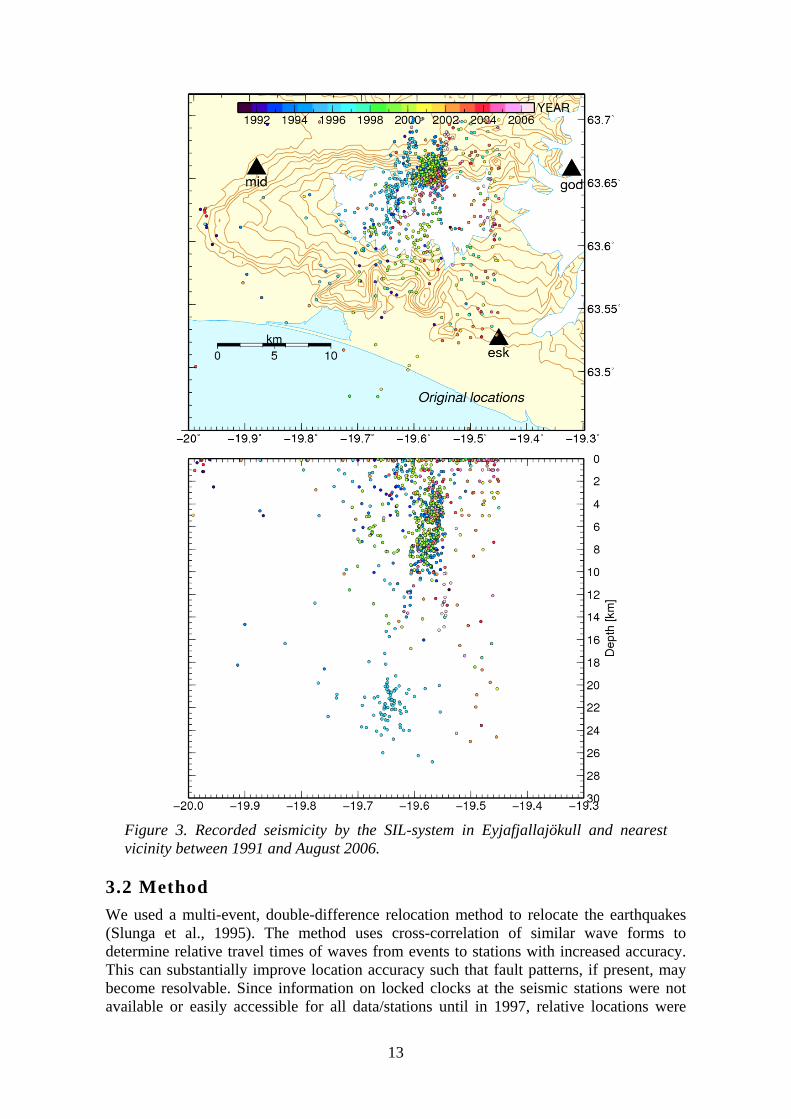
3.1 Dataset The Icelandic seismic network SIL is a network of digital, short period, three-component seismometers, constructed to record microseismicity in order to obtain continuous information on stress conditions in the crust. (Stefánsson et al, 1993; Jakobsdóttir et al., 2002). The first instruments were installed in 1989 in the SISZ. At the end of 2008 the network comprised 55 stations, mostly located around the plate boundary. The distribution of stations around Eyjafjallajökull, approximately within 100 km distance, is displayed in Figure 1. Since the beginning of automatic measurements in 1991, until 31 August 2006, about 860 earthquakes were located in Eyjafjallajökull and its nearest vicinity (Figure 2); between 63.4 and 63.7 degrees north, and 20.00 and 19.45 degrees west (Figure 3). The dataset contains all detected and located events in this area and before relocation no selection was made based on quality or magnitudes. The average, one-dimensional SIL-velocity model (Figure 4), based on velocity profiles in south-west Iceland (Stefánsson et al., 1993), is used to locate earthquakes in Iceland but the SIL-crustal model has no Moho boundary. Using this model in the routine, daily analysis, the majority of the earthquakes in Eyjafjallajökull form a 3-km-wide chimney between 1 and 10 km depth beneath the northern flank of the volcano. A smaller cloud is also visible between 19 and 25 km depth, about 1.5 km west of the main activity/cluster.
13
Figure 3. Recorded seismicity by the SIL-system in Eyjafjallajökull and nearest vicinity between 1991 and August 2006.
3.2 Method We used a multi-event, double-difference relocation method to relocate the earthquakes (Slunga et al., 1995). The method uses cross-correlation of similar wave forms to determine relative travel times of waves from events to stations with increased accuracy. This can substantially improve location accuracy such that fault patterns, if present, may become resolvable. Since information on locked clocks at the seismic stations were not available or easily accessible for all data/stations until in 1997, relative locations were
14
done in two separate time periods: 1991–13 June 1997 and 14 June 1997–31 August 2006, where the latter period includes accurate clock information.
Although the relocation method decreases the effect of error in velocity structure, it has been shown that different velocity models affect focal depth (Vogfjörð and Hjaltadóttir, 2007). Hence, relocation was applied using two different velocity models. Using the SIL velocity model, the chimney narrowed and shortened, but events from the first period separated from events from the second period. When the P23 velocity model was used, events from the two periods did on the other hand not separate spatially. The P23 model is based on the average of one-dimensional velocity structures derived from two profiles in south Iceland, as mentioned above (Vogfjord et al., 2002). A Moho reflection from 22 km depth in this model was obtained at Fljótshlíð (marked by and X in Figure 1), 28 km northwest of Eyjafjallajökull’s summit. Given the facts that the SIL model has no Moho-boundary, deep activity took place in 1996 close to this boundary according to the P23 crustal model and spatial separation in the main cluster between the two time periods are not seen using P23, it was concluded that model P23 was more reliable and relative locations based on the SIL-model were not analysed further.
Fault plane solutions were determined using the method by Rögnvaldsson and Slunga (1993 and 1994). Grid search is used to find all possible combinations of strike, dip and rake in 4° intervals. The radiation pattern is then calculated for each combination and compared to recorded amplitudes and the P-wave polarities, if available. The combinations, which fit the polarities available and have amplitudes within certain error limits from the measured amplitudes, are stored as possible solutions.
If the relocated seismicity shows any distinct fault patterns, the joint interpretation of the events defining the fault and their mechanisms can be used to determine an overall slip direction for each fault. For each event on the fault, the mechanism best fitting the overall strike and dip of the fault is chosen. The average slip of all events is used to estimate the overall slip direction on the fault. When no distinct lineaments can be detected, the optimum fault plane solution (having the lowest error) is used for further interpretation. We did not observe any distinct faults so interpretation of FPSs is hereafter in terms of direction of P- and T-axes of the optimum solutions.
4 Results
4.1 Relative locations and temporal and spatial evolution of the seismicity
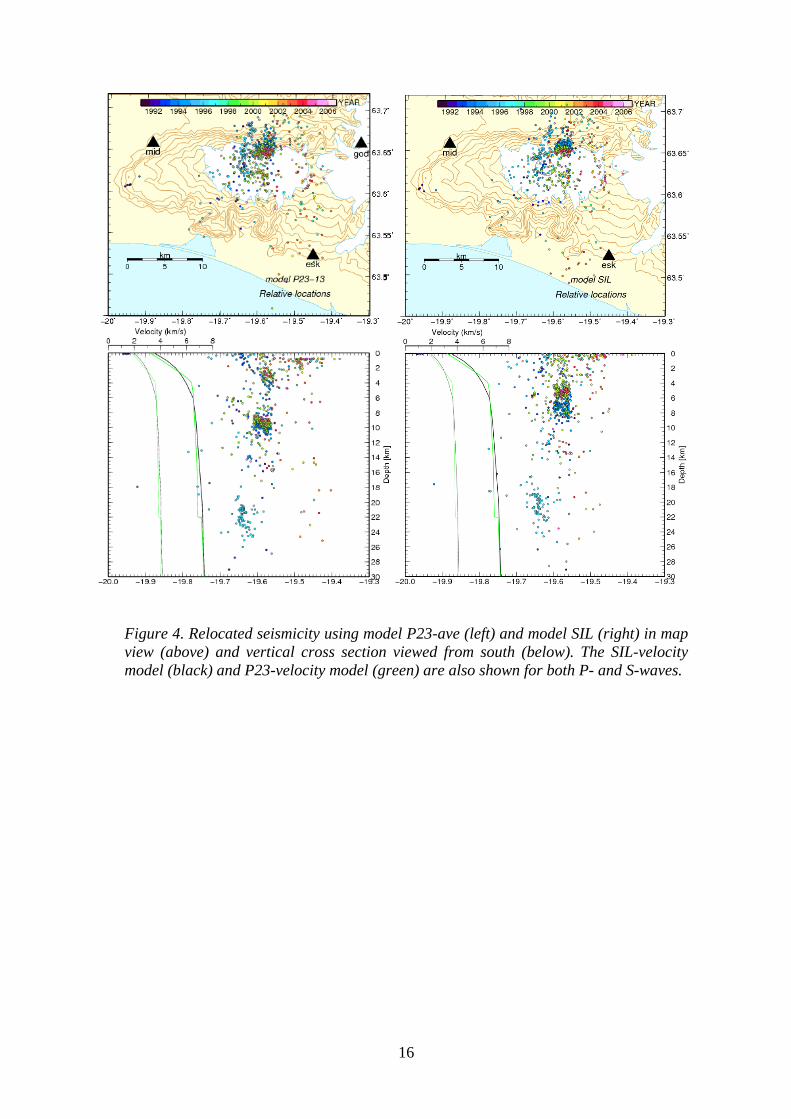
Figure 4 shows relative locations of all events obtained using the P23 velocity model. Compared to the original locations (Figure 3) the pipe/chimney has (narrowed and) shortened, with the main activity clustering between 8 and 11 km depth, and also between 2 and 5 km depth. These two clusters include most of the seismicity accompanying the intrusive activity in 1994 and 1999–2000. As mentioned earlier, the seismicity in Eyjafjallajökull increased in late May 1994 and stayed high for roughly a month. The majority of this activity is located in the main cluster beneath the northern edge of the glacier, between 8 and 11 km depth. The epicentres form a horseshoe-shaped cluster, facing SSE (upper insert in Figure 5). A second cluster lies above it, between 2.5 and 4.5 km depth. The swarm activity between July 1999 and May 2000 occurred at the same location as in 1994. The epicentres form a very similar crescent shaped cluster (lower insert in Figure 5), which is accurately relatively located.
15
The increased activity in early 1996 includes the deepest cluster, which lies between 20 km and 25 km depth. Compared to the original single-event locations the cluster is tighter and about 1 km deeper. Horizontally the events form a distribution elongated in the N-S direction 1.5–2 km west of the main activity (light blue in Figure 4).
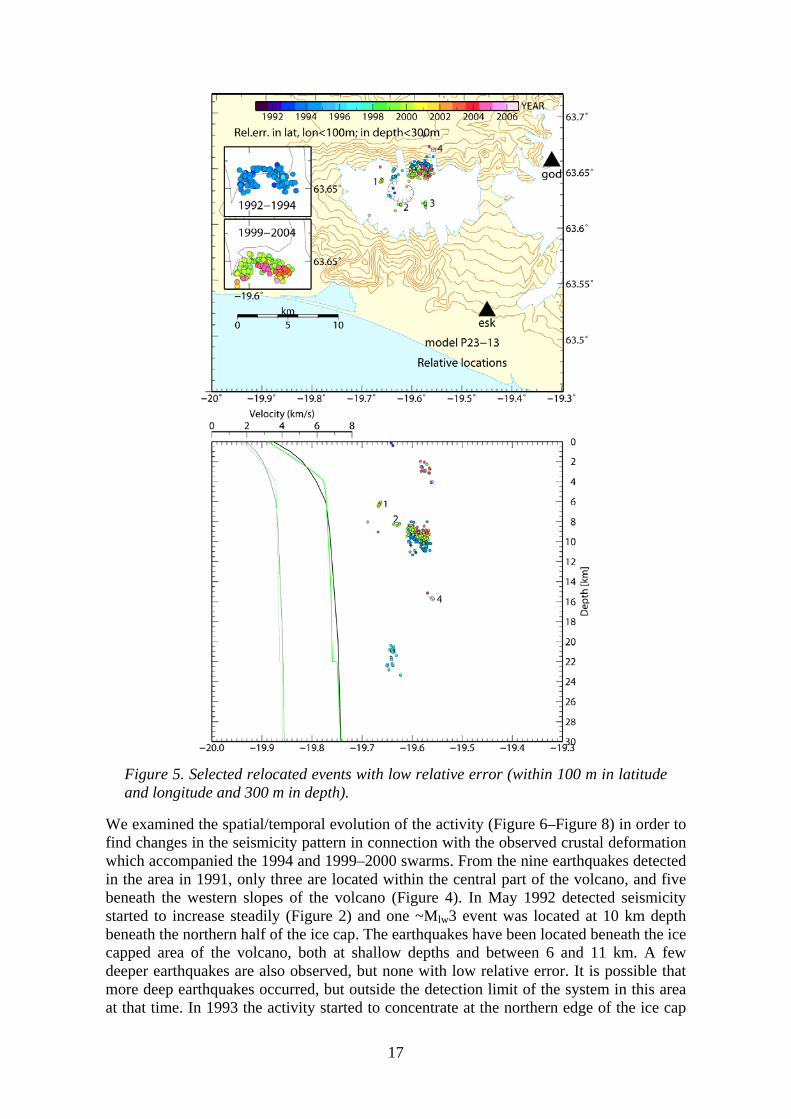
Apart from the main activity, four smaller clusters, numbered 1–4 in Figure 5, were distinguished from the group of earthquakes all having low relative location error, within 100 m in latitude and longitude and 300 m in depth, as displayed in Figure 5. Cluster 1, farthest west, consists of 12 earthquakes, which occurred in August and September 1999 at 6–6.5 km depth, just at the bottom of the suggested intrusion. Cluster 2, a group six events, thereof four well located, is located just off the southern rim of the caldera at 8 km depth. All but one occurred in August 1999, shortly before the period of maximum uplift. Several other earthquakes were detected between 5 and 8 km depth, but were scattered south of the summit crater. Cluster 3 is located less than 1 km ESE of the crater rim at roughly 10 km depth. It contains 9 earthquakes, which occurred in July 1999. Cluster 4 is situated at the northern edge of the glacier, about 1.5 km north of the main horseshoe-shaped cluster. It is composed of 11 earthquakes at approximately 16 km depth, which occurred in June and July 2006.
Figure 4 shows numerous earthquakes located near the surface (between -1 and 1.5 km depth). Most of these are low quality events with poor original locations which did not improve during the relocation process. Events located east of ~19.53°W probably originate in western Mýrdalsjökull. A group of events which occurred between 1992 and 1994 and also in mid February 1996, at the beginning of the deep swarm, is also located near to the surface. A selection of the shallowest earthquakes was re-examined and relocated interactively using the P23-model and then relocated again with the double-difference method. This did either return shallow locations or scattered activity at intermediate depths, But comparison of the waveforms of a couple of these shallow events and deep events which occurred the same day suggests that the events located at the surface originate deeper, or in the lower crust.
16
Figure 4. Relocated seismicity using model P23-ave (left) and model SIL (right) in map view (above) and vertical cross section viewed from south (below). The SIL-velocity model (black) and P23-velocity model (green) are also shown for both P- and S-waves.
17
Figure 5. Selected relocated events with low relative error (within 100 m in latitude and longitude and 300 m in depth).
We examined the spatial/temporal evolution of the activity (Figure 6–Figure 8) in order to find changes in the seismicity pattern in connection with the observed crustal deformation which accompanied the 1994 and 1999–2000 swarms. From the nine earthquakes detected in the area in 1991, only three are located within the central part of the volcano, and five beneath the western slopes of the volcano (Figure 4). In May 1992 detected seismicity started to increase steadily (Figure 2) and one ~Mlw3 event was located at 10 km depth beneath the northern half of the ice cap. The earthquakes have been located beneath the ice capped area of the volcano, both at shallow depths and between 6 and 11 km. A few deeper earthquakes are also observed, but none with low relative error. It is possible that more deep earthquakes occurred, but outside the detection limit of the system in this area at that time. In 1993 the activity started to concentrate at the northern edge of the ice cap
18
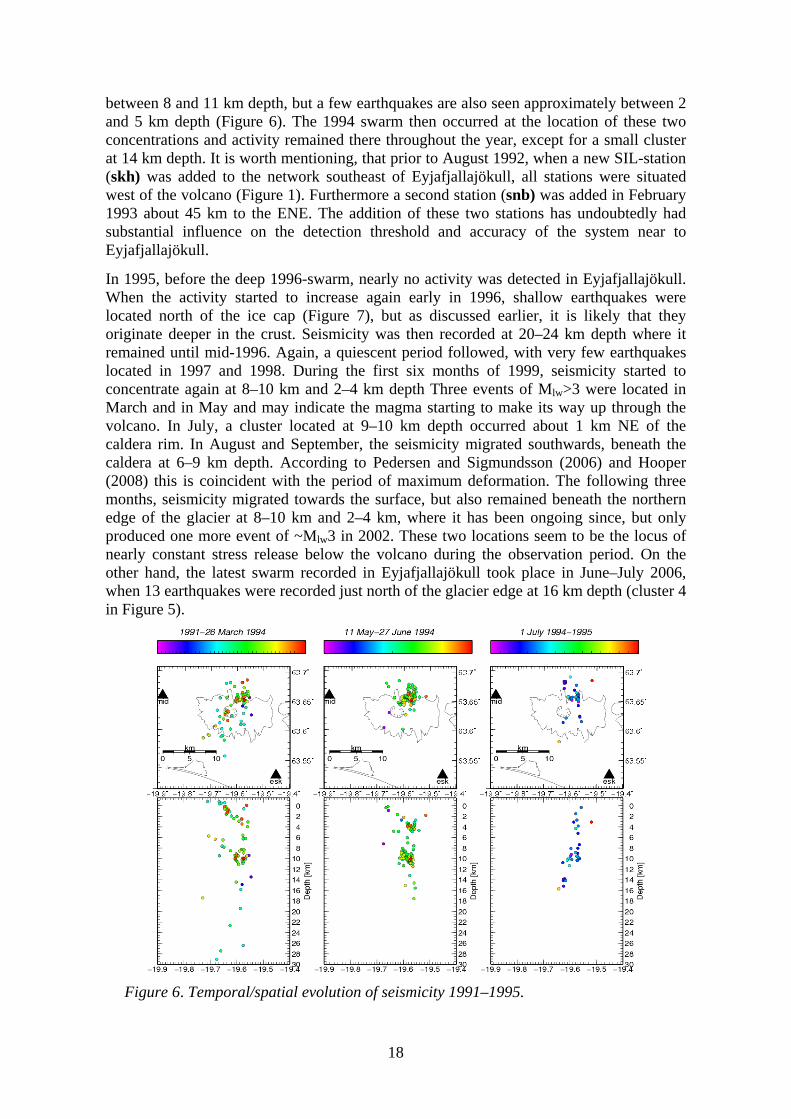
between 8 and 11 km depth, but a few earthquakes are also seen approximately between 2 and 5 km depth (Figure 6). The 1994 swarm then occurred at the location of these two concentrations and activity remained there throughout the year, except for a small cluster at 14 km depth. It is worth mentioning, that prior to August 1992, when a new SIL-station (skh) was added to the network southeast of Eyjafjallajökull, all stations were situated west of the volcano (Figure 1). Furthermore a second station (snb) was added in February 1993 about 45 km to the ENE. The addition of these two stations has undoubtedly had substantial influence on the detection threshold and accuracy of the system near to Eyjafjallajökull.
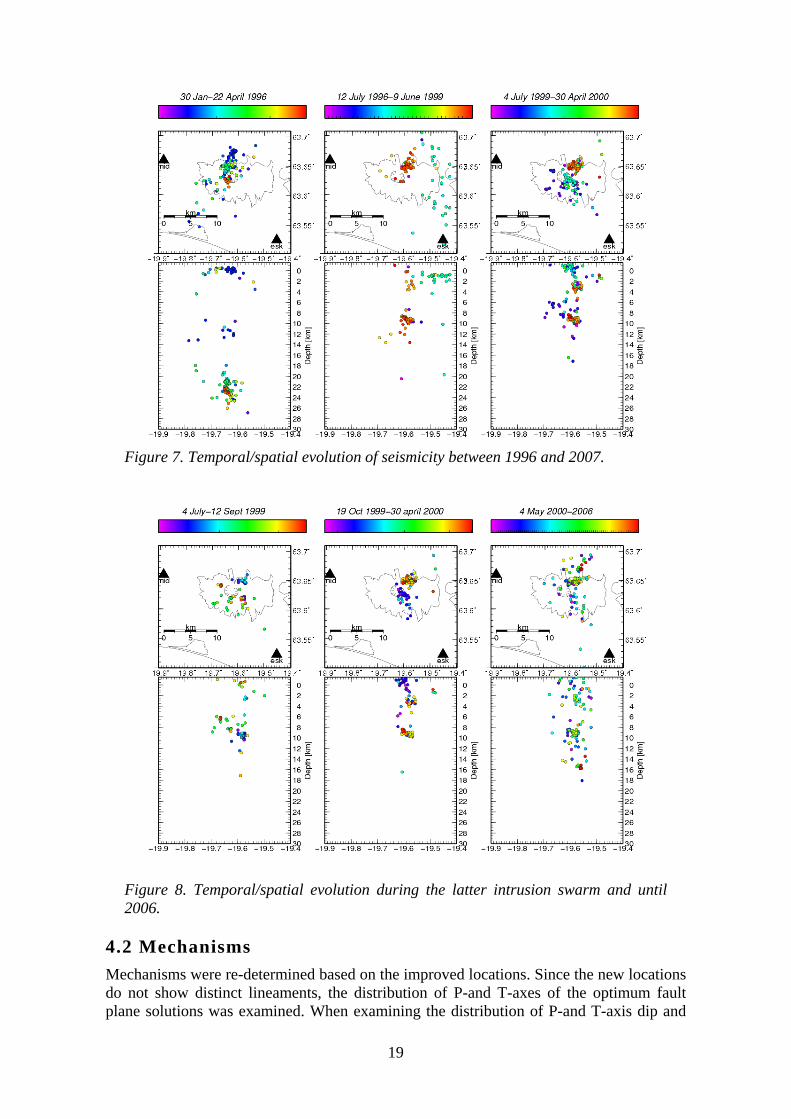
In 1995, before the deep 1996-swarm, nearly no activity was detected in Eyjafjallajökull. When the activity started to increase again early in 1996, shallow earthquakes were located north of the ice cap (Figure 7), but as discussed earlier, it is likely that they originate deeper in the crust. Seismicity was then recorded at 20–24 km depth where it remained until mid-1996. Again, a quiescent period followed, with very few earthquakes located in 1997 and 1998. During the first six months of 1999, seismicity started to concentrate again at 8–10 km and 2–4 km depth Three events of Mlw>3 were located in March and in May and may indicate the magma starting to make its way up through the volcano. In July, a cluster located at 9–10 km depth occurred about 1 km NE of the caldera rim. In August and September, the seismicity migrated southwards, beneath the caldera at 6–9 km depth. According to Pedersen and Sigmundsson (2006) and Hooper (2008) this is coincident with the period of maximum deformation. The following three months, seismicity migrated towards the surface, but also remained beneath the northern edge of the glacier at 8–10 km and 2–4 km, where it has been ongoing since, but only produced one more event of ~Mlw3 in 2002. These two locations seem to be the locus of nearly constant stress release below the volcano during the observation period. On the other hand, the latest swarm recorded in Eyjafjallajökull took place in June–July 2006, when 13 earthquakes were recorded just north of the glacier edge at 16 km depth (cluster 4 in Figure 5).
Figure 6. Temporal/spatial evolution of seismicity 1991–1995.
19
Figure 7. Temporal/spatial evolution of seismicity between 1996 and 2007.
Figure 8. Temporal/spatial evolution during the latter intrusion swarm and until 2006.
4.2 Mechanisms Mechanisms were re-determined based on the improved locations. Since the new locations do not show distinct lineaments, the distribution of P-and T-axes of the optimum fault plane solutions was examined. When examining the distribution of P-and T-axis dip and
20
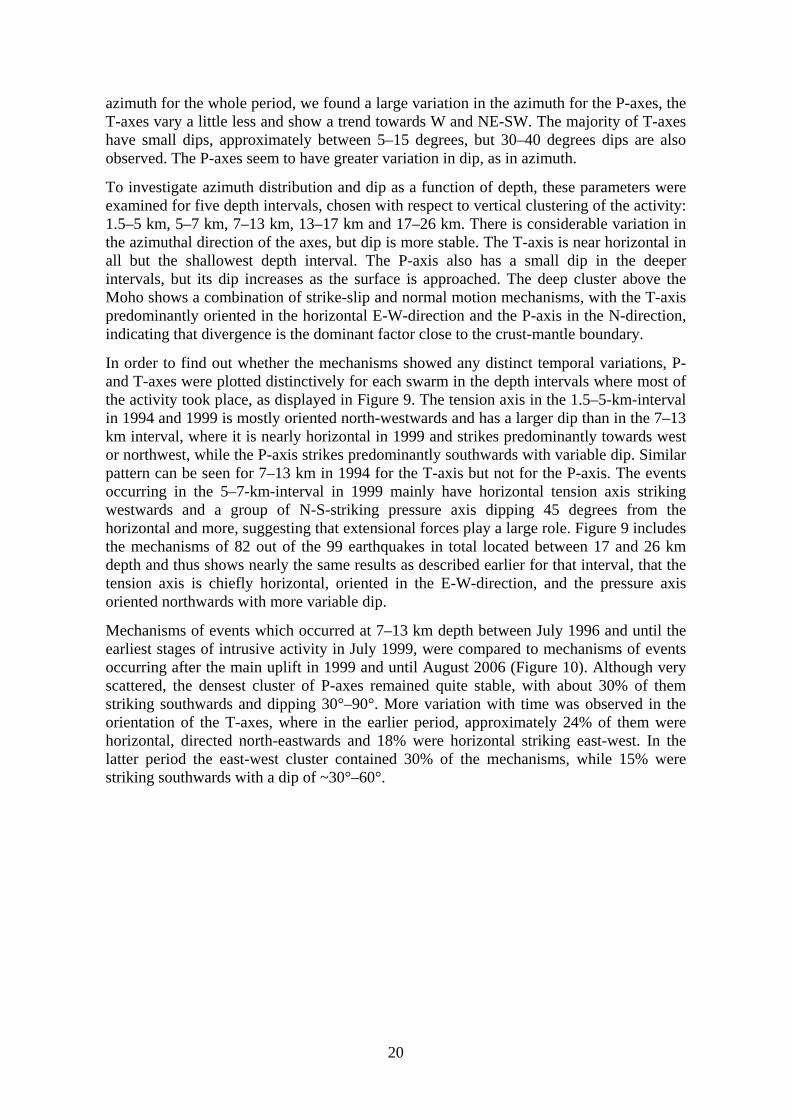
azimuth for the whole period, we found a large variation in the azimuth for the P-axes, the T-axes vary a little less and show a trend towards W and NE-SW. The majority of T-axes have small dips, approximately between 5–15 degrees, but 30–40 degrees dips are also observed. The P-axes seem to have greater variation in dip, as in azimuth.
To investigate azimuth distribution and dip as a function of depth, these parameters were examined for five depth intervals, chosen with respect to vertical clustering of the activity: 1.5–5 km, 5–7 km, 7–13 km, 13–17 km and 17–26 km. There is considerable variation in the azimuthal direction of the axes, but dip is more stable. The T-axis is near horizontal in all but the shallowest depth interval. The P-axis also has a small dip in the deeper intervals, but its dip increases as the surface is approached. The deep cluster above the Moho shows a combination of strike-slip and normal motion mechanisms, with the T-axis predominantly oriented in the horizontal E-W-direction and the P-axis in the N-direction, indicating that divergence is the dominant factor close to the crust-mantle boundary.
In order to find out whether the mechanisms showed any distinct temporal variations, P- and T-axes were plotted distinctively for each swarm in the depth intervals where most of the activity took place, as displayed in Figure 9. The tension axis in the 1.5–5-km-interval in 1994 and 1999 is mostly oriented north-westwards and has a larger dip than in the 7–13 km interval, where it is nearly horizontal in 1999 and strikes predominantly towards west or northwest, while the P-axis strikes predominantly southwards with variable dip. Similar pattern can be seen for 7–13 km in 1994 for the T-axis but not for the P-axis. The events occurring in the 5–7-km-interval in 1999 mainly have horizontal tension axis striking westwards and a group of N-S-striking pressure axis dipping 45 degrees from the horizontal and more, suggesting that extensional forces play a large role. Figure 9 includes the mechanisms of 82 out of the 99 earthquakes in total located between 17 and 26 km depth and thus shows nearly the same results as described earlier for that interval, that the tension axis is chiefly horizontal, oriented in the E-W-direction, and the pressure axis oriented northwards with more variable dip.
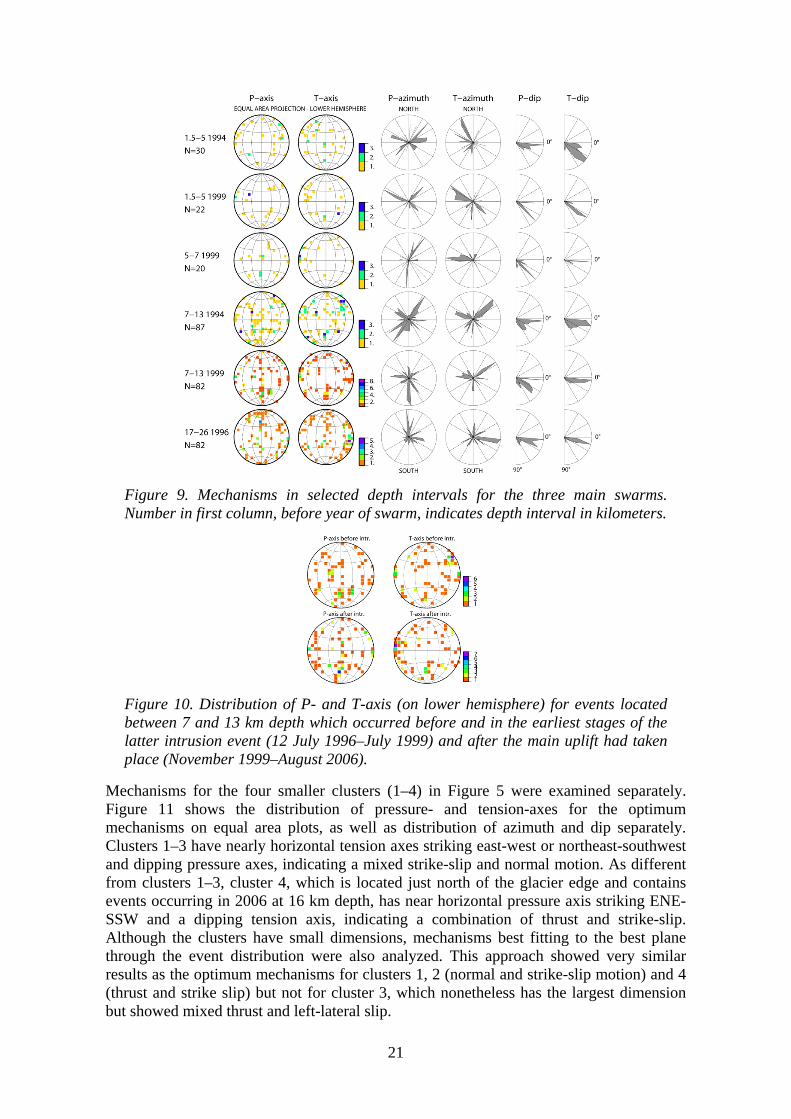
Mechanisms of events which occurred at 7–13 km depth between July 1996 and until the earliest stages of intrusive activity in July 1999, were compared to mechanisms of events occurring after the main uplift in 1999 and until August 2006 (Figure 10). Although very scattered, the densest cluster of P-axes remained quite stable, with about 30% of them striking southwards and dipping 30°–90°. More variation with time was observed in the orientation of the T-axes, where in the earlier period, approximately 24% of them were horizontal, directed north-eastwards and 18% were horizontal striking east-west. In the latter period the east-west cluster contained 30% of the mechanisms, while 15% were striking southwards with a dip of ~30°–60°.
21
Figure 9. Mechanisms in selected depth intervals for the three main swarms. Number in first column, before year of swarm, indicates depth interval in kilometers.
Figure 10. Distribution of P- and T-axis (on lower hemisphere) for events located between 7 and 13 km depth which occurred before and in the earliest stages of the latter intrusion event (12 July 1996–July 1999) and after the main uplift had taken place (November 1999–August 2006).
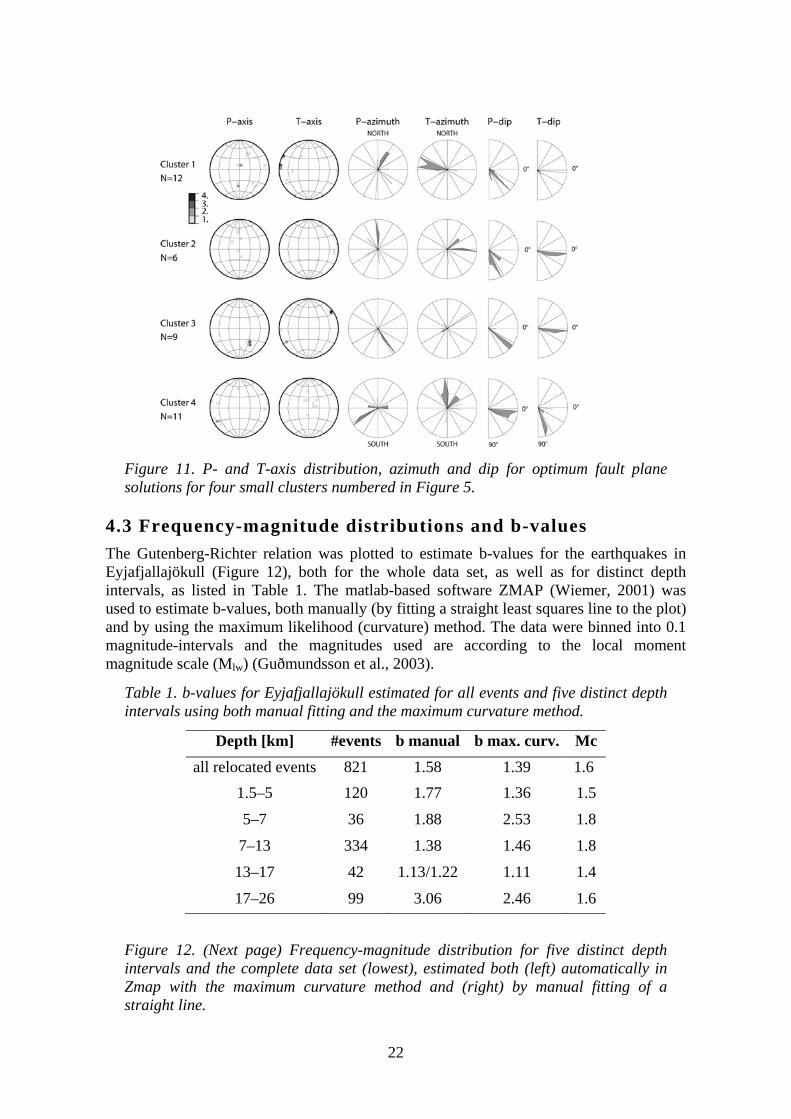
Mechanisms for the four smaller clusters (1–4) in Figure 5 were examined separately. Figure 11 shows the distribution of pressure- and tension-axes for the optimum mechanisms on equal area plots, as well as distribution of azimuth and dip separately. Clusters 1–3 have nearly horizontal tension axes striking east-west or northeast-southwest and dipping pressure axes, indicating a mixed strike-slip and normal motion. As different from clusters 1–3, cluster 4, which is located just north of the glacier edge and contains events occurring in 2006 at 16 km depth, has near horizontal pressure axis striking ENE-SSW and a dipping tension axis, indicating a combination of thrust and strike-slip. Although the clusters have small dimensions, mechanisms best fitting to the best plane through the event distribution were also analyzed. This approach showed very similar results as the optimum mechanisms for clusters 1, 2 (normal and strike-slip motion) and 4 (thrust and strike slip) but not for cluster 3, which nonetheless has the largest dimension but showed mixed thrust and left-lateral slip.
22
Figure 11. P- and T-axis distribution, azimuth and dip for optimum fault plane solutions for four small clusters numbered in Figure 5.
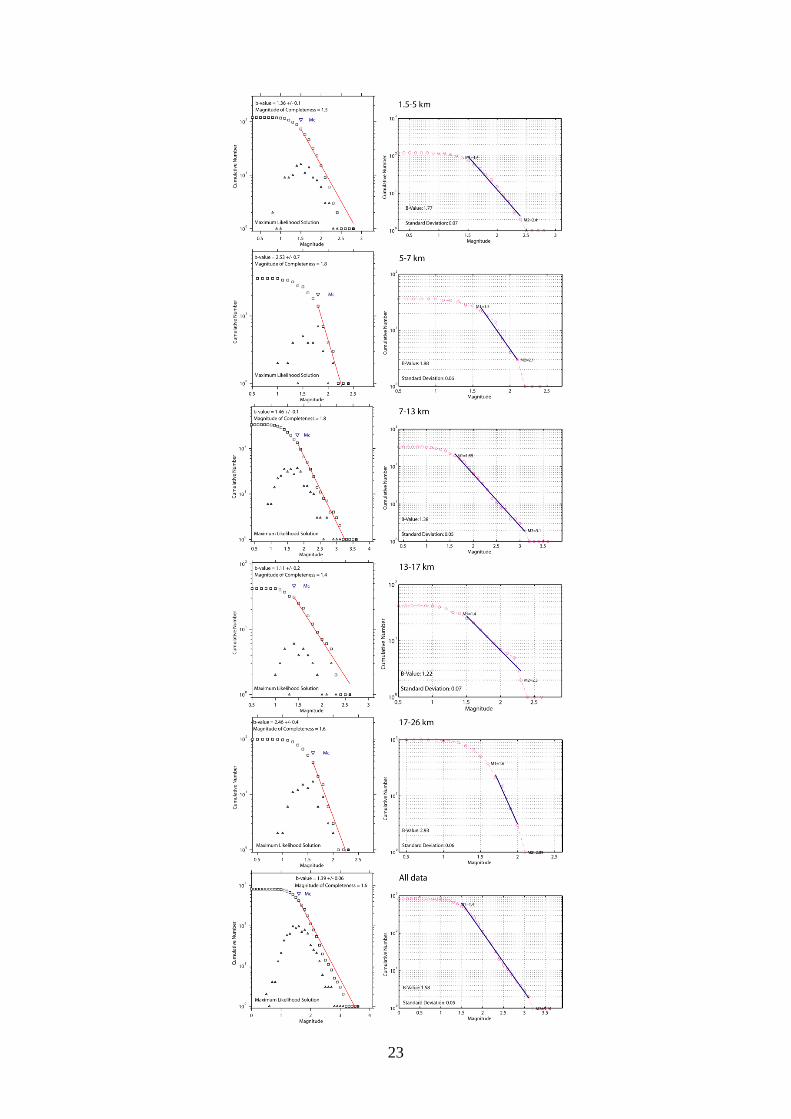
4.3 Frequency-magnitude distributions and b-values The Gutenberg-Richter relation was plotted to estimate b-values for the earthquakes in Eyjafjallajökull (Figure 12), both for the whole data set, as well as for distinct depth intervals, as listed in Table 1. The matlab-based software ZMAP (Wiemer, 2001) was used to estimate b-values, both manually (by fitting a straight least squares line to the plot) and by using the maximum likelihood (curvature) method. The data were binned into 0.1 magnitude-intervals and the magnitudes used are according to the local moment magnitude scale (Mlw) (Guðmundsson et al., 2003).
Table 1. b-values for Eyjafjallajökull estimated for all events and five distinct depth intervals using both manual fitting and the maximum curvature method.
Depth [km] #events b manual b max. curv. Mc all relocated events 821 1.58 1.39 1.6
1.5–5 120 1.77 1.36 1.5
5–7 36 1.88 2.53 1.8
7–13 334 1.38 1.46 1.8
13–17 42 1.13/1.22 1.11 1.4
17–26 99 3.06 2.46 1.6
Figure 12. (Next page) Frequency-magnitude distribution for five distinct depth intervals and the complete data set (lowest), estimated both (left) automatically in Zmap with the maximum curvature method and (right) by manual fitting of a straight line.
23
24
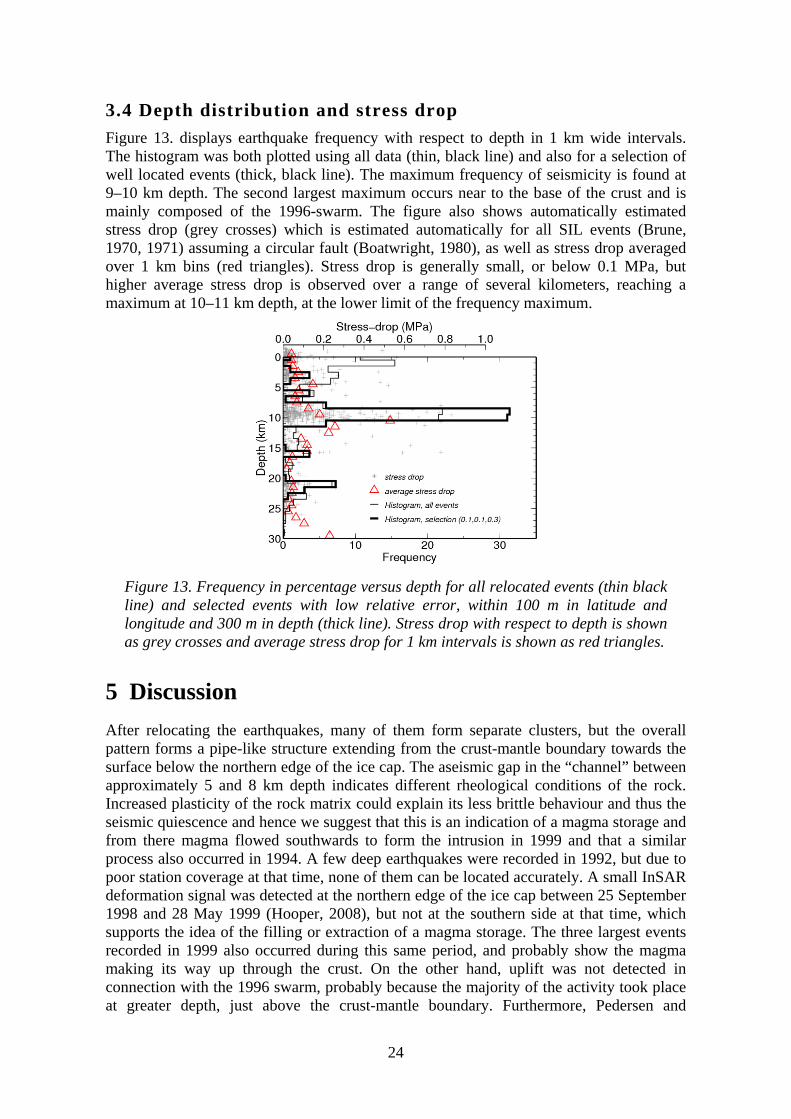
3.4 Depth distribution and stress drop Figure 13. displays earthquake frequency with respect to depth in 1 km wide intervals. The histogram was both plotted using all data (thin, black line) and also for a selection of well located events (thick, black line). The maximum frequency of seismicity is found at 9–10 km depth. The second largest maximum occurs near to the base of the crust and is mainly composed of the 1996-swarm. The figure also shows automatically estimated stress drop (grey crosses) which is estimated automatically for all SIL events (Brune, 1970, 1971) assuming a circular fault (Boatwright, 1980), as well as stress drop averaged over 1 km bins (red triangles). Stress drop is generally small, or below 0.1 MPa, but higher average stress drop is observed over a range of several kilometers, reaching a maximum at 10–11 km depth, at the lower limit of the frequency maximum.
Figure 13. Frequency in percentage versus depth for all relocated events (thin black line) and selected events with low relative error, within 100 m in latitude and longitude and 300 m in depth (thick line). Stress drop with respect to depth is shown as grey crosses and average stress drop for 1 km intervals is shown as red triangles.
5 Discussion After relocating the earthquakes, many of them form separate clusters, but the overall pattern forms a pipe-like structure extending from the crust-mantle boundary towards the surface below the northern edge of the ice cap. The aseismic gap in the “channel” between approximately 5 and 8 km depth indicates different rheological conditions of the rock. Increased plasticity of the rock matrix could explain its less brittle behaviour and thus the seismic quiescence and hence we suggest that this is an indication of a magma storage and from there magma flowed southwards to form the intrusion in 1999 and that a similar process also occurred in 1994. A few deep earthquakes were recorded in 1992, but due to poor station coverage at that time, none of them can be located accurately. A small InSAR deformation signal was detected at the northern edge of the ice cap between 25 September 1998 and 28 May 1999 (Hooper, 2008), but not at the southern side at that time, which supports the idea of the filling or extraction of a magma storage. The three largest events recorded in 1999 also occurred during this same period, and probably show the magma making its way up through the crust. On the other hand, uplift was not detected in connection with the 1996 swarm, probably because the majority of the activity took place at greater depth, just above the crust-mantle boundary. Furthermore, Pedersen and
25
Sigmundsson (2006) showed that if the 1999 intrusion material originated at greater depth than 17 km, their method would be unable to resolve the resulting deformation. Mechanisms for the 1996 swarm predominantly show nearly horizontal, E-W oriented tension axis (Figure 9) but more variable dipping and striking pressure axis. Dilatation is thus the dominant factor at the crust-mantle boundary, which also supports our idea that the swarm indicates a short period of magma intruding from the mantle up into the bottom of the crust. The higher strain rate, caused by such an intrusion, results in brittle behaviour of the ductile rock (Sibson, 1984). Such deep intrusion events are uncommonly observed in Iceland, but deep events have though been recorded beneath the Heimaey fissure in Vestmannaeyjar, before it erupted in 1973 and since. Deep seismicity was also observed during a large swarm at Upptyppingar-Álftadalsdyngja in the northern volcanic zone in 2007–2008, when thousands of earthquakes were detected between 14–22 km depth accompanying horizontal displacement of continuous GPS stations (Jakobsdóttir et al., 2008). Several deep earthquakes have been detected beneath Katla’s eastern caldera rim in 2007 and 2008 and 20 km farther south-east near to Hjörleifshöfði (location is marked by the H in Figure 1), deep seismicity was recorded in December 2007. After relocation using the P23-model, the ten small events all form a dense cluster located between 24 and 25 km depth (Hjaltadóttir, unpublished data, 2008). Similar to the 1996-swarm, all this deep seismicity may be the indication of a period of regional influx of magma from the mantle.
Maximum frequency, also known as the characteristic depth (Iio, 1996), is reached between 9 and 10 km depth. It has previously been observed that maximum frequency of seismicity in the crust occurs at or just below the brittle-ductile transition (i.e. Iio, 1996; Ito,1990; Meissner and Strehlau, 1982). It is also widely accepted that the brittle-ductile transition does not occur abruptly but rather through a certain depth range (i.e. Scholz, 1988 and 2002; Strehlau 1986). We also observe a peak in average stress drop near the characteristic depth, or at the lower limit of the frequency maximum, between 10 and 12 km depth. Since higher stress drop implies higher moment release per fault length (Lay and Wallace, 1995), one may assume that highest stress drop is found at the maximum crustal strength. Combining this information we conclude that the brittle ductile transition occurs between 9 and 12 km depth below Eyjafjallajökull, but this thickness estimation of the brittle crust is considerably thinner than the more than 19 km thickness of the seismogenic crust estimated in this area by Ágústsson and Flóvenz (2005).
Our mechanisms are greatly scattered, but most of the events are small (Mlw<2.5) which partly accounts for this variety. The addition of three new stations north, north-east and south-east of the volcano between the two intrusion events (Figure 1) probably explains the slightly less scattered mechanisms for the latter intrusion swarm compared to the first one. But with no T-axes close to vertical, our mechanisms are not in agreement with the results of Dahm og Brandsdóttir (1997), who located the 1994 events using a 1D approximation to the velocity model obtained for the northern flank of Katla volcano (Gudmundsson et al., 1994). Their events, which in our dataset are mostly located between 8.5 and 10.5 km depth, and in the western part of the horse-shoe shaped event distribution, were distributed up to 1 km east of the horse-shoe and much shallower than our results indicate, or between 4.5 and 6.5 km depth. The reasons for the discrepancy can be for example the different velocity models used. There is a great difference in velocity in the two models between 3 and 6 km depth where the P23 model has higher velocities, and the rays are mostly bottoming in the 3–6 km depth range, thus affecting travel times. The great velocity variation will also greatly affect the take-off angles on the focal sphere, thus affecting the mechanisms. The velocity model we used is well constrained and appropriate for propagation in SW Iceland. It is less constrained in the top few km. However, it is
26
closer to the velocity model obtained by Jónsdóttir et al. (2007) for the western flank of Katla than the northern Katla model. The southward migration of the seismicity in August 1999 towards the southern slopes of the volcano is concurrent with the period of maximum crustal uplift according to the InSAR time-series by Pedersen and Sigmundsson (2006) and Hooper (2008). Their suggested depth of the sill intrusion also falls within the depth range of the southwards migrating seismicity, which is spread laterally over a 5-by-8 km area, supporting the formation of an intrusion of significant horizontal extent.
The frequency-magnitude distribution for the complete data set yields a magnitude of completeness of Mlw=1.6 and a b-value between 1.4 and 1.6 (Table 1), dependent on which method was used. This is considerably higher than typical b-values of ~0.87 found for the Hengill volcanic area (approximately location of stations hei and kro in Figure 1) during a 10 year period including an intrusion event (Ágústsson and Halldórsson, 2005). Our b-values are on the other hand slightly lower than estimated for another recent intrusion swarm in an Icelandic, volcanic area, for the 2007 Upptyppingar-Álftadalsdyngja swarm exhibited an overall value of approximately 2.1 (Jakobsdóttir et al., 2008). The examination of b-values with respect to depth revealed a b-value for the shallowest interval that was approximately within the limits for the total b-value. The sparse data in the 5–7 km interval do not fit well to the Gutenberg-Richter relation and the high b-values found for this depth range are highly unreliable. Wyss and Ragnarsson (2006) concluded that b-values of the lowest part of the seismogenic crust in the south Iceland transform zone are significantly higher than those in the upper part. Since the majority of the activity at 7–13 km depth has a b-value close to 1.4, this does not apply to our data in a volcanic area. Deeper, in the lower crust, the b-value for 13–17 km decreases to 1.1–1.2, but increases again to a much higher b-value of 2.4–3 in the deepest cluster. This high value probably reflects the higher temperature at the bottom of the crust, since it is based on the lack of large events in this ductile part of the crust (McNutt, 2005 and references therein).
6 Conclusions By analyzing relocated microearthquakes recorded by the SIL-network in Eyjafjallajökull between 1991 and 2006 and their mechanisms we conclude that (1) the overall pipe-like pattern of earthquake distribution below the Eyjafjallajökull volcano indicates a feeding channel through the crust, which is located below the northern edge of the ice cap and fed the intrusions in the upper crust in 1994 and in 1999. (2) The deep swarm in 1996 at the crust-mantle boundary was caused by a period of magma intruding from below up into the base of the crust and this material may even have fed the 1999-intrusion. (3) Sparse seismicity has been recorded between approximately 5 and 8 km depth below the northern flank of the volcano and magma probably accumulated there in 1999 and in 1994 before it migrated southwards to form the intrusions beneath the southern flank. (4) From the maximum frequency of earthquakes, which is between 9 and 10 km depth, and maximum average stress drop observed at 10–12 km depth, we conclude that the brittle-ductile transition occurs at 9–12 km depth beneath Eyjafjallajökull volcano.
27
Acknowledgements This work was supported by the European Commission, 6th Framework Project-‘VOLUME’, Contract No. 018471. All figures in this report were made with the GMT public domain software (Wessel and Smith, 1998), except for Figure 2 which was made with the public Gnuplot software (http://www.gnuplot.info), and Figure 11 which was prepared with the ZMAP software (Wiemer, 2001). Thanks to Matthew J. Roberts for reading and editing an earlier version of the manuscript.
References Allen, R. M., G. Nolet, W. J. Morgan, K. Vogfjörd, M. Nettles, G. Ekström, B. H.
Bergsson, P. Erlendsson, G. Goulger, S. Jakobsdottir, B. Julian, M. Pritchard, S. Ragnarsson, and R. Stefansson (2002). Plume driven plumbing and crustal formation in Iceland, J. Geophys. Res., 107 (B8) 101029/2001JB000584.
Ágústsson, K., and Ó. G. Flóvenz (2005). The Thickness of the Seismogenic Crust in Iceland and its Implications for Geothermal Systems. Proceedings of the World Geothermal Congress 2005, Antalya, Turkey, 24–29 April 2005.
Boatwright, J. (1980). A spectral theory for circular seismic sources; simple estimates of source dimension, dynamic stress drop, and radiated seismic energy. Bull. Seism. Soc. Am.,70, no 1, 1–27.
Brune, J. N. (1970). Tectonic stress and the spectra of seismic shear waves from earthquakes. J. Geophys. Res., 75, no 26, 4997–5009.
Brune, J. N. (1971). Correction. J. of Geophys. Res., 76, No. 20, 5002. Dahm, Thorsten, B. Brandsdóttir (1997). Moment tensors of microearthquakes from the
Eyjafjallajökull volcano in South Iceland. Geophys. J. Int, 130, 183–192. Einarsson, P., S. Björnsson, G. Foulger, R. Stefánsson and Th. Skaftadóttir (1981).
Seismicity pattern in the south Iceland seismic zone. From Earthquake Prediction – An International Review, Maurice Ewing Series 4, 141–151.
Einarsson, P., 1991. Earthquakes and present-day tectonism in Iceland (1991). Tectonophysics, 189, 261–279.
Einarsson, P., B. Brandsdóttir (2000). Earthquakes in the Mýrdalsjökull area, 1978–1985. Jökull, 49, 59–73
Geirsson, H., Th. Árnadóttir, C. Völksen, W. Jiang, E. Sturkell, T. Villemin, P. Einarsson, F. Sigmundsson, and R. Stefánsson (2006). Current plate movements across the Mid-Atlantic Ridge determined from 5 years of continuous GPS measurements in Iceland. J. Geophys. Res., 111, B09407, doi:10.1029/2005JB003717.
Guðmundsson, Á., S. Brynjólfsson (1993). Overlapping rift zone segments and the evolution of the South Iceland Seismic Zone. Geophys. Res. Lett., 20, 1903–1906.
Guðmundsson, G. B., K. S. Vogfjörð, B. S. Þorbjarnardóttir (2003). SIL data status report. http://hraun.vedur.is/ja/prepared/reports/sdsr.pdf
Gudmundsson, Ó., Brandsdóttir, B., Menke, W. and Sigvaldason, E. (1994). The crustal magma chamber of the Katla volcano in south Iceland revealed by 2-D seismic undershooting, Geophys. J. Int., 119, 277–296.
Hooper, A. (2008). A multi-temporal InSAR method incorporating both persistent scatterer and small baseline approaches. Geophys. Res. Lett., 35, L16302, doi: 10.1029/2008GL034654.
28
Iio, Y. (1996). Depth-dependent change in the focal mechanism of shallow earthquakes: Implications for brittle-plastic transition in a seismogenic region, J. Geophys. Res., 101, 11209–11216.
Ito, K. (1990). Regional variations of the cutoff depth of seismicity in the crust and their relation to heat flow and large inland-earthquakes, J. Phys. Earth., 38, 223–250.
Jakobsdóttir, S. S., G. B. Guðmundsson and R. S. Stefánsson (2002). Seismicity in Iceland 1991–2000 monitored by the SIL seismic system. Jökull, 51, 87–94.
Jakobsdóttir, S. S., M. J. Roberts, G. B. Guðmundsson, H. Geirsson and R. Slunga (2008). Earthquake swarms at Upptyppingar, north-east Iceland: A sign of magma intrusion? Stud. Geophys. Geod., 52, 513–528.
Jónsdóttir, K., A. Tryggvason, R. Roberts, B. Lund, H. Soosalu, and R. Böðvarsson (2007). Habits of a glacier-covered volcano: seismicity patterns and velocity structure of Katla volcano, Iceland. Annals of Glaciology, 45, 169–177.
Jónsson, J. (1985). Þáttur um jarðfræði Eyjafjalla. Notes on the Geology of the Eyjafjöll, southern Iceland (In Icelandic, summary in English). Náttúrufræðingurinn, 55(1),1–8.
Jónsson, J. (1988). Geological Map Eyjafjöll. Research Institute Neðri Ás, Hveragerði. Larsen, G. (2000). Holocene eruptions within the Katla volcanic system, south Iceland:
Characteristics and environmental impact. Jökull, 49, 1–28. Lay, T., and T. C. Wallace, 1995. Modern Global Seismology, Academic Press. McNutt, S. R. (2005). Volcanic Seismology. Annu. Rev. Earth Planet. Sci., 32, 15.1–
15.31. doi: 10.1146/annurev.earth.33.092203.122459. Meissner, R. and J. Strehlau (1982). Limits of stresses in continental crusts and their
relation to the depth-frequency distribution of shallow earthquakes, Tectonics, 1, 73–89.
Pedersen, R., F. Sigmundsson (2004). InSAR based sill model links spatially offset areas of deformation and seismicity for the 1994 unrest episode at Eyjafjallajökull volcano, Iceland. Geophys. Res. Lett. 31: L14610, doi:10.1029/2004GL020368.
Pedersen, R., F. Sigmundsson (2006). Temporal development of the 1999 intrusive episode in the Eyjafjallajökull volcano, Iceland, derived from InSAR images. Bull. Volcanol. 68: 377–393. Doi:10.1007/s00445-005-0020-y.
Rögnvaldsson, S. Th. and R. Slunga (1993). Routine fault plane solutions for local networks: a test with synthetic data. Bull. Seism. Soc. Am., 83, 4, 1232–1247.
Rögnvaldsson, S. Th. and R. Slunga (1994). Single and joint fault plane solutions for microearthquakes in South Iceland. Tectonophysics, 237, 73–86.
Scholz, C. H. (1988). The brittle-plastic transition and depth of seismic faulting, Geol. Rundsch., 77, 319–328.
Scholz, C. H. (2002). The Mechanics of Earthquakes and Faulting, 2nd ed., Cambridge Univ., Cambridge.
Sibson, R. H. (1984). Roughness at the Base of the Seismogenic Zone: Contributing Factors.J. Geophys. Res., 89, B7, 5791–5799.
Sigmundsson, F., P. Einarsson, R. Bilham, and E. Sturkell (1995). Rift-transform kinematics in south Iceland: Deformation from Global Positioning System measurements, 1986–1992. J. Geophys. Res., 100, 6235–6248.
Slunga, R., S. T. Rögnvaldsson and R. Bödvarsson (1995). Absolute and relative locations of similar events with application to microearthquakes in southern Iceland. Geophys. J. Int., 123, 409–419.
Stefánsson R., R. Böðvarsson, R. Slunga, P. Einarsson, S. Jakobsdóttir, H. Bungum, S. Gregersen, J. Havskov, J. Hjelme, H. Korhonen (1993). Earthquake prediction research in the south Iceland seismic zone and the SIL project. Bull. Seism. Soc. Am., 83, no. 3, 696–716.
29
Strehlau, J. (1986). A discussion of the depth extent of rupture in large continental earthquakes, in Earthquake Source Mechanics, Monogr. Ser., vol. 37, edited by S. Das, J. Boatwright and C. H. Scholz, pp. 131–145, AGU, Washington D. C.
Sturkell, E., F. Sigmundsson, and P. Einarsson (2003). Recent unrest and magma movements at Eyjafjallajökull and Katla volcanoes, Iceland. J. Geophys. Res. 108:2, doi: 2310.1029/2001JB000917.
Sæmundsson, K. (1979). Outline of the geology of Iceland. Jökull 29, 7–28. Vogfjörð, K. S., G. Nolet, W. J. Morgan, R. M. Allen, R. Slunga, B. H. Bergsson, P.
Erlendsson, G. Foulger, S. Jakobsdóttir, B. Julian, M. Pritchard, S. Ragnarsson (2002). Crustal profiling in Iceland using earthquakes source arrays, AGU Fall meeting, Abstract S61C-1161, San Francisco, California, 6–10 December, 2002.
Vogfjörð, K. S., S. Hjaltadóttir (2007). Kortlagning skjálftavirkni við Hverahlíð á Hellisheiði í febrúar 2006. Unnið fyrir Orkuveitu Reykjavíkur. Icelandic Meteorological Office. Report 07010 (in Icelandic).
Wessel, P. and W. H. F. Smith (1998). New, improved version of Generic Mapping Tools released. EOS, Trans. AGU 79, 579.
Wiemer, S. (2001). A software package to analyse seismicity: ZMAP. Seismol. Res. Lett., 72, 373–382.
30
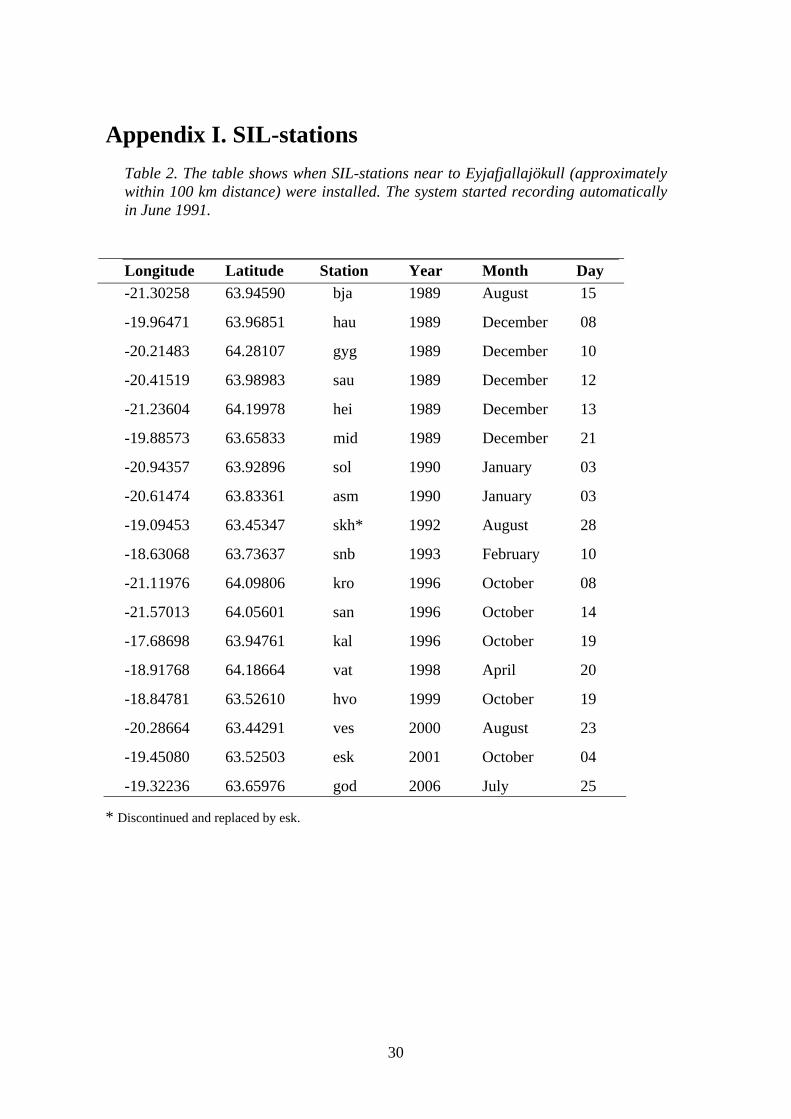
Appendix I. SIL-stations Table 2. The table shows when SIL-stations near to Eyjafjallajökull (approximately within 100 km distance) were installed. The system started recording automatically in June 1991.
Longitude Latitude Station Year Month Day -21.30258 63.94590 bja 1989 August 15
-19.96471 63.96851 hau 1989 December 08
-20.21483 64.28107 gyg 1989 December 10
-20.41519 63.98983 sau 1989 December 12
-21.23604 64.19978 hei 1989 December 13
-19.88573 63.65833 mid 1989 December 21
-20.94357 63.92896 sol 1990 January 03
-20.61474 63.83361 asm 1990 January 03
-19.09453 63.45347 skh* 1992 August 28
-18.63068 63.73637 snb 1993 February 10
-21.11976 64.09806 kro 1996 October 08
-21.57013 64.05601 san 1996 October 14
-17.68698 63.94761 kal 1996 October 19
-18.91768 64.18664 vat 1998 April 20
-18.84781 63.52610 hvo 1999 October 19
-20.28664 63.44291 ves 2000 August 23
-19.45080 63.52503 esk 2001 October 04
-19.32236 63.65976 god 2006 July 25
* Discontinued and replaced by esk.
31
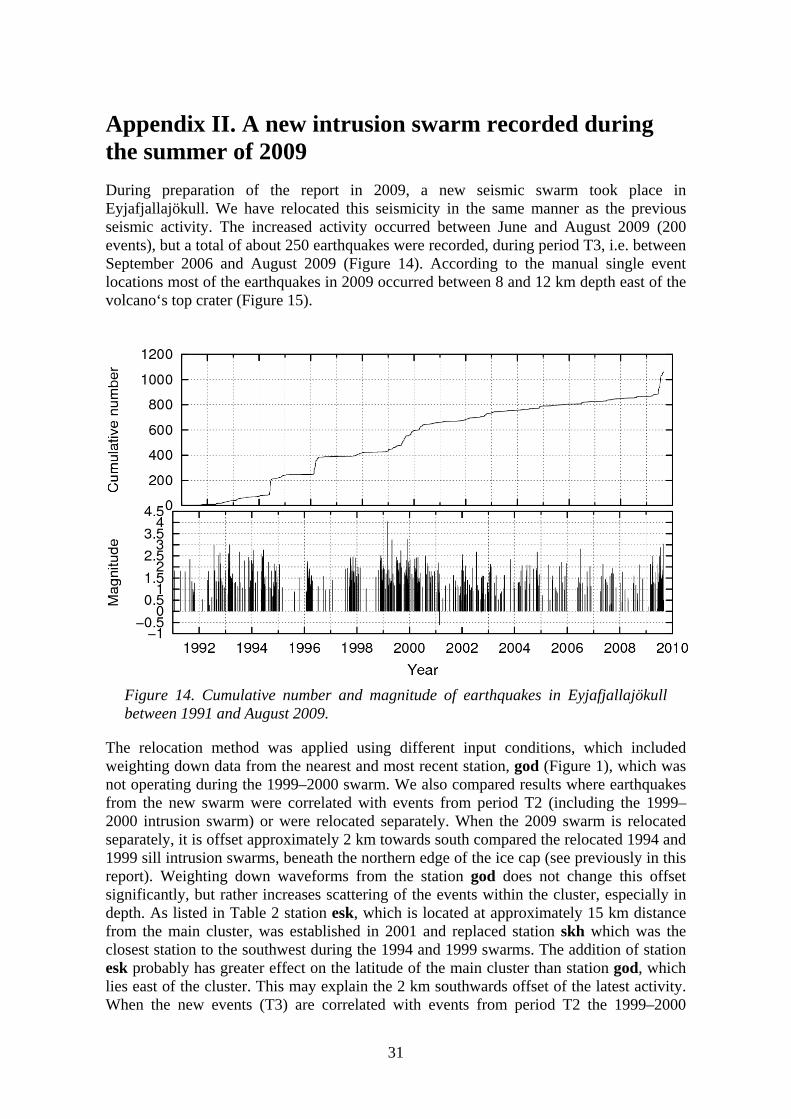
Appendix II. A new intrusion swarm recorded during the summer of 2009 During preparation of the report in 2009, a new seismic swarm took place in Eyjafjallajökull. We have relocated this seismicity in the same manner as the previous seismic activity. The increased activity occurred between June and August 2009 (200 events), but a total of about 250 earthquakes were recorded, during period T3, i.e. between September 2006 and August 2009 (Figure 14). According to the manual single event locations most of the earthquakes in 2009 occurred between 8 and 12 km depth east of the volcano‘s top crater (Figure 15).
Figure 14. Cumulative number and magnitude of earthquakes in Eyjafjallajökull between 1991 and August 2009.
The relocation method was applied using different input conditions, which included weighting down data from the nearest and most recent station, god (Figure 1), which was not operating during the 1999–2000 swarm. We also compared results where earthquakes from the new swarm were correlated with events from period T2 (including the 1999–2000 intrusion swarm) or were relocated separately. When the 2009 swarm is relocated separately, it is offset approximately 2 km towards south compared the relocated 1994 and 1999 sill intrusion swarms, beneath the northern edge of the ice cap (see previously in this report). Weighting down waveforms from the station god does not change this offset significantly, but rather increases scattering of the events within the cluster, especially in depth. As listed in Table 2 station esk, which is located at approximately 15 km distance from the main cluster, was established in 2001 and replaced station skh which was the closest station to the southwest during the 1994 and 1999 swarms. The addition of station esk probably has greater effect on the latitude of the main cluster than station god, which lies east of the cluster. This may explain the 2 km southwards offset of the latest activity. When the new events (T3) are correlated with events from period T2 the 1999–2000
32
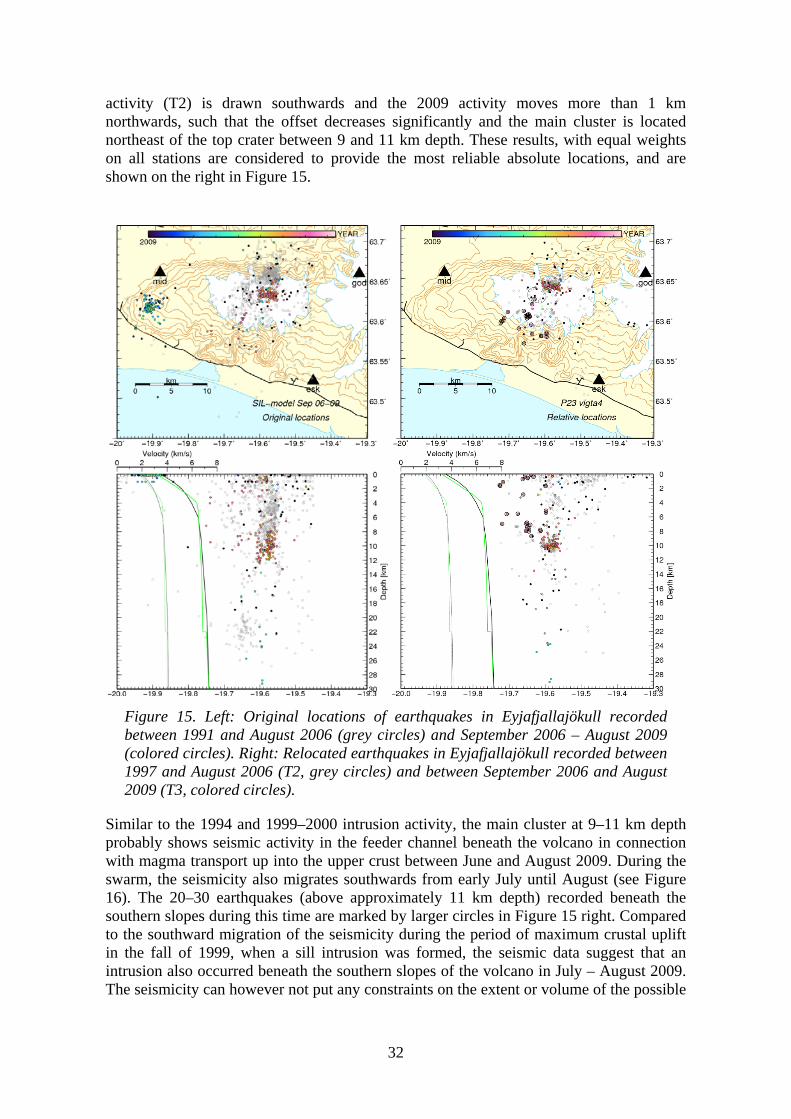
activity (T2) is drawn southwards and the 2009 activity moves more than 1 km northwards, such that the offset decreases significantly and the main cluster is located northeast of the top crater between 9 and 11 km depth. These results, with equal weights on all stations are considered to provide the most reliable absolute locations, and are shown on the right in Figure 15.
Figure 15. Left: Original locations of earthquakes in Eyjafjallajökull recorded between 1991 and August 2006 (grey circles) and September 2006 – August 2009 (colored circles). Right: Relocated earthquakes in Eyjafjallajökull recorded between 1997 and August 2006 (T2, grey circles) and between September 2006 and August 2009 (T3, colored circles).
Similar to the 1994 and 1999–2000 intrusion activity, the main cluster at 9–11 km depth probably shows seismic activity in the feeder channel beneath the volcano in connection with magma transport up into the upper crust between June and August 2009. During the swarm, the seismicity also migrates southwards from early July until August (see Figure 16). The 20–30 earthquakes (above approximately 11 km depth) recorded beneath the southern slopes during this time are marked by larger circles in Figure 15 right. Compared to the southward migration of the seismicity during the period of maximum crustal uplift in the fall of 1999, when a sill intrusion was formed, the seismic data suggest that an intrusion also occurred beneath the southern slopes of the volcano in July – August 2009. The seismicity can however not put any constraints on the extent or volume of the possible

33
intrusion, but compared to the seismic activity in the previous intrusions, the 2009 activity suggests a smaller sill intrusion.
IMO’s continuous GPS observations at Þorvaldseyri (THEY located a few kilometres south of the ice cap) showed southward movement of the station between 15 May and 25 August (Halldór Geirsson, 2009, personal communication), which also supports the hypothesis that magma was transported into the upper crust beneath Eyjafjallajökull. However, INSAR images have so far shown little or no uplift signal during this period (Freysteinn Sigmundsson, 2009, personal communication), which supports the indications from the seismicity, that the volume of magma transported into the upper crust event is significantly smaller than during the two previous sill intrusion events.
Figure 16. Latitude of earthquakes beneath Eyjafjallajökull in 2009.