Embed Size (px)
Citation preview
ORIGINAL RESEARCH
Seismic response of multi-story structure with multiple tunedmass friction dampers
Alka Y. Pisal
Received: 2 July 2013 / Accepted: 27 January 2014 / Published online: 4 January 2015
� The Author(s) 2015. This article is published with open access at Springerlink.com
Abstract The effectiveness of passive multiple-tuned mass
friction dampers (P-MTMFDs) over a single passive-tuned
mass friction damper (P-TMFD) is investigated. The gov-
erning differential equations of motion are solved numeri-
cally using state-space method. The response of a five-story
structure is investigated for four considered earthquake
ground motions. The number of P-TMFD units of
P-MTMFDs is varied and the response of five-story structure
with single P-TMFD is compared with the response of the
same structure with P-MTMFDs. A parametric study is also
conducted to investigate the effects of important parameters
like number of P-TMFD units in P-MTMFDs, frequency
spacing, mass ratio, tuning ratio and damper slip force. It is
found that at a given level of excitation; an optimum value of
considered important parameters exists at which the peak
displacement of structure attains its minimum value. The
response time history of the structure with single P-TMFD
and P-MTMFDs, with respect to their optimum parameters is
compared. It is found that the P-MTMFDs are more effective
in controlling the response of the structure to which it is
attached in compare to the single P-TMFD having same mass.
Keywords P-TMFD � P-MTMFDs � Seismic excitation �Mass ratio � Tuning ratio � Frequency spacing and slip force
Introduction
Tuned mass damper (TMD) is the most popular and
extensively used device to control vibration in civil and
mechanical engineering applications ranging from small
rotating machinery to tall civil engineering structures.
Similar to TMD, friction dampers (FD) were also found to
be very efficient, not only for rehabilitation and strength-
ening of existing structures, but also for the design of
structures to resist excessive vibrations (Colajanni and
Papia 1995; Qu et al. 2001; Mualla and Belev 2002; Pas-
quin et al. 2004). In the past, some researchers had pro-
posed the use of FD along with TMD. Ricciardelli and
Vickery (1999) considered a single degree of freedom
(SDOF) system to which a TMD with linear stiffness and
dry friction damping was attached. The system was ana-
lyzed for harmonic excitation and design criteria for fric-
tion TMD system were proposed. Lee et al. (2005)
performed a feasibility study of tunable FD and it was
shown that proper sizing of the mass and the fulfillment of
the damper criteria allows the designer to use benefit of FD
and TMD. Gewei and Basu (2010) analyzed dynamic
characteristics of SDOF system with STMFD, using har-
monic and static linearization solution. The study indicated
that the STMFD has benefits of both FD as well as TMD, if
designed appropriately.
The main disadvantage of a STMFD is its sensitivity of
the effectiveness to the error in the natural frequency of the
structure. If the design parameters of the TMD are selected
wrongly, it may accelerate the vibration of the system
instead of attenuating it. To overcome this difficulty, many
researchers had proposed the use multiple tuned mass
damper (MTMD) with different dynamic characteristics
(Xu and Igusa 1992; Joshi and Jangid 1997). It was shown
that MTMD is more effective than STMD. Similar to the
TMD the STMFD have the same disadvantage that it also
performs effectively only in a narrow frequency range.
However, the limitation of narrow frequency range can be
improved by using MTFMD in place of STMFD. Thus, in this
A. Y. Pisal (&)
Civil Engineering Department, College of Engineering,
Pune 411005, India
e-mail: [email protected]
123
Int J Adv Struct Eng (2015) 7:81–92
DOI 10.1007/s40091-014-0079-9
study the effectiveness of MTMFD over an STMFD for
reduction of response of multi-story structure is studied. The
specific objectives of the study are summarized as to (1)
formulate the equations of motion and develop solution
procedure for the response of multi degree of freedom
(MDOF) system with MTMFD, under seismic excitations,
numerically; (2) investigate the influence of important
parameters like number of dampers in MTMFD, mass ratio,
tuning ratio, frequency spacing and damper slip force on the
performance of the MTMFD; (3) obtain optimum values of
influencing parameters for different mass ratios of the
MTMFD, which may find application in the effective design
of MTMFD; and (4) to compare the response of MDOF
system attached with MTMFD to the response of same sys-
tem attached with STMFD having same total mass.
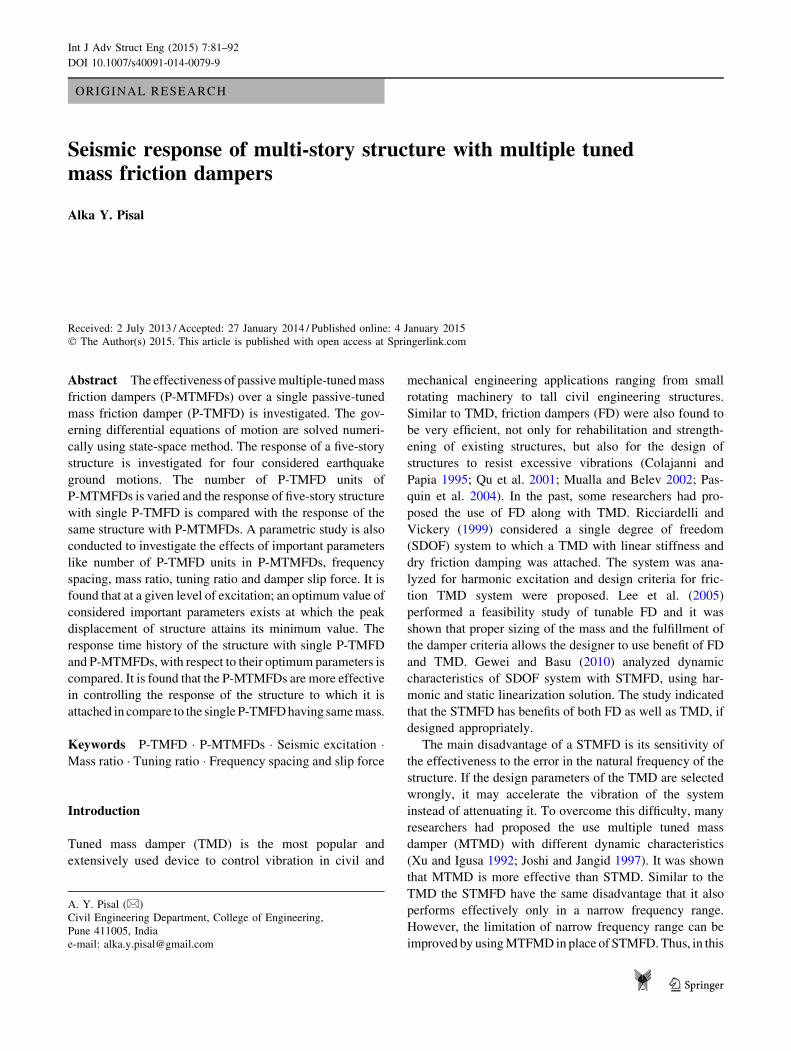
Modeling of MDOF system with MTMFD
The system configuration considered for the study consists of
a primary system of five story structure attached with
MTMFD with different dynamic characteristics as shown in
Fig. 1. For this study the following assumptions are made:
1. The structural system of the primary system, i.e., mass
and stiffness of each floor are same. Also, the damping
ratio for each mode of vibration is assumed to be
constant.
2. Stiffness of each TMFD unit is same.
3. Normalized slip force value of each TMFD unit is kept
same.
4. The mass of each TMFD unit is varying. By varying
the mass, the natural frequency of each TMFD unit is
adjusted to the required value.
5. The natural frequencies of the MTMFD are uniformly
distributed around their average natural frequency. It is to
be noted that MTMFD with indistinguishable dynamic
characteristics are equivalent to an STMFD in which the
natural frequency of the individual MTMFD unit is same
as that of the equivalent STMFD.
Let xT be the average frequency of all MTMFD and can
be expressed as
xT ¼Xr
j¼1
xj
r; ð1Þ
where r is the total number of MTMFD, and xj is the
natural frequency of the jth TMFD is expressed as
xj ¼ xT 1þ j� r þ 1
2
� �� �b
r � 1; ð2Þ
where b is the non-dimensional frequency spacing of the
MTMFD, given as
b ¼ xr � x1
xT
: ð3Þ
If kd is the constant stiffness of each TMFD, then the
mass of the jth TMFD is expressed as
md j ¼kd
x2j
: ð4Þ
The ratio of the total MTMFD mass to the total mass of
the main structure is defined as the mass ratio and is
expressed as
l ¼Pr
j¼1 md j
ms
; ð5Þ
where ms denotes the total mass of the primary structure.
The ratio of average frequency of the MTMFD to the
fundamental frequency of main structure is defined as
tuning ratio, expressed as
f ¼ xT
xs
: ð6Þ
It is to be noted that as the stiffness and normalized
damper force of all the TMFD are constant and only mass
is varying, the friction force adds up. Thus, the non-
dimensional frequency spacing b, controls the distribution
of the frequency of the TMFD units.
.....1dm jdm rdm
1dx jdx rdx
1TdK1sf
2TdK TdrK2sf srf
1k
2k
3k
4k
5k
5x
4x
3x
2x
1x1m
2m
3m
4m
5m
Fig. 1 Five-story structure with MTMFD
82 Int J Adv Struct Eng (2015) 7:81–92
123
Governing equations of motion and solution procedure
Let the mass and stiffness of the ith floor of the primary
structure is characterized by mi and ki, respectively, as
shown in Fig. 1. The primary system and each TMFD
unit is modeled as SDOF system so that the total degrees
of freedom of the combined system configuration con-
sidered for the study becomes r þ 5. The governing
equations of motion of MDOF system with MTMFD
when subjected to earthquake excitations are expressed
as
M €X þ C _X þ K X ¼ E €xg þ B Fs ð7Þ
X ¼ xp
xd
� �; ð8Þ
where xp and xd represents the displacement relative to the
ground vector of floors of primary structure and TMFD
units of MTMFD, respectively; M, C and K denotes the
mass, damping and stiffness matrix of the configured sys-
tem, considered for the study; the matrix E and B are
placement matrix for the excitation force and friction force,
respectively; X, _X and €X are the relative displacement,
velocity and acceleration vector of configured system,
respectively; €xg denotes the ground acceleration; and Fs
denotes the vector of friction force provided by the TMFD.
These matrices are expressed as
M ¼ Mp 0
0 Md
� �ð9Þ
MP ¼ diag½m1 ;m2;. . . ; m5� ð10Þ
Md ¼ diag½md1;md2;. . . ; md r� ð11Þ
K ¼
Kp þPr
j¼1
Kd r �Kd1 �Kd2 �Kd3 . . . �Kd r
�Kd 1 Kd1 0 0 . . . 0
�Kd2 0 Kd2 0 . . . 0
�Kd3 0 0 Kd3 . . . 0���
���
���
���
���
0
�Kd r 0 0 0 0 Kd r
2
66666666666664
3
77777777777775
ð12Þ
C ¼ Cp 0
0 0
� �; ð13Þ
where KP andCp represent the typical damping and stiff-
ness matrix of dimensions (5 9 5) of primary structure. It
is also to be noted that as the damping matrix of the system
is not known explicitly, it is constructed using the Ray-
leigh’s damping considering proportional to mass and
stiffness of the main structure as:
CP ¼ a0Mp þ a1Kp; ð14Þ
where a0 and a1 are the coefficients which depends on the
damping ratio of two vibration mode. For the considered
primary structure, damping ratio is taken as 2 % for both
the modes of vibration.
Fs ¼Xr
j¼1
Fsj � Fs1 � Fs2. . .� Fsr
( ); ð15Þ
where the friction force of the jth damper is given as
Fsj ¼ fsj sgnð _xd j � _x5Þ; ð16Þ
where _xd j shows the velocity of jth TMFD and _x5 denotes the
velocity of the top story, where MTMFD are attached to the
primary structure. The damper forces are calculated by using
the hysteretic model proposed by Constantinou et al. (1990),
using Wen’s equation (Wen 1976), which is expressed as:
Fsj ¼ fsj Z; ð17Þ
where fsj is the limiting friction force or slip force of the
damper and Z is the non-dimensional hysteretic component
which satisfies the following first order nonlinear differ-
ential equation,
qdZ
dt¼ A ð _x2 � _x1Þ � b ð _x2 � _x1Þj j Z Zj jn�1�s ð _x2
� _x1Þ Zj jn; ð18Þ
where q represents the yield displacement of frictional
force loop and A, b, s and n are non-dimensional param-
eters of the hysteretic loop which control the shape of the
loop. These parameters are selected in such a way that it
provides typical Coulomb-friction damping. The recom-
mended values of these parameters are taken as
q = 0.0001 m, A = 1, b = 0.5, s = 0.05, n = 2 (Bhas-
kararao and Jangid 2006). The hysteretic displacement
component, Z, is bounded by peak values of �1 to account
for the conditions of sliding and non-sliding phases.
The limiting friction force or slip force of the damper,
fsj, can be expressed in the normalized form by Rf as
Rf ¼fsj
Md j : g: ð19Þ
The governing equations of motion are solved using the
state space method numerically, since the force deforma-
tion behavior of MTMFD is nonlinear.
Numerical study
For the numerical study, the five story structure of funda-
mental time period of 0.5 s is considered. The earthquake
time histories along with their peak ground acceleration
(PGA) and components which are used for this study are
Int J Adv Struct Eng (2015) 7:81–92 83
123
represented in Table 1. The displacement and acceleration
response spectra of the above-mentioned earthquakes are
shown in Fig. 2 for 2 % critical damping. The maximum
ordinate of acceleration are 1.225, 3.616, 3.296, 3.614 g,
occurring at the period of 0.46, 0.64, 0.08 and 0.36 s for
Imperial Valley, Loma Prieta, Landers and Kobe earth-
quakes, respectively. The spectra of these ground motion
indicate that these ground motions are recorded on a rocky
site or on a firm soil. The response quantity of interest is
displacement of the top story of the structure. For the
numerical study, the MTMFD are assumed to be attached
to the top story of the structure as shown in Fig. 1.
The mass of each floor is taken as 10,000 kg. The nat-
ural frequencies of the structure are calculated as 2, 5.838,
9.203, 11.822, 13.484 Hz. For the present study the results
are obtained with the interval, Dt = 0.02, 0.01 and 0.005,
respectively. The number of iteration in each time step is
taken as 50–200 to determine the incremental frictional
force of the MTMFD. The important parameters on which
the efficiency of MTMFD depends such as mass ratio,
tuning ratio, frequency spacing, damper slip force, number
of TMFD units in MTMFD are discussed here. To inves-
tigate the effectiveness of the MTMFD over an STMFD,
the response of the system with MTMFD is compared with
the response of uncontrolled and controlled system with
STMFD, respectively.
Effect of mass ratio
The effect of mass ratio on the performance of the
MTMFD is studied in Fig. 3 by plotting the peak dis-
placement of the top story against the mass ratio for dif-
ferent number of TMFD units. The mass ratio is varied
from 0.01 to 0.1 which shows the total mass of MTMFD is
varying from 1 to 10 % of the total mass of the main
structure. It is observed that the response of the structure
decreases with the increase in mass ratio. In general, a
higher mass ratio is beneficial for vibration control but due
to practical limitations, the acceptable value of mass ratio
is 10–15 % only. It is also observed that the value of
response reduction with respect to mass ratio varies with
the number of TMFD unit in MTMFD. Thus, the higher
mass ratio is beneficial for more response reduction of a
structure using MTMFD.
0 1 2 3 40.00
0.05
0.10
0.15
0.20
0 1 2 3 40
1
2
3
4
Dis
plac
emen
t (m
) Imperial Valley, 1940 Loma Prieta, 1989 Landers, 1992 Kobe, 1995
Acc
eler
atio
n (g
)
Time (Sec)
Fig. 2 Displacement and acceleration spectra of four earthquakes
considered for the study
0.02 0.04 0.06 0.08 0.100.05
0.10
0.15
0.20
Peak
Dis
plac
emen
t,x 5
(m)
Mass Ratio ( )
r = 1 r = 5 r = 11
Fig. 3 Variation of peak displacement of top story with mass ratio
Table 1 Details of earthquakes considered for numerical study
Recording station Component Duration (s) PGA (g)
Imperial valley (19th May 1940) El Centro Array # 9 I—ELC 180 40 0.313
Loma Prieta (18th October 1989) UCSC 16 LOS Gatos Presentation Centre (LGPC) LGP 000 25 0.96
Landers 28th June 1992 Lucerne valley LCN 275 48.125 0.721
Kobe 16th January 1995 Japan Meteorological Agency (JMA) 99999 KJMA KJM 000 48 0.82
84 Int J Adv Struct Eng (2015) 7:81–92
123
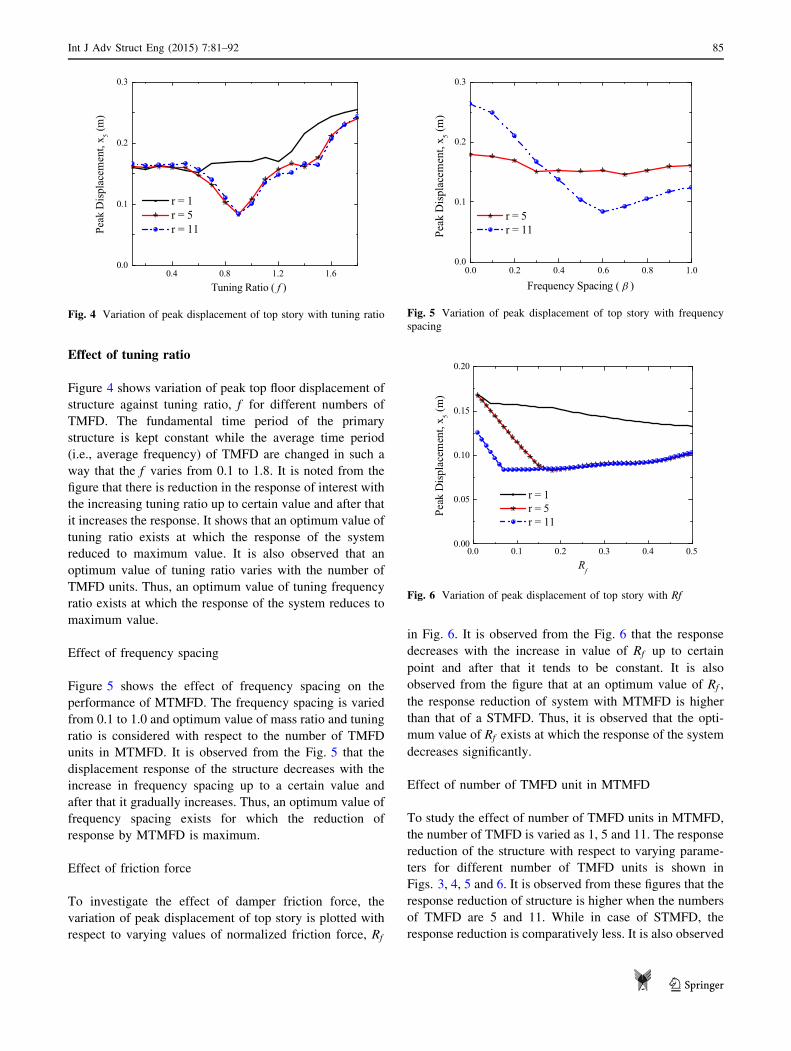
Effect of tuning ratio
Figure 4 shows variation of peak top floor displacement of
structure against tuning ratio, f for different numbers of
TMFD. The fundamental time period of the primary
structure is kept constant while the average time period
(i.e., average frequency) of TMFD are changed in such a
way that the f varies from 0.1 to 1.8. It is noted from the
figure that there is reduction in the response of interest with
the increasing tuning ratio up to certain value and after that
it increases the response. It shows that an optimum value of
tuning ratio exists at which the response of the system
reduced to maximum value. It is also observed that an
optimum value of tuning ratio varies with the number of
TMFD units. Thus, an optimum value of tuning frequency
ratio exists at which the response of the system reduces to
maximum value.
Effect of frequency spacing
Figure 5 shows the effect of frequency spacing on the
performance of MTMFD. The frequency spacing is varied
from 0.1 to 1.0 and optimum value of mass ratio and tuning
ratio is considered with respect to the number of TMFD
units in MTMFD. It is observed from the Fig. 5 that the
displacement response of the structure decreases with the
increase in frequency spacing up to a certain value and
after that it gradually increases. Thus, an optimum value of
frequency spacing exists for which the reduction of
response by MTMFD is maximum.
Effect of friction force
To investigate the effect of damper friction force, the
variation of peak displacement of top story is plotted with
respect to varying values of normalized friction force, Rf
in Fig. 6. It is observed from the Fig. 6 that the response
decreases with the increase in value of Rf up to certain
point and after that it tends to be constant. It is also
observed from the figure that at an optimum value of Rf ,
the response reduction of system with MTMFD is higher
than that of a STMFD. Thus, it is observed that the opti-
mum value of Rf exists at which the response of the system
decreases significantly.
Effect of number of TMFD unit in MTMFD
To study the effect of number of TMFD units in MTMFD,
the number of TMFD is varied as 1, 5 and 11. The response
reduction of the structure with respect to varying parame-
ters for different number of TMFD units is shown in
Figs. 3, 4, 5 and 6. It is observed from these figures that the
response reduction of structure is higher when the numbers
of TMFD are 5 and 11. While in case of STMFD, the
response reduction is comparatively less. It is also observed
0.0 0.2 0.4 0.6 0.8 1.00.0
0.1
0.2
0.3
Peak
Dis
plac
emen
t,x 5
(m)
Frequency Spacing ( )
r = 5 r = 11
Fig. 5 Variation of peak displacement of top story with frequency
spacing
0.0 0.1 0.2 0.3 0.4 0.50.00
0.05
0.10
0.15
0.20
Peak
Dis
plac
emen
t,x 5
(m)
Rf
r = 1 r = 5 r = 11
Fig. 6 Variation of peak displacement of top story with Rf
0.4 0.8 1.2 1.60.0
0.1
0.2
0.3
Peak
Dis
plac
emen
t,x 5
(m)
Tuning Ratio ( f )
r = 1 r = 5 r = 11
Fig. 4 Variation of peak displacement of top story with tuning ratio
Int J Adv Struct Eng (2015) 7:81–92 85
123
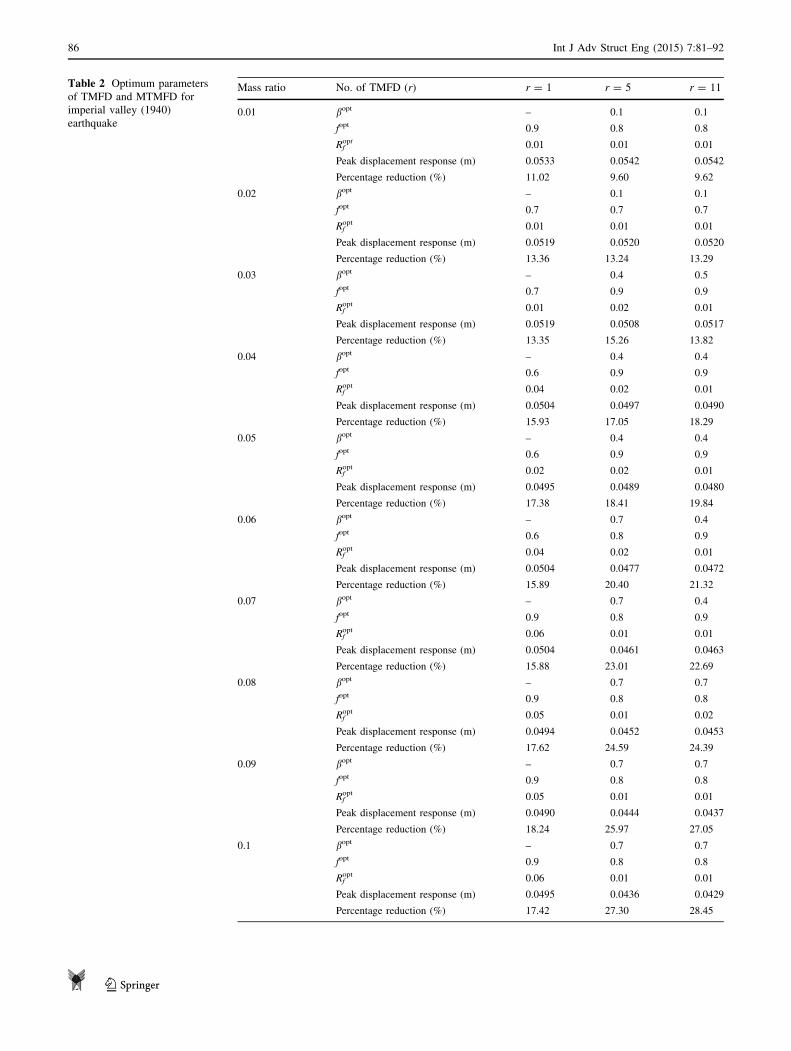
Table 2 Optimum parameters
of TMFD and MTMFD for
imperial valley (1940)
earthquake
Mass ratio No. of TMFD (r) r = 1 r = 5 r = 11
0.01 bopt – 0.1 0.1
fopt 0.9 0.8 0.8
Rfopt 0.01 0.01 0.01
Peak displacement response (m) 0.0533 0.0542 0.0542
Percentage reduction (%) 11.02 9.60 9.62
0.02 bopt – 0.1 0.1
fopt 0.7 0.7 0.7
Rfopt 0.01 0.01 0.01
Peak displacement response (m) 0.0519 0.0520 0.0520
Percentage reduction (%) 13.36 13.24 13.29
0.03 bopt – 0.4 0.5
fopt 0.7 0.9 0.9
Rfopt 0.01 0.02 0.01
Peak displacement response (m) 0.0519 0.0508 0.0517
Percentage reduction (%) 13.35 15.26 13.82
0.04 bopt – 0.4 0.4
fopt 0.6 0.9 0.9
Rfopt 0.04 0.02 0.01
Peak displacement response (m) 0.0504 0.0497 0.0490
Percentage reduction (%) 15.93 17.05 18.29
0.05 bopt – 0.4 0.4
fopt 0.6 0.9 0.9
Rfopt 0.02 0.02 0.01
Peak displacement response (m) 0.0495 0.0489 0.0480
Percentage reduction (%) 17.38 18.41 19.84
0.06 bopt – 0.7 0.4
fopt 0.6 0.8 0.9
Rfopt 0.04 0.02 0.01
Peak displacement response (m) 0.0504 0.0477 0.0472
Percentage reduction (%) 15.89 20.40 21.32
0.07 bopt – 0.7 0.4
fopt 0.9 0.8 0.9
Rfopt 0.06 0.01 0.01
Peak displacement response (m) 0.0504 0.0461 0.0463
Percentage reduction (%) 15.88 23.01 22.69
0.08 bopt – 0.7 0.7
fopt 0.9 0.8 0.8
Rfopt 0.05 0.01 0.02
Peak displacement response (m) 0.0494 0.0452 0.0453
Percentage reduction (%) 17.62 24.59 24.39
0.09 bopt – 0.7 0.7
fopt 0.9 0.8 0.8
Rfopt 0.05 0.01 0.01
Peak displacement response (m) 0.0490 0.0444 0.0437
Percentage reduction (%) 18.24 25.97 27.05
0.1 bopt – 0.7 0.7
fopt 0.9 0.8 0.8
Rfopt 0.06 0.01 0.01
Peak displacement response (m) 0.0495 0.0436 0.0429
Percentage reduction (%) 17.42 27.30 28.45
86 Int J Adv Struct Eng (2015) 7:81–92
123
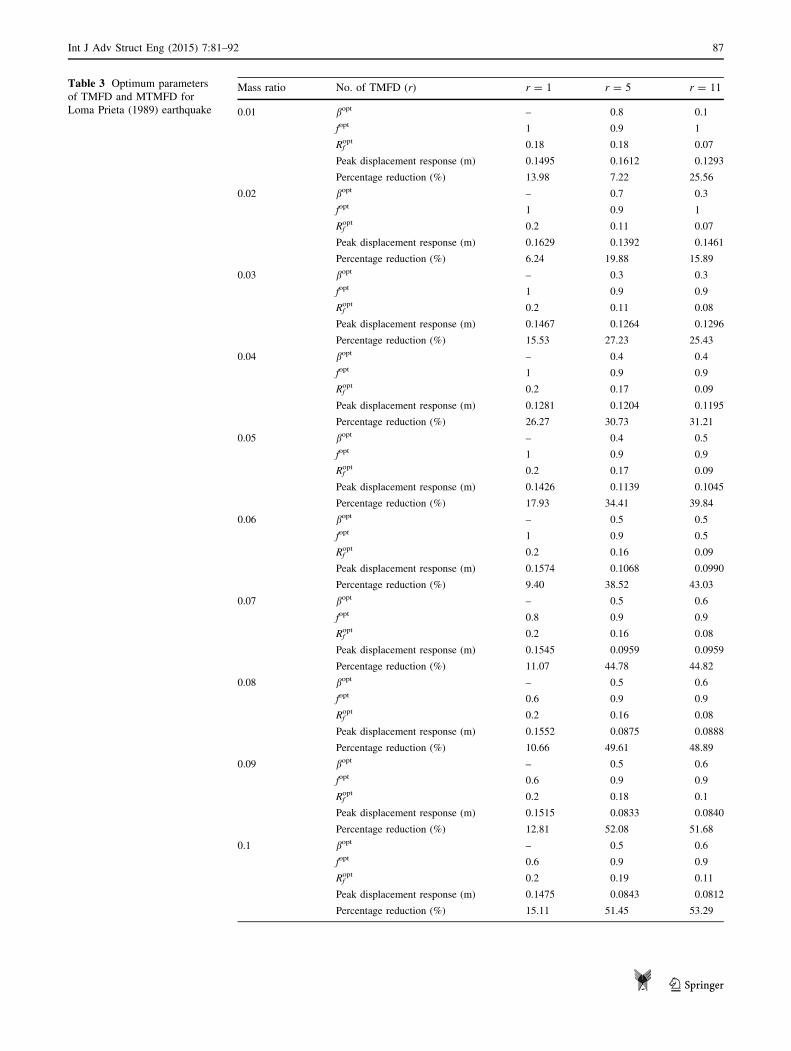
Table 3 Optimum parameters
of TMFD and MTMFD for
Loma Prieta (1989) earthquake
Mass ratio No. of TMFD (r) r = 1 r = 5 r = 11
0.01 bopt – 0.8 0.1
fopt 1 0.9 1
Rfopt 0.18 0.18 0.07
Peak displacement response (m) 0.1495 0.1612 0.1293
Percentage reduction (%) 13.98 7.22 25.56
0.02 bopt – 0.7 0.3
fopt 1 0.9 1
Rfopt 0.2 0.11 0.07
Peak displacement response (m) 0.1629 0.1392 0.1461
Percentage reduction (%) 6.24 19.88 15.89
0.03 bopt – 0.3 0.3
fopt 1 0.9 0.9
Rfopt 0.2 0.11 0.08
Peak displacement response (m) 0.1467 0.1264 0.1296
Percentage reduction (%) 15.53 27.23 25.43
0.04 bopt – 0.4 0.4
fopt 1 0.9 0.9
Rfopt 0.2 0.17 0.09
Peak displacement response (m) 0.1281 0.1204 0.1195
Percentage reduction (%) 26.27 30.73 31.21
0.05 bopt – 0.4 0.5
fopt 1 0.9 0.9
Rfopt 0.2 0.17 0.09
Peak displacement response (m) 0.1426 0.1139 0.1045
Percentage reduction (%) 17.93 34.41 39.84
0.06 bopt – 0.5 0.5
fopt 1 0.9 0.5
Rfopt 0.2 0.16 0.09
Peak displacement response (m) 0.1574 0.1068 0.0990
Percentage reduction (%) 9.40 38.52 43.03
0.07 bopt – 0.5 0.6
fopt 0.8 0.9 0.9
Rfopt 0.2 0.16 0.08
Peak displacement response (m) 0.1545 0.0959 0.0959
Percentage reduction (%) 11.07 44.78 44.82
0.08 bopt – 0.5 0.6
fopt 0.6 0.9 0.9
Rfopt 0.2 0.16 0.08
Peak displacement response (m) 0.1552 0.0875 0.0888
Percentage reduction (%) 10.66 49.61 48.89
0.09 bopt – 0.5 0.6
fopt 0.6 0.9 0.9
Rfopt 0.2 0.18 0.1
Peak displacement response (m) 0.1515 0.0833 0.0840
Percentage reduction (%) 12.81 52.08 51.68
0.1 bopt – 0.5 0.6
fopt 0.6 0.9 0.9
Rfopt 0.2 0.19 0.11
Peak displacement response (m) 0.1475 0.0843 0.0812
Percentage reduction (%) 15.11 51.45 53.29
Int J Adv Struct Eng (2015) 7:81–92 87
123

Table 4 Optimum parameters
of TMFD and MTMFD for
Landers (1992) earthquake
Mass ratio No. of TMFD (r) r = 1 r = 5 r = 11
0.01 bopt – 0.2 0.2
fopt 1 0.9 0.9
Rfopt 0.06 0.01 0.01
Peak displacement response (m) 0.0391 0.0386 0.0396
Percentage reduction (%) 27.94 28.97 27.14
0.02 bopt – 0.1 0.5
fopt 1 0.9 0.8
Rfopt 0.08 0.01 0.01
Peak displacement response (m) 0.0393 0.0400 0.0398
Percentage reduction (%) 27.59 26.32 26.69
0.03 bopt – 0.9 0.8
fopt 1 0.8 0.7
Rfopt 0.08 0.02 0.01
Peak displacement response (m) 0.0417 0.0397 0.0408
Percentage reduction (%) 23.15 26.87 24.82
0.04 bopt – 0.8 0.8
fopt 1 0.7 0.7
Rfopt 0.09 0.01 0.01
Peak displacement response (m) 0.0439 0.0391 0.0392
Percentage reduction (%) 19.12 28.06 27.73
0.05 bopt – 0.8 0.8
fopt 0.6 0.7 0.7
Rfopt 0.03 0.01 0.01
Peak displacement response (m) 0.0423 0.0404 0.0396
Percentage reduction (%) 22.10 25.56 27.09
0.06 bopt – 0.8 0.2
fopt 0.6 0.7 0.6
Rfopt 0.03 0.02 0.01
Peak displacement response (m) 0.0408 0.0394 0.0402
Percentage reduction (%) 24.82 27.42 26.01
0.07 bopt – 0.2 0.2
fopt 0.6 0.6 0.6
Rfopt 0.03 0.01 0.02
Peak displacement response (m) 0.0399 0.0393 0.0396
Percentage reduction (%) 26.58 27.56 27.07
0.08 bopt – 0.2 0.2
fopt 0.6 0.6 0.6
Rfopt 0.02 0.01 0.02
Peak displacement response (m) 0.0394 0.0391 0.0392
Percentage reduction (%) 27.42 27.97 27.71
0.09 bopt – 0.1 0.1
fopt 0.6 0.6 0.6
Rfopt 0.02 0.02 0.02
Peak displacement response (m) 0.0383 0.0387 0.0386
Percentage reduction (%) 29.37 28.66 28.82
0.1 bopt – 0.1 0.1
fopt 0.6 0.6 0.6
Rfopt 0.02 0.02 0.06
Peak displacement response (m) 0.0391 0.0379 0.0376
Percentage reduction (%) 27.93 30.24 30.75
88 Int J Adv Struct Eng (2015) 7:81–92
123
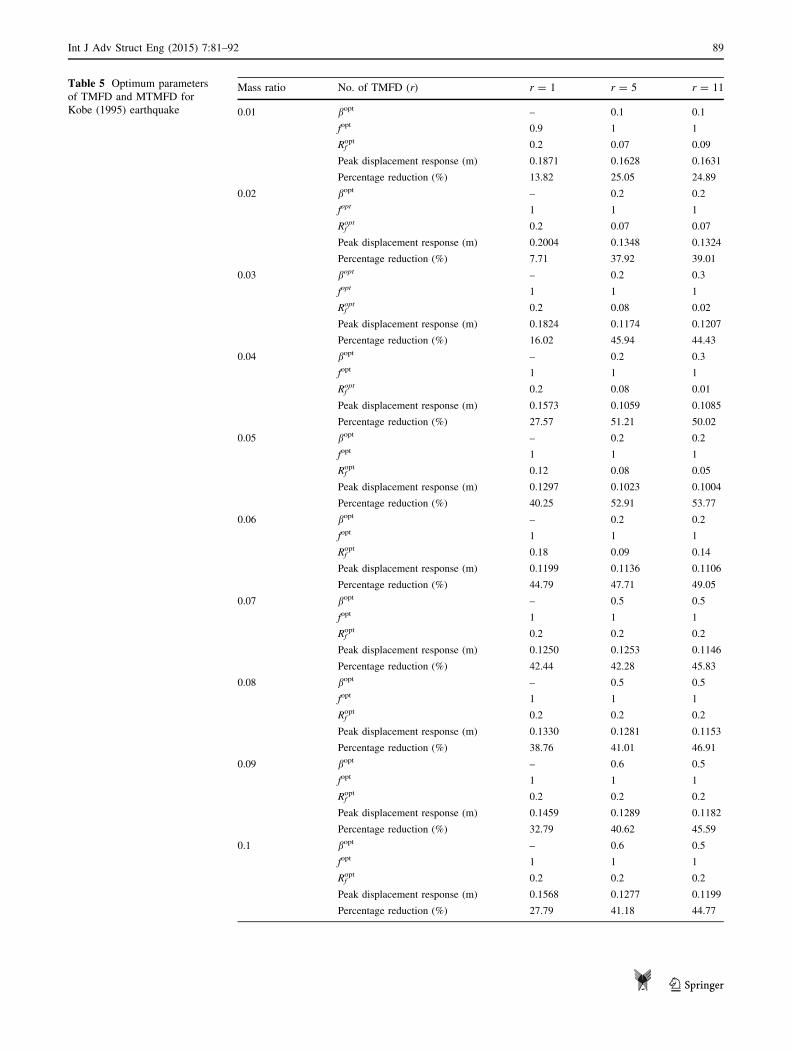
Table 5 Optimum parameters
of TMFD and MTMFD for
Kobe (1995) earthquake
Mass ratio No. of TMFD (r) r = 1 r = 5 r = 11
0.01 bopt – 0.1 0.1
fopt 0.9 1 1
Rfopt 0.2 0.07 0.09
Peak displacement response (m) 0.1871 0.1628 0.1631
Percentage reduction (%) 13.82 25.05 24.89
0.02 bopt – 0.2 0.2
fopt 1 1 1
Rfopt 0.2 0.07 0.07
Peak displacement response (m) 0.2004 0.1348 0.1324
Percentage reduction (%) 7.71 37.92 39.01
0.03 bopt – 0.2 0.3
fopt 1 1 1
Rfopt 0.2 0.08 0.02
Peak displacement response (m) 0.1824 0.1174 0.1207
Percentage reduction (%) 16.02 45.94 44.43
0.04 bopt – 0.2 0.3
fopt 1 1 1
Rfopt 0.2 0.08 0.01
Peak displacement response (m) 0.1573 0.1059 0.1085
Percentage reduction (%) 27.57 51.21 50.02
0.05 bopt – 0.2 0.2
fopt 1 1 1
Rfopt 0.12 0.08 0.05
Peak displacement response (m) 0.1297 0.1023 0.1004
Percentage reduction (%) 40.25 52.91 53.77
0.06 bopt – 0.2 0.2
fopt 1 1 1
Rfopt 0.18 0.09 0.14
Peak displacement response (m) 0.1199 0.1136 0.1106
Percentage reduction (%) 44.79 47.71 49.05
0.07 bopt – 0.5 0.5
fopt 1 1 1
Rfopt 0.2 0.2 0.2
Peak displacement response (m) 0.1250 0.1253 0.1146
Percentage reduction (%) 42.44 42.28 45.83
0.08 bopt – 0.5 0.5
fopt 1 1 1
Rfopt 0.2 0.2 0.2
Peak displacement response (m) 0.1330 0.1281 0.1153
Percentage reduction (%) 38.76 41.01 46.91
0.09 bopt – 0.6 0.5
fopt 1 1 1
Rfopt 0.2 0.2 0.2
Peak displacement response (m) 0.1459 0.1289 0.1182
Percentage reduction (%) 32.79 40.62 45.59
0.1 bopt – 0.6 0.5
fopt 1 1 1
Rfopt 0.2 0.2 0.2
Peak displacement response (m) 0.1568 0.1277 0.1199
Percentage reduction (%) 27.79 41.18 44.77
Int J Adv Struct Eng (2015) 7:81–92 89
123
from these figures that there is similar response reduction
of MTMFD when it consists of 5 and 11 TMFD unit
implying that it will not be economical to increase the
number of TMFD units beyond 5. Thus, after an increase of
number of TMFD unit in an MTMFD the reduction in
response remains almost the same.
Optimum parameters
It is observed from the numerical study that there exists a
range of optimum values of controlling parameters which
influence the performance of MTMFD. Also, the optimum
values of the controlling parameter differ with the number
of TMFD unit in MTMFD. To compare the effectiveness
of MTMFD over the STMFD, the optimum values of
important parameters and percentage response reduction
of peak displacement due to MTMFD having number of
TMFD as 1, 5 and 11 are presented in Tables 2, 3, 4 and 5
for different values of mass ratio for considered four
earthquakes. It is observed from the tables that in general
as the value of number of TMFD units in MTMFD
increases the value of optimum tuning frequency ratio and
frequency spacing increases or tends to constant for higher
number of TMFD units. Similarly, the value of Rf
decreases with the increasing value of TMFD units. It is
also observed from the tables that with the increase in the
value of mass ratio, value of optimum frequency ratio and
frequency spacing decrease while the value of Rf increases.
The optimum values of parameters mentioned in these
tables are used to depict the comparison of top floor dis-
placement time history without TMFD, with STMFD and
with MTMFD having same total mass, respectively, in
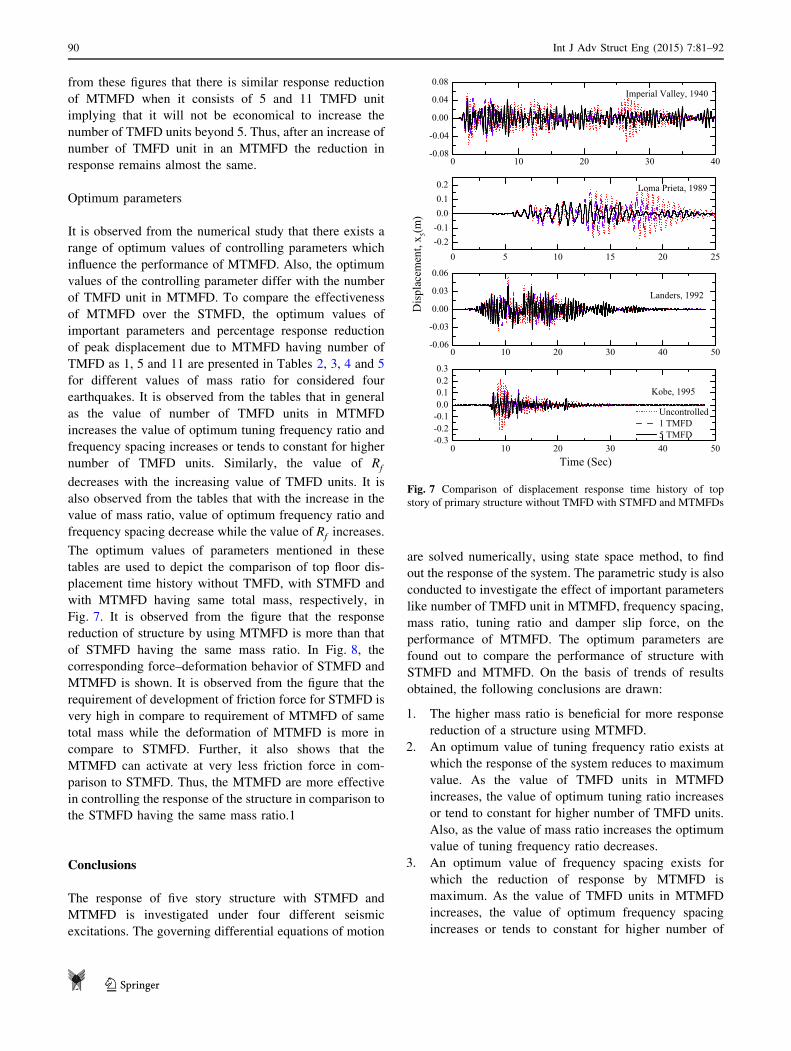
Fig. 7. It is observed from the figure that the response
reduction of structure by using MTMFD is more than that
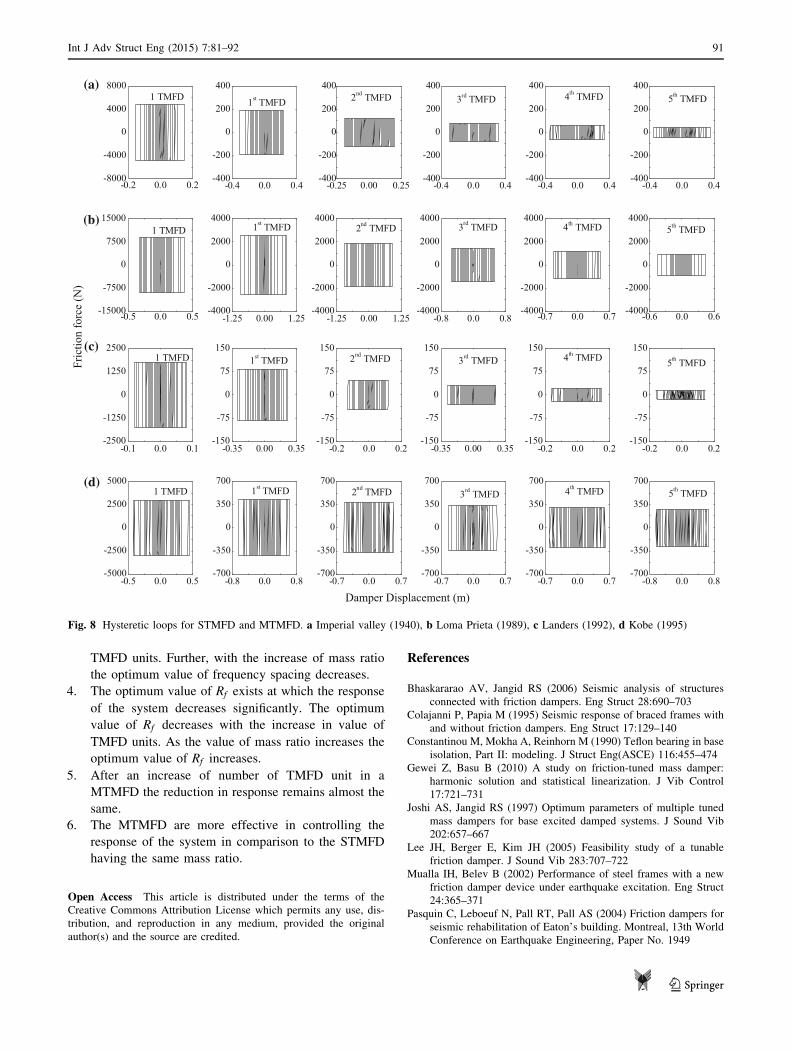
of STMFD having the same mass ratio. In Fig. 8, the
corresponding force–deformation behavior of STMFD and
MTMFD is shown. It is observed from the figure that the
requirement of development of friction force for STMFD is
very high in compare to requirement of MTMFD of same
total mass while the deformation of MTMFD is more in
compare to STMFD. Further, it also shows that the
MTMFD can activate at very less friction force in com-
parison to STMFD. Thus, the MTMFD are more effective
in controlling the response of the structure in comparison to
the STMFD having the same mass ratio.1
Conclusions
The response of five story structure with STMFD and
MTMFD is investigated under four different seismic
excitations. The governing differential equations of motion
are solved numerically, using state space method, to find
out the response of the system. The parametric study is also
conducted to investigate the effect of important parameters
like number of TMFD unit in MTMFD, frequency spacing,
mass ratio, tuning ratio and damper slip force, on the
performance of MTMFD. The optimum parameters are
found out to compare the performance of structure with
STMFD and MTMFD. On the basis of trends of results
obtained, the following conclusions are drawn:
1. The higher mass ratio is beneficial for more response
reduction of a structure using MTMFD.
2. An optimum value of tuning frequency ratio exists at
which the response of the system reduces to maximum
value. As the value of TMFD units in MTMFD
increases, the value of optimum tuning ratio increases
or tend to constant for higher number of TMFD units.
Also, as the value of mass ratio increases the optimum
value of tuning frequency ratio decreases.
3. An optimum value of frequency spacing exists for
which the reduction of response by MTMFD is
maximum. As the value of TMFD units in MTMFD
increases, the value of optimum frequency spacing
increases or tends to constant for higher number of
0 10 20 30 40-0.08
-0.04
0.00
0.04
0.08
0 5 10 15 20 25-0.2-0.10.00.10.2
0 10 20 30 40 50-0.06
-0.03
0.00
0.03
0.06
0 10 20 30 40 50-0.3-0.2-0.10.00.10.20.3
Imperial Valley, 1940
Uncontrolled 1 TMFD 5 TMFD
Dis
plac
emen
t,x 5(m
)
Loma Prieta, 1989
Landers, 1992
Kobe, 1995
Time (Sec)
Fig. 7 Comparison of displacement response time history of top
story of primary structure without TMFD with STMFD and MTMFDs
90 Int J Adv Struct Eng (2015) 7:81–92
123
TMFD units. Further, with the increase of mass ratio
the optimum value of frequency spacing decreases.
4. The optimum value of Rf exists at which the response
of the system decreases significantly. The optimum
value of Rf decreases with the increase in value of
TMFD units. As the value of mass ratio increases the
optimum value of Rf increases.
5. After an increase of number of TMFD unit in a
MTMFD the reduction in response remains almost the
same.
6. The MTMFD are more effective in controlling the
response of the system in comparison to the STMFD
having the same mass ratio.
Open Access This article is distributed under the terms of the
Creative Commons Attribution License which permits any use, dis-
tribution, and reproduction in any medium, provided the original
author(s) and the source are credited.
References
Bhaskararao AV, Jangid RS (2006) Seismic analysis of structures
connected with friction dampers. Eng Struct 28:690–703
Colajanni P, Papia M (1995) Seismic response of braced frames with
and without friction dampers. Eng Struct 17:129–140
Constantinou M, Mokha A, Reinhorn M (1990) Teflon bearing in base
isolation, Part II: modeling. J Struct Eng(ASCE) 116:455–474
Gewei Z, Basu B (2010) A study on friction-tuned mass damper:
harmonic solution and statistical linearization. J Vib Control
17:721–731
Joshi AS, Jangid RS (1997) Optimum parameters of multiple tuned
mass dampers for base excited damped systems. J Sound Vib
202:657–667
Lee JH, Berger E, Kim JH (2005) Feasibility study of a tunable
friction damper. J Sound Vib 283:707–722
Mualla IH, Belev B (2002) Performance of steel frames with a new
friction damper device under earthquake excitation. Eng Struct
24:365–371
Pasquin C, Leboeuf N, Pall RT, Pall AS (2004) Friction dampers for
seismic rehabilitation of Eaton’s building. Montreal, 13th World
Conference on Earthquake Engineering, Paper No. 1949
-0.2 0.0 0.2-8000
-4000
0
4000
8000
-0.4 0.0 0.4-400
-200
0
200
400
-0.25 0.00 0.25-400
-200
0
200
400
-0.4 0.0 0.4-400
-200
0
200
400
-0.4 0.0 0.4-400
-200
0
200
400
-0.4 0.0 0.4-400
-200
0
200
400
-0.5 0.0 0.5-15000
-7500
0
7500
15000
-1.25 0.00 1.25-4000
-2000
0
2000
4000
-1.25 0.00 1.25-4000
-2000
0
2000
4000
-0.8 0.0 0.8-4000
-2000
0
2000
4000
-0.7 0.0 0.7-4000
-2000
0
2000
4000
-0.6 0.0 0.6-4000
-2000
0
2000
4000
-0.1 0.0 0.1-2500
-1250
0
1250
2500
-0.35 0.00 0.35-150
-75
0
75
150
-0.2 0.0 0.2-150
-75
0
75
150
-0.35 0.00 0.35-150
-75
0
75
150
-0.2 0.0 0.2-150
-75
0
75
150
-0.2 0.0 0.2-150
-75
0
75
150
-0.5 0.0 0.5-5000
-2500
0
2500
5000
-0.8 0.0 0.8-700
-350
0
350
700
-0.7 0.0 0.7-700
-350
0
350
700
-0.7 0.0 0.7-700
-350
0
350
700
-0.7 0.0 0.7-700
-350
0
350
700
-0.8 0.0 0.8-700
-350
0
350
700
5th TMFD1 TMFD 1st TMFD 2nd TMFD 3rd TMFD 4th TMFD
Fric
tion
forc
e (N
)
1 TMFD 1st TMFD 2nd TMFD 3rd TMFD 4th TMFD 5th TMFD
(a)
(b)
(c)
(d)
1 TMFD 1st TMFD 2nd TMFD 3rd TMFD 4th TMFD 5th TMFD
Damper Displacement (m)
1 TMFD 1st TMFD 2nd TMFD 3rd TMFD 4th TMFD 5th TMFD
Fig. 8 Hysteretic loops for STMFD and MTMFD. a Imperial valley (1940), b Loma Prieta (1989), c Landers (1992), d Kobe (1995)
Int J Adv Struct Eng (2015) 7:81–92 91
123

Qu WL, Chen ZH, Xu YL (2001) Dynamic analysis of wind-excited
truss tower with friction dampers. Comput Struct 79:2817–2831
Ricciardelli F, Vickery BJ (1999) Tuned vibration absorbers with dry
friction damping. Earthq Eng Struct Dyn 28:707–723
Wen YK (1976) Method for random vibration of hysteretic systems.
J Eng Mechan Div (ASCE) 102(2):249–263
Xu K, Igusa T (1992) Dynamic characteristics of multiple substruc-
tures with closely spaced frequencies. Earthq Eng Struct Dyn
21(12):1059–1070
92 Int J Adv Struct Eng (2015) 7:81–92
123